Article

A Study on the Influence and Mechanism of Temperature and Dosage on PCDD/Fs Adsorption via Coal-Based Activated Carbon

1
State Key Laboratory of Clean Energy Utilization, Institute for Thermal Power Engineering, Zhejiang University, Hangzhou 310027, China
2
Research Institute of Zhejiang University-Taizhou, Taizhou 318000, China
3
Zhejiang Development & Planning Institute, Hangzhou 310000, China
*
Author to whom correspondence should be addressed.
Recycling 2023, 8(6), 98; https://doi.org/10.3390/recycling8060098
Submission received: 20 August 2023 / Revised: 21 October 2023 / Accepted: 23 October 2023 / Published: 11 December 2023
(This article belongs to the Special Issue Sustainable Recycling of Municipal Solid Waste)

Abstract

:
Using a trace polychlorinated-ρ-dibenzodioxins and dibenzofurans (PCDD/Fs) stabilizing generator, an experimental study related to the influence of temperature (150, 165, and 180 °C) and activated carbon (AC) dosage (0.10, 0.15, and 0.20 g) on the adsorption effect of gas-phase PCDD/Fs via coal-based AC was conducted. Increasing the AC dosage is the most efficient method to improve the PCDD/Fs adsorption efficiency from 65.8% (0.10 g) to 93.0% (0.20 g) at 150 °C in an exponential trend. Both the polychlorinated-ρ-dibenzodioxins (PCDD)/polychlorinated dibenzofurans (PCDF) ratio and the Cl-PCDD/Fs value showed positive correlations, with the AC dosage under the same temperature. Increasing adsorption temperature declined the adsorption capacity of AC, resulting in the exponentially decreased average I-TEQ value adsorbed per gram of AC, from 131.3 ng TEQ/Nm3 (150 °C) to 55.9 ng TEQ/Nm3 (180 °C). The coal-based AC used in this study preferred to adsorb lower chlorinated PCDD/Fs, tetrachlorianted dibenzo-p-dioxin and dibenzofurans (TCDD/Fs), and pentachlorianted dibenzo-p-dioxin and dibenzofurans (PeCDD/Fs) than highly chlorinated PCDD/Fs, heptachlorianted dibenzo-p-dioxin and dibenzofurans (HpCDD/Fs), hexachlorinated dibenzo-p-dioxin and dibenzofurans (HxCDD/Fs), and octachlorianted dibenzo-p-dioxin and dibenzofurans (OCDD/Fs), which was aggravated by the increasing temperature. The characterization of the surface properties of AC revealed that slight oxidation occurred on the AC surface during the adsorption process, introducing oxygen to the competitive adsorption. In addition, it was found in this study that an increased temperature led to a higher content of hydrophilic carboxyl and anhydride groups and weakened π-π interactions, which were also partly responsible for the negative impact of the increasing temperature on the AC adsorption capacity. The results of this study can contribute to the operation optimization for controlling PCDD/F emissions from municipal solid waste incineration (MSWI).

1. Introduction

Polychlorinated-ρ-dibenzodioxins and dibenzofurans (PCDD/Fs) are major pollutants in waste incineration plants. Based on the advantages of wide sources, simple processes, low costs, and good adsorption effects, AC adsorption, one of the after-incineration technologies, is the most widely used method for removing PCDD/Fs from flue gas in waste incineration plants [1]. Over the last decade (2012–2021), the volume of municipal solid waste disposed of via incineration has proliferated from 35.84 to 180.20 million tons in China [2]. According to the Best Available Techniques (BAT) reference document for waste incineration released by the European Commission [3], 0.5–3 kg/t of waste is a typical carbon consumption rate for MSWIs, and to achieve the PCDD/Fs emission level of 0.06 ng I-TEQ/Nm3, the dose rate of AC is usually between 0.5 kg/t and 2 kg/t. Therefore, it can be estimated that the consumption of AC in waste incinerations in China will be 90.1–360.4 thousand tons/a. Grounded on the AC price ($3000/t) of Cabot Norit, the largest AC company around the world, only the purchase cost of AC can reach USD 270.3–1081.2 million. Hence, a study on the influence factors of PCDD/Fs adsorption via AC to figure out the most effective operating mode is of great importance to control the PCDD/Fs removal costs.
At present, common types of ACs mainly include coal-based AC, wood-based AC, and coconut shell AC. Coal-based AC, which mainly consists of micropores and mesopores, is very hard, easy to regenerate, and cost-effective. It is widely used in the environmental adsorption field, including gas purification and sewage disposal. Wood-based AC, known for its low ash content, less impurities, and low density, is produced from selected wood types and sawdust and mostly consists of mesopores and macropores. It is often used in the food and pharmaceutical industries. Coconut shell AC, possessing a much higher density of micropores, is able to adsorb volatile organic chemicals better and creates a higher mechanical strength but costs more than the other two kinds of AC. Porosity plays a vital role in choosing the right type of AC. Gu et al. [4] believed that when the ratio of the pore diameter of the adsorbent to the molecular diameter of the adsorbate was 1.7~3.0, the utilization rate of the adsorbent was the highest. Based on the size of 2,3,7,8-tetrachlorianted dibenzo-p-dioxin (TCDD) calculated by Nagano et al. [5], the optimal pore size range for AC to adsorb PCDD/Fs is 2.3~4.1 nm, which means the richness of mesopores is the key to determine the adsorption performance of AC for PCDD/Fs [6]. Thus, accounting for both adsorption capacity and cost, coal-based AC is the most suitable AC for removing PCDD/Fs and is also the most widely used AC in waste incinerators.
Temperature was considered a vital factor in influencing AC adsorption. Everaert et al. [7] investigated 12 municipal solid waste incineration in Flemish and summarized that the temperature at the fabric filter, namely AC adsorption temperature, generally fluctuated between 140 and 160 °C and increased to 220–240 °C when a catalytic fabric was used. Based on the adsorption isotherms of common chlorinated volatile organic compounds on AC, previous studies developed model equations of the overall efficiency of gas phase PCDD/Fs removal and predicted that the efficiency would decrease with increasing temperatures [7,8]. Owing to the low volatility and high melting point of trace PCDD/Fs, earlier experiments usually adopted model compounds of PCDD/Fs to explore the temperature effect on PCDD/Fs adsorption. Inoue et al. [9] examined the adsorption characteristics of 1,2,3,4-tetrachlorobenzene on AC and found that at 150 °C, the equilibrium adsorption dosage increased 1.9–3.2 times more than that at 190 °C. Cui et al. [10] attained a similar result: the adsorption efficiency of dibenzofurnan decreased when the adsorption temperatures gradually rose from 90 °C to 130 °C.
In waste incineration plants, increasing AC usage is commonly used to meet the PCDD/Fs emission limits. Xiong et al. [11] were of the opinion that with the known flue gas flow rate, the optimal injection rate of AC could be calculated to achieve the PCDD/Fs emission standard. Various field tests have been carried out to verify the influence of AC injection rates on PCDD/Fs. Kim et al. [12] conducted an experiment in a dual bag filter system of a municipal solid waste incinerator and reported a parabolic-like relationship between PCDD/Fs removal efficiency and the AC feeding rate: it increased under 150 mg/Nm3, basically unchanged between 150 and 300 mg/Nm3, and decreased beyond 300 mg/Nm3. Gunes et al. [13] observed similar results in a medical waste incineration plant. When the feeding rate of the activated lignite improved from 197 mg/Nm3 to 332 mg/Nm3, the removal efficiency of PCDD/Fs decreased from 97% to 77%, which could be attributed to the leaks of the fine particles via the bag filter brought by the increased pressure drop.
Although physical adsorption is generally considered to dominate the adsorption of PCDD/Fs on AC, the diverse chemical properties of AC are also able to affect the adsorption performance [14,15]. Oxygen-containing functional groups are usually found on the surface of AC because of oxidation via oxygen, water, and other oxidants during different production processes and uses [16], which provide an electron-rich environment and polar function for PCDD/Fs [17]. Ding et al. [15] drew a conclusion using the density functional theory that activated cokes with oxygenated groups had a prior adsorption ability to dibenzofuran. Furthermore, Kawashima et al. [18] observed higher adsorption ratios of non-ortho PCBs on AC because AC could adsorb aromatic compounds via π-π interactions between aromatic rings and the graphite-like surface. Meanwhile, non-ortho PCBs were easier to form planar conformations compared to other congeners.
Targeted at applying AC more efficiently, this article discussed the effects and mechanisms of temperature and AC dosage on PCDD/Fs adsorption via coal-based AC. As previous studies of temperature and AC dosage influence were usually carried out on site or adopted model compounds of PCDD/Fs, a trace PCDD/Fs stabilizing generator was innovatively employed in this study to explore the influence law in the lab scale, which is expected to be more accurate and interference factors free. The adsorption performance, including the PCDD/Fs concentration and I-TEQ value before and after adsorption under different temperatures, PCDD/Fs distribution, were investigated. The correlations between temperature/AC dosage and AC adsorption capacity were further explored. Finally, with the adoption of XPS analysis, the influence mechanism of temperature on PCDD/Fs chemical adsorption was first discussed.

2. Results and Discussion

2.1. Adsorption Performance

2.1.1. Initial PCDD/Fs

As shown in Figure 1a, without any adsorbent, the initial concentration of the total 136 PCDD/F congeners was 9134.9 ng/Nm3 at 150 °C, and the corresponding international toxicity equivalent (I-TEQ) was 24.4 ng I-TEQ/Nm3. Both the initial mass concentration and the I-TEQ value decreased with the rise in the adsorption temperature. It was observed that the initial mass concentrations declined to 5205.8 ng/Nm3 and 4831.1 ng/Nm3 when under 165 °C and 180 °C, respectively, and the I-TEQ values simultaneously declined to 13.8 ng I-TEQ/Nm3 and 10.3 ng I-TEQ/Nm3. The high initial concentration of the PCDD/Fs guaranteed the adsorption difference under varied working conditions [19]. Moreover, the proportions of initial PCDDs were much greater than PCDFs under three different temperatures (Figure 1b). Despite some recent research that believed the PCDD/PCDF ratio depends more on the relative concentration of chlorinated benzenes and chlorinated phenols, two precursors of PCDD/Fs, and cannot be used to define the main formation pathway of PCDD/Fs [20,21], it is still a common understanding that the precursor pathway mainly generated PCDDs, while the PCDFs is mainly formed via de novo synthesis [22]. Therefore, as the PCDD/Fs stock solution was extracted from the fly ash of a medical waste incineration power plant, it could be deduced that the precursor pathway dominated the PCDD/Fs generation in this power plant.
The initial concentration distribution of 17 toxic PCDD/Fs congeners under different temperatures is shown in Figure 1c. Contrary to the typical medical waste incinerators [23], toxic PCDDs congeners shared a larger part of the mass concentration than PCDFs. Wang et al. has also observed this phenomenon [24], and according to their study the different distribution was caused because the incinerators were operated within the excess air. As for the contribution rate of individual congeners, 1,2,3,4,6,7,8-heptachlorianted dibenzo-p-dioxin (HpCDD), octachlorianted dibenzo-p-dioxin (OCDD) among the whole homolog, and 1,2,3,4,6,7,8-heptachlorianted dibenzofuran (HpCDF) within the scope of PCDFs, contributed most to mass concentration, in accordance with the research of Gao et al. [25]. Meanwhile, 2,3,4,7,8-pentachlorianted dibenzofuran (PeCDF) accounted for the highest proportion (>30%) of the I-TEQ value, which agreed with earlier studies [26,27].

2.1.2. PCDD/Fs Concentration

Figure 2 exhibits the PCDD/Fs concentration and I-TEQ value before and after AC adsorption under different working conditions. The PCDD/Fs concentration decreased with the increase in AC dosage under three different temperatures. For instance, at 150 °C, the PCDD/Fs concentrations reduced to 2692.8, 1027.7, and 445.3 ng/Nm3 from 9134.9 ng/Nm3 for different AC dosage of 0.10, 0.15, and 0.20 g, respectively, corresponding to I-TEQ value of 8.34, 3.96, and 1.71 ng I-TEQ/Nm3 from 24.4 ng I-TEQ/Nm3, respectively. In addition, the trend that the diminution of both the mass concentration and the I-TEQ value reduced with the increasing AC dosage (D-value: 0.05 g) grew more obviously with the rise of the adsorption temperature.

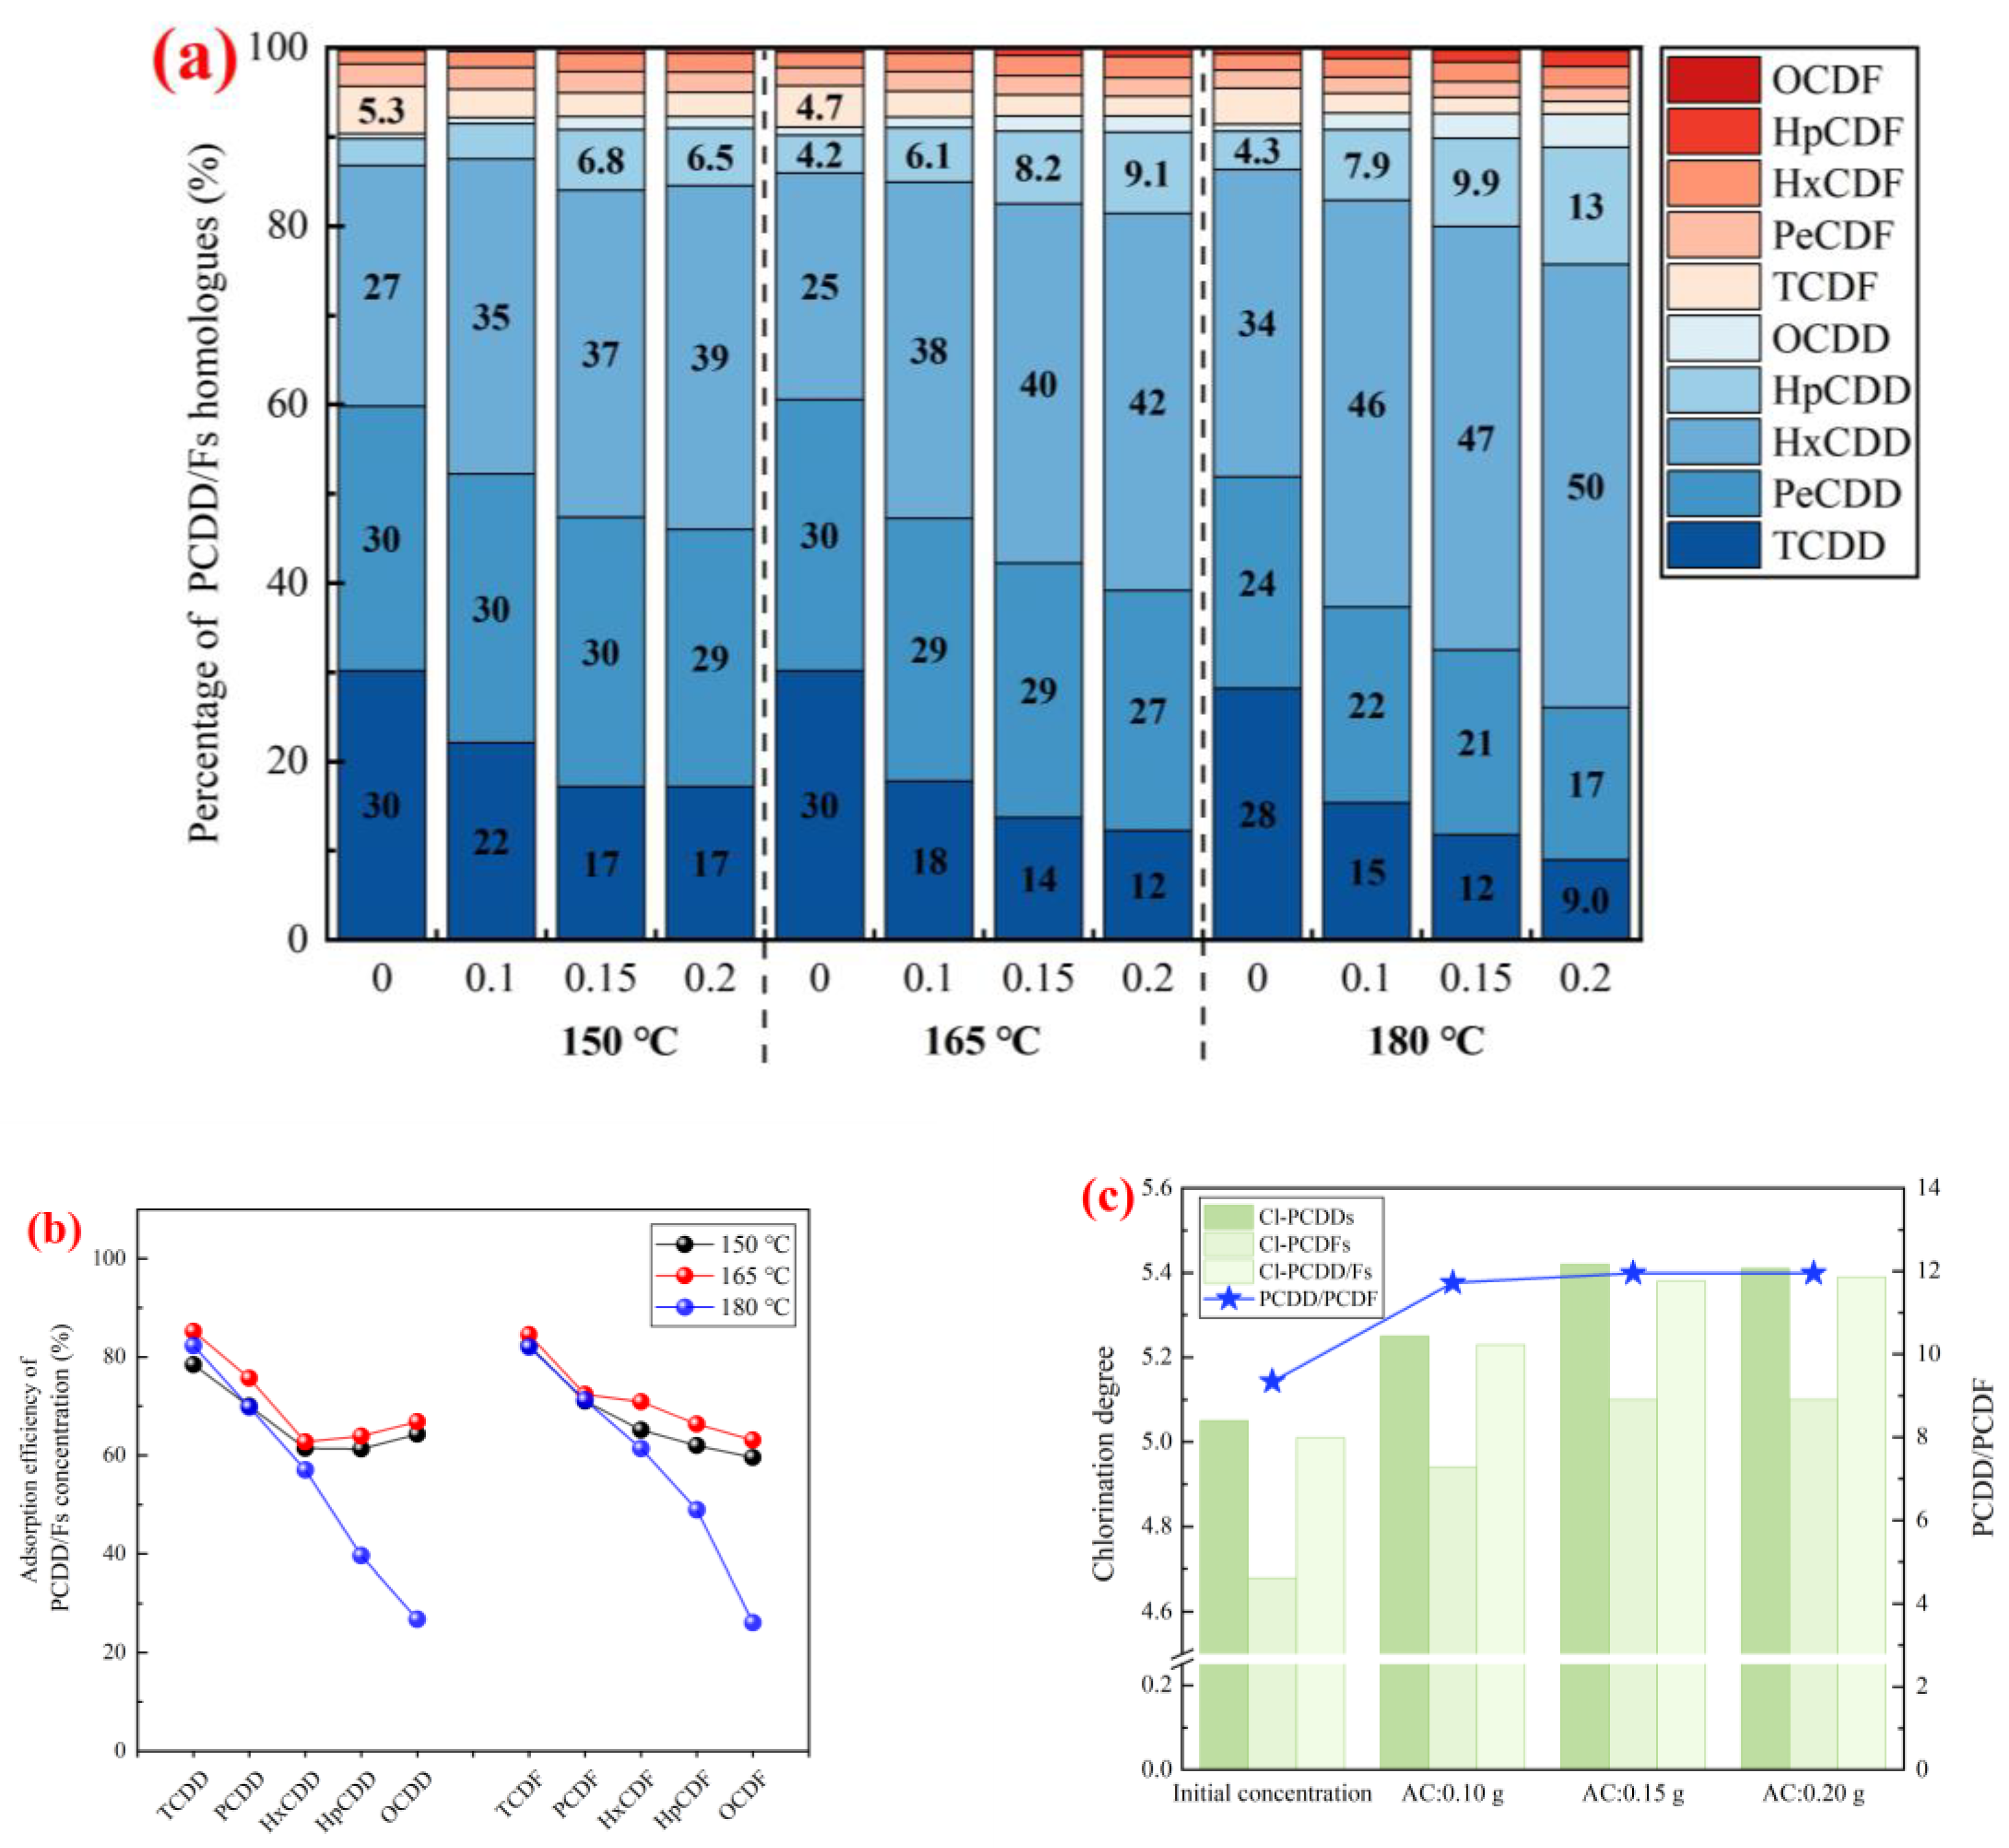
2.1.3. PCDD/Fs Distribution

The PCDD/Fs homolog profiles of all working conditions are depicted in Figure 3a. The alterations in PCDD/Fs distribution brought by adsorption at three temperatures showed very similar trends. Compared to the initial ones, the proportion of hexachlorinated dibenzo-p-dioxin (HxCDD) was notably promoted with the increase in the AC dosage, while heptachlorianted dibenzo-p-dioxin (HpCDD) and octachlorinated dibenzo-p-dioxin (OCDD) also obtained slight upswings. In contrast, obvious abatement was perceived in tetrachlorianted dibenzo-p-dioxin (TCDD) and tetrachlorianted dibenzofuran (TCDF). Furthermore, the magnitude of the above changes becomes greater as the temperature increases.
Working conditions that applied 0.10 g AC were chosen to further study the influence of adsorption temperature on the variation in PCDD/Fs adsorption efficiency with the chlorination level (Figure 3b). On the whole, the change trends of PCDD/Fs adsorption efficiencies with different chlorination levels at three different temperatures were roughly the same. Compared with highly chlorinated PCDD/Fs (HpCDD/Fs, HxCDD/Fs, and OCDD/Fs), AC had higher adsorption efficiency for lower chlorinated PCDD/Fs (TCDD/Fs and PeCDD/Fs), which was consistent with the research results of Lin et al. [28]. And the downward tendency with the chlorination level became much more evident at 180 °C, which meant a sufficient increase in temperature would aggravate the decrease in adsorption efficiencies.
AC’s selective adsorption of lower chlorinated PCDD/Fs may be attributed to the gas/particle partitioning differences in PCDD/Fs. AC is considered more effective at absorbing gas-phase PCDD/Fs compared to particle-bound PCDD/Fs, which are more challenging to remove [29]. Smolka and Schmidt et al. [30] previously investigated the PCDD/Fs gas/particle partitioning in flue gas at low temperatures and found that the proportion of gas-phase PCDD/Fs increased with a higher vapor pressure of congeners, namely congeners that are highly volatile are more efficiently adsorbed via AC than less volatile ones, due to their greater tendency to exist in the gas phase. Moreover, at a given temperature, the vapor pressure of PCDD/Fs homologs tends to decrease with rising chlorination levels. Therefore, PCDD/Fs with lower levels of chlorination are expected to have a higher removal efficiency via AC than those with higher levels of chlorination.
Figure 3c summarizes the values of PCDD/PCDF ratio and chlorination degree under the adsorption temperature of 150 °C. Compared with the initial working condition, which did not add any AC, the PCDD/PCDF ratios in the working conditions within AC, were increased from 9.34 to 11.72–11.95, which appeared to have a positive correlation with the AC dosage. That is to say, PCDFs were removed more efficiently via ACs than PCDDs, which could be ascribed to the lower vapor pressure of PCDDs than PCDFs at the same chlorination level [31]. The Cl-PCDD/Fs value also increased along with the escalation of the AC dosage. In the field study of Lin et al. [32], similar phenomena were also observed that with increasing AC injection rates (20 kg/h, 40 kg/h, and 50 kg/h), lower chlorinated PCDD/Fs congeners revealed much higher removal proportions than highly chlorinated congeners.

2.2. Correlation

2.2.1. Adsorption Temperature

Figure 4a illustrates the influence of temperature on AC adsorption. PCDD/Fs concentration and I-TEQ value adsorbed per gram of AC turned out to be lessened along with the growing temperature. The I-TEQ value adsorbed per gram of AC decreased from 131.3 ng TEQ/Nm3 (150 °C) to 55.9 ng TEQ/Nm3 (180 °C). Ji et al. [33] conducted experiments at 160, 180, and 200 °C with two different kinds of AC and also found that with temperature rising, the removal efficiencies decreased from 88.6% to 86.1% and 95.6% to 92.7%, respectively. Moreover, it could be noticed that, within the same temperature D-value of 15 °C, the decrement of the adsorption quantity, whether the PCDDs/PCDFs concentration or I-TEQ value, also showed a distinct reduction with the increase in the adsorption temperature.
Linear fitting and nonlinear curve fitting were applied to research the correlation between the I-TEQ values of adsorbed PCDD/Fs per gram of AC and the adsorption temperature. The adjusted R2 was only 0.88 in the linear fitting model, while an exponential function was found well fitted between the above two factors, which was in accordance with the exponential decreasing trend Everaert et al. and Lu et al. [7,8] obtained based on the modeling calculation. However, Li et al. [34] investigated temperature influence on PCDD/Fs adsorption using nano-graphites and drew a different conclusion that between the range of 150 °C and 190 °C, there existed a negative linear correlation between removal efficiency and adsorption temperature.

2.2.2. AC Dosage

As shown in Figure 4b, along with the increasing dosage of the AC from 0.10 g to 0.20 g, the adsorption efficiencies of both PCDD/Fs concentration and I-TEQ value improved more than 20% at 150 °C. The adsorption efficiencies of the I-TEQ value rose from 65.8% (0.10 g) to 93.0% (0.20 g), which increased by 27.2%. Compared to the linear fitting (R2 = 0.93), an increasing exponential relationship could better explain the correlation between AC dosage and the I-TEQ value adsorption efficiencies. And it could be deduced that the adsorption efficiency would tend towards stability with the continuous increase in AC dosage. Thus, increasing the dosage of AC to an appropriate range could effectively enhance the adsorption efficiency of AC on gas-phase PCDD/Fs. This conclusion could be mutually confirmed with some earlier experiments on site. Chang et al. [35] studied the effect of the AC feeding concentration on PCDD/Fs removal efficiency and concluded that when the feeding rate of AC was larger than 150 mg/Nm3, the removal efficiency would approach a maximum value. Gunes et al. [13] found that when above 66 mg/Nm3, despite the two to three times increase in the AC feeding rate, the removal efficiency was not changed.

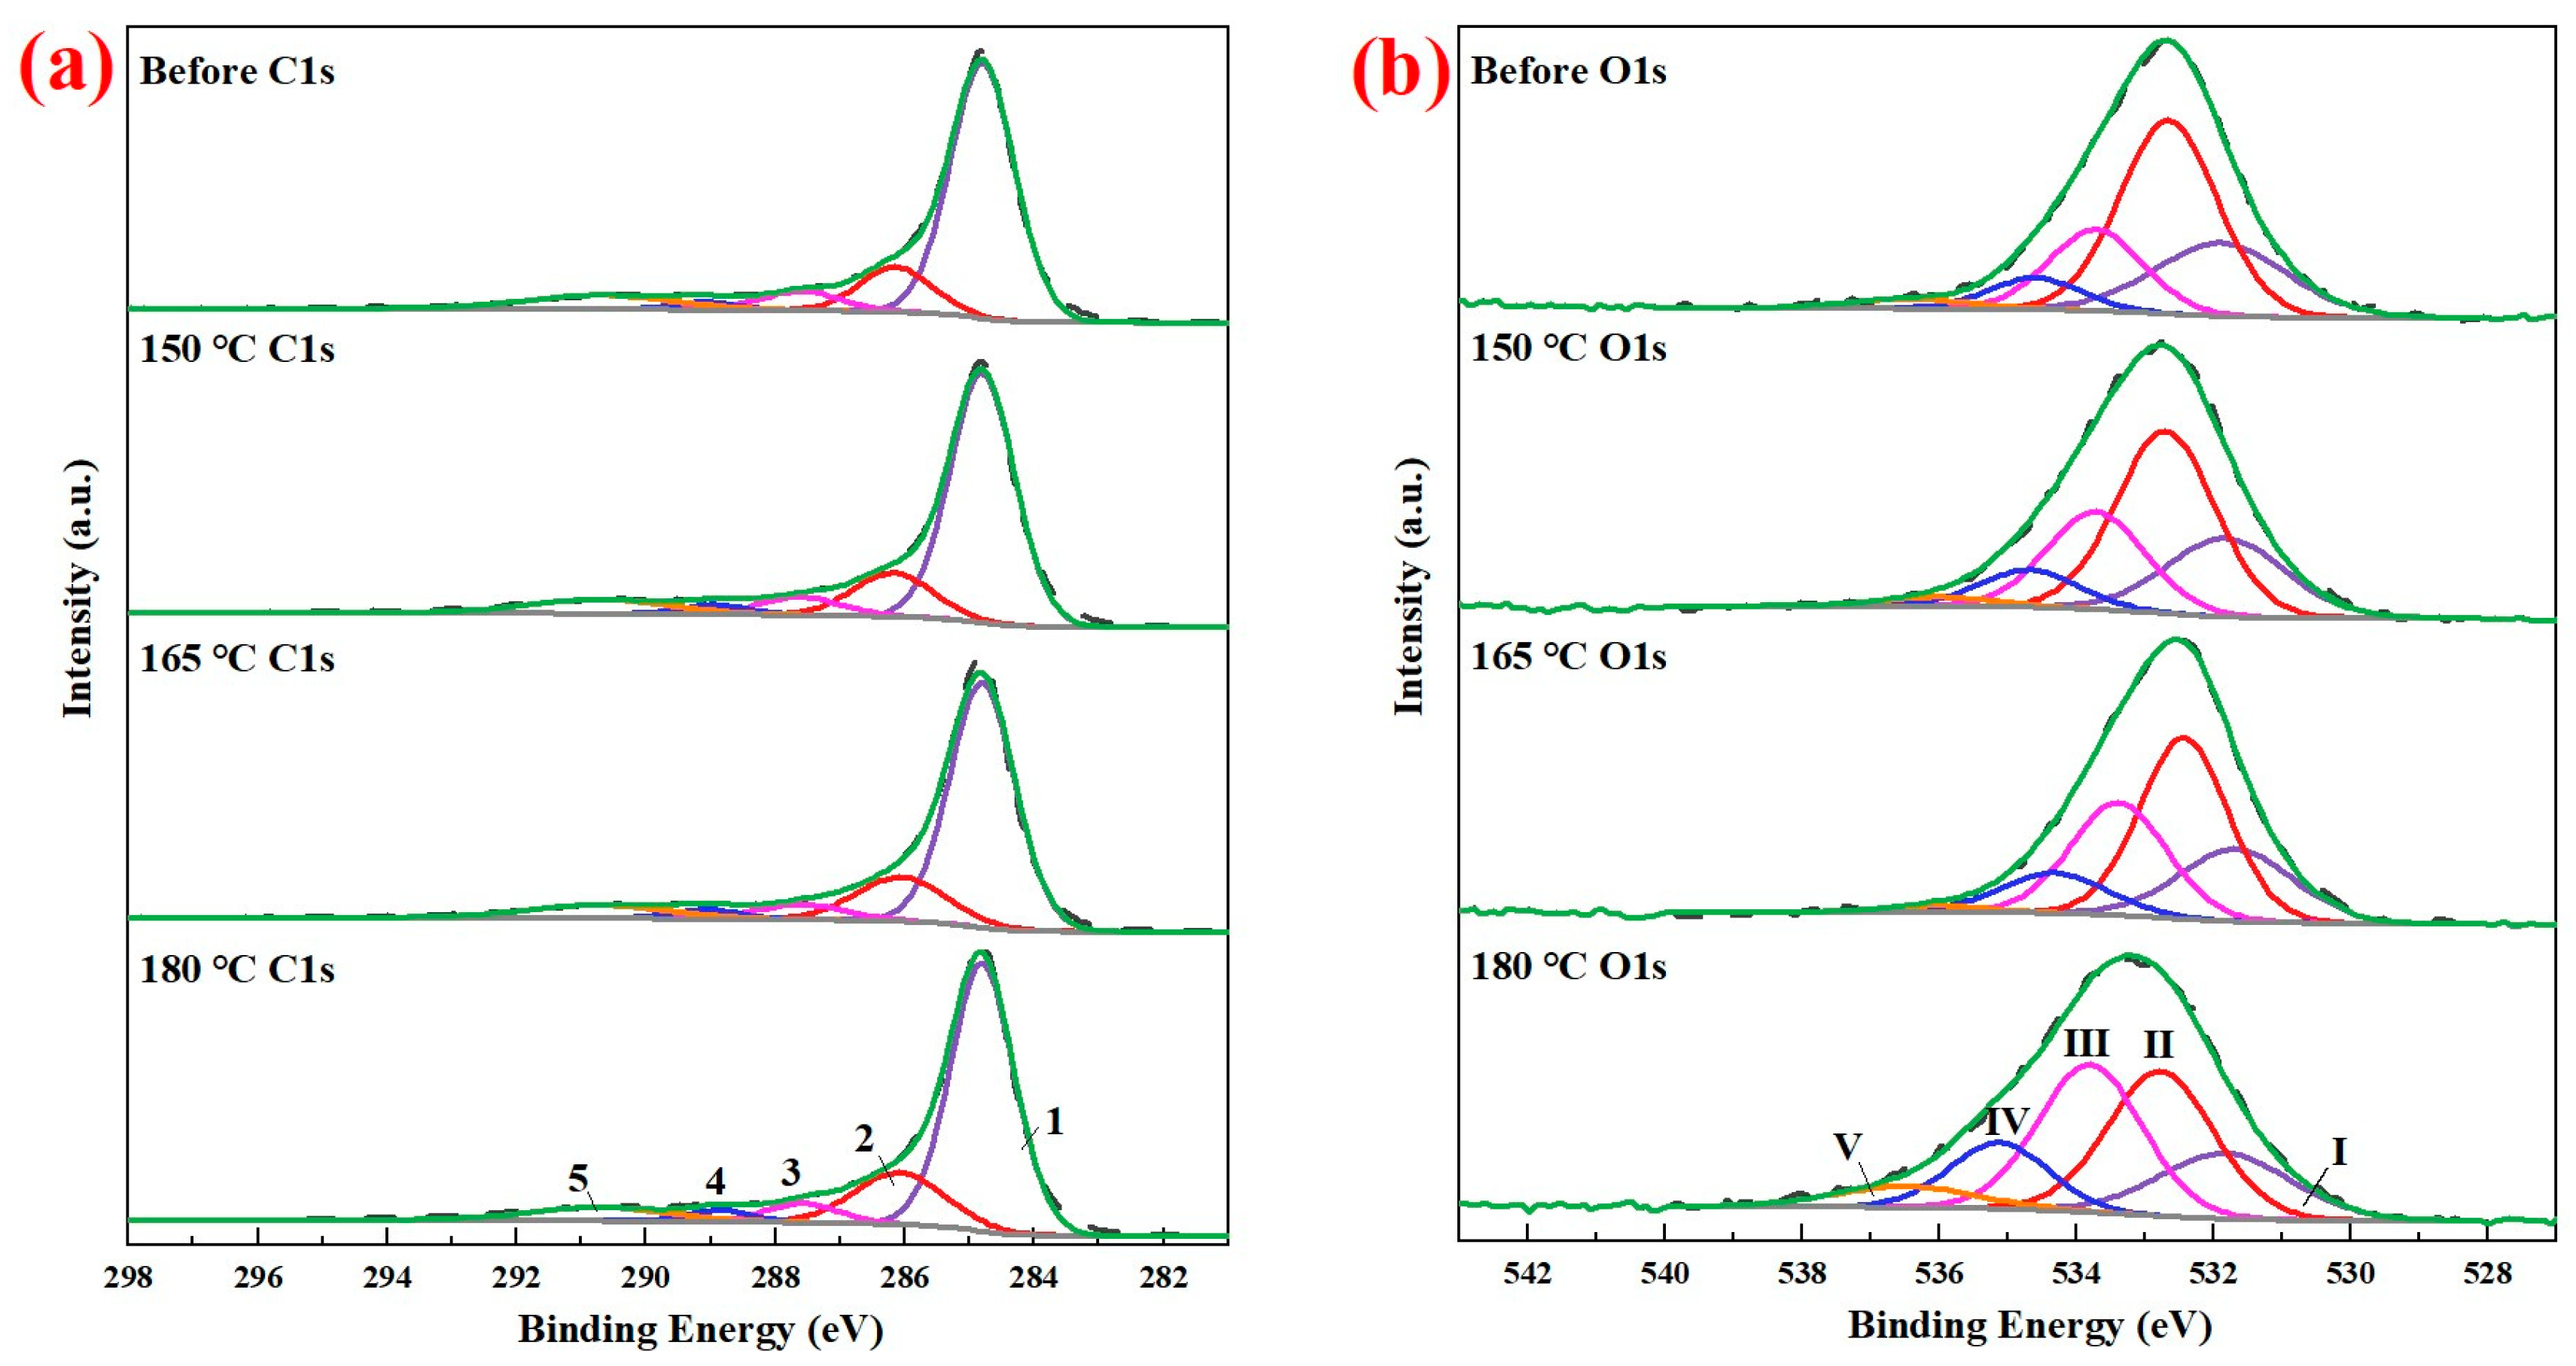
2.3. Mechanism of the Temperature Influence

According to previous studies, the main mechanism of the temperature influence may be that adsorption is an exothermic process, and the increase in temperature will diminish the surface coverage fraction of the adsorbent, leading to a decrease in available active adsorption sites, which means a lower adsorption capacity [36,37]. Furthermore, in the application of incinerators, it is also considered that the raised proportion of gas-phase PCDD/Fs can account for the negative effect of higher temperature on PCDD/Fs removal, as particle-bound PCDD/Fs can be easily captured using the bag filter with fly ash, while gas-phase PCDD/Fs rely more on the AC adsorption [38,39].
XPS analysis was employed to further clarify the influence of the AC chemical properties changes on adsorption capacity during the temperature-rising process. According to the analysis results, the O 1 s/C 1 s peak area ratio showed a tiny increment after the adsorption process, which might be due to the oxidation of AC caused by the oxygen in the gas flow (Table 1). On the other hand, if the temperature keeps rising, the dosage of the oxygen chemical groups on the carbon surface will decrease [40]. The XPS spectra of C 1 s and O 1 s peaks and their fitting curves are given in Figure 5. Typical asymmetric peaks in the C 1 s region and typical symmetric peaks in the O 1 s were detected in the XPS spectra for all AC samples, both before and after adsorption under varying temperatures [41,42].
To acquire a more detailed understanding of the changes in the surface chemistry of AC during adsorption, the C 1 s peaks were deconvoluted into five distinct peaks [43,44]: peak 1 (284.8 eV), alkyl type carbon (C-C, C-H); peak 2 (286.1–286.5 eV), alcohol (C-OH) and/or ether (C-O-C) groups; peak 3 (287.6–287.8 eV), carbonyl (C=O) groups; peak 4 (288.6–289.1 eV), carboxyl and ester (O-C=O) groups; peak 5 (290.7–291.2 eV), π to π* shake-up satellite. Likewise, the O 1 s peaks were also deconvoluted into five distinct peaks [45,46]: peak I (531.0–531.9 eV), the carbonyl oxygen of quinones; peak II (532.3–532.8 eV), carbonyl oxygen atoms in esters, anhydrides and oxygen atoms in hydroxyls or ethers; peak III (533.1–533.8 eV), the non-carbonyl (ether-type) oxygen atoms in esters and anhydrides; peak IV (534.3–535.4 eV), oxygen atoms in carboxyl groups; peak V (536.0–536.5 eV), oxygen atoms in adsorbed water and/or O2. Figure 6 exhibited the functional groups of oxygen atoms relevant to peaks I–IV in the form of a structural formula.
The relative content of alkyl-type carbon (peak 1) decreased after the adsorption process under three different temperatures, which was consistent with the increase in the O 1 s/C 1 s peak area ratio. Accordingly, the total dosage of carbon bonded to oxygen-containing functional groups increased, and it primarily originated from an increase in peak 2, assigned to alcohol and/or ether groups, of which the amplification also increased with the rise in temperature. The relative dosage of peak 2 increased from 13.20% to 18.24%, which was in good agreement with the O 1 s results, and peak III, assigned to ether-type oxygen atoms in esters and anhydrides, increased from 19.06% to 31.19%. The relative dosage of peak 4, assigned to carboxyl and ester, slightly increased with the increase in temperature, which was also observed in peak IV of O 1 s results, assigned to oxygen atoms in carboxyl groups. Meanwhile, an abatement appeared in peak 3 (assigned to carbonyl groups) and peak I in O 1 s results (assigned to carbonyl groups). Based on the above results, some C=O might convert to C-O when temperature increases.
In light of the research carried out by Ding et al. [15], although the oxygenated groups could accelerate the adsorption process of dibenzofurnan, the reduction in the adsorption capacity would still be revealed due to the competitive adsorption of oxygen, and the formation of hydrophilic carboxyl and anhydride groups mainly contributed to this deterioration process. Therefore, as the proportions of hydrophilic carboxyl and anhydride groups were found to be increased from the rising temperature in this study, it might also be a reason for the adverse influence on the AC adsorption capacity caused by rising temperatures. Moreover, the π-π interactions, represented as peak V in C 1 s spectra, also weakened as the temperature increased. Since AC was able to adsorb aromatic compounds via π-π interactions between aromatic rings and the graphite-like surface [18], the decrease in π-π interactions also accounted for the reduction in adsorbed PCDD/Fs.

3. Materials and Methods

3.1. Materials

PCDD/Fs stock solution, a certain concentration of liquid phase PCDD/Fs, was used to produce PCDD/Fs carrying flow. PCDD/Fs stock solution was prepared via method of USEPA1613 pretreatment of fly ash, and the fly ash was from a medical waste incineration power plant in China. 12C and 37Cl standard samples were not added to the process. The concentration of PCDD/Fs stock solution can be adjusted by concentration or dilution.
One kind of commercial coal-based AC, produced by Jiangyang Activated Carbon Factory in Liyang City, was selected to use in the experiment. Before the experiment, the AC was dried at 105 °C for 12 h and sieved via 100 meshes. Its pore texture was determined using low-temperature N2 adsorption method. An automatic instrument (BK300C, JWGB SCI. & TECH, Beijing, China) was employed to measure the N2 adsorption–desorption isotherm of the AC (Figure 7a) at 77 K. According to the classification of IUPAC [47], this isotherm belonged to type IV. An obvious hysteresis loop occurred at an upper relative pressure due to the capillary condensation, indicating that there was a certain number of mesopores distributed on the AC. The AC pore sizes are concentrated in a range of 2–5 nm, and there were also some mesopores distributed at 15–20 nm.
Table 2 shows the detailed pore structure parameters of the AC, which met the basic property requirements of PCDD/Fs removal [16]. Brunauer–Emmett–Teller (BET) method was used to calculate the total specific surface area of AC. When the relative pressure (p/p0) on the N2 adsorption–desorption isotherm was 0.97, the pore volume represented the total pore volume. The t-plot method was used to calculate the specific surface area and pore volume of micropores, while the BJH method was applied to calculate the specific surface area and pore volume of mesoporous pores. And the average pore diameter (D) was acquired using the 4 Vt/SBET formula.

3.2. Experimental Methods

As shown in Figure 7b, the experimental device consisted of three parts: PCDD/Fs generation, adsorption, and tail gas collection. The microdialysis pump CMA 300 (CMA Microdialysis AB, Massachusetts, MA, USA) was used as the power unit, and the PCDD/Fs stock solution in micro injector (0–0.5 mL) was injected into the nebulizer (Meinhard, Omaha, NE, USA) at the injection rate of 0.5μL/min. Under the synergistic effect of carrier gas, it was sprayed into the quartz tube (200 °C) in the form of atomization and fully volatilized into the form of gas in the quartz tube. Thus, a gas carrying a certain concentration of PCDD/Fs was obtained. The gas was then passed through a quartz tube equipped with an AC column, and the residual PCDD/Fs in the tail gas was collected using toluene in the ice bath. The working conditions set in this experiment are illustrated in Table 3, and the same PCCD/Fs stock solution was applied in all working conditions. Before the experiment, the experimental device needed to run empty for 7 h to make the pipe wall reach the adsorption saturation state of PCDD/Fs. A set of parallel samples was set for all groups to ensure the repeatability and representativeness of the results.

3.3. Sampling and Analysis

XPS analysis was performed with an ESCALAB 250XI electron spectrometer (Thermo, Massachusetts, MA, USA) using an Al Ka light source (1486.6 eV), to detect the surface functional groups of AC. The standard Cls peak was 284.8 ev to calibrate the binding energies.
The PCDD/Fs samples in toluene were pre-treated with clean-up process according to Method 1613 (EPA, Washington, DC, USA). A 6890 Series gas chromatograph (GC) (Agilent, California, CA, USA) coupled to a JMS-800D mass spectrometer (JEOL, Tokyo, Japan) performed high-resolution gas chromatography/high-resolution mass spectrometry (HRGC/HRMS) to define and quantify all the 136 PCDD/Fs (P = 4–8) congeners, and the separation of these congeners was achieved using a DB-5ms (60 m × 0.25 mm ID, 0. 25 μm film thickness). Following was the column temperature program of GC: splitless injection of 1 μL at the initial temperature (150 °C), which was kept constant for 1 min and then increased to 190 °C at a 25 °C/min rate. Finally, the temperature was increased to 280 °C at a rate of 3 °C/min, and that temperature was held for 20 min. Standard HJ 77.2-2008 (MEE, China) was adopted to ensure that the recoveries of PCDD/Fs samples were within the appropriate range.
The Cl-PCDD/Fs value, expression of the PCDD/Fs’ average chlorination degree, can be obtained using the following formula:
C l d = C i   × n i C i = 4 ,   5 ,   6 ,   7 ,   8
where Cld denotes the average chlorination degree of the PCDD/Fs, Ci denotes the concentration of each PCDD/Fs congener, ni denotes the number of the substituted chlorine atoms in each PCDD/Fs congener, and C denotes the total mass concentration of 136 PCDD/Fs congeners.

4. Conclusions

This article presented an experimental study on the temperature and AC dosage influence of gas-phase PCDD/Fs adsorption via coal-based AC based on a system that could produce PCDD/Fs stably. The results showed that lower chlorinated PCDD/Fs (TCDD/Fs and PeCDD/Fs) presented higher adsorption efficiencies than highly chlorinated PCDD/Fs (HpCDD/Fs, HxCDD/Fs, and OCDD/Fs) and this phenomenon would be aggravated by a sufficient increase in adsorption temperature. The correlation between the I-TEQ values of adsorbed PCDD/Fs per gram of AC and the adsorption temperature revealed a decreasing exponential trend from 131.3 ng TEQ/Nm3 (150 °C) to 55.9 ng TEQ/Nm3 (180 °C). Increasing the AC dosage could effectively enhance the adsorption efficiency of AC on gas-phase PCDD/Fs (>20%) in an increasing exponential trend, which meant the adsorption efficiency would tend towards stability with the continuous increase in AC dosage. Both the PCDD/PCDF ratio and the Cl-PCDD/Fs value showed positive correlations with the AC dosage when applying the same temperature. Furthermore, the exothermic process took major responsibility for the negative impact of rising temperature on AC adsorption capacity. Nevertheless, the XPS analysis also indicated that the formation of hydrophilic carboxyl and anhydride groups and the weakened π-π interactions might account for the reduction in adsorbed PCDD/Fs during the temperature-increasing process.

Author Contributions

Conceptualization, X.L. (Xiaoqing Lin); methodology, P.W.; validation, P.W. and J.L.; formal analysis, P.W.; investigation, P.W.; resources, X.L. (Xiaodong Li); data curation, P.W.; writing—original draft preparation, P.W.; writing—review and editing, X.L. (Xiaoqing Lin) and S.X.; visualization, P.W. All authors have read and agreed to the published version of the manuscript.

Funding

This research was funded by the National Key Research and Development Program of China (2020YFC1910100).

Data Availability Statement

The authors confirm that the data supporting the findings of this study are available within the article.

Conflicts of Interest

The authors declare no conflict of interest.

References

  1. Wu, H.; Xiao, H.; Wang, W.; Zhang, Y.; Jiang, X. Formation and Emission Control of PCDD/Fs from Typical Fluidized Bed MSW Incinerators. J. Power Eng. 2012, 32, 654–660. [Google Scholar]
  2. China, N.B.O.S. China Statistical Yearbook; China Statistics Press: Beijing, China, 2022. [Google Scholar]
  3. European, C.; Joint, R.C.; Cusano, G.; Roudier, S.; Neuwahl, F.; Holbrook, S.; Gómez Benavides, J. Best Available Techniques (BAT) Reference Document for Waste Incineration: Industrial Emissions Directive 2010/75/EU (Integrated Pollution Prevention and Control); Publications Office: Luxembourg, 2020. [Google Scholar]
  4. Gu, K. Application of activated carbon (1). Commun. For. Prod. Chem. Ind. 1999, 37–40. [Google Scholar]
  5. Nagano, H.; Tamon, T.; Adzumi, K.; Nakagawa, T. Suzuki. Act. Carbon Munic. Waste 2000, 38, 915–920. [Google Scholar]
  6. Zhou, X.J.; Buekens, A.; Li, X.D.; Ni, M.J.; Cen, K.F. Adsorption of polychlorinated dibenzo-p-dioxins/dibenzofurans on activated carbon from hexane. Chemosphere 2016, 144, 1264–1269. [Google Scholar] [CrossRef] [PubMed]
  7. Everaert, K.; Baeyens, J.; Degrève, J. Entrained-Phase Adsorption of PCDD/F from Incinerator Flue Gases. Environ. Sci. Technol. 2003, 37, 1219–1224. [Google Scholar] [CrossRef] [PubMed]
  8. Lu, S.; Ji, Y.; Buekens, A.; Ma, Z.; Jin, Y.; Li, X.; Yan, J. Activated carbon treatment of municipal solid waste incineration flue gas. Waste Manag. Research. 2012, 31, 169–177. [Google Scholar] [CrossRef] [PubMed]
  9. Inoue, K.; Kawamoto, K. Fundamental Adsorption Characteristics of Carbonaceous Adsorbents for 1,2,3,4-Tetrachlorobenzene in a Model Gas of an Incineration Plant. Environ. Sci. Technol. 2005, 39, 5844–5850. [Google Scholar] [CrossRef]
  10. Cui, Y.; Yang, G.; Xiao, G.; Zhou, J.; Ding, G.; Pan, X. Adsorption of Dioxin by Bag Filter + Powdered Activated Carbon. Water Air Soil Pollut. 2017, 228, 160. [Google Scholar] [CrossRef]
  11. Xiong, S.; Yaqi, P.; Shengyong, L.; Chen, K.; Li, X.; Kefa, C. PCDD/Fs from a large-scale municipal solid waste incinerator under transient operations: Insight formation pathways and optimal reduction strategies. J. Environ. Manag. 2022, 314, 114878. [Google Scholar] [CrossRef]
  12. Kim, B.; Lee, S.; Maken, S.; Song, H.; Park, J.; Min, B. Removal characteristics of PCDDs/Fs from municipal solid waste incinerator by dual bag filter (DBF) system. Fuel 2007, 86, 813–819. [Google Scholar] [CrossRef]
  13. Gunes, G.; Saral, A.; Saral, A.; Yıldız; Kuzu, S.L. Determination of optimum dose of adsorbent for PCDD/F removal in the flue gas of a medical waste incineration plant. Chem. Eng. Res. Des. 2015, 104, 695–702. [Google Scholar] [CrossRef]
  14. Li, C.Q.; Liu, G.R.; Qin, S.; Zhu, T.Y.; Song, J.F.; Xu, W.Q. Emission reduction of PCDD/Fs by flue gas recirculation and activated carbon in the iron ore sintering. Environ. Pollut. 2023, 327, 121520. [Google Scholar] [CrossRef] [PubMed]
  15. Ding, X.X.; Jiao, W.H.; Yang, Y.T.; Zeng, Z.Q.; Huang, Z.G. Effects of oxygenated groups on the adsorption removal of dibenzofuran by activated coke: Experimental and DFT studies. J. Environ. Chem. Eng. 2021, 9, 106775. [Google Scholar] [CrossRef]
  16. Hideki, T.; Ikuo, A. Application Technology of Activated Carbon—Maintenance and Problems; Tech System Co., Ltd.: Tokyo, Japan, 2000. (In Japanese) [Google Scholar]
  17. Yang, C.T.; Jiao, W.H.; Yang, Y.T.; Zeng, Z.Q.; Huang, Z.G. Abatement of various types of VOCs by adsorption/catalytic oxidation: A review. Chem. Eng. J. 2019, 370, 1128–1153. [Google Scholar] [CrossRef]
  18. Kawashima, A.; Katayama, M.; Matsumoto, N.; Honda, K. Physicochemical characteristics of carbonaceous adsorbent for dioxin-like polychlorinated biphenyl adsorption. Chemosphere 2011, 83, 823–830. [Google Scholar] [CrossRef]
  19. Wang, P.; Xu, S.; Chen, Z.; Chen, T.; Lin, X.; Ma, Y.; Zhang, M.; Li, X. Inhibition of polychlorinated dibenzo-p-dioxins and dibenzofurans by phosphorus-containing compounds in model fly ash. Chemosphere 2020, 257, 127168. [Google Scholar] [CrossRef]
  20. Guan, X.; Ghimire, A.; Potter, P.M.; Lomnicki, S.M. Role of Fe2O3 in fly ash surrogate on PCDD/Fs formation from 2-monochlorophenol. Chemosphere 2019, 226, 809–816. [Google Scholar] [CrossRef]
  21. Nganai, S.; Lomnicki, S. Surface catalysed PCDD/F formation from precursors—High PCDF yield does not indicate de novo mechanism! Int. J. Environ. Pollut. 2017, 61, 208–222. [Google Scholar] [CrossRef]
  22. Weber, R.; Sakurai, T.; Hagenmaier, H. Formation and destruction of PCDD/PCDF during heat treatment of fly ash samples from fluidized bed incinerators. Chemosphere 1999, 38, 2633–2642. [Google Scholar] [CrossRef]
  23. Chen, T.; Zhan, M.; Lin, X.; Fu, J.; Lu, S.; Li, X. Distribution of PCDD/Fs in the fly ash and atmospheric air of two typical hazardous waste incinerators in eastern China. Environ. Sci. Pollut. Res. 2015, 22, 1207–1214. [Google Scholar] [CrossRef]
  24. Wang, L.; Lee, W.; Lee, W.; Chang-Chien, G.; Tsai, P. Effect of chlorine content in feeding wastes of incineration on the emission of polychlorinated dibenzo-p-dioxins/dibenzofurans. Sci. Total Environ. 2003, 302, 185–198. [Google Scholar] [CrossRef] [PubMed]
  25. Gao, H.; Ni, Y.; Zhang, H.; Zhao, L.; Zhang, N.; Zhang, X.; Zhang, Q.; Chen, J. Stack gas emissions of PCDD/Fs from hospital waste incinerators in China. Chemosphere 2009, 77, 634–639. [Google Scholar] [CrossRef] [PubMed]
  26. Han, J.; Guo, L.; Ke, Z.; Zhang, P.; Chen, J. PCDD/Fs Emission Characteristics of Medical Waste Incineration in Flue Gas. Environ. Sci. Technol. 2017, 40, 153–158. [Google Scholar]
  27. Li, J.; Lv, Z.; Du, L.; Li, X.; Hu, X.; Wang, C.; Niu, Z.; Zhang, Y. Emission characteristic of polychlorinated dibenzo-p-dioxins and polychlorinated dibenzofurans (PCDD/Fs) from medical waste incinerators (MWIs) in China in 2016: A comparison between higher emission levels of MWIs and lower emission levels of MWIs. Environ. Pollut. 2017, 221, 437–444. [Google Scholar] [CrossRef] [PubMed]
  28. Lin, W.; Wang, L.; Wang, Y.; Li, H. Removal characteristics of PCDD/Fs by the dual bag filter system of a fly ash treatment plant. J. Hazard. Mater. 2008, 153, 1015–1022. [Google Scholar] [CrossRef] [PubMed]
  29. Karademir, A.; Bakoglu, M.; Taspinar, F.; Ayberk, S. Removal of PCDD/Fs from Flue Gas by a Fixed-Bed Activated Carbon Filter in a Hazardous Waste Incinerator. Environ. Sci. Technol. 2004, 38, 1201–1207. [Google Scholar] [CrossRef]
  30. Smolka, A.; Schmidt, K. Gas/particle partitioning before and after flue gas purification by an activated-carbon-filter. Chemosphere 1997, 34, 1075–1082. [Google Scholar] [CrossRef]
  31. Hung, P.C.; Wei, C.L.; Kai, H.C.; Shu, H.C.; Chang, M.B. Reduction of dioxin emission by a multi-layer reactor with bead-shaped activated carbon in simulated gas stream and real flue gas of a sinter plant. Chemosphere 2010, 82, 72–77. [Google Scholar] [CrossRef]
  32. Lin, L.; Lee, W.; Li, H.; Wang, M.; Chang-Chien, G. Characterization and inventory of PCDD/F emissions from coal-fired power plants and other sources in Taiwan. Chemosphere 2007, 68, 1642–1649. [Google Scholar] [CrossRef]
  33. Ji, S.; Ren, Y.; Buekens, A.; Chen, T.; Lu, S.; Cen, K.; Li, X. Treating PCDD/Fs by combined catalysis and activated carbon adsorption. Chemosphere 2014, 102, 31–36. [Google Scholar] [CrossRef]
  34. Li, W.; Lin, X.; Yu, M.; Mubeen, I.; Buekens, A.; Li, X. Experimental Study on PCDD/Fs Adsorption onto Nano-Graphite. Aerosol Air Qual. Research. 2016, 16, 3281–3289. [Google Scholar] [CrossRef]
  35. Chang, Y.; Hung, C.; Chen, J.; Chang, C.; Chen, C. Minimum feeding rate of activated carbon to control dioxin emissions from a large-scale municipal solid waste incinerator. J. Hazard. Mater. 2009, 161, 1436–1443. [Google Scholar] [CrossRef] [PubMed]
  36. Duca, G.; Ciobanu, M.; Lupascu, T.; Povar, I. Adsorption of Strontium Ions from Aqueous Solutions on Nut Shells Activated Carbons. Chem. J. Mold. 2018, 13, 69–73. [Google Scholar] [CrossRef]
  37. Zhang, Y.L.; Li, D.G. Adsorption of pyridine on post-crosslinked fiber. J. Sci. Ind. Res. 2010, 69, 73–76. [Google Scholar]
  38. Chang, M.B.; Chi, K.H.; Chang-Chien, G.P. Evaluation of PCDD/F congener distributions in MWI flue gas treated with SCR catalysts. Chemosphere 2004, 55, 1457–1467. [Google Scholar] [CrossRef] [PubMed]
  39. Maetzing, H.; Baumann, W.; Becker, B.; Jay, K.; Paur, H.; Seifert, H. Adsorption of PCDD/F on MWI fly ash. Chemosphere 2001, 42, 803–809. [Google Scholar] [CrossRef]
  40. Brender, P.; Gadiou, R.; Rietsch, J.; Fioux, P.; Dentzer, J.; Ponche, A.; Vix-Guterl, C. Characterization of Carbon Surface Chemistry by Combined Temperature Programmed Desorption with in Situ X-ray Photoelectron Spectrometry and Temperature Programmed Desorption with Mass Spectrometry Analysis. Anal. Chem. 2012, 84, 2147–2153. [Google Scholar] [CrossRef]
  41. Zielke, U.; Hüttinger, K.J.; Hoffman, W.P. Surface-oxidized carbon fibers: I. Surface structure and chemistry. Carbon 1996, 34, 983–998. [Google Scholar] [CrossRef]
  42. Moulder, J.F.; Chastain, J.; King, R.C. Handbook of x-ray photoelectron spectroscopy: A reference book of standard spectra for identification and interpretation of XPS data. Chem. Phys. Lett. 1992, 220, 7–10. [Google Scholar]
  43. Biesinger, M.C. Accessing the robustness of adventitious carbon for charge referencing (correction) purposes in XPS analysis: Insights from a multi-user facility data review. Appl. Surf. Sci. 2022, 597, 153681. [Google Scholar] [CrossRef]
  44. Zhou, J.H.; Sui, Z.J.; Zhu, J.; Li, P.; De, C.; Dai, Y.C.; Yuan, W.K. Characterization of surface oxygen complexes on carbon nanofibers by TPD, XPS and FT-IR. Carbon 2007, 45, 785–796. [Google Scholar] [CrossRef]
  45. Ma, X.W.; Lv, H.; Yang, L.J.; Zhang, Z.; Sun, Z.K.; Wu, H. Removal characteristics of organic pollutants by the adsorbent injection coupled with bag filtering system. J. Hazard. Mater. 2021, 405, 124193. [Google Scholar] [CrossRef]
  46. Guo, Q.Q.; Jing, W.; Hou, Y.Q.; Huang, Z.G.; Ma, G.Q.; Han, X.J.; Sun, D.K. On the nature of oxygen groups for NH3-SCR of NO over carbon at low temperatures. Chem. Eng. J. 2015, 270, 41–49. [Google Scholar] [CrossRef]
  47. Sing, K.S. Reporting physisorption data for gas/solid systems with special reference to the determination of surface area and porosity (Recommendations 1984). Pure Appl. Chem. 1985, 57, 603–619. [Google Scholar] [CrossRef]
Figure 1. Initial PCDD/Fs: (a) concentrations and I-TEQ values, (b) proportions of PCDDs and PCDFs, and (c) concentration distribution of 17 toxic PCDD/Fs congeners under different temperatures.
Recycling 08 00098 g001
Figure 2. PCDD/Fs concentration and I-TEQ value before and after adsorption: (a) 150 °C; (b) 165 °C; (c) 180 °C.
Recycling 08 00098 g002
Figure 3. PCDD/Fs distribution: (a) PCDD/F homolog profiles, (b) variation in PCDD/Fs adsorption efficiencies with the chlorination level, and (c) PCDD/PCDF ratio and chlorination degree at 150 °C.
Recycling 08 00098 g003
Figure 4. Correlation: (a) PCDD/Fs adsorption per gram of AC with different temperatures and (b) AC dosage with adsorption efficiencies at 150 °C.
Recycling 08 00098 g004
Figure 5. XPS spectra of AC and fitting curves: (a) C 1 s peak; (b) O 1 s peak.
Recycling 08 00098 g005
Figure 6. Functional groups of relevant oxygen atoms decided using the XPS spectra.
Recycling 08 00098 g006
Figure 7. (a) N2 adsorption–desorption isotherm at 77 K and pore size distribution. (b) Experimental facilities for adsorption of PCDD/Fs via AC.
Recycling 08 00098 g007
Table 1. Relative contents of elements in AC and functional groups in C 1 s and O 1 s from XPS spectra.
Survey-wt%O 1 s/C 1 sC 1 s-wt%O 1 s-wt%
C 1 sO 1 sPeak 1Peak 2Peak 3Peak 4Peak 5Peak IPeak IIPeak IIIPeak IVPeak V
Before91.818.190.089268.6313.206.722.268.7023.9746.5019.067.393.08
150 °C91.668.340.091067.4314.936.352.728.5722.5143.0023.078.912.50
165 °C91.798.210.089466.5816.885.902.827.8220.7039.8126.9910.821.67
180 °C91.578.430.092165.5618.245.692.997.5017.8431.3231.1913.406.25
Table 2. Physical characteristics and pore parameters of the AC used in this study.
ItemBET
Surface Area
Micropore Surface AreaMesopore Surface AreaTotal Pore VolumeMicropore VolumeMesopore VolumeAverage Pore Diameter
Unitm2/gm2/gm2/gcm3/gcm3/gcm3/gnm
Quantity6383892560.650.160.504.05
Table 3. Operational condition and flue gas composition.
No.Adsorption
Temperature
Dosage of
Activated Carbon
Carrier Gas
Flow Rate
Carrier Gas
(Volume Ratio)
Adsorption
Time
a0150 °C/500 mL/minN2:O2 = 9:11 h
a10.10 g
a20.15 g
a30.20 g
b0165 °C/
b10.10 g
b20.15 g
b30.20 g
c0180 °C/
c10.10 g
c20.15 g
c30.20 g
Disclaimer/Publisher’s Note: The statements, opinions and data contained in all publications are solely those of the individual author(s) and contributor(s) and not of MDPI and/or the editor(s). MDPI and/or the editor(s) disclaim responsibility for any injury to people or property resulting from any ideas, methods, instructions or products referred to in the content.

