Article

Assessing Greenhouse Gas Emissions and Energy Efficiency of Four Treatment Methods for Sustainable Food Waste Management

1
School of Materials and Environmental Engineering, Shenzhen Polytechnic University, Shenzhen 518055, China
2
College of Civil Engineering, Hunan University, Changsha 410082, China
3
School of Construction Engineering, Shenzhen Polytechnic, Shenzhen 518055, China
4
Department of Civil and Environmental Engineering, The Hong Kong University of Science and Technology, Clear Water Bay, Hong Kong SAR, China
*
Author to whom correspondence should be addressed.
Recycling 2023, 8(5), 66; https://doi.org/10.3390/recycling8050066
Submission received: 21 June 2023 / Revised: 14 August 2023 / Accepted: 24 August 2023 / Published: 27 August 2023
(This article belongs to the Special Issue Sustainable Recycling of Municipal Solid Waste)

Abstract

:
Food waste (FW) increases with urbanization and population growth, which puts pressure on the treatment system, causing a variety of harmful impacts on the environment. Proper FW treatment is imperative for ecological integrity and public health. Even though FW treatment is an extensively studied topic, the sustainable FW treatment considering holistic-lifecycle-based environmental impacts has rarely been evaluated. This study addresses this gap through a comprehensive analysis of various FW treatment methods, including co-treatment with sewage, anaerobic digestion, incineration, and aerobic composting. The impacts of greenhouse gas (GHG) emission and energy use efficiency are assessed by analyzing diverse FW treatment methods in Shenzhen, China. The study indicates that FW addition to sewage does not adversely affect the current sewage treatment plant, but benefits GHG avoidance and energy recovery. Compared with the other FW treatment methods, FW anaerobic digestion avoids the most GHG emissions with −71.3 kg CO2 eq/FU and recovers the most energy with −223 kWh/FU, followed by FW co-treated with sewage. The energy conversion efficiency of the combined heat and power (CHP) unit greatly affects FW incineration, while energy consumption in incineration and anaerobic digestion (AD) process is relatively minor. Perturbation analysis pinpoints key parameters influencing outcomes, including CHP efficiency, GHG emission factor of local electricity, and chemical oxygen demand (COD) in FW with ratios of −13~−0.942, −0.518~0.22, and −13~1.01, respectively, that should be given special attention. This study sheds light on sustainable FW management strategies, not only in China but also transferrable to regions confronting similar challenges. Advocating ecologically balanced and resource-efficient approaches, the study aligns with broader aims of fostering sustainable development.

1. Introduction

The surge in urbanization and population expansion has propelled a concomitant rise in food waste (FW) generation, engendering intricate challenges within the domain of municipal waste management and imposing formidable environmental stresses. Quantitative assessments underscore an annual production of a staggering 931 million tons of FW worldwide, with residential, food service, and retail sectors accounting for 61%, 26%, and 13%, respectively [1]. In China, FW production increased by 118% from 2001 to 2018 and is expected to reach approximately 2.2 million tons by 2040 [2]. Consequently, growing concerns revolve around the ecological implications inherent to FW disposal, with a discernible focus on its discernible contributions to global greenhouse gas (GHG) emissions and energy consumption [3]. Globally, FW emerges as a conspicuous contributor, constituting a substantial 8–10% proportion of the cumulative GHG emissions, approximating a voluminous 3.3 billion tons of carbon dioxide [4]. Consequently, the appropriate management and recycling of FW present pivotal imperatives for the advancement of sustainable municipal solid waste management practices.
FW is a valuable source of organic matter, highly biodegradable and suitable for biological treatment to recover resources. In Shenzhen, anaerobic digestion (AD), aerobic composting, and incineration are commonly used FW treatment methods. Using aerobic or anaerobic composting [5], FW can be degraded into organic compost, offering a sustainable alternative to mineral fertilizers, reducing energy consumption and associated GHG and energy consumption [6]. However, the quality of the organic compost is a problem, with lower efficiency compared to mineral fertilizers [7]. AD is another alternative for FW biological treatment [8], wherein microorganisms decompose organic matter in an oxygen-free environment, generating biogas primarily composed of methane and carbon dioxide [8]. With a high calorific value, methane can be harnessed for heating and electricity generation via combined heat and power generation systems (CHPs). However, AD’s operational complexity surpasses that of FW aerobic composting [9,10]. In addition, incineration is also a commonly used method for solid waste disposal [11]. However, FW has a high water content and is not conducive to direct combusting, necessitating supplementary fossil fuels to facilitate the process [12]. In China, low chemical oxygen demand (COD) and biochemical oxygen demand (BOD) concentrations in sewage make it difficult to achieve efficient biological treatment [13]. Conversely, FW is rich in COD, making it viable for co-treatment with sewage [14]. This integrated approach can address the low COD concern in sewage while concurrently managing FW [15]. However, the surge in sludge production poses subsequent challenges in sludge treatment [16]. Overall, the adequate treatment of FW in Shenzhen presents policymakers with intricate challenges, necessitating comprehensive evaluation for sustainable management strategies.
Recently, there have been some studies focusing on the sustainable treatment of FW. Like, Yeo et al. [17] conducted a comprehensive assessment of the environmental performance of onsite FW fermentation in Hong Kong. Their study explored four fermentation technics and found their environmental superiority over the usual cases in Hong Kong. Similarly, You et al. [18] compared the treatment technic of co-gasification and incineration for sewage sludge and FW, identifying the former technic to be more economically attractive. Another study evaluated lifecycle based environmental evaluations of different FW disposal approaches, using landfill, incineration and AD [11]. It indicates landfill is the least environmentally friendly approach. In contrast, AD and incineration approaches performed better in different environmental impacts, illustrating the optimal choices depending on the specific situations. Two full-scale FW treatment plants with different AD processes are compared with GHG, energy consumption, and acidification potential impacts [19]. This investigation unveiled the intricate interrelation of environmental impacts to FW compositions, treatment methodologies, and environmental implications, providing constructive suggestions to access the optimal resources recovery. Moreover, FW disposers have been implemented in the United States (US) for more than half a century [5], in this approach the crushed FW is disposed into sewers and co-treated with sewage. Recent research has highlighted the feasibility of co-treating FW with sewage in Hong Kong, and it increases ~30% of the COD loading in influent wastewater without disturbing the established normal sewage operation [16]. Iqbal et al. [15] further evaluated the methane generation, energy consumption and GHG generation for FW co-treated with sewage, firmly establishing its merit within the domain of co-treatment strategies.
Contemporary research on food waste (FW) predominantly concentrates on a limited spectrum of treatment methods, neglecting a comprehensive assessment of prevailing FW management techniques. This study addresses this gap by extensively evaluating potential FW management strategies, including anaerobic digestion, landfilling, aerobic composting, incineration, and the innovative co-treatment with wastewater. Notably, co-treatment with sewage is seldom considered in the current literature, because of lacking necessary information and data [5]. FW co-treatment with sewage can not only solve the issue of lower COD in some plants but can also increase the biodegradability of the consequent sludge. However, is FW co-treatment with sewage a sustainable approach? Or do other approaches have superiority? This study seeks to unravel the sustainability of FW management, offering comprehensive insights into diverse scenarios and bridging the knowledge gap to advance resource-efficient waste management practices.
This study comprehensively evaluates four FW treatment approaches in Shenzhen, China, including AD, incineration, composting and co-treatment with sewage. Notably, FW disposal in landfill has been excluded because of local regulations. The environmental evaluation is conducted by using The Intergovernmental Panel on Climate Change (IPCC) suggestions for GHG and energy analysis [20], with the data mostly accessed from local sites or the relevant literature. This study aims to discern an optimal solution for sustainable FW management, accounting for both GHG emissions and energy criteria. While focusing on Shenzhen, this research holds broader significance, offering insights with global relevance for regions grappling with FW management complexities.

2. Results and Discussion

2.1. Performances of FW Co-Treatment with Wastewater

2.1.1. GHG Emissions from FW Co-Treated with Sewage

The total GHG emissions, both with and without FW addition, are presented in Figure 1. The most substantial GHG emissions emanate from the electricity consumption in WWTP. As electricity production from fossil-fuels generates GHG emissions, it contributes approximately 40–50% of the cumulative GHG in the WWTP. This finding is in consistent with others’ conclusion that electricity consumption is the main contributor for the overall GHG generation [15]. N2O stems from nitrification and denitrification processes employed for nitrogen removal from wastewater. Notably, N2O possesses a staggering GWP 273 times greater than that of CO2 [20]. Thereby, N2O is accountable for 37–39% of the total GHG emissions, as depicted in Figure 1. This corroborates with findings from a comprehensive review, citing N2O emissions as contribution 30–80% of the total GHG emissions [21]. The variation in N2O emissions’ contribution can be attributed to nuanced factors encompassing system boundaries, C/N ratio (affecting N2O production), temperature, pH, etc. [22]. Effective control of N2O generation during sewage treatment poses a challenge to achieving carbon-neutral sewage treatment. It indicates GHG emissions from FW transportation and crushing are insignificant in this study. However, a converse perspective is evident in regions relying on conventional vehicles fueled by fossil fuels, signifying the pertinence of local context and region-specific data [23]. This underscores the vital role of localized considerations in shaping the broader narrative of sustainable waste management strategies.
The sludge treatment process accounts for 30–40% of GHG emissions from inside the sewage plant, this contribution varied a lot depending on the technics applied for treatment [24]. FW addition slightly yields a marginal increase in energy consumption, but the increase is negligible (<1%). FW addition also increases the sludge settleability, as 98.9% of the sludge is water. Electricity consumed for dewatering includes gravity thickening, belt pressure and drying. The dewatered sludge is then transported to the incineration plant. According to the reports [7], waste can potentially undergo self-ignition when water content descends below the threshold of 40%. Moreover, energy is also required for stirring waste for air mixing consuming around 20% of the recovered energy. The recovered energy avoids 80–90% of GHG emissions. The extent of energy recovery mainly hinges on the waste’s organic matter content and the conversion efficiency of the CHP unit [25], which can vary across studies [26]. Overall, the net GHG emissions for co-treatment with FW are lower than without FW case, as greater GHG is avoided by greater energy recovery.

2.1.2. Energy Analysis for FW Co-Treated with Sewage

The energy balance for sewage with and without FW is depicted in Figure 2. Evidently, the predominant contributor to overall energy consumption is the aeration process, accounting for 80–84% of the total. It is also reflected in the GHG emission results that most GHG emissions are generated from electricity consumption in aeration tanks in Figure 1. This aligns with the conclusions drawn by Iqbal et al. [15], who reported that more than 60% of energy is consumed in aeration tanks.
The introduction of FW brings about a noticeable increase in energy consumption during the transportation and crushing phases; however, but it is with insignificant contribution, aligning with similar findings in the literature where FW addition will not significantly increase additional energy at this stage [15]. However, it significantly increases in aeration tanks with around 2-fold energy consumption than before. The COD in influent with FW is 604 mg/L, which is 0.9-fold greater than raw sewage without FW. This is because FW settleability is increased in the crushing process, causing most of the TS and COD in FW to settle as sludge in the primary settling tank [16]. The increased COD consumes more energy than before, as indicated by Zan et al. [16]. However, various COD concentrations in sewage and FW result in different energy consumption [16]. Moreover, FW addition also results in additional energy consumption for sludge dewatering compared to the case without FW. Sludge generation is almost double with the addition of FW, resulting in 1.8-fold energy consumption that also depends on the sludge amounts and characteristics in it [3]. Within the sewage plant, sludge treatment encompasses gravity thickening, belt pressure and drying to achieve a reduction in water content from 98.9% to 40% [7]. It accounts for around 17% of the energy consumed, showcasing a divergence from the observations in Liu et al.’s study, where this contribution was closer to 30% due to the utilization of different dewatering equipment [27].
The dried sludge (DS) is subsequently transported to the incineration plant, located 15 km away from the sewage treatment plant. Energy is used to facilitate waste agitation inside the incinerator, a factor that makes a negligible contribution to the overall energy consumption [28]. Because FW contains organic carbon, it increases the calorific value of the consequent sludge. The energy recovered from sludge with FW is 3.7 × 10⁵ kWh/d, which is 1.3 times greater than without FW. The net energy recovery with and without FW is higher than in Zan et al.’s study, reporting a 2-fold energy recovery [16]. This variance can be ascribed to divergent influent characteristics, COD content in FW, variations in treatment technics, and disparities in energy recovery efficiencies.

2.2. Alternatives for FW Management
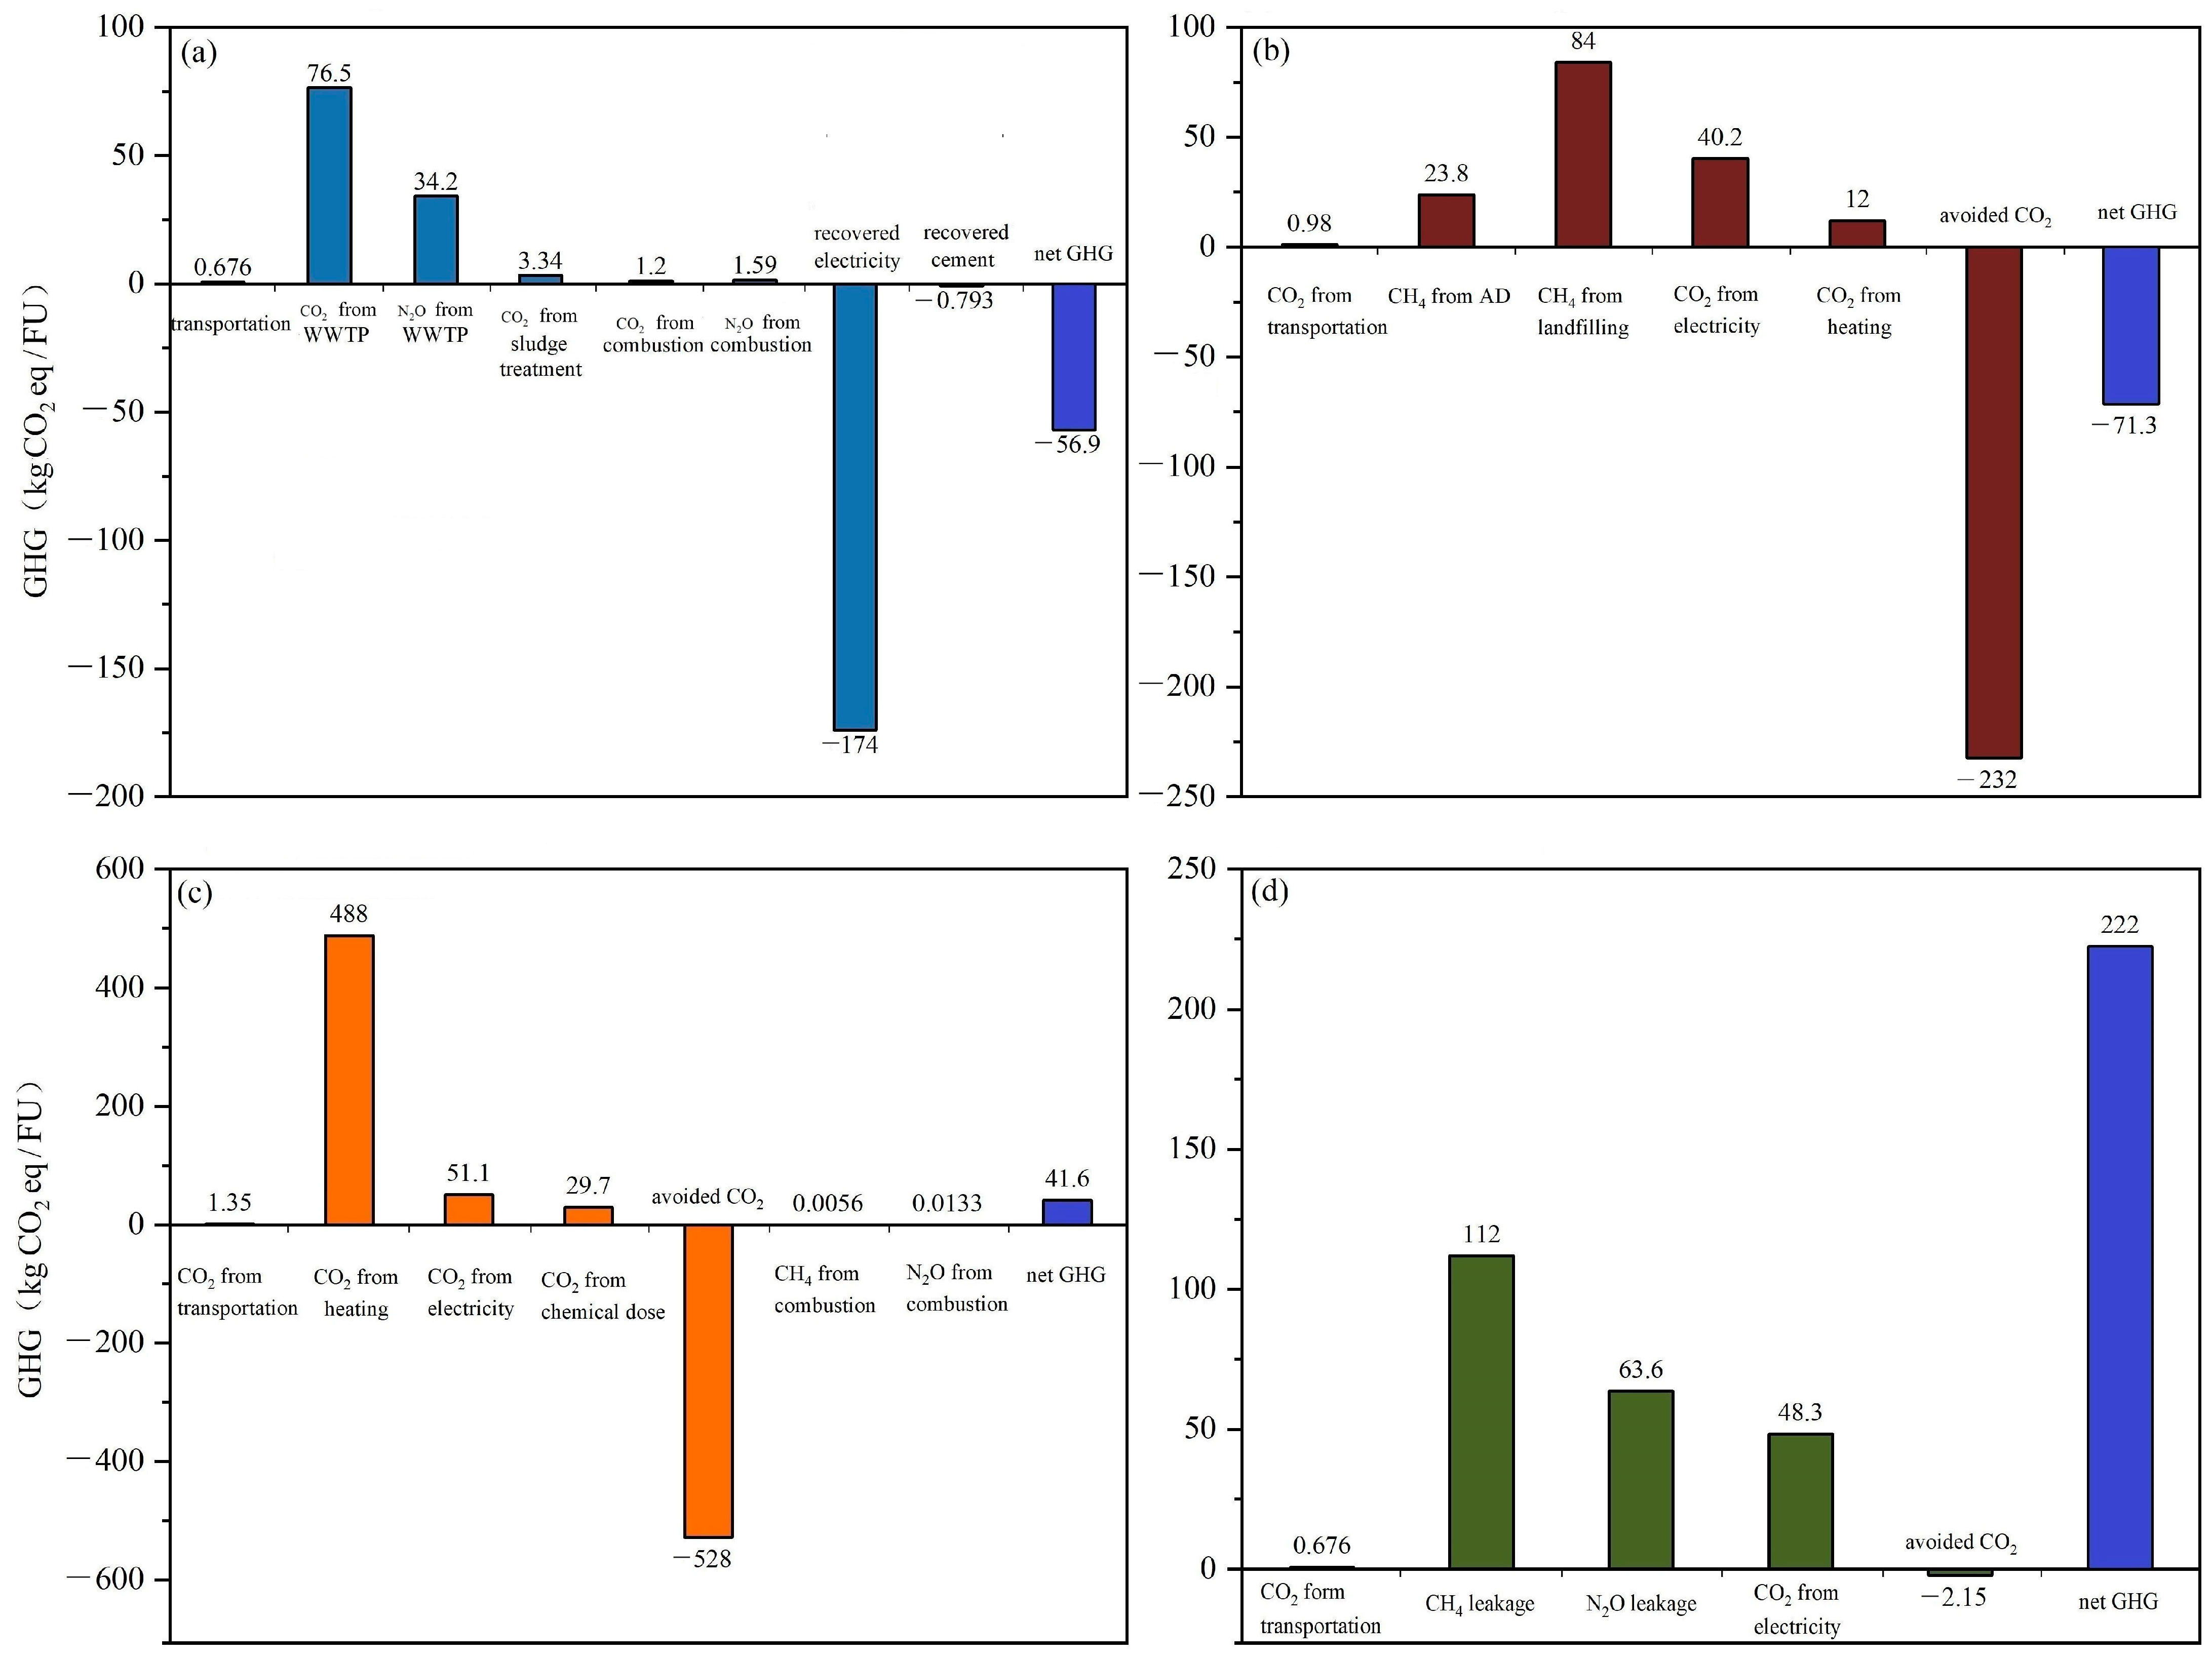
2.2.1. GHGs Impacts

The comparative analysis of GHG emissions across the four scenarios is indicated in Figure 3. In FW co-treated with sewage scenario (S1), GHG emissions are effectively circumvented through energy recovery during the sludge incineration process. Notably, the majority of GHG emissions are generated indirectly from energy consumption within aeration tanks. The generated GHG emissions are fully covered by the avoided GHG emissions, resulting in the negative result of −56.9 kg CO2 eq/FU. In FW-AD scenario (S2), −232 kg CO2 eq/FU is avoided by energy recovery from methane produced. The amount of GHG avoided depends on the COD in FW and CHP conversion efficiency, which also results in variation in different studies [15]. Methane leakage from AD tanks and landfill significantly contributes to the overall GHG emissions, aligning with insights from Yu et al.’s research, which identified these sources as primary GHG emission contributors within the FW-AD scenario [19]. On the contrary, GHG emissions attributed to thermal pretreatment constitute a relatively minor 7% of the aggregate, notably lower than the contribution from methane leakage. This is also much lower than Evangelisti et al.’s study reporting 13% from pretreatment [29]. Therefore, the variation in thermal pretreatment may affect the final results, the impact of energy used for thermal pretreatment is further studied and described in Section 3.3.
In S3 (FW incineration scenario), the main GHG emissions stem from electricity consumption for heating (488 kg CO2 eq/FU). This usage aligns with the significant energy requirement to elevate temperatures and facilitate moisture evaporation [30]. Around 528 kg CO2 eq/FU of GHG emissions are avoided via energy recovery. The efficacy of energy recovery hinges prominently upon the waste’s calorific value and the efficiencies of CHP systems [7]. Given the same CHP efficiency of 80%, the calorific value in FW is higher than in sewage sludge (Figure 3a), resulting in greater energy recovery and GHG avoidance for FW incineration. In S4 (FW composting scenario), GHG emissions are chiefly attributed to methane and N2O leakage within the compost, followed by electricity consumption associated with composting equipment Heating FW is necessary to accelerate aerobic composting reaction [31]. Moreover, stirring helps FW to be mixed with air. Using organic compost to replace mineral fertilizer avoids GHG emissions from the manufacturing process, but the avoided fraction is insignificant in the overall GHG results. This aligns with observations from the existing literature [24,27].
Among the proposed scenarios, FW co-treated with sewage benefited the most from GHG avoidance, with −56.9 kg CO2 eq/FU. Directly followed by the FW AD scenario, it is boasting a reduction of −50.8 kg CO2 eq/FU. The most beneficial feature of these two cases is the energy recovery by the CHP system making higher use of the contained exergy in the FW [32]. While energy recovery from FW incineration outperforms both FW co-treated with sewage and FW AD, the substantial energy consumption for dewatering FW to facilitate self-ignition significantly detracts from its net GHG emission profile within the system boundary [7]. Consequently, FW incineration exhibits less attractive net GHG emissions within system boundary compared to the former two scenarios. Notably, FW composting predominantly contributes to GHG generation, even though the utilization of organic compost as a substitute for mineral fertilizer results in a negligible fraction of emissions avoided. The comparative GHG performances among these four scenarios indicate that the most optimal scenario is FW co-treatment with sewage, but its energy performance is another indicator that should be considered and is described in the next section.

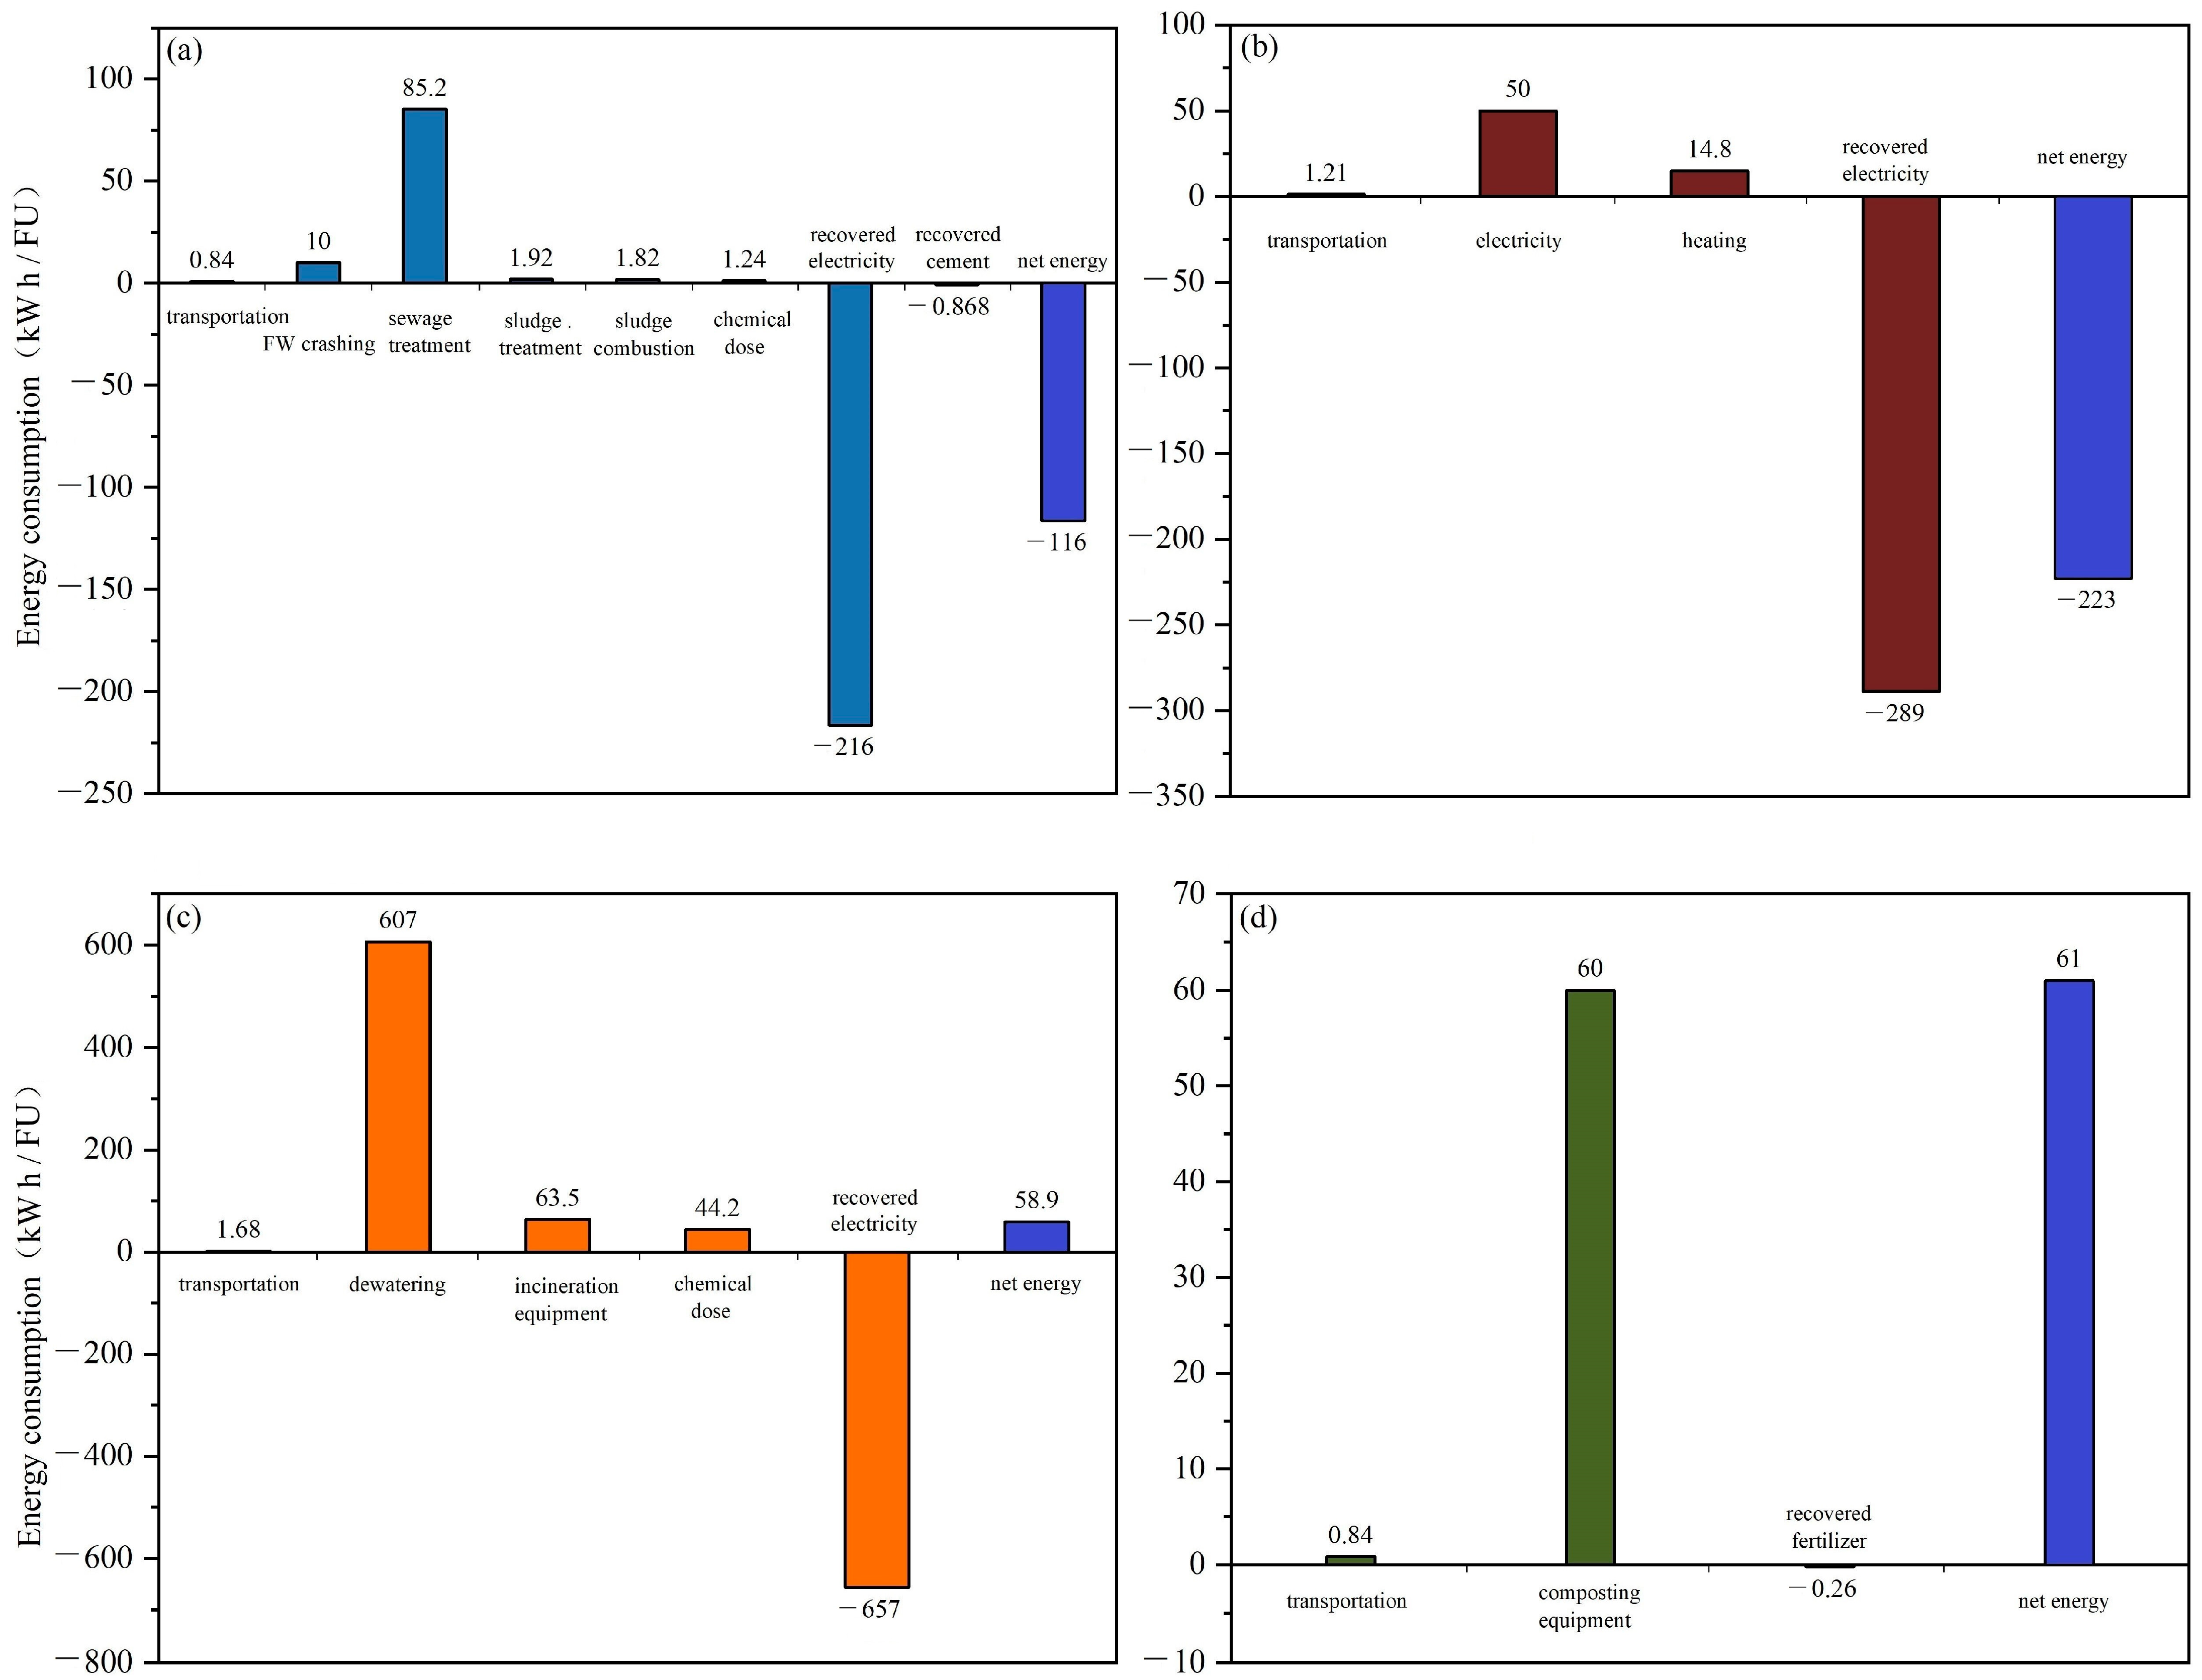
2.2.2. Energy Impacts

The energy analysis of each scenario and their subprocesses is shown in Figure 4. In S1, FW co-treated with sewage scenario consumes the most energy in the sewage treatment process. The energy consumption for sludge treatment is lower compared to other studies reporting around 30% of the total energy used by sludge treatment inside the plant [24]. It is because the results for S1 represent only the total results excluded from raw sewage sludge treatment. The addition of FW did not significantly increase the mixed sludge treatment burdens, which results in lower energy consumption for solo FW treatment. In S2 (FW-AD) scenario, a significant amount of energy is recovered by the CHP system, resulting in a negative energy balance. Energy recovery in S3 (FW incineration scenario) is 2.4~3.0-fold higher than the former two scenarios, but due to high energy consumption especially for waste drying, the net energy balance is positive. In S4 (FW composting), energy is mostly used for heating. The avoidance of mineral fertilizer indirectly replaces energy, but its contribution is negligible. This finding is consistent with Liu et al.’s study [27].
Among the proposed scenarios, S1 and S2 can achieve energy neutrality, i.e., recovering more energy than consumed. S2 slightly outperforms S1 due to higher energy consumption during sewage treatment. Considering the energy demand by other sub-processes, it was figured out that S3 and S4 fail to attain energy neutrality. Analyzing GHG and energy aspects reveals their close correlation but distinct performances across scenarios. FW co-treated with sewage is the most optimal in terms of GHG, but S2 FW AD stands out for energy recovery. Importantly, energy neutrality does not equate to GHG neutrality, and the latter stems not only from energy consumption but also from onsite emissions of methane and N2O [33,34]. Generally, carbon neutrality is more intricate than energy neutrality [35], given its multifaceted origins. Beyond GHG and energy aspects, green scenarios have wide applications such as green manufacturing [36] and green materials [37] which are also considerable for the integrated sustainability of FW management [38], but are beyond the scope of this study and will be considered in the future work.

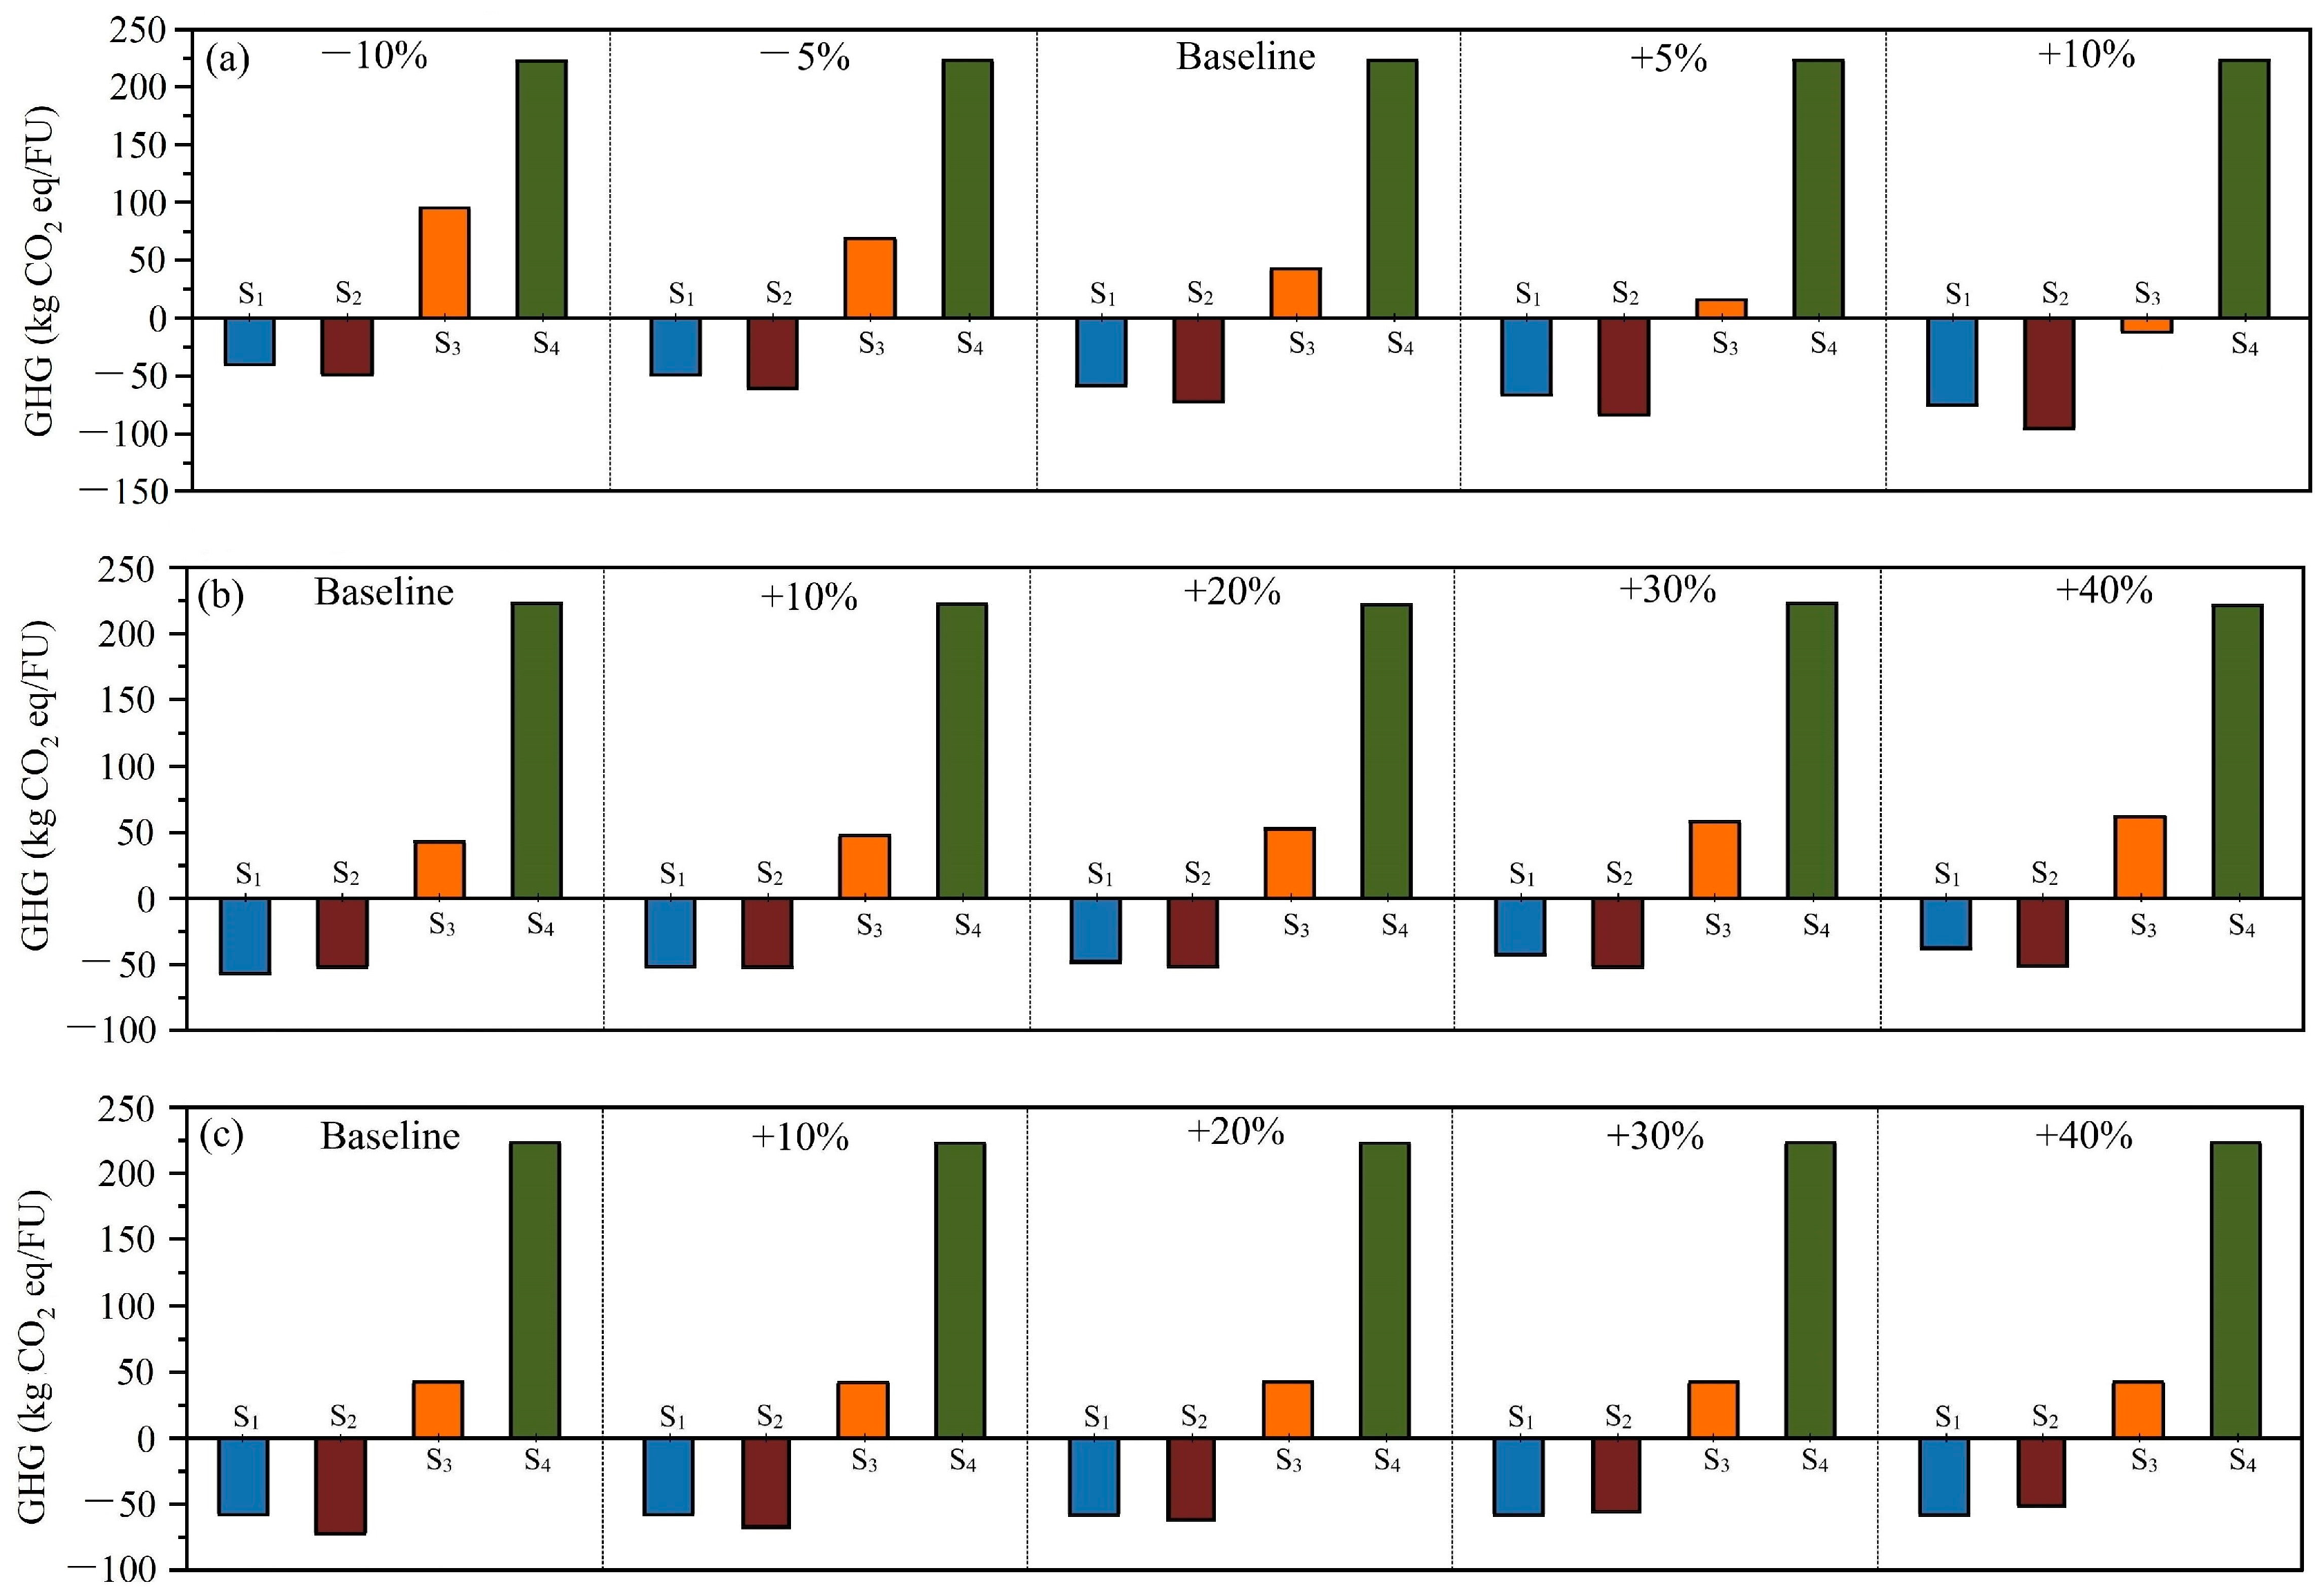
2.3. Scenario Analysis from CHP Efficiency, and Energy Consumption in AD and Incineration Process

Figure 5 portrays the influence of CHP efficiency, incineration energy consumption, and energy usage during the AD process on GHG emissions. CHP efficiency directly impacts energy recovery during incineration and the AD process, which influences the GHG results for S1, S2 and S3. It can be found that CHP has a pronounced effect on S3, which is using incineration for FW treatment. As delineated in Figure 3, the dominant contribution to the overall negative GHG emissions stems from GHG avoidance through energy recovery via the CHP system. Enhancing CHP efficiency by 10% enables S3 to achieve GHG neutrality. Figure 5b,c indicate the GHG variation from energy consumption in the incineration and AD processes. Increasing energy consumption in incineration adversely affects GHG results for S1 and S3. A 20% increase in energy consumption in incineration puts S1 at a disadvantage. Energy consumption in the incineration plant mainly includes heating for water drying and stirring waste for air mixing [7]. Utilizing equipment with highly efficiency underpins sustainable FW management [39]. Conversely, energy consumption in the AD process adversely impacts S2. In this study, the energy used for thermal pretreatment is taken at 60 kWh/t-waste [40], which is much less compared to other studies [26]; this could be attributed to equipment differences.
The energy analysis for CHP efficiency, energy consumption in incineration, and energy usage during AD is indicated in Figure 6. CHP efficiency significantly affects the energy analysis of S3, as depicted in Figure 6a. A 10% increase in CHP efficiency could propel S3 towards energy neutrality. In this study, CHP efficiency is taken 80% from Hao et al. [7], but another 10% increase in efficiency (88%) is hard to achieve. The CHP efficiency used in this study is higher than in other studies [41], implying that incineration might lose appeal at lower CHP efficiencies. Energy outcomes for S1 are slightly influenced because energy recovery contributes less in S1 than S3, as evidenced in Figure 2. Impacts of energy consumption in incineration and the AD process slightly affect energy results in the incineration and AD-related scenarios. However, the impact is too little to change the ranking of scenarios. The energy consumption in this scenario represents the fraction for heating and stirring wastes, which is less than the energy recovered from combusting wastes [41]. AD’s energy consumption is primarily allocated to thermal pretreatment, contributing less than 10% in this study. Variations in heating methods for thermal pretreatment can influence the net t results [19,42], yet the impact remains negligible.

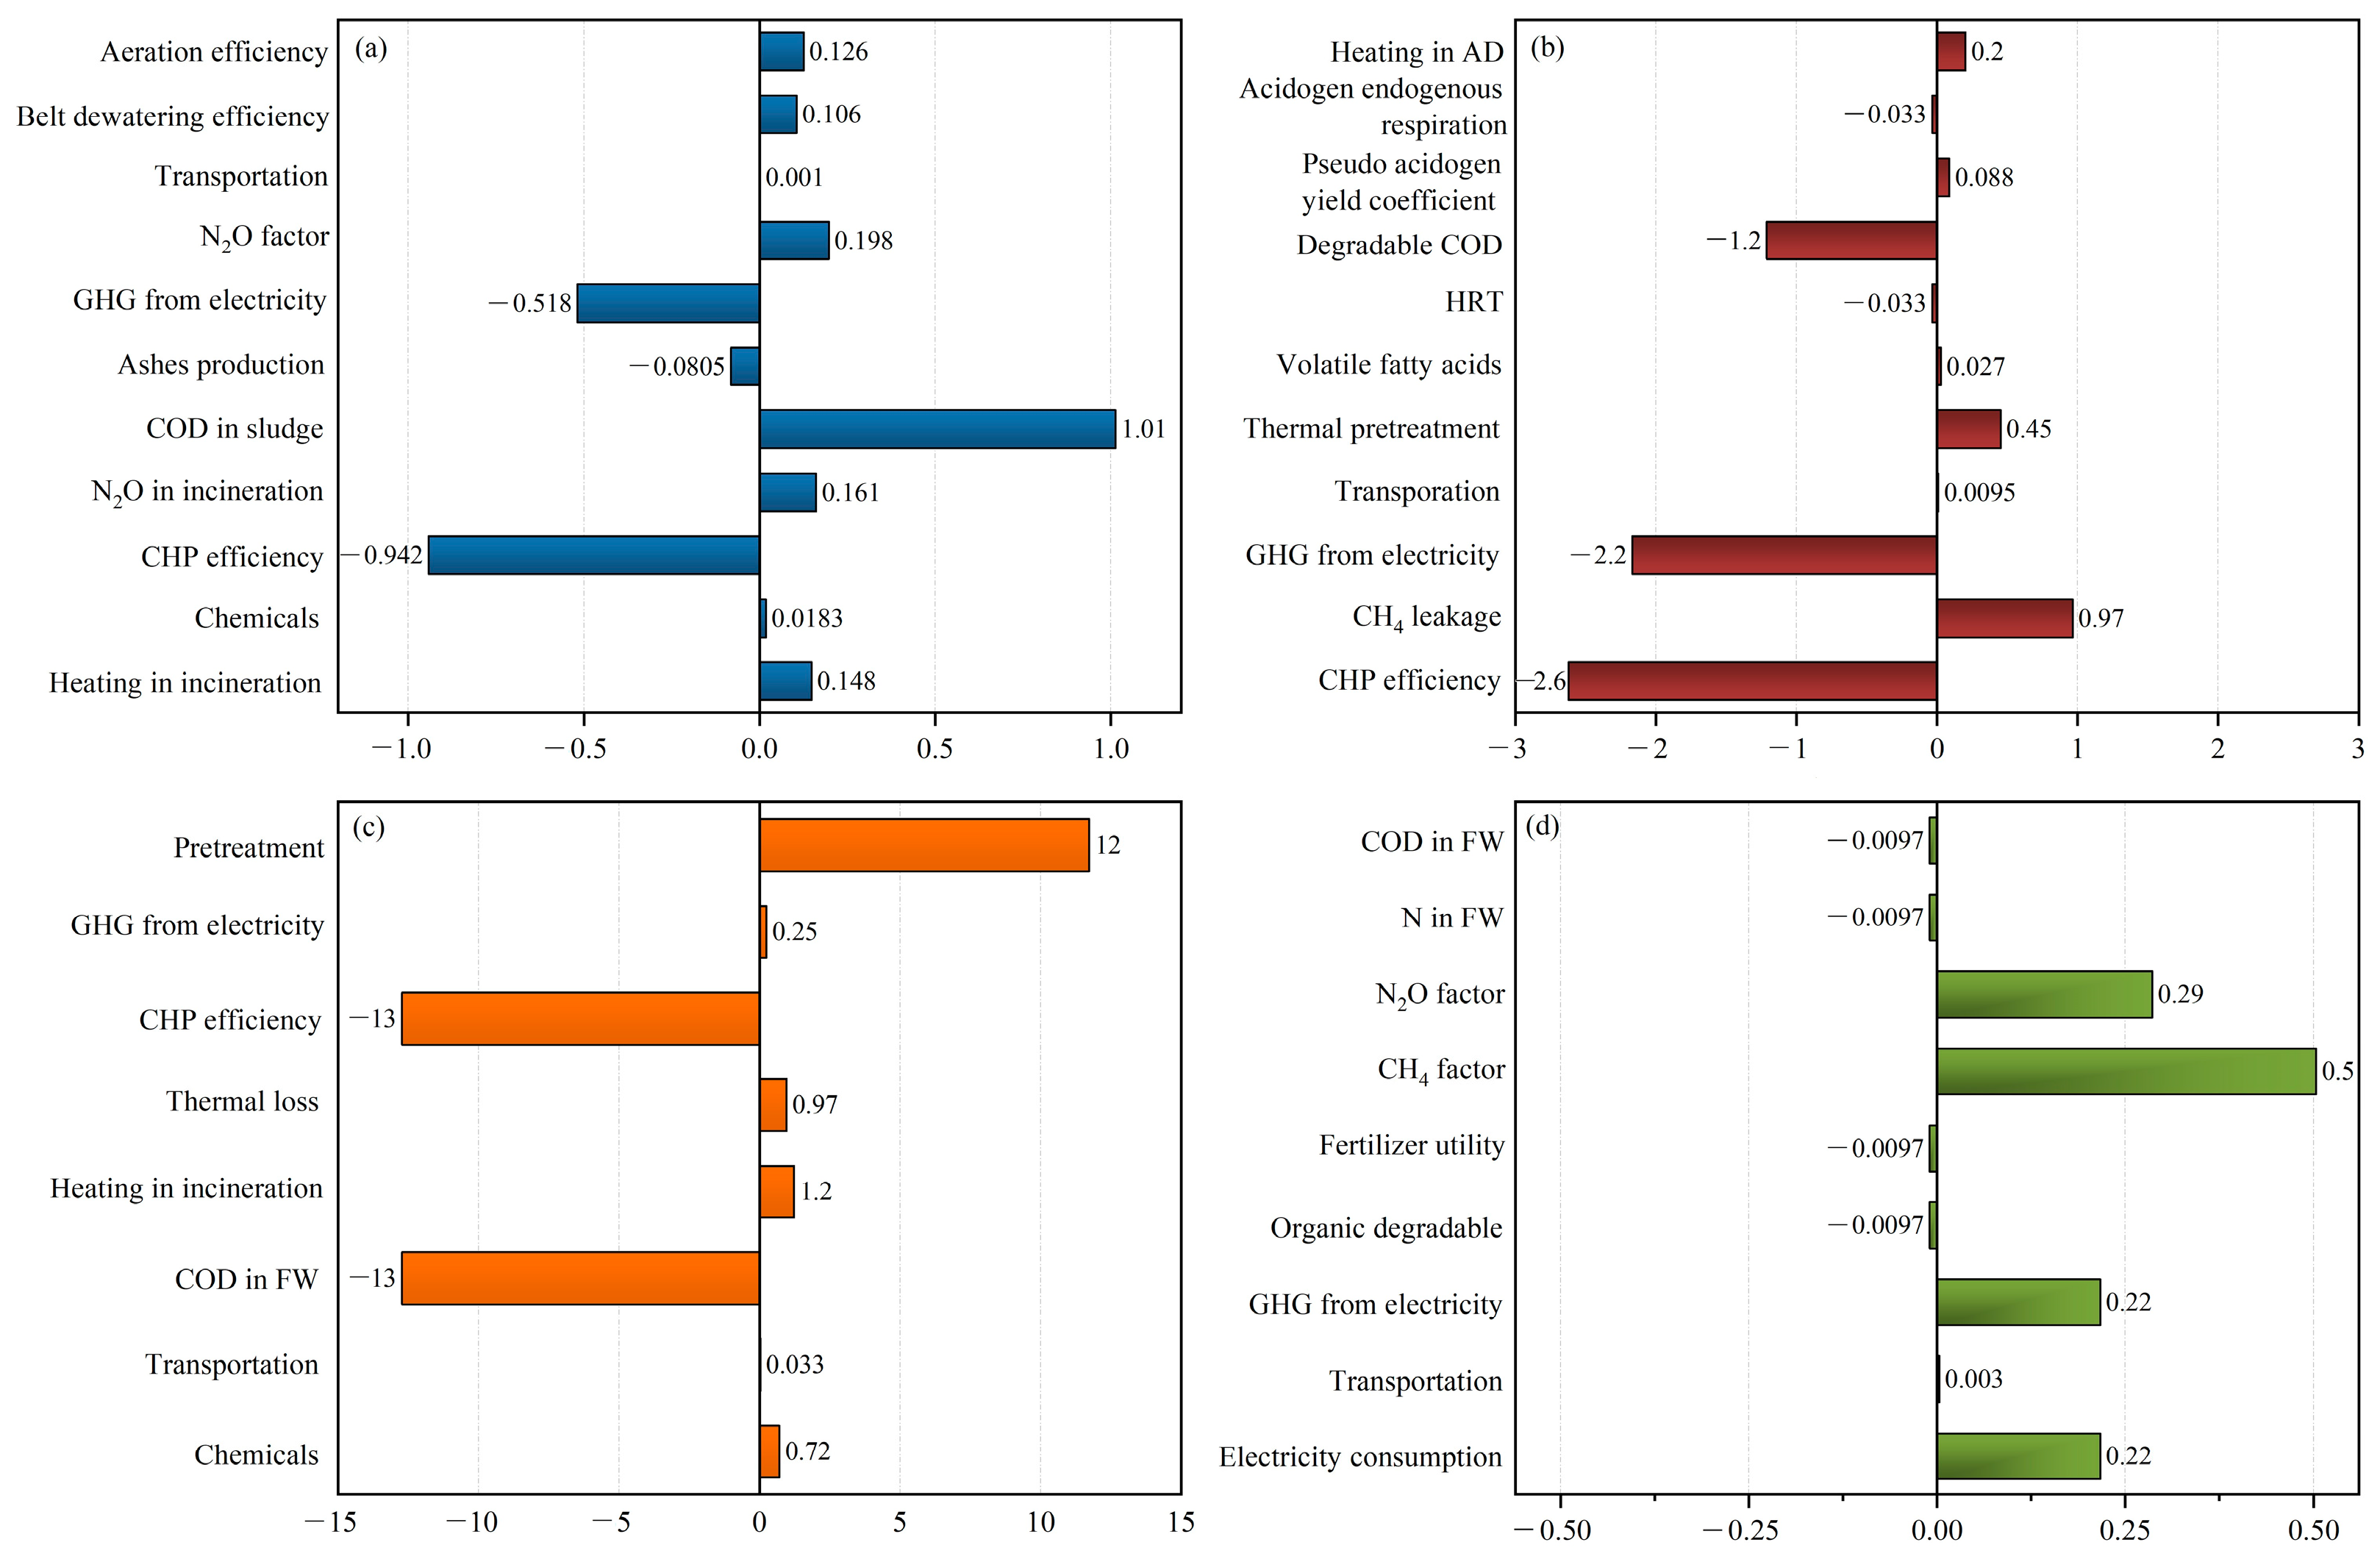
2.4. Perturbation Sensitivity Analysis

Perturbation sensitivity analysis was conducted on key parameters, with GHG analysis as an illustrative example. Figure 7 presents the sensitivity ratio (SR) resulting from a 10% variation in each parameter on net GHG emissions. Parameters with higher absolute SR values are more sensitive and have a greater impact on net results. Positive or negative SR values indicate the direction of impact a parameter has and whether this is a direct or inverse impact.
This reflects the variation of sensitive parameters across different scenarios. In scenario S1 (FW co-treated with sewage), COD in sludge is the most sensitive parameter with a 1.01 SR value. It is followed by CHP efficiency with −0.942 SR results, indicating the importance of enhancing CHP efficiency or using green energy [43]. Both these parameters hold a direct connection to energy recovery, where a higher CHP system efficiency leads to increased energy recovery, subsequently mitigating GHG emissions [30]. Moreover, the GHG emission factor of consumed electricity also significantly influences overall GHG results, with a −0.518 SR value [44]. The N2O emission factor in sewage treatment and incineration, and heating in incinerators have SRs of 0.198, 0.161, and 0.148, respectively. SR results may vary across studies [24,27], due to differences in system boundaries, parameters selection, and technique implemented.
In the FW AD scenario, CHP efficiency, GHG factor in electricity and degradable COD in FW are the three most influential parameters, with −2.6, −2.2, and −1.2 SR results, respectively. Enhancing these three parameters boosts energy recovery and avoids further GHG emissions [15,45]. Moreover, methane leakage indicates a 0.97 SR result, indicating the need for improving collection efficiency. Thermal pretreatment achieves an SR of 0.45. As indicated by Yoshida et al. [46], pretreatment consumes around 10–15% of recovered energy, using an efficient thermal pretreatment method will reduce GHG emissions but not to the extent as other sensitive parameters with greater SR indicated in Figure 7b. In FW incineration scenario, CHP efficiency and COD in FW are pivotal factors, each with an SR of 13.0. Waste pretreatment for self-ignition follows with an SR of 12.0. Other parameters hold minor roles. In FW composting, methane and N2O factors in the composting process are the most sensitive parameters, followed by the GHG emission factor of electricity and onsite electricity consumption.
In the perturbation analysis, parameters with higher SR results influence the overall results. Thus, utilizing accurate values from these parameters is imperative to ensure result reliability. Conversely, parameters with lower SRs insignificantly impact the results. If case-specific data are not available for these parameters, default or literature data can be used to save time and workload during data collection [47].

3. Methods

3.1. Study Purpose, Scope and Functional Unit

This study aims to identify an effective method of FW disposal in terms of energy saving and carbon neutrality. To ensure comparability between different FW disposal methods, a functional unit (FU) is essential for the lifecycle-based analysis within the system boundary. Treatment of 1 ton of FW is defined as FU following suggestions from other scholars [47]. Four scenarios are defined in this study as depicted in Figure 8, where the system boundary covers the energy and GHG emissions involved in the whole system, including transportation. The GHG calculation involves direct and indirect emissions and avoided GHGs. The indirect GHGs mainly are emissions generated from the production and use of energy and chemicals. The direct GHGs mainly include non-biogenic CO2, CH4, and N2O generated from FW degradation. The study focuses on the operation phases only, as the construction phase has insignificant role in the whole system [28,48].

3.2. Food Waste Generation and Collection in Futian District, Shenzhen

As of 2023, around 1.55 million people live in Futian District, Shenzhen [49]. According to statistics, the per capita FW output in Shenzhen is estimated at 0.26 kg FW/d [50], whereas the total FW output of Futian District is about 400 t FW/d having a density of 0.5 t/m3. The FW in Shenzhen mainly consists of cereal products (31%), followed by fruits (23%), vegetables (16%), animal waste (15%), and packaging waste (15%) [51]. The sewage generation rate is around 400,000 m3/d in Futian District. The average influent characteristics for raw sewage are COD 309.7 mg/L, BOD 151.3 mg/L, TN 31.3 mg/L, NH3-N 22.3 mg/L, NO3-N 0.49 mg/L, TP 3.5 mg/L, and SS 212.7 mg/L. As accessed from a local study [52], the influent characteristics are estimated to change as COD 604.0 mg/L, BOD 266.3 mg/L, TN 38.5 mg/L, NH3-N 23.1 mg/L, NO3-N 0.49 mg/L, TP 5.2 mg/L and SS 342.3 mg/L after FW addition.

3.3. Description of Scenarios

This study evaluates and compares the impacts of energy consumption and net GHG emissions of FW treatment by four scenarios: (1) co-treatment with wastewater, (2) anaerobic digestion (AD), (3) incineration, and (4) composting, as illustrated in Figure 1. The energy analysis includes any directly and indirectly consumed and recovered energy. The GHG calculation also involves direct and indirect emissions and avoided GHGs. Following the IPCC’s 100-year global warming potential (GWP) of GHGs, the GWP factors used in this study are 1:27:273 for CO2, CH4, and N2O, respectively [20,24]. Biogenic carbon dioxide is considered to be neutral (no warming potential) and is excluded from the calculation of GHG emissions, as suggested by IPCC [20,27].

3.3.1. Co-Treatment of FW with Sewage

Simulation of FW Co-Treated with Sewage in BioWin

This scenario focuses on FW co-treated with sewage in a sewage treatment plant located in Futian District, Shenzhen. The sewage plant has a treatment capacity of 400,000 m3/d, serving the whole Futian District. The plant has four multi-stage A2/O tanks for enhanced denitrification and phosphorus removal—an amount of 400 t/d FW is added for co-treatment. To analyze the sewage treatment with and without FW addition, BioWin 6.0 is used to simulate the treatment process and identify the influent quality and effluent standards [53]. BioWin is a wastewater treatment process simulator that ties together biological, chemical and physical processes, it is used worldwide to design, upgrade and optimize wastewater treatment plants [54]. In BioWin, multiple editors are available to adjust parameters to align with the actual operation of the wastewater treatment plant, including influent parameters, dynamic parameters, and stoichiometric parameters. After establishing the initial steady-state model based on the existing reactor parameters, sensitivity analysis is conducted to identify the potential influences from them. Parameters, such as the maximum growth rate of ammonia-oxidizing bacteria, nitrite-oxidizing bacteria, and phosphorus-accumulating bacteria, as well as the decay rate and yield coefficient of common heterotrophic bacteria, and the COD composition of influent wastewater, significantly impact the ecological balance within the reaction tank. Thereby, adjustments for significant parameters are necessary to improve the accuracy of the simulation by resetting the values for the parameters. The discrepancy between simulated and measured effluent data is defined within 20% to ensure the simulation accuracy.

Energy and GHG Emission Calculation

The distance for FW collection and transportation to the sewage plant is taken as 14 km, which is the average distance from the nearest and furthest collection sites to the sewage treatment plant in Futian District. Electric vehicles are used for transportation, with an average energy rating of 0.06 kWh/km per ton [48]. The FW is crushed at the sewage treatment plant to a particle size of 2–3 mm for 1 h by an electric crusher having a power rating of 100 kWh/10 tons of FW.
The crushed FW is co-treated with sewage in a biological activated sludge process. The electricity consumption by sewage treatment is estimated by BioWin, considering 60% oxygen transfer and utilization efficiency [55]. The sludge is collected from primary and secondary sedimentation tanks, with 98.9% water content. Gravity thickening is used first to reduce the water content to 98.5%, and then the belt press conveyer further reduces it to 65%. To enhance the dewatering efficiency, polyacrylamide (PAM) is added at a rate of 5 kg/t, the energy expenditure associated with chemicals production is referenced from Ecoinvent [56]. Within the Futian sewage treatment plant, the sludge is further dewatered by using a low-temperature belt drying to moisture content of 40%, which consumes electricity at 40 kWh/t for dehydration and another 300 kWh/t for drying [57], respectively.
The water content is decreased to 40% for self-ignition, which consumes energy consumption of 607 kWh/t FW [58]. Another energy input of 63.5 kWh/t FW is used in the incinerator to stir waste. Based on the carbon content in FW, the calorific value of FW is estimated to be 15 GJ/t [7], of which 20% energy loss is considered as per the CHP unit efficiency.
The dewatered sludge is transported to the sludge incineration plant located 15 km away, using electric trucks. It consumes 63.5 kWh/t FW for stirring waste in the incinerator. Energy recovery from combustion depends on the calorific value of the sludge and is estimated to be 11.54 GJ/t [7], the CHP system efficiency is considered 80%. To absorb hazardous flue gases (HCl, SO2, NOx, and dioxins), NaOH, NH3, Ca(OH)2, and activated carbon are used for flue gas treatment [45].
Indirect GHG emissions are related to electricity, chemicals, and fuel consumption within the system boundary. The local electricity emission factor is taken as 0.8042 kg CO2/kWh [59]. The GHG emission factors for chemicals and fuel are taken from the Ecoinvent database representing the country-specific data [56]. Meanwhile, GHG emissions are avoided by the recovery of electricity via incineration and cement production from incineration ashes.

3.3.2. FW Treated by Anaerobic Digestion

In this scenario, the FW is transported for 14 km to AD sites. During the AD process, organic contents are biodegraded and digested to methane and biogenic carbon dioxide. The combined heat and power (CHP) system uses methane as a fuel for energy recovery. The residual sludge/digestate is later disposed of in the landfill. Due to the high biodegradability of FW, no additional adjustment measures are considered for pretreatment, only thermal treatment is used to operate at mesophilic temperature (~35 °C) for methanogens growth.

Energy and GHG Emission Calculation

The energy consumption in this scenario includes energy used for FW transportation, thermal treatment for AD temperature maintenance, sludge dewatering, transportation of dewatered sludge to the landfill, and leachate treatment at the landfill site [27]. At the AD sites, a power of 60 kWh/t is used for thermal pretreatment [40]. For the AD process, a steady-state kinetic model from Sotemann et al. [60] is used to simulate hydrolysis, fermentation acidification, and methane generation. A leakage of 5% is considered for methane gas during the collection and combustion process [20]. The remaining 95% of methane is burned for heating and power generation. The energy conversion efficiency of 80% is considered for the CHP system. The calorific value of methane is taken as 39.82 MJ/m3 or 4.8 kWh/kg methane.
From Sotemann et al.’s model [60], around 35% of organic matter exists in the residues after the digestion process. The digested residue still has a high water content. Gravity thickening, chemical conditioning and belt-pressured dewatering are implemented for sludge dewatering. After the water content is reduced to around 60%, dried sludge (DS) is then transported to the landfill. A dosage of PAM at rate of 0.004 kg/kg-dry matter for sludge thickening and 0.0045 kg/kg-DS for sludge conditioning is taken following Xu et al. [61]. The electricity is used to add PAM for sludge conditioning with 0.975 kWh/kg-PAM [6]. After conditioning, the water content in sludge is 97%, which is further reduced to 75% for landfilling by using 0.064 kWh/kg-DS electricity, respectively [6]. In the managed landfill, digestate from AD is further biodegraded to generate methane [27]. The IPCC landfill model [20] is used to calculate the methane and biogenic carbon dioxide generation, and methane leakage is changed yearly as suggested by the IPCC report [20]. Methane is collected and combusted, and energy is further recovered in the CHP system, with the same conversion efficiency and calorific values as in the AD process. The detailed calculation steps of GHG and energy analysis can be found in Supplementary Materials (SM).
The main sources of GHG emissions in this scenario are methane leakage from methane collection systems in AD and landfill. In the CHP system, the collected methane is burned into carbon dioxide which is considered as biogenic carbon, as suggested by IPCC [20]. Moreover, the carbon dioxide from the AD and landfill is also considered biogenic carbon and is excluded from the system boundary [62]. Indirect GHG from transportation and chemicals are estimated based on the factors from the Ecoinvent database [20].

3.3.3. FW Treated by Direct Incineration

In this scenario, FW is priorly dewatered to achieve self-ignition. The energy consumption for thermal drying includes raising the temperature and evaporating the moisture. The water content is decreased to 40% for self-ignition, taking energy consumption of 607 kWh/t FW [58]. Another energy of 63.5 kWh/t FW is consumed in the incinerator for stirring wastes. According to the carbon content in FW, the calorific value of FW is estimated to be 15 GJ/t [7], which is converted to energy based on the 80% efficiency of the CHP unit. The amount and type of chemicals for flue gas treatment are taken from Liu et al. [11], with their respective indirect energy consumption rate taken from Ecoinvent [56].
The main sources of GHGs are indirectly generated from FW transportation, dehydration, electricity consumption during incineration, and chemical usage for toxic gas treatment. The GHG emission factors for chemical production are obtained from Ecoinvent [56]. During combustion, all organic carbon is assumed to be fully oxidized to CO2, and considered as biogenic carbon as recommended from IPCC reports [20]. The ashes are recycled for cement production [63], substituting the use of sand.

3.3.4. FW Treated by Aerobic Composting

In this scenario, FW is transported to the composting sites, where organic matter is decomposed for several weeks. It is converted into organic compost in the presence of the air, replacing the use of mineral fertilizer. Energy is mainly attributed to the transportation of FW and the use of composting equipment. Transportation distance is considered as 14 km, while the energy consumption rate of thermal composting equipment is taken as 60 kWh/t FW from the local survey.
The GHGs include the direct release of CH4 and N2O during the composting process and indirect emissions associated with the energy consumption mentioned above. Following the IPCC guidelines, CH4 leakage during the process is estimated to be 4 kg/t-FW, while N2O leakage is estimated at 0.24 kg/t-FW [20]. GHG estimation from transportation uses the same method as described before. The use of organic compost reduces the consumption of mineral fertilizer, avoiding related energy consumption and GHG emissions. The nitrogen content in FW is used to estimate the amount of fertilizer that could be avoided. The following equation is used to calculate the replacement of urea [64].
W u = W o θ C N ( M u r e a / M c ) ρ
where W u is the urea replaced by using food waste as fertilizer, Wo is the amount of food waste, θ is composting production efficiency using 5% in this study, C N is nitrogen content in FW using 3.51% in Shenzhen, M u r e a and M c are molecular weights for urea and carbon, respectively, and ρ is the utilization rate as fertilizer (70%). Based on this calculation, 1 t of FW can replace 6.15 kg of urea.

4. Conclusions and Perspectives

The study evaluated the GHG emissions and energy analysis of four different alternatives for treating food waste, i.e., FW co-treated with sewage, FW-AD, FW incineration, and FW composting. The results indicated that FW co-treated with sewage generates the least GHG emissions, and the FW-AD scenario performs best in terms of energy analysis. Both options are viable for sustainable management, but policymakers must consider trade-offs. FW incineration and composting are less favorable in both GHG and energy performances due to excessive heating energy consumption in the former and minimal energy recovery in the latter scenarios. The energy conversion efficiency of the CHP system mostly affects incineration-related scenarios, while energy consumption in incineration and AD process has a minor impact on FW co-treated with sewage, FW-AD, and FW incineration. Perturbation analysis highlights key parameters for environmental assessment and technology implementation: CHP efficiency, GHG emission factor of electricity, COD in FW, and degradable COD. These parameters are crucial considerations, applicable not only in China but universally relevant to countries grabbling with similar FW management challenges. AD process is mature and widely used. FW-AD approaches will benefit the adopters in less GHG emissions and greater energy recovery. Sustainable FW management is essential for holistic social benefits and advancing progress towards global sustainability objectives.

Supplementary Materials

The following are available online at https://www.mdpi.com/article/10.3390/recycling8050066/s1, Table S1: Literatures with the detailed explanations [65,66,67,68,69,70,71,72,73,74,75].

Author Contributions

Conception, X.L. and A.I.; methodology, W.C.; validation, H.Y. and Y.M.; investigation, M.A.S.; data curation, A.I.; writing—original draft preparation, S.L.; writing—review and editing, X.L.; funding acquisition, X.L. All authors have read and agreed to the published version of the manuscript.

Funding

This research was funded by Guangdong Basic and Applied Basic Research Foundation (2021A1515110040), Shenzhen Polytechnic Research Fund (6022312026K and 6022310022K), Shenzhen Science and Technology Program (JCYJ20220531094416037), and National Natural Science Foundation of China (52008117).

Data Availability Statement

Data is contained within the article or supplementary material.

Conflicts of Interest

The authors declare no conflict of interest.

References

  1. United Nations. UNEP Food Waste Index Report 2021; United Nations: New York, NY, USA, 2021. [Google Scholar]
  2. Zhang, H.; Liu, G.; Xue, L.; Zuo, J.; Chen, T.; Vuppaladadiyam, A.; Duan, H. Anaerobic digestion based waste-to-energy technologies can halve the climate impact of China’s fast-growing food waste by 2040. J. Clean. Prod. 2020, 277, 123490. [Google Scholar] [CrossRef]
  3. Iqbal, A.; Zan, F.; Siddiqui, M.A.; Nizamuddin, S.; Chen, G. Integrated treatment of food waste with wastewater and sewage sludge: Energy and carbon footprint analysis with economic implications. Sci. Total Environ. 2022, 825, 154052. [Google Scholar] [CrossRef] [PubMed]
  4. Food and Agriculture Organization of the United Nations. Food Wastage Footprint—Impacts on Natural Resources—Summary Report; Food and Agriculture Organization of the United Nations: Rome, Italy, 2023. [Google Scholar]
  5. Zan, F.; Iqbal, A.; Lu, X.; Wu, X.; Chen, G. “Food waste-Wastewater-Energy/Resource” Nexus: Integrating food waste management with wastewater treatment towards urban sustainability. Water Res. 2022, 211, 118089. [Google Scholar] [CrossRef]
  6. Yoshida, H.; ten Hoeve, M.; Christensen, T.H.; Bruun, S.; Jensen, L.S.; Scheutz, C. Life cycle assessment of sewage sludge management options including long-term impacts after land application. J. Clean. Prod. 2018, 174, 538–547. [Google Scholar] [CrossRef]
  7. Hao, X.; Chen, Q.; van Loosdrecht, M.C.M.; Li, J.; Jiang, H. Sustainable disposal of excess sludge: Incineration without anaerobic digestion. Water Res. 2020, 170, 115298. [Google Scholar] [CrossRef] [PubMed]
  8. Wen, Z.; Wang, Y.; De Clercq, D. What is the true value of food waste? A case study of technology integration in urban food waste treatment in Suzhou City, China. J. Clean. Prod. 2016, 118, 88–96. [Google Scholar] [CrossRef]
  9. Li, Y.; Jin, Y.; Borrion, A.; Li, H. Current status of food waste generation and management in China. Bioresour. Technol. 2019, 273, 654–665. [Google Scholar] [CrossRef]
  10. Wang, Y.; Wang, C.; Wang, Y.; Xia, Y.; Chen, G.; Zhang, T. Investigation on the anaerobic co-digestion of food waste with sewage sludge. Appl. Microbiol. Biotechnol. 2017, 101, 7755–7766. [Google Scholar] [CrossRef] [PubMed]
  11. Liu, M.; Ogunmoroti, A.; Liu, W.; Li, M.; Bi, M.; Liu, W.; Cui, Z. Assessment and projection of environmental impacts of food waste treatment in China from life cycle perspectives. Sci. Total Environ. 2022, 807, 150751. [Google Scholar] [CrossRef] [PubMed]
  12. Thomsen, M.; Romeo, D.; Caro, D.; Seghetta, M.; Cong, R.G. Environmental-economic analysis of integrated organicwaste and wastewater management systems: A case study from Aarhus City (Denmark). Sustainability 2018, 10, 3742. [Google Scholar] [CrossRef]
  13. Yang, G.; Zhang, G.; Wang, H. Current state of sludge production, management, treatment and disposal in China. Water Res. 2015, 78, 60–73. [Google Scholar] [CrossRef] [PubMed]
  14. Zan, F.; Zeng, Q.; Hao, T.; Ekama, G.A.; Hao, X.; Chen, G. Achieving methane production enhancement from waste activated sludge with sulfite pretreatment: Feasibility, kinetics and mechanism study. Water Res. 2019, 158, 438–448. [Google Scholar] [CrossRef]
  15. Iqbal, A.; Ekama, G.A.; Zan, F.; Liu, X.; Chui, H.-K.; Chen, G.-H. Potential for co-disposal and treatment of food waste with sewage: A plant-wide steady-state model evaluation. Water Res. 2020, 184, 116175. [Google Scholar] [CrossRef]
  16. Zan, F.; Iqbal, A.; Guo, G.; Liu, X.; Dai, J.; Ekama, G.A.; Chen, G. Integrated food waste management with wastewater treatment in Hong Kong: Transformation, energy balance and economic analysis. Water Res. 2020, 184, 116155. [Google Scholar] [CrossRef] [PubMed]
  17. Yeo, J.; Chopra, S.S.; Zhang, L.; An, A.K. Life cycle assessment (LCA) of food waste treatment in Hong Kong: On-site fermentation methodology. J. Environ. Manag. 2019, 240, 343–351. [Google Scholar] [CrossRef]
  18. You, S.; Wang, W.; Dai, Y.; Tong, Y.W.; Wang, C.-H. Comparison of the co-gasification of sewage sludge and food wastes and cost-benefit analysis of gasification- and incineration-based waste treatment schemes. Bioresour. Technol. 2016, 218, 595–605. [Google Scholar] [CrossRef]
  19. Yu, Q.; Li, H.; Deng, Z.; Liao, X.; Liu, S.; Liu, J. Comparative assessment on two full-scale food waste treatment plants with different anaerobic digestion processes. J. Clean. Prod. 2020, 263, 121625. [Google Scholar] [CrossRef]
  20. IPCC. 2019 IPCC Guidelines for National Greenhouse Gas Inventories; IPCC: Geneva, Switzerland, 2019. [Google Scholar]
  21. Corominas, L.; Foley, J.; Guest, J.S.; Hospido, A.; Larsen, H.F.; Morera, S.; Shaw, A. Life cycle assessment applied to wastewater treatment: State of the art. Water Res. 2013, 47, 5480–5492. [Google Scholar] [CrossRef] [PubMed]
  22. Lam, K.L.; Zlatanović, L.; van der Hoek, J.P. Life cycle assessment of nutrient recycling from wastewater: A critical review. Water Res. 2020, 173, 115519. [Google Scholar] [CrossRef]
  23. Woon, K.S.; Lo, I.M.C. An integrated life cycle costing and human health impact analysis of municipal solid waste management options in Hong Kong using modified eco-efficiency indicator. Resour. Conserv. Recycl. 2016, 107, 104–114. [Google Scholar] [CrossRef]
  24. Liu, X.; Iqbal, A.; Huang, H.; Zan, F.; Chen, G.; Wu, D. Life cycle assessment of deploying sludge minimization with (sulfidogenic-)oxic-settling-anaerobic configurations in sewage-sludge management systems. Bioresour. Technol. 2021, 335, 125266. [Google Scholar] [CrossRef]
  25. Murakami, T.; Suzuki, Y.; Nagasawa, H.; Yamamoto, T.; Koseki, T.; Hirose, H.; Okamoto, S. Combustion characteristics of sewage sludge in an incineration plant for energy recovery. Fuel Process. Technol. 2009, 90, 778–783. [Google Scholar] [CrossRef]
  26. Yoshida, H.; Clavreul, J.; Scheutz, C.; Christensen, T.H. Influence of data collection schemes on the Life Cycle Assessment of a municipal wastewater treatment plant. Water Res. 2014, 56, 292–303. [Google Scholar] [CrossRef]
  27. Liu, X.; Huang, H.; Iqbal, A.; Chen, J.; Zan, F.; Jiang, C.; Chen, G. Sustainability analysis of implementing sludge reduction in overall sludge management process: Where do we stand? Waste Manag. 2022, 152, 80–93. [Google Scholar] [CrossRef]
  28. Lu, D.; Iqbal, A.; Zan, F.; Liu, X.; Chen, G. Life-cycle-based greenhouse gas, energy, and economic analysis of municipal solid waste management using system dynamics model. Sustainability 2021, 13, 1641. [Google Scholar] [CrossRef]
  29. Evangelisti, S.; Lettieri, P.; Borello, D.; Clift, R. Life cycle assessment of energy from waste via anaerobic digestion: A UK case study. Waste Manag. 2014, 34, 226–237. [Google Scholar] [CrossRef]
  30. Samolada, M.C.; Zabaniotou, A.A. Comparative assessment of municipal sewage sludge incineration, gasification and pyrolysis for a sustainable sludge-to-energy management in Greece. Waste Manag. 2014, 34, 411–420. [Google Scholar] [CrossRef] [PubMed]
  31. Bruun, S.; Yoshida, H.; Nielsen, M.P.; Jensen, L.S.; Christensen, T.H.; Scheutz, C. Estimation of long-term environmental inventory factors associated with land application of sewage sludge. J. Clean. Prod. 2016, 126, 440–450. [Google Scholar] [CrossRef]
  32. Liikanen, M.; Havukainen, J.; Hupponen, M.; Horttanainen, M. Influence of different factors in the life cycle assessment of mixed municipal solid waste management systems—A comparison of case studies in Finland and China. J. Clean. Prod. 2017, 154, 389–400. [Google Scholar] [CrossRef]
  33. Risch, E.; Gutierrez, O.; Roux, P.; Boutin, C.; Corominas, L. Life cycle assessment of urban wastewater systems: Quantifying the relative contribution of sewer systems. Water Res. 2015, 77, 35–48. [Google Scholar] [CrossRef]
  34. McCarty, P.L.; Bae, J.; Kim, J. Domestic Wastewater Treatment as a Net Energy Producer–Can This be Achieved? Environ. Sci. Technol. 2011, 45, 7100–7106. [Google Scholar] [CrossRef] [PubMed]
  35. Corominas, L.; Byrne, D.M.; Guest, J.S.; Hospido, A.; Roux, P.; Shaw, A.; Short, M.D. The application of life cycle assessment (LCA) to wastewater treatment: A best practice guide and critical review. Water Res. 2020, 184, 116058. [Google Scholar] [CrossRef]
  36. Mughal, K.; Mughal, M.P.; Farooq, M.U.; Anwar, S.; Ammarullah, M.I. Using Nano-Fluids Minimum Quantity Lubrication (NF-MQL) to Improve Tool Wear Characteristics for Efficient Machining of CFRP/Ti6Al4V Aeronautical Structural Composite. Processes 2023, 11, 1540. [Google Scholar] [CrossRef]
  37. Ammarullah, M.I.; Hartono, R.; Supriyono, T.; Santoso, G.; Sugiharto, S.; Permana, M.S. Polycrystalline Diamond as a Potential Material for the Hard-on-Hard Bearing of Total Hip Prosthesis: Von Mises Stress Analysis. Biomedicines 2023, 11, 951. [Google Scholar] [CrossRef]
  38. Santoso, B.; Ammarullah, M.I.; Haryati, S.; Sofijan, A.; Bustan, M.D. Power and Energy Optimization of Carbon Based Lithium-Ion Battery from Water Spinach (Ipomoea Aquatica). J. Ecol. Eng. 2023, 24, 213–223. [Google Scholar] [CrossRef]
  39. Fang, L.L.; Valverde-Pérez, B.; Damgaard, A.; Plósz, B.G.; Rygaard, M. Life cycle assessment as development and decision support tool for wastewater resource recovery technology. Water Res. 2016, 88, 538–549. [Google Scholar] [CrossRef] [PubMed]
  40. Li, H.; Zhou, Y.; Liu, J.; Sun, G. Comprehensive somparison and optimal strategies of food waste treatment modes. Chin. J. Environ. Eng. 2021, 15, 2398–2408. (In Chinese) [Google Scholar]
  41. Woon, K.S.; Lo, I.M.C. Analyzing environmental hotspots of proposed landfill extension and advanced incineration facility in Hong Kong using life cycle assessment. J. Clean. Prod. 2014, 75, 64–74. [Google Scholar] [CrossRef]
  42. Hou, K.; Luo, X.; Liang, M.; Liu, X.; Xu, Q.; Chen, J.; Lu, X.; Wu, X.; Zan, F. Heat-enhanced sulfite pretreatment improves the release of soluble substances and the stimulation of methanogenic pathways for anaerobic digestion of waste activated sludge. Process Saf. Environ. Prot. 2023, 176, 997–1006. [Google Scholar] [CrossRef]
  43. Chin, M.Y.; Phuang, Z.X.; Woon, K.S.; Hanafiah, M.M.; Zhang, Z.; Liu, X. Life cycle assessment of bioelectrochemical and integrated microbial fuel cell systems for sustainable wastewater treatment and resource recovery. J. Environ. Manag. 2022, 320, 115778. [Google Scholar] [CrossRef]
  44. Iqbal, A.; Zan, F.; Liu, X.; Chen, G. Net Zero Greenhouse Emissions and Energy Recovery from Food Waste: Manifestation from Modelling a City-Wide Food Waste Management Plan. Water Res. 2023, 244, 120481. [Google Scholar] [CrossRef]
  45. Iqbal, A.; Zan, F.; Liu, X.; Chen, G.-H. Integrated municipal solid waste management scheme of Hong Kong: A comprehensive analysis in terms of global warming potential and energy use. J. Clean. Prod. 2019, 225, 1079–1088. [Google Scholar] [CrossRef]
  46. Yoshida, H.; Mønster, J.; Scheutz, C. Plant-integrated measurement of greenhouse gas emissions from a municipal wastewater treatment plant. Water Res. 2014, 61, 108–118. [Google Scholar] [CrossRef]
  47. Iqbal, A.; Liu, X.; Chen, G.H. Municipal solid waste: Review of best practices in application of life cycle assessment and sustainable management techniques. Sci. Total Environ. 2020, 729, 138622. [Google Scholar] [CrossRef] [PubMed]
  48. Liu, X.; Dai, J.; Ng, T.-L.; Chen, G. Evaluation of potential environmental benefits from seawater toilet flushing. Water Res. 2019, 162, 505–515. [Google Scholar] [CrossRef]
  49. Shenzhen Municipal People’s Government Bulletin. Bulletin of the Seventh National Census of Shenzhen; Shenzhen Municipal People’s Government Bulletin: Shenzhen, China, 2021. (In Chinese)
  50. Shenzhen Municipal People’s Government Bulletin. 2021 Shenzhen Ecological Environment Status Bulletin; Shenzhen Municipal People’s Government Bulletin: Shenzhen, China, 2021. (In Chinese)
  51. Zhang, H.; Duan, H.; Andric, J.M.; Song, M.; Yang, B. Characterization of household food waste and strategies for its reduction: A Shenzhen City case study. Waste Manag. 2018, 78, 426–433. [Google Scholar] [CrossRef]
  52. Liu, R.; Deng, Z.; Liang, W.; Li, S.; Xun, R.; Wang, W.; Chen, H.; Feng, K. Tolerance analysis of municipal sewage plants in Shenzhen by the application of kitchen waste disposer. Environ. Sanit. Eng. 2018, 26, 43–47. (In Chinese) [Google Scholar]
  53. Biowin 6.0. EnviroSim—Wastewater Modeling Softwre. EnviroSim Associates LTD. Available online: https://envirosim.com/ (accessed on 21 June 2023).
  54. Liwarska-Bizukojc, E.; Biernacki, R. Identification of the most sensitive parameters in the activated sludge model implemented in BioWin software. Bioresour. Technol. 2010, 101, 7278–7285. [Google Scholar] [CrossRef]
  55. Chen, G.-H.; van Loosdrecht, M.C.M.; Ekama, G.A.; Brdjanovic, D. Biological Wastewater Treatment: Principles, Modeling and Design; IWA Publishing: London, UK, 2020; ISBN 1789060354. [Google Scholar]
  56. SCLCI. Ecoinvent V3.0 Database; SCLCI: Dubendorf, Switzerland, 2020. [Google Scholar]
  57. Li, Z.; Zhang, L.; Du, Z.; Li, F.; Liu, Y. Comparision of carbon emissions in different treatment and disposal process routes of municipal sludge. Environ. Sci. 2023, 44, 1181–1190. (In Chinese) [Google Scholar]
  58. Yu, Q.; Li, H. Life cycle environmental performance of two restaurant food waste management strategies at Shenzhen, China. J. Mater. Cycles Waste Manag. 2021, 23, 826–839. [Google Scholar] [CrossRef]
  59. Ministry of Ecology and Environment of the People’s Republic of China. 2019 Annual Emission Reduction Project of China’s Regional Power Grid Baseline Emission Factors; Ministry of Ecology and Environment of the People’s Republic of China: Beijing, China, 2020.
  60. Sotemann, S.; Ristow, N.; Wentzel, M.; Ekama, G. A steady state model for anaerobic digestion of sewge sludges. Water 2005, 31, 511–527. [Google Scholar]
  61. Xu, C.; Chen, W.; Hong, J. Life-cycle environmental and economic assessment of sewage sludge treatment in China. J. Clean. Prod. 2014, 67, 79–87. [Google Scholar] [CrossRef]
  62. Liu, X.; Dai, J.; Wu, D.; Jiang, F.; Chen, G.; Chui, H.K.; van Loosdrecht, M.C.M. Sustainable Application of a Novel Water Cycle Using Seawater for Toilet Flushing. Engineering 2016, 2, 460–469. [Google Scholar] [CrossRef]
  63. Liang, Y.; Xu, D.; Feng, P.; Hao, B.; Guo, Y.; Wang, S. Municipal sewage sludge incineration and its air pollution control. J. Clean. Prod. 2021, 295, 126456. [Google Scholar] [CrossRef]
  64. Xiao, B.; Hui, G.; Zhong, Y.; Junkai, W. Comparison of carbon emission estimation among different “collection-disposal” modes for food waste. Chin. J. Environ. Eng. 2019, 13, 449–456. [Google Scholar]
  65. Bernstad Saraiva, A.; Davidsson, Å.; Bissmont, M. Lifecycle Assessment of a System for Food Waste Disposers to Tank—A Full-Scale System Evaluation. Waste Manag. 2016, 54, 169–177. [Google Scholar] [CrossRef]
  66. Kim, M.-H.; Kim, J.-W. Comparison through a LCA Evaluation Analysis of Food Waste Disposal Options from the Perspective of Global Warming and Resource Recovery. Sci. Total Environ. 2010, 408, 3998–4006. [Google Scholar] [CrossRef]
  67. Ahamed, A.; Yin, K.; Ng, B.J.H.; Ren, F.; Chang, V.W.-C.; Wang, J.-Y. Life Cycle Assessment of the Present and Proposed Food Waste Management Technologies from Environmental and Economic Impact Perspectives. J. Clean. Prod. 2016, 131, 607–614. [Google Scholar] [CrossRef]
  68. Eriksson, M.; Strid, I.; Hansson, P.-A. Carbon Footprint of Food Waste Management Options in the Waste Hierarchy—A Swedish Case Study. J. Clean. Prod. 2015, 93, 115–125. [Google Scholar] [CrossRef]
  69. Bernstad Saraiva Schott, A.; Andersson, T. Food Waste Minimization from a Life-Cycle Perspective. J. Environ. Manage. 2015, 147, 219–226. [Google Scholar] [CrossRef]
  70. Maalouf, A.; El-Fadel, M. Effect of a Food Waste Disposer Policy on Solid Waste and Wastewater Management with Economic Implications of Environmental Externalities. Waste Manag. 2017, 69, 455–462. [Google Scholar] [CrossRef] [PubMed]
  71. Kaur, G.; Luo, L.; Chen, G.; Wong, J.W.C. Integrated Food Waste and Sewage Treatment—A Better Approach than Conventional Food Waste-Sludge Co-Digestion for Higher Energy Recovery via Anaerobic Digestion. Bioresour. Technol. 2019, 289, 121698. [Google Scholar] [CrossRef] [PubMed]
  72. Edwards, J.; Othman, M.; Crossin, E.; Burn, S. Life Cycle Assessment to Compare the Environmental Impact of Seven Contemporary Food Waste Management Systems. Bioresour. Technol. 2018, 248, 156–173. [Google Scholar] [CrossRef]
  73. Cristóbal, J.; Limleamthong, P.; Manfredi, S.; Guillén-Gosálbez, G. Methodology for Combined Use of Data Envelopment Analysis and Life Cycle Assessment Applied to Food Waste Management. J. Clean. Prod. 2016, 135, 158–168. [Google Scholar] [CrossRef]
  74. Thyberg, K.L.; Tonjes, D.J. The Environmental Impacts of Alternative Food Waste Treatment Technologies in the U.S. J. Clean. Prod. 2017, 158, 101–108. [Google Scholar] [CrossRef]
  75. HKEMSD, Study on the Potential Applications of Renewable Energy in Hong Kong. Stage 1 Study Report; 2002. Available online: https://re.emsd.gov.hk/english/gen/overview/files/stage1_report.pdf (accessed on 21 June 2023).
Figure 1. GHG analysis for FW co-treatment with sewage scenario for both with and without FW addition.
Recycling 08 00066 g001
Figure 2. Energy analysis for FW co-treatment with sewage scenario for both with and without FW addition.
Recycling 08 00066 g002
Figure 3. GHG emissions for FW alternative treatment of (a) FW co-treated with sewage, (b) FW anaerobic digestion (AD), (c) FW incineration, and (d) FW composting.
Recycling 08 00066 g003
Figure 4. Energy analysis for FW alternative treatment scenarios by (a) FW co-treated with sewage, (b) FW anaerobic digestion, (c) FW incineration, and (d) FW composting.
Recycling 08 00066 g004
Figure 5. GHG emissions affected by (a) CHP efficiency, (b) energy consumption in incineration, and (c) in the AD process.
Recycling 08 00066 g005
Figure 6. Energy balance affected by (a) CHP efficiency, (b) energy consumption in incineration, and (c) in the AD process.
Recycling 08 00066 g006
Figure 7. Sensitivity ratios of parameters for GHG emissions results obtained by perturbation analysis for (a) FW + sewage treatment, (b) FW anaerobic digestion, (c) FW incineration, (d) FW composting.
Recycling 08 00066 g007
Figure 8. System boundary and scenario definition.
Recycling 08 00066 g008
Disclaimer/Publisher’s Note: The statements, opinions and data contained in all publications are solely those of the individual author(s) and contributor(s) and not of MDPI and/or the editor(s). MDPI and/or the editor(s) disclaim responsibility for any injury to people or property resulting from any ideas, methods, instructions or products referred to in the content.

