Neutron Imaging in Cultural Heritage Research at the FRM II Reactor of the Heinz Maier-Leibnitz Center

 , and
, and 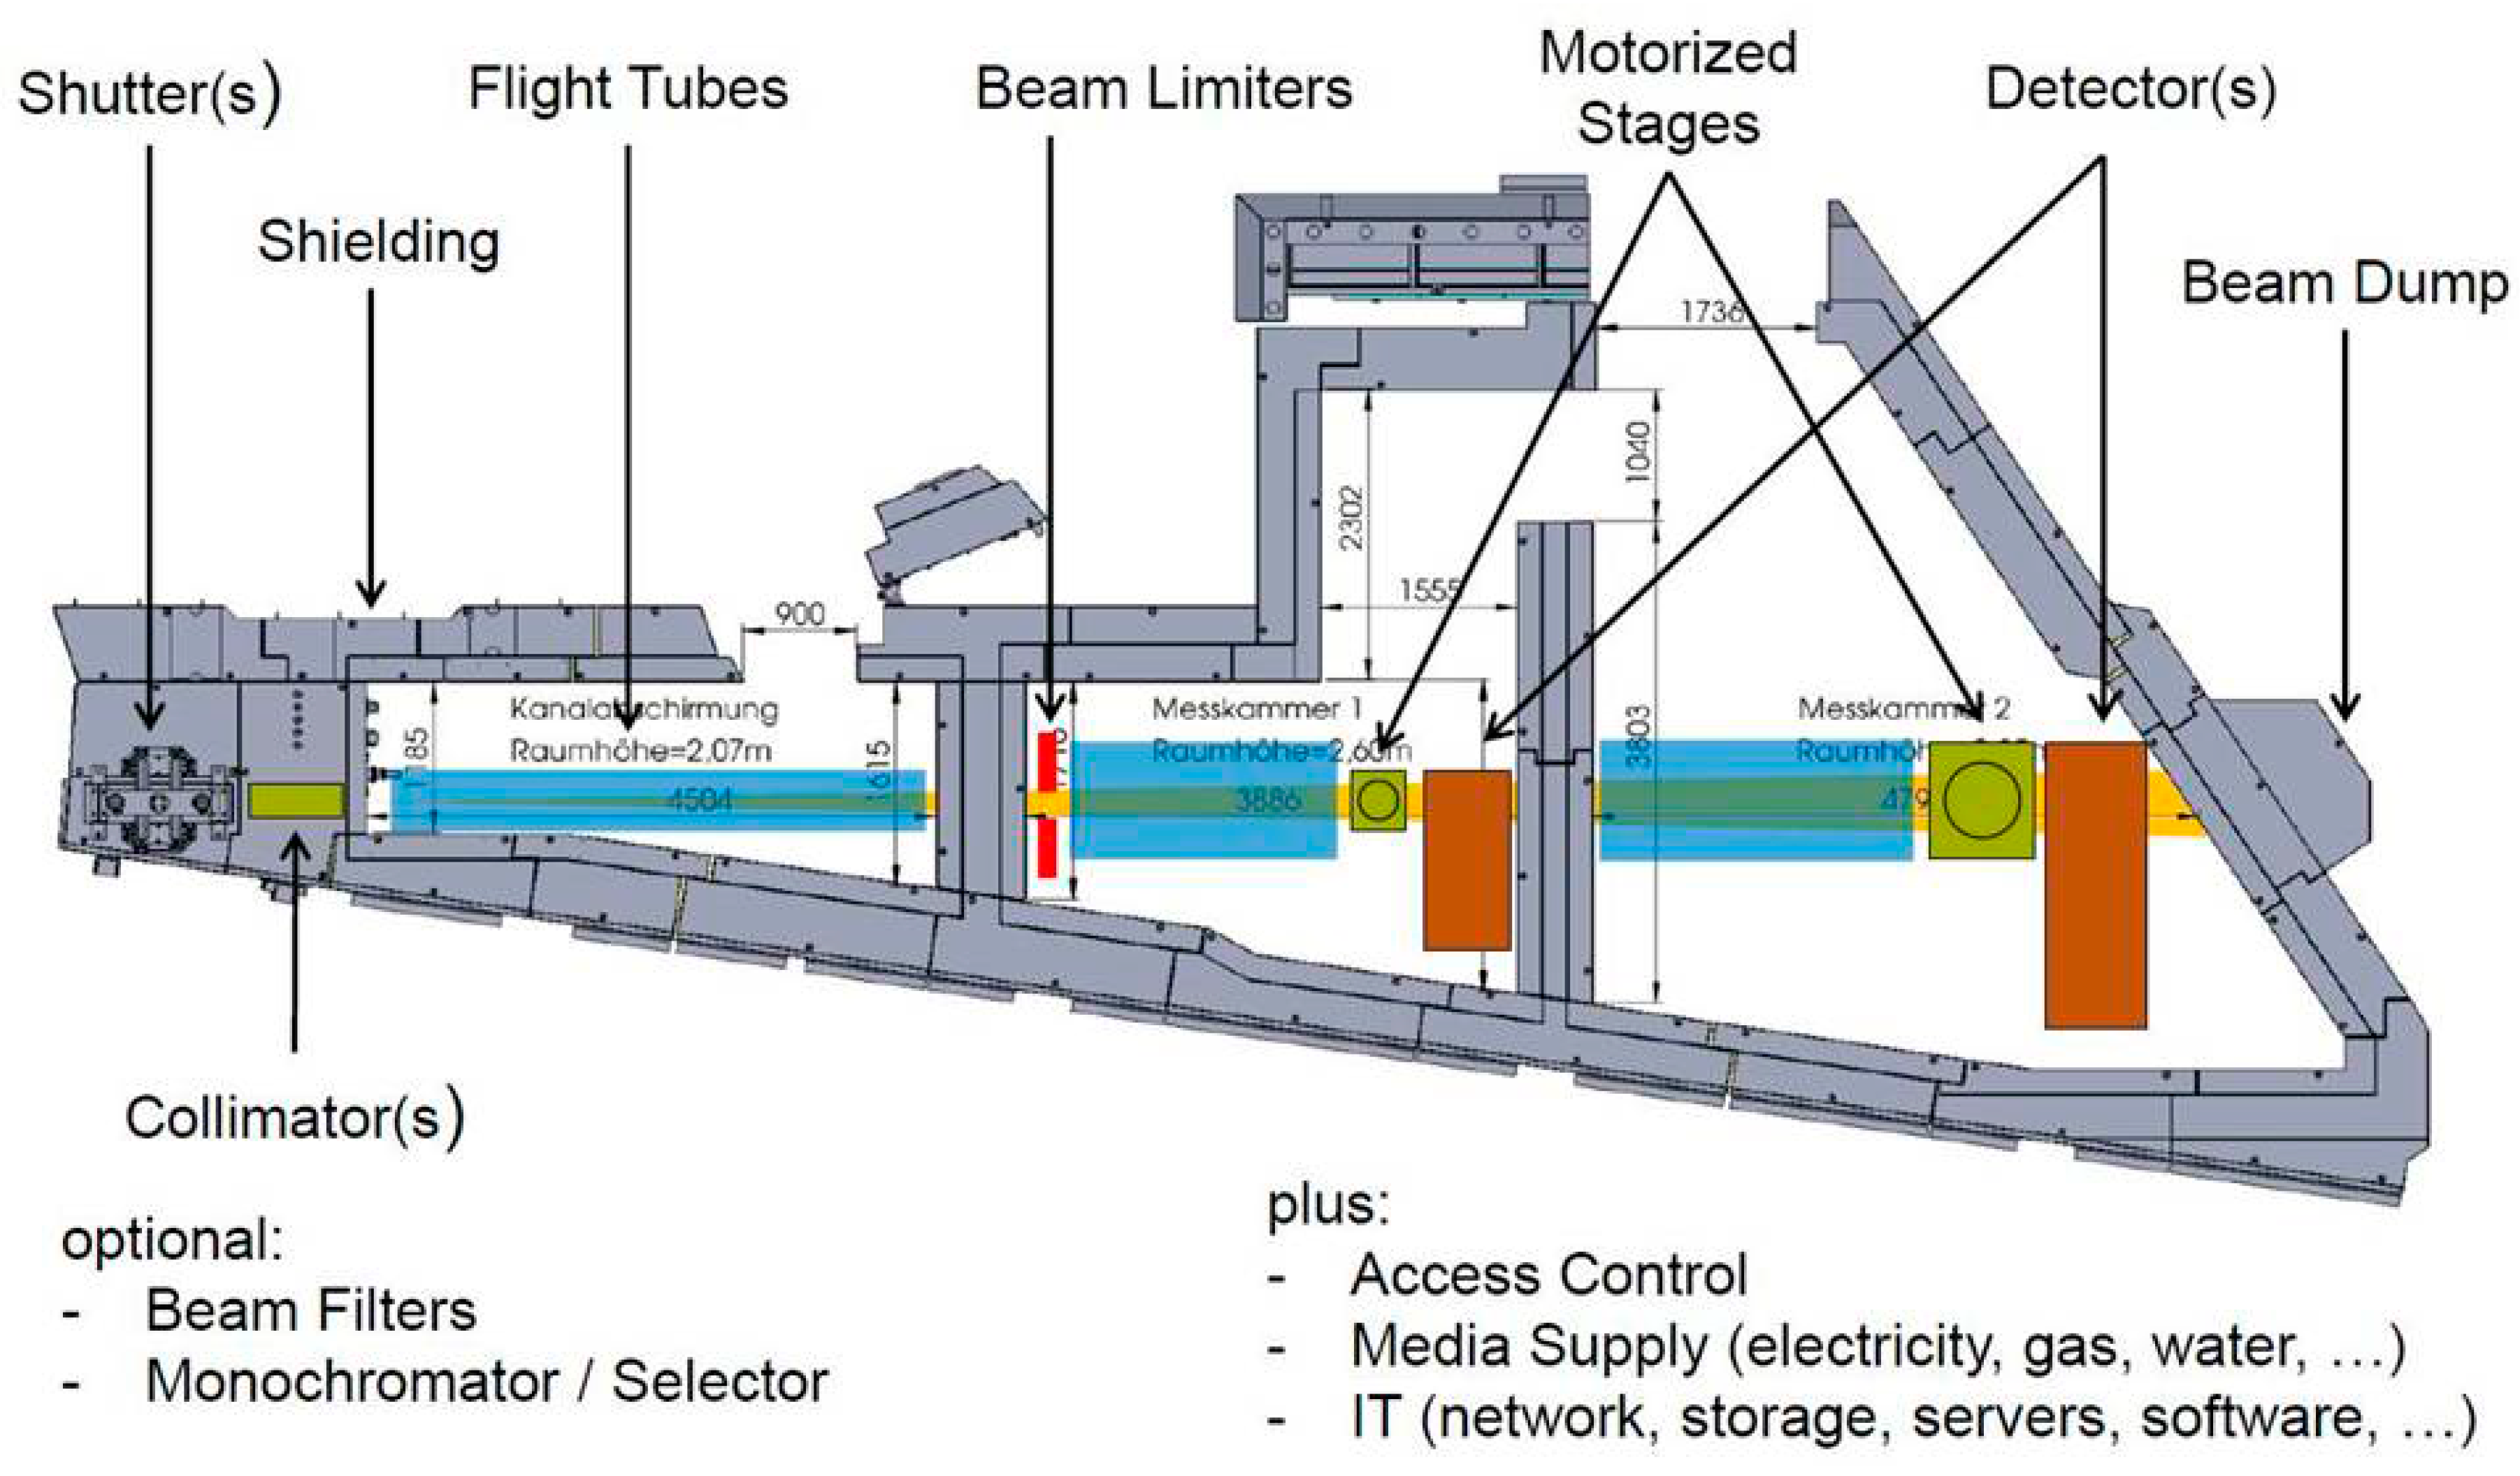
Abstract
:1. Introduction
2. The Neutron Imaging Facilities
2.1. The Antares Facility
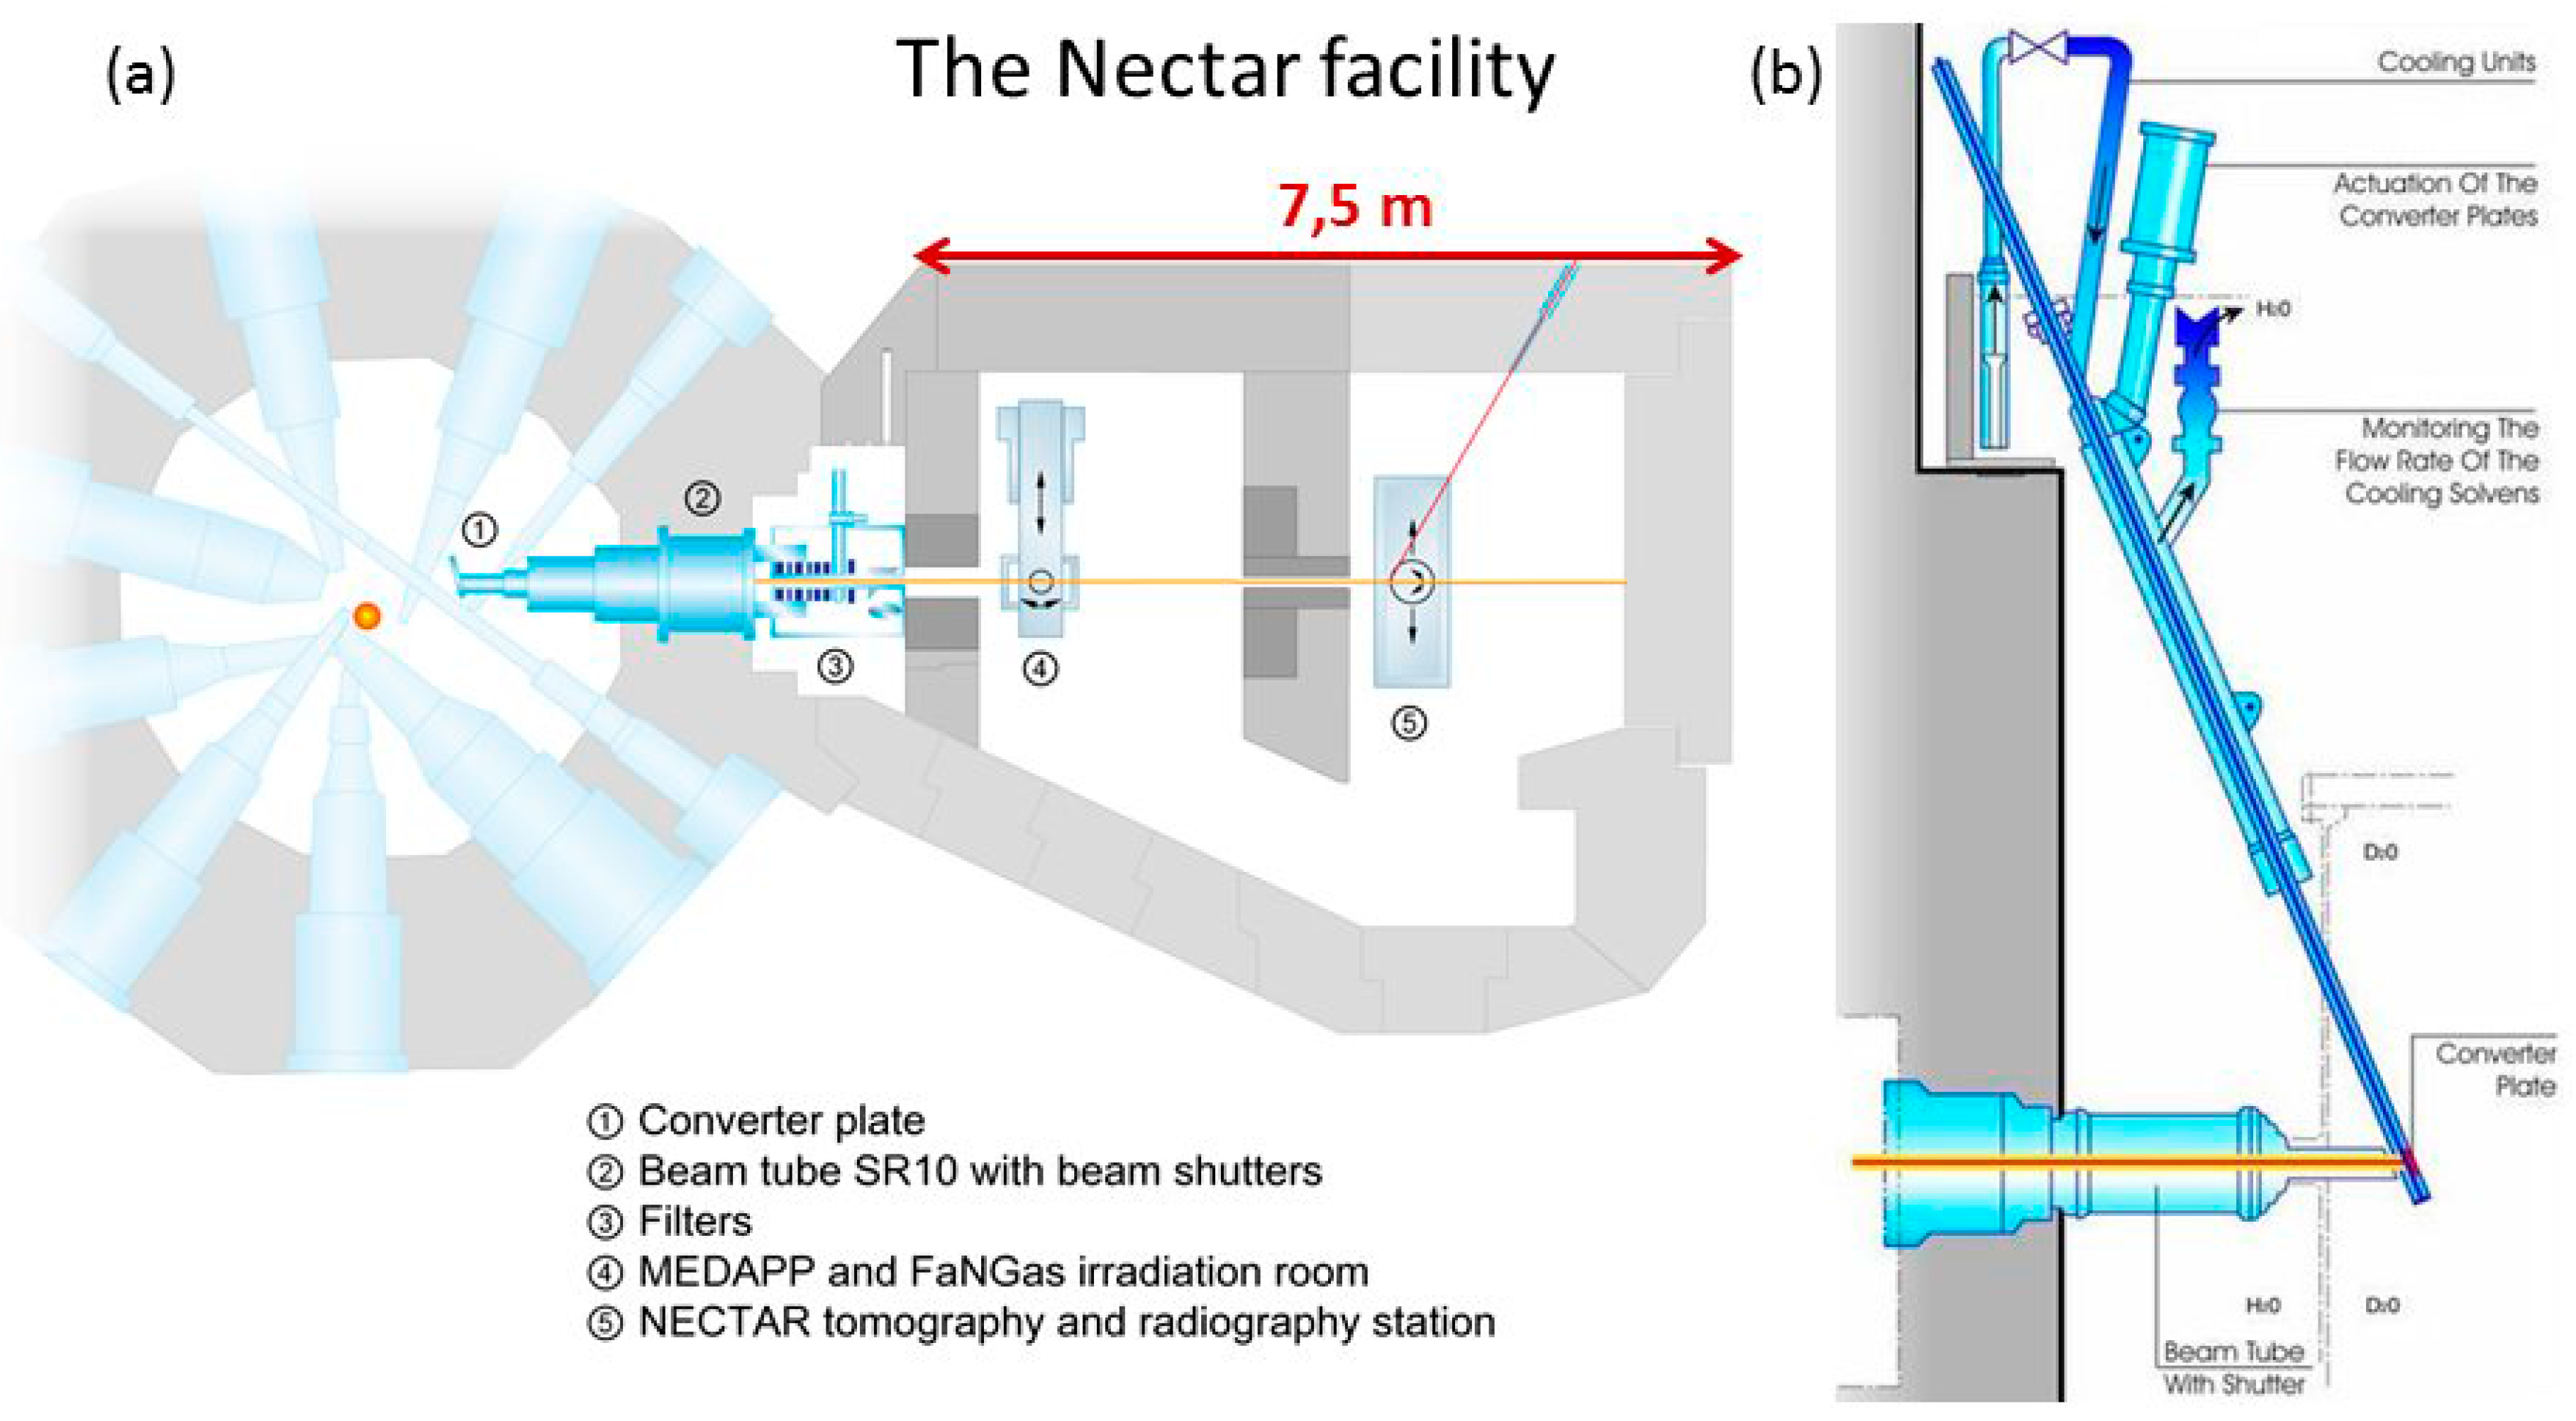
2.2. The Nectar Facility
3. Neutron Computed Tomography with Thermal and Cold Neutrons
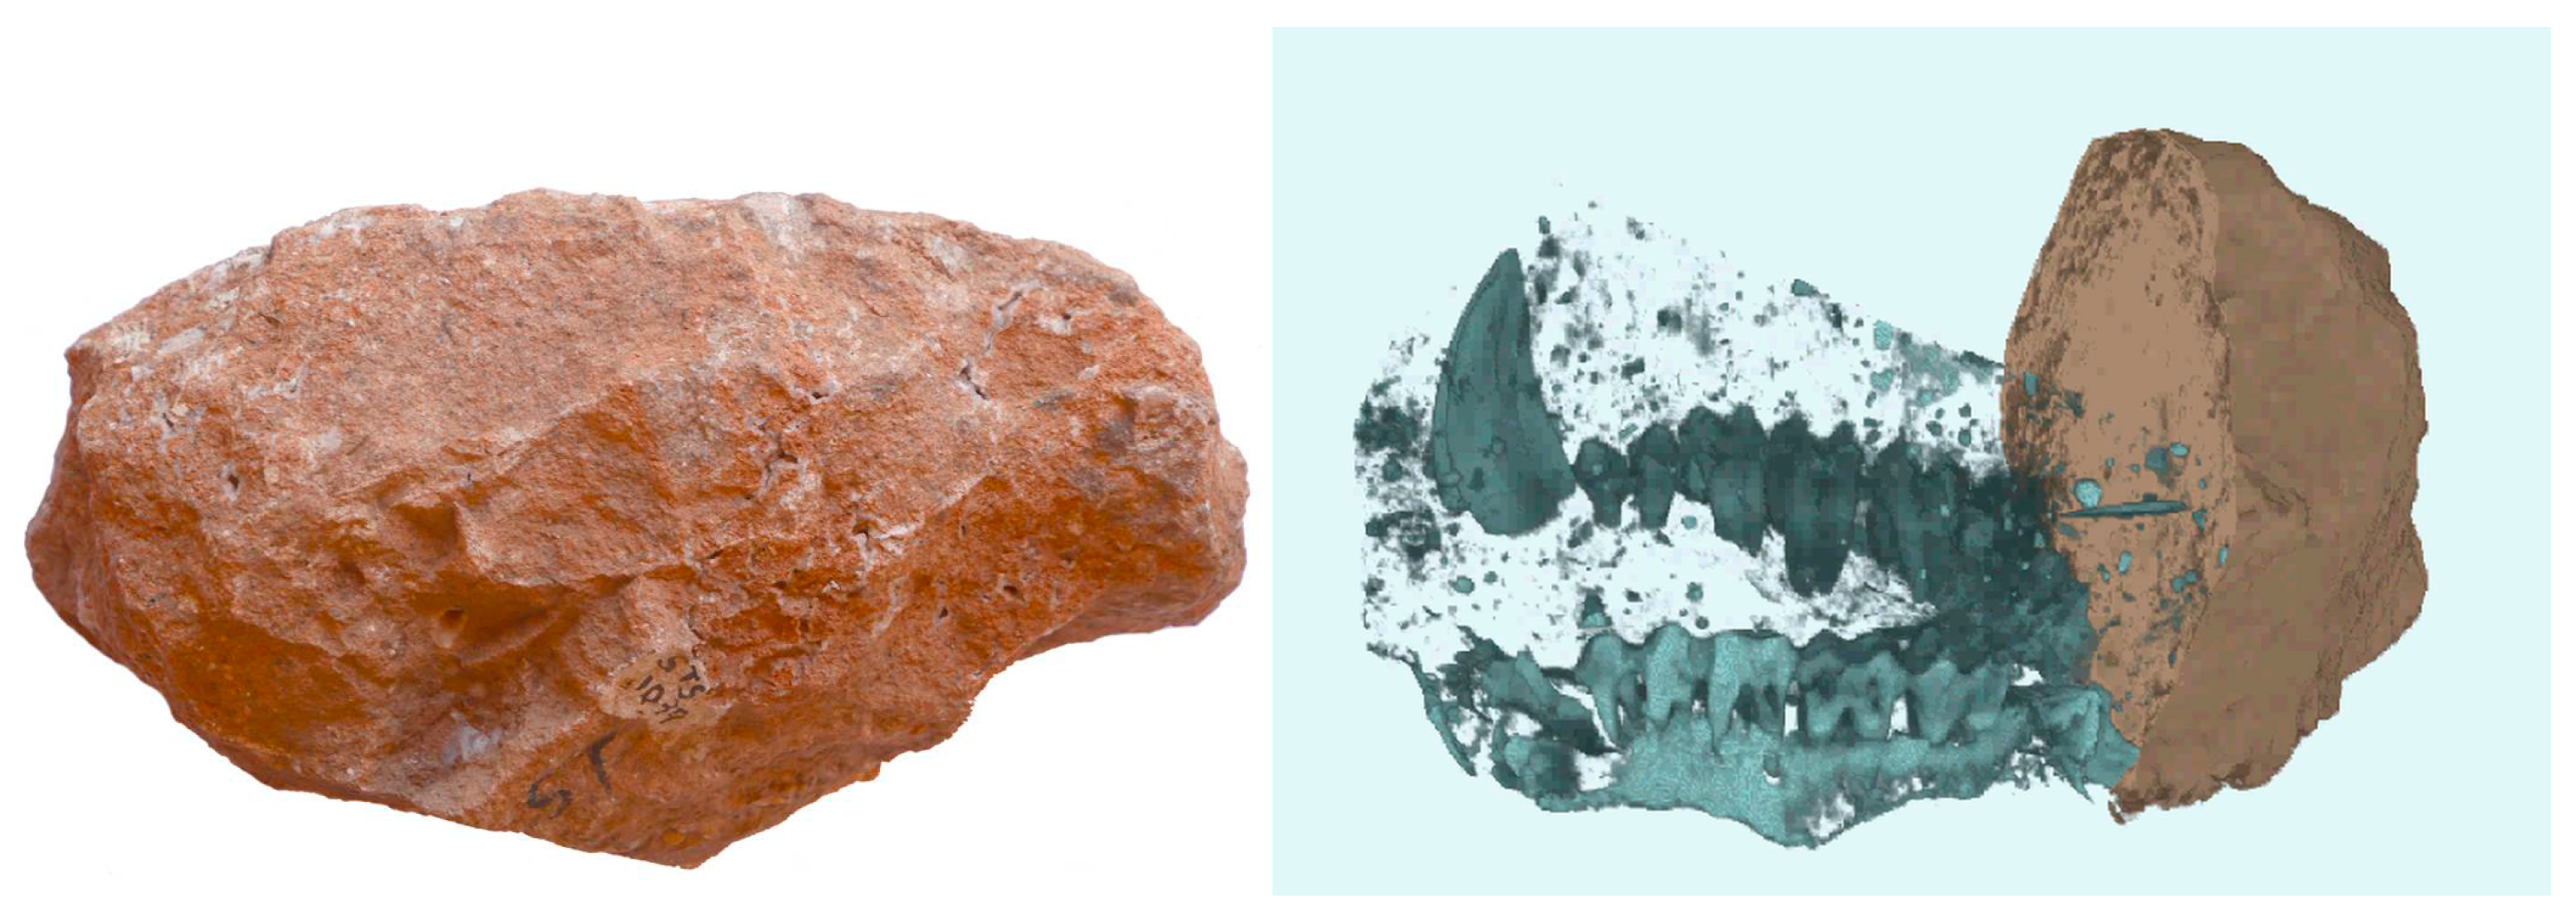
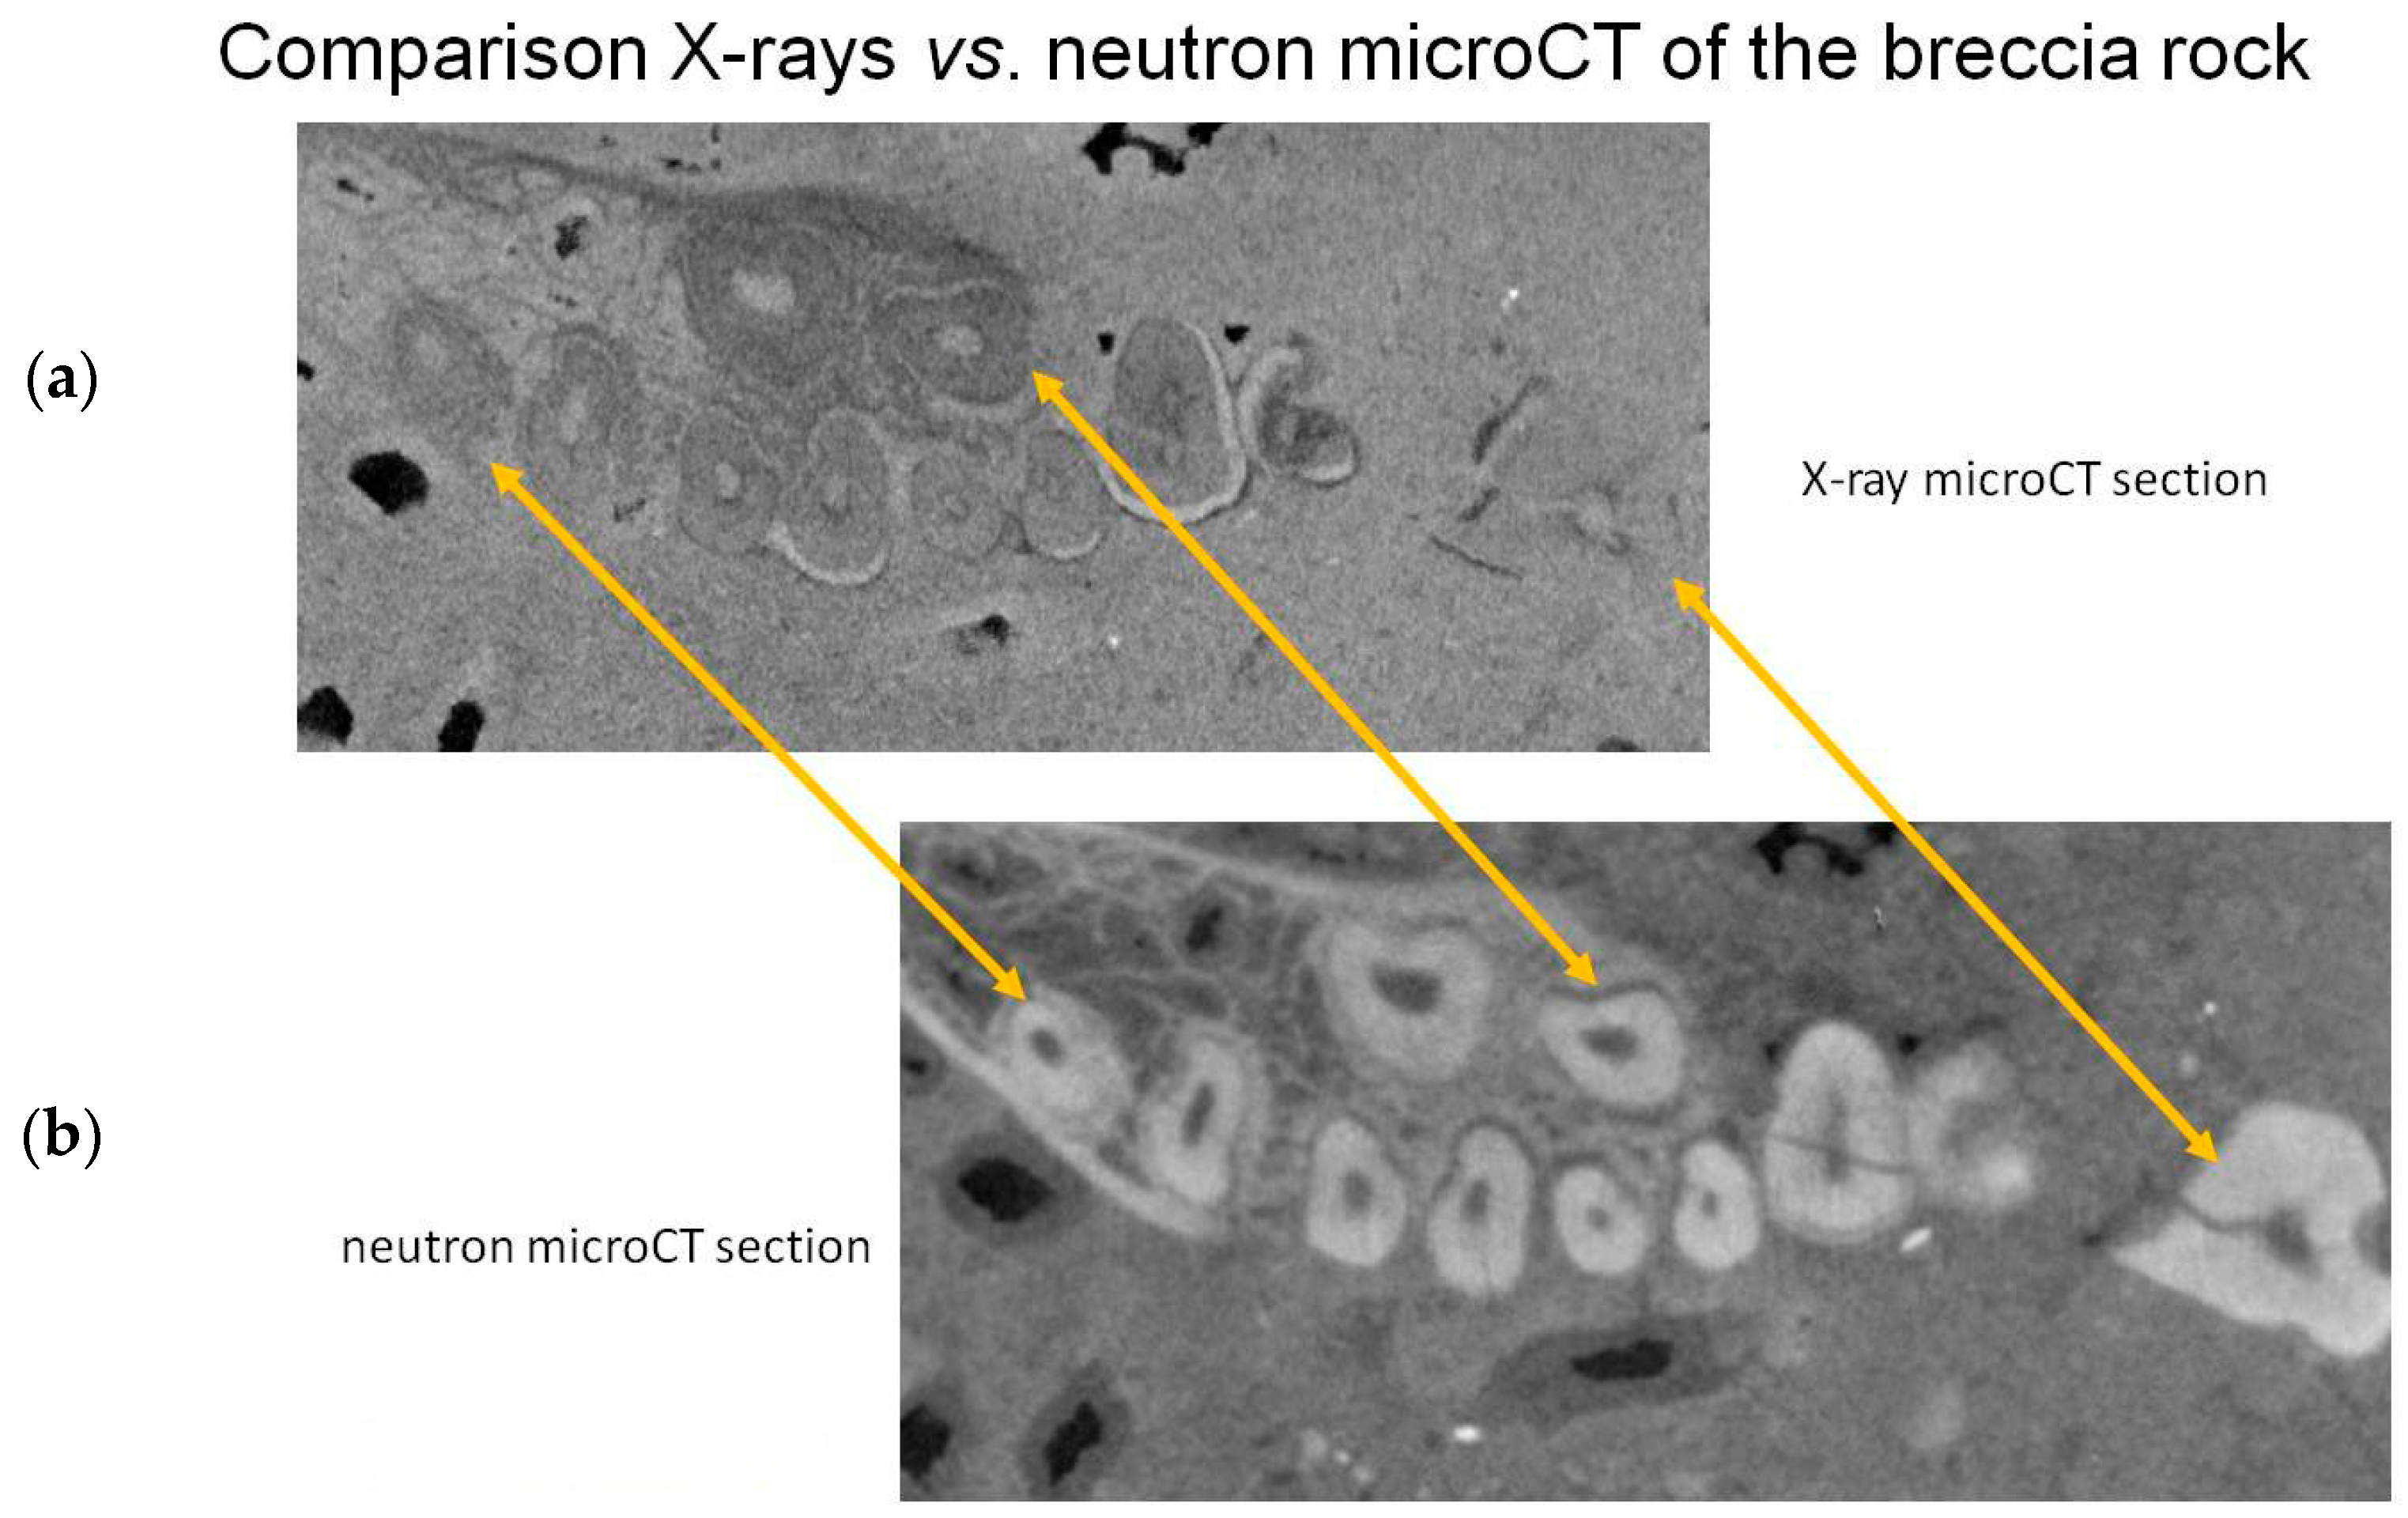
3.1. Fossils Embedded in Breccia Rock
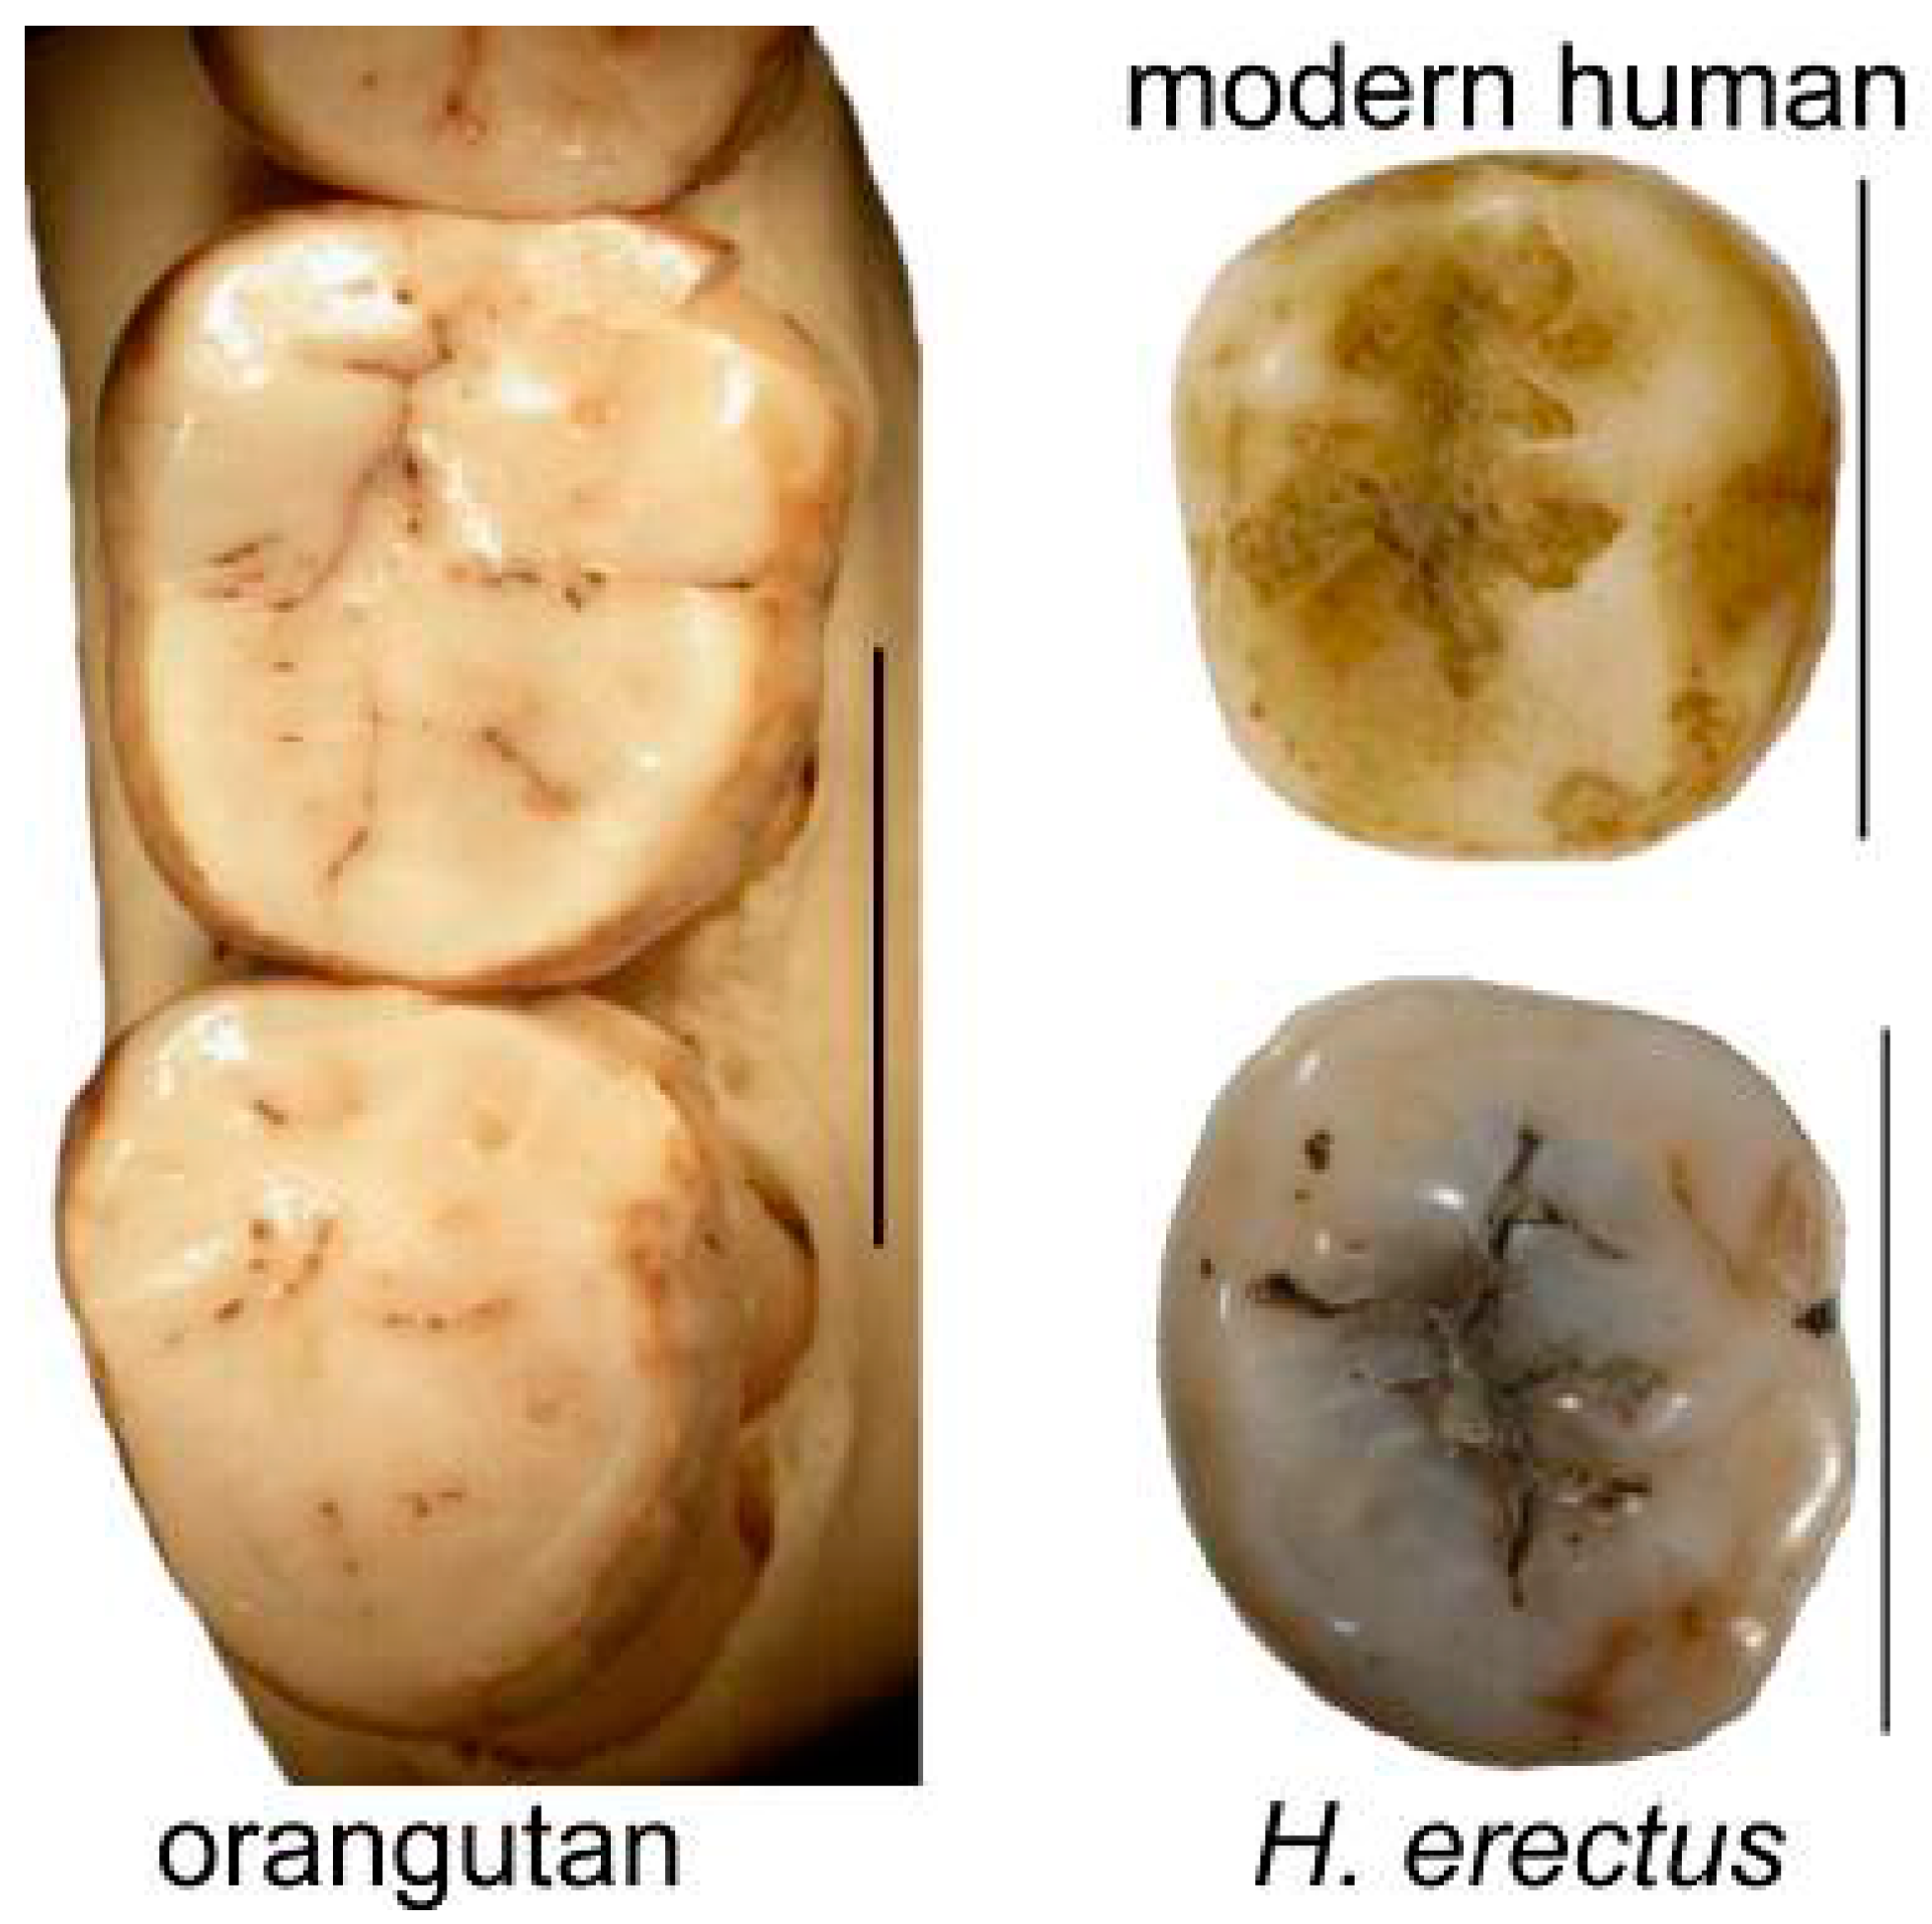
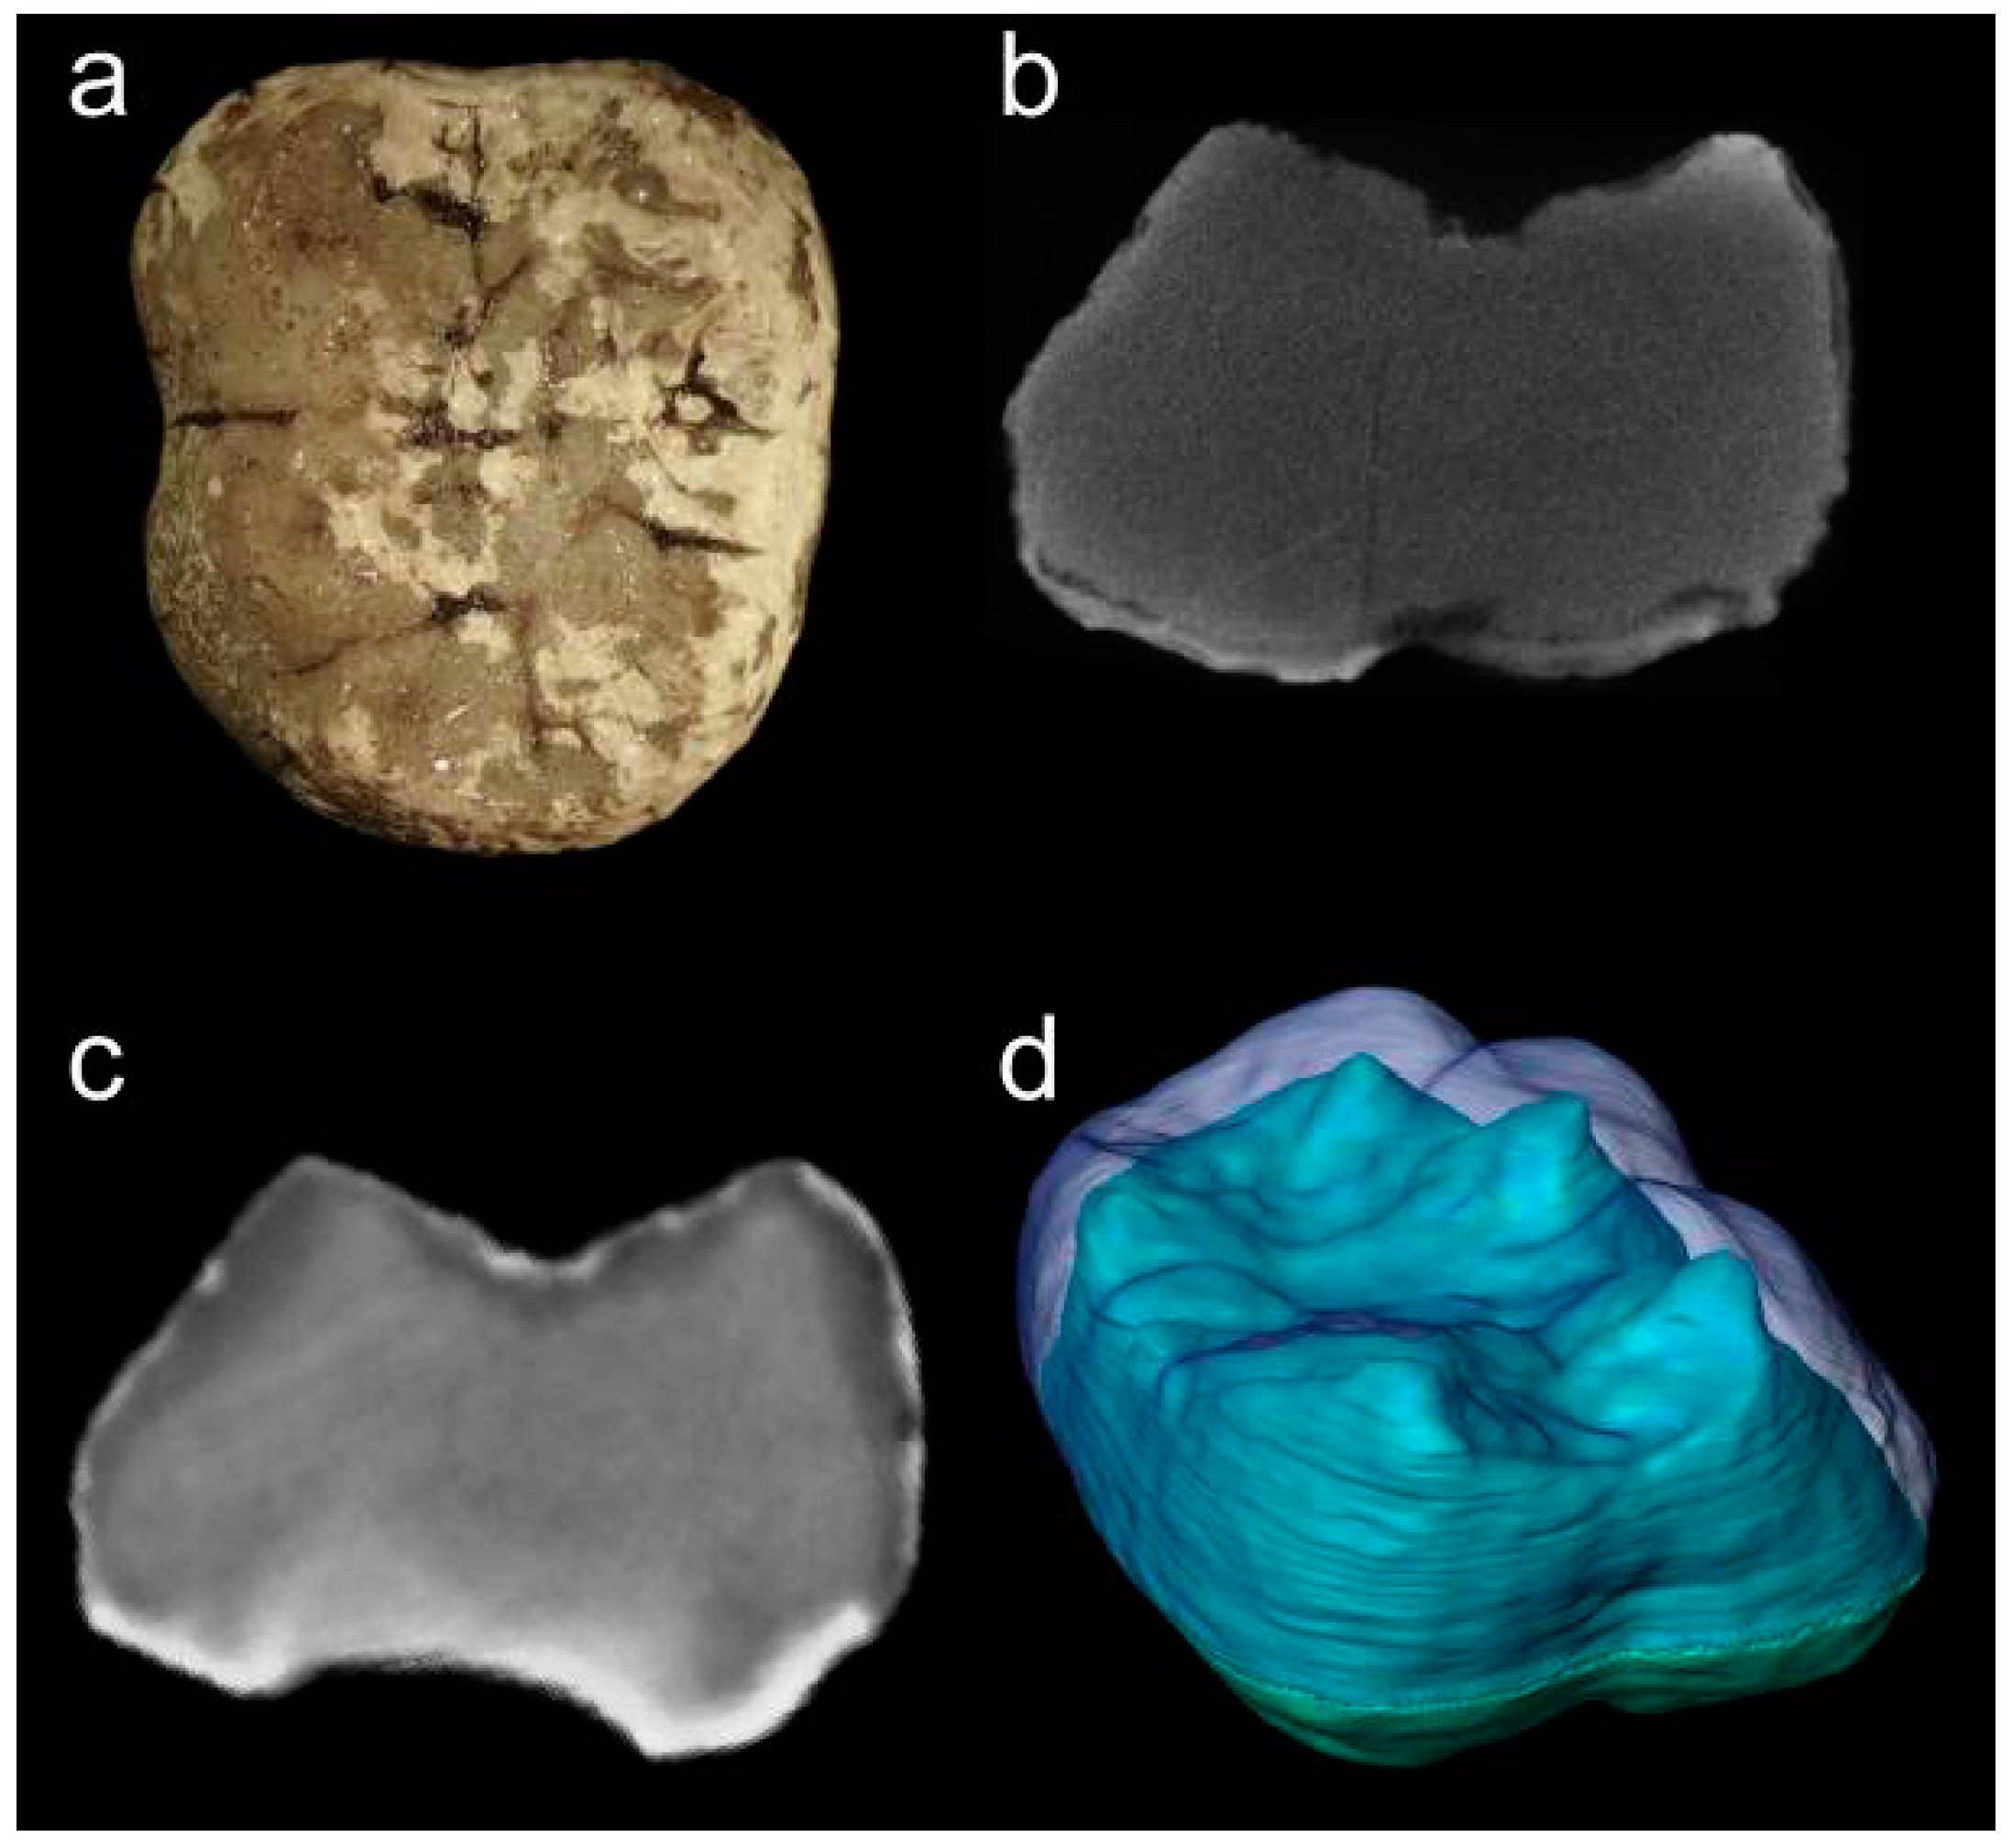
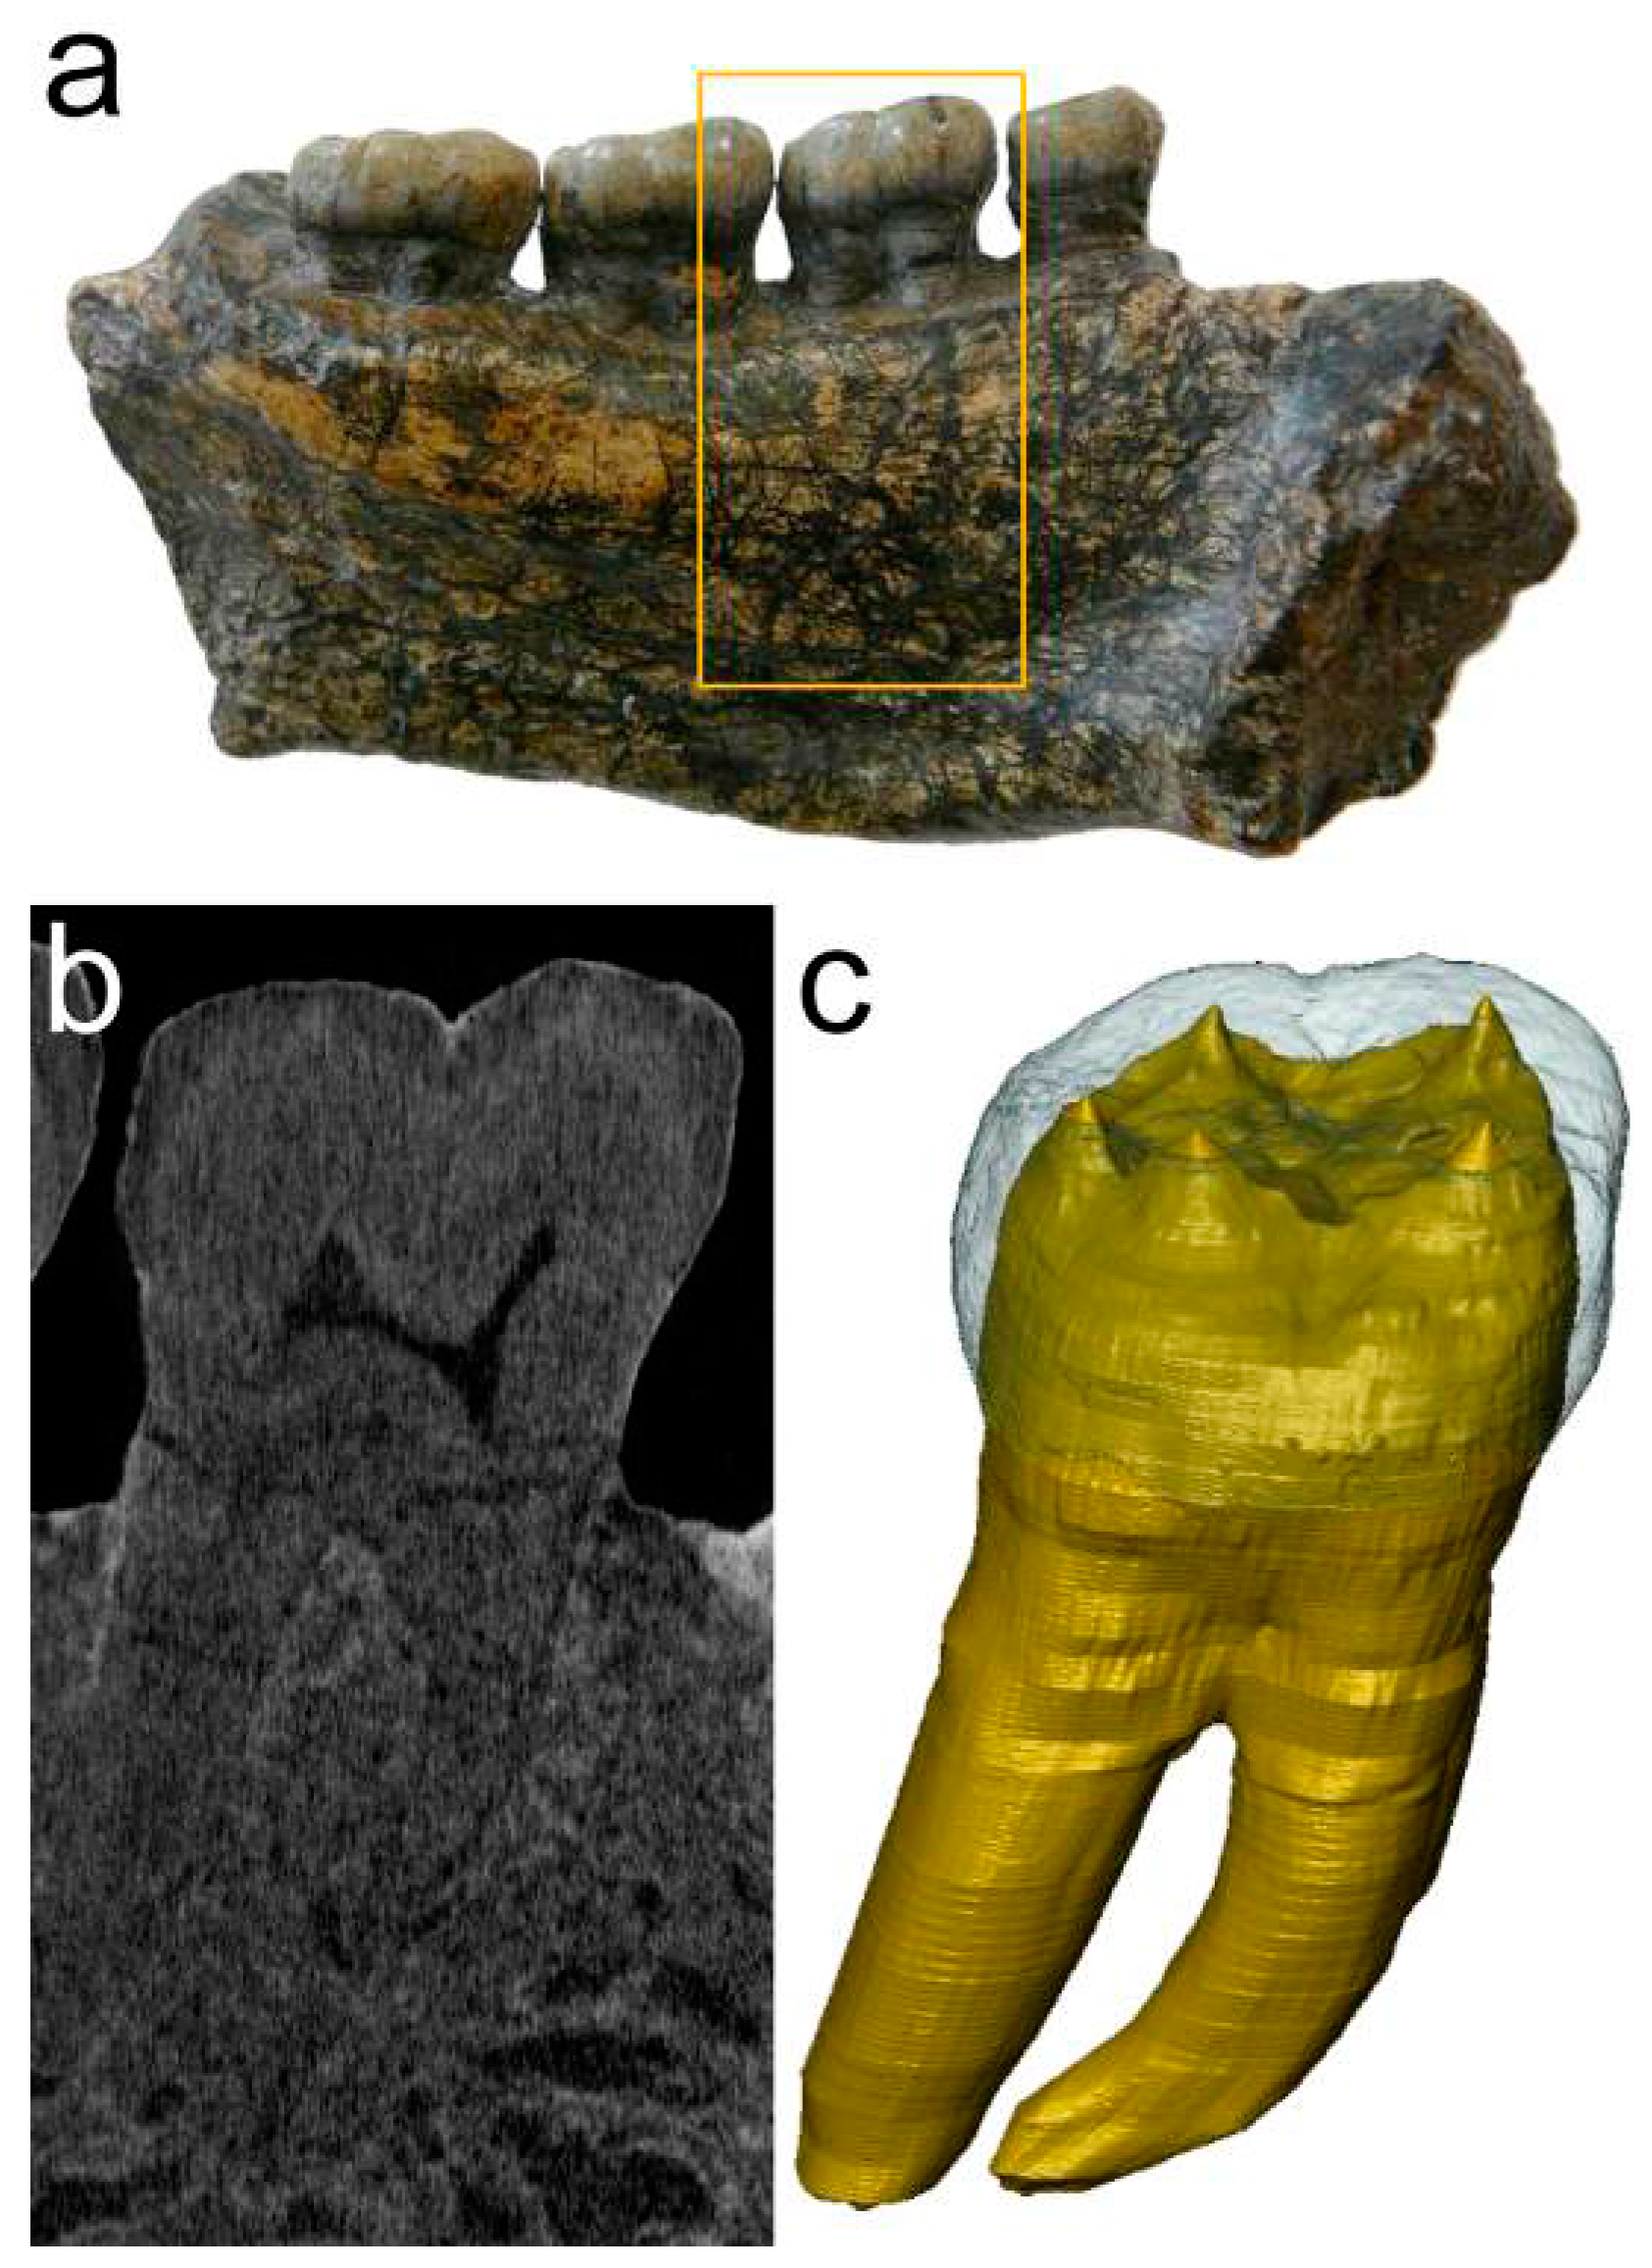
3.2. Fossilized Teeth—Human or Ape?
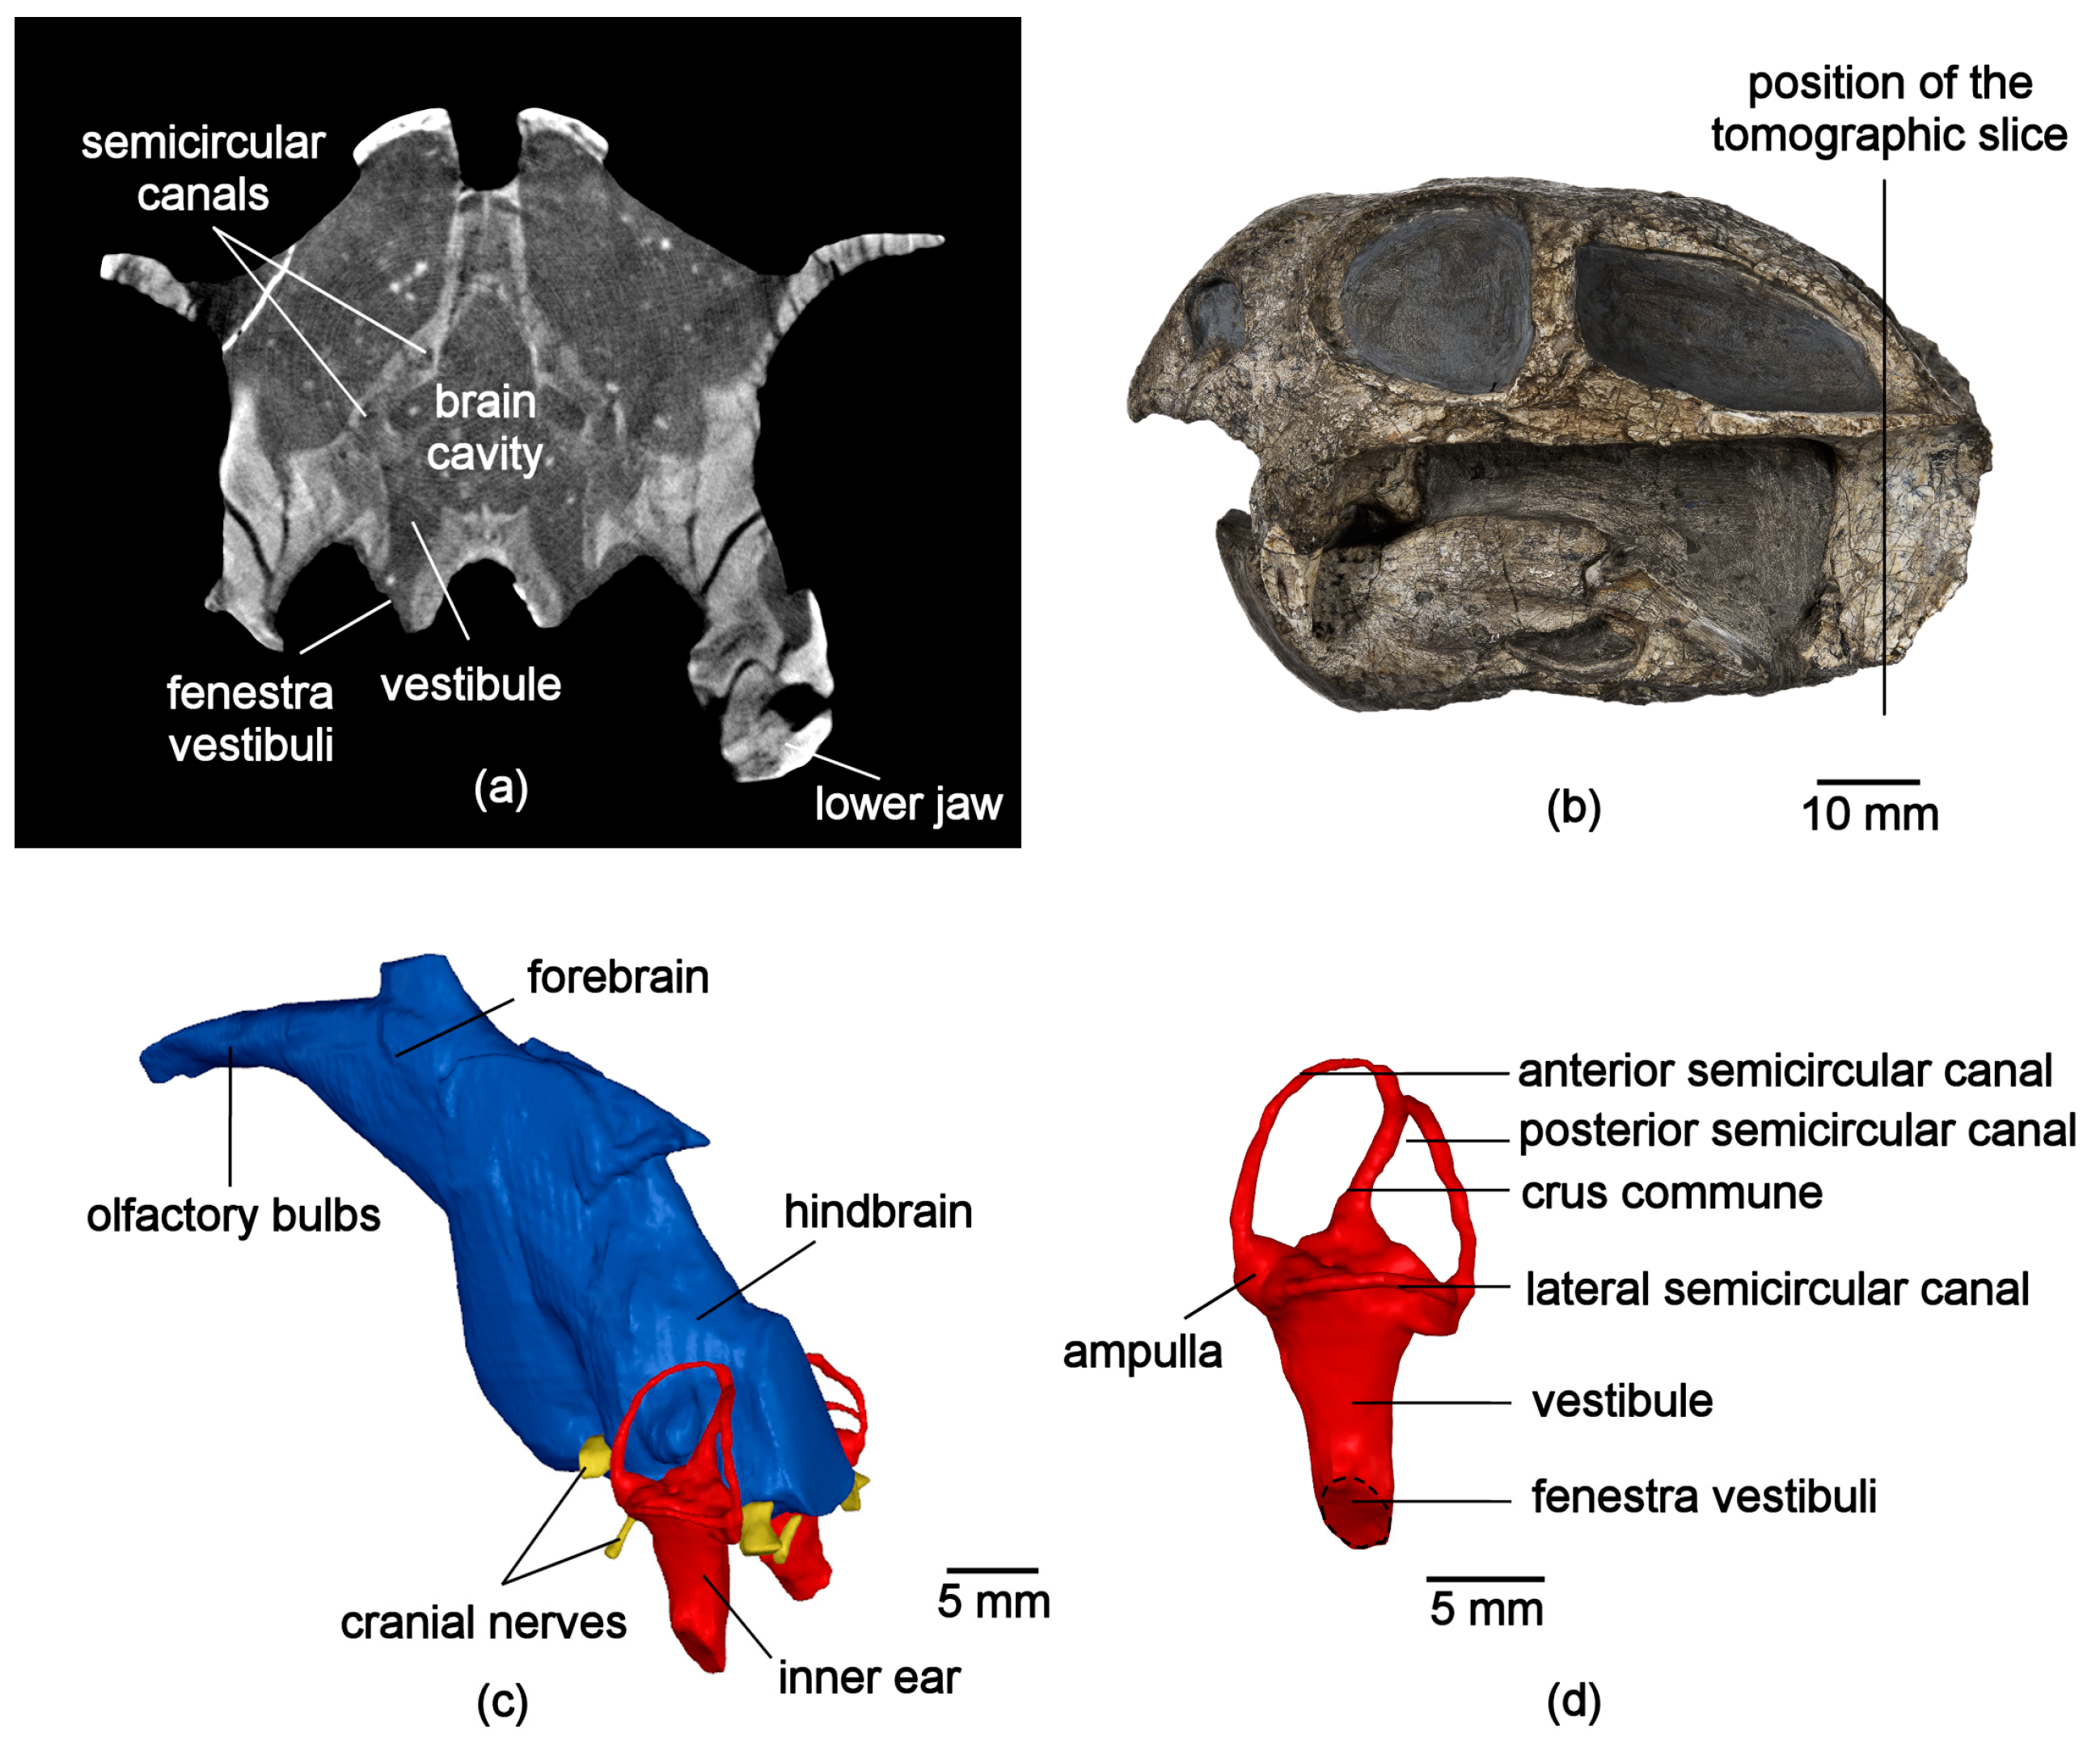
3.3. Hearing Capabilities of the Mammalian “Forerunners” Therapsida
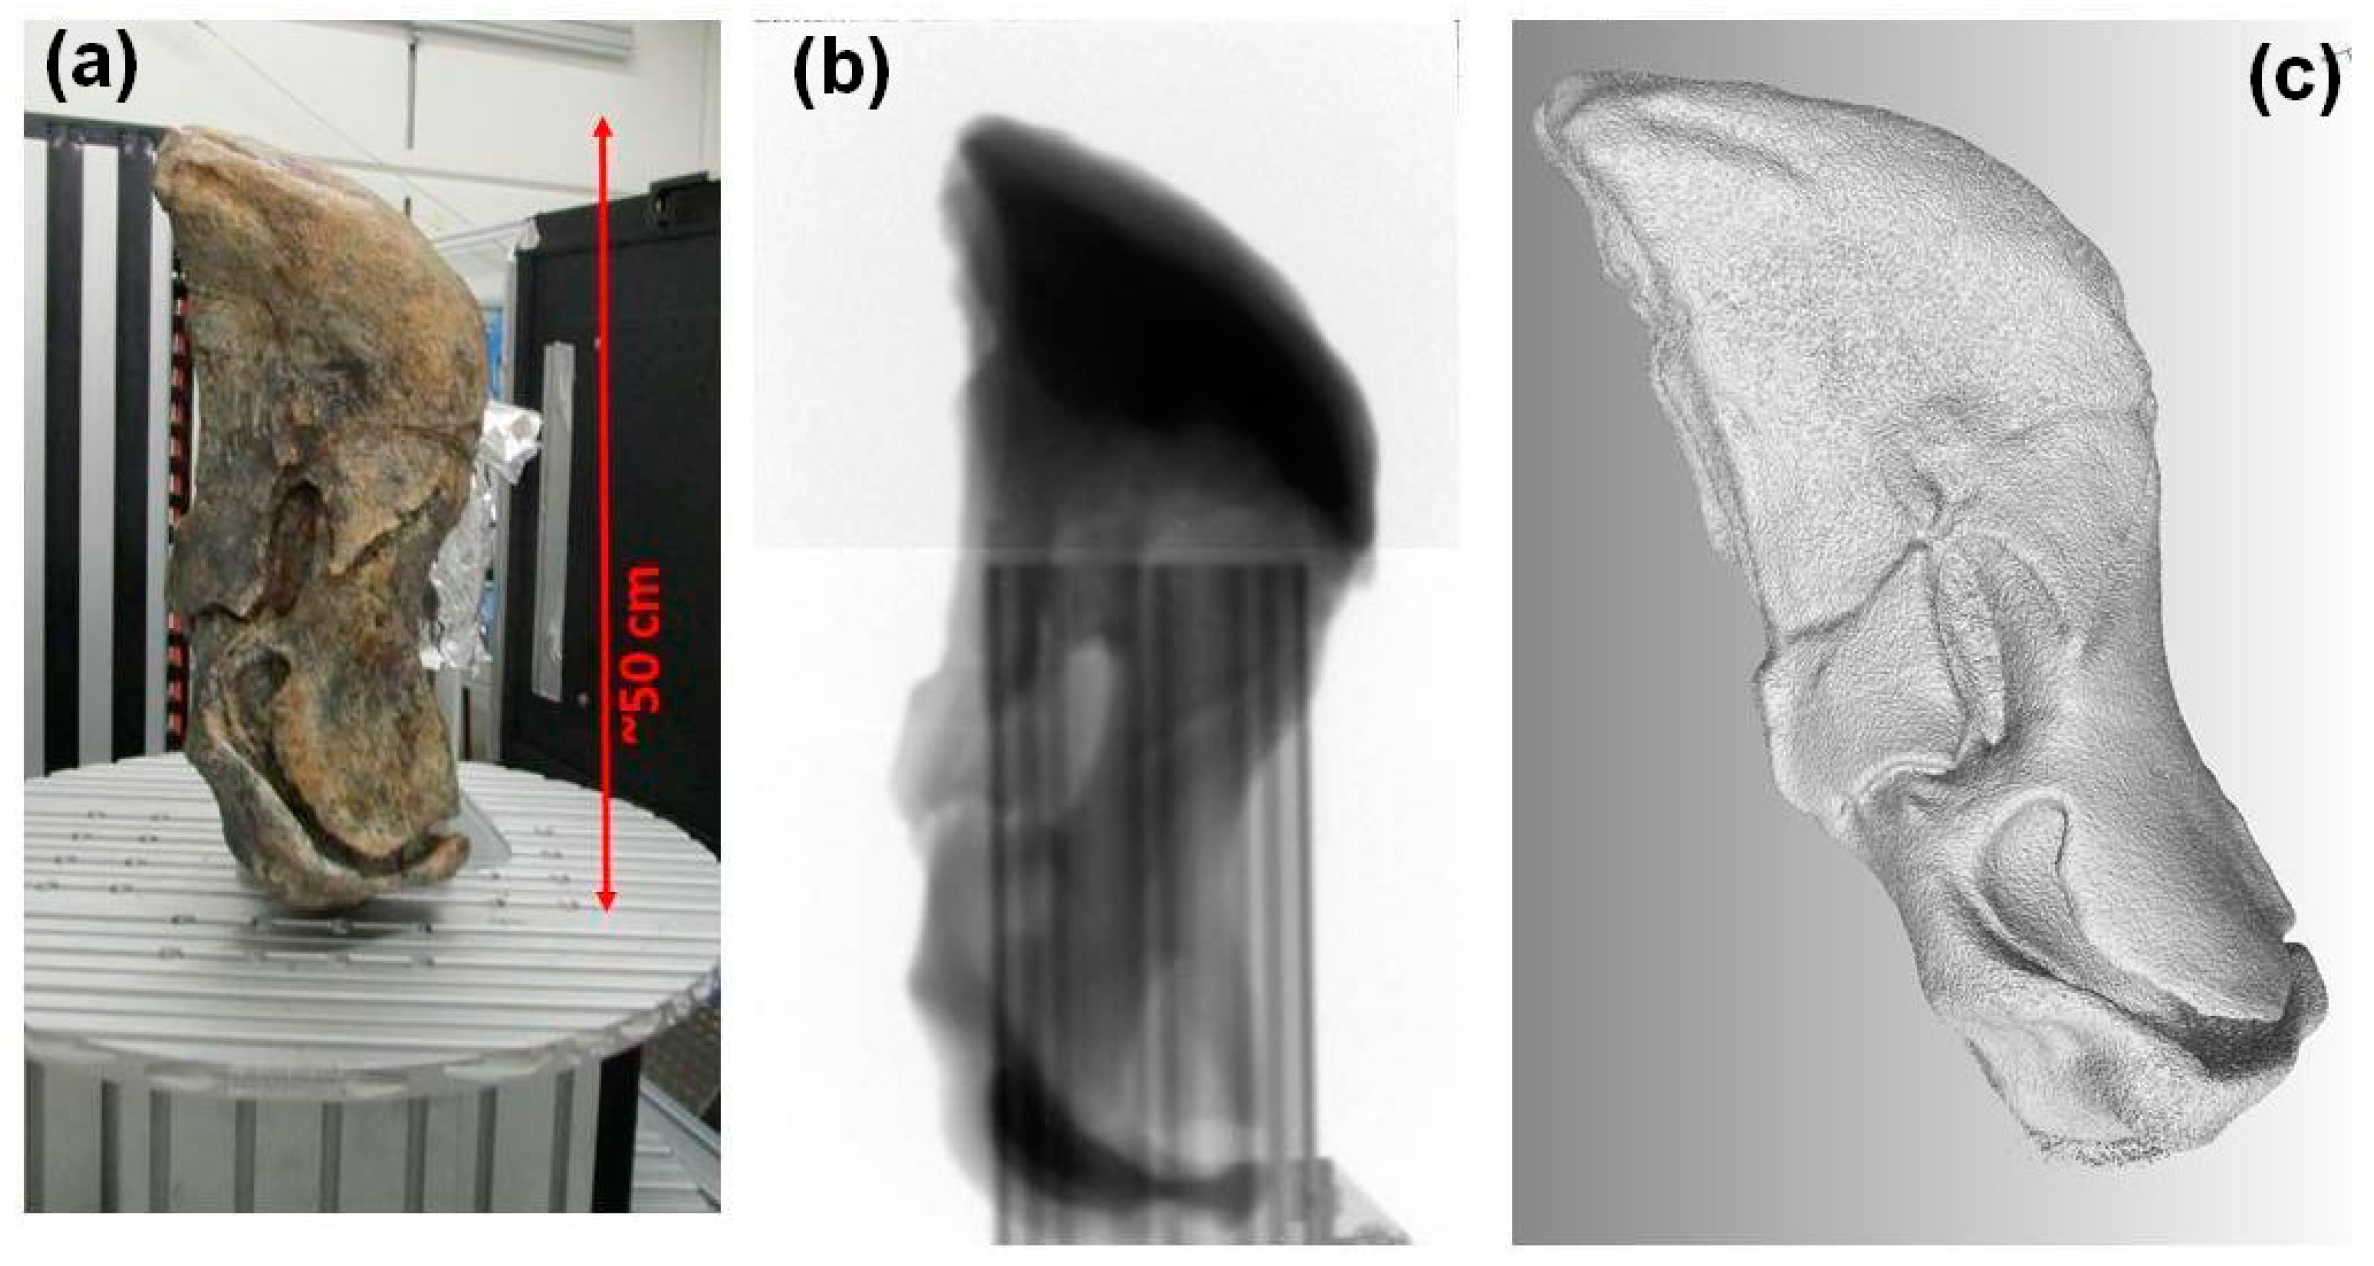
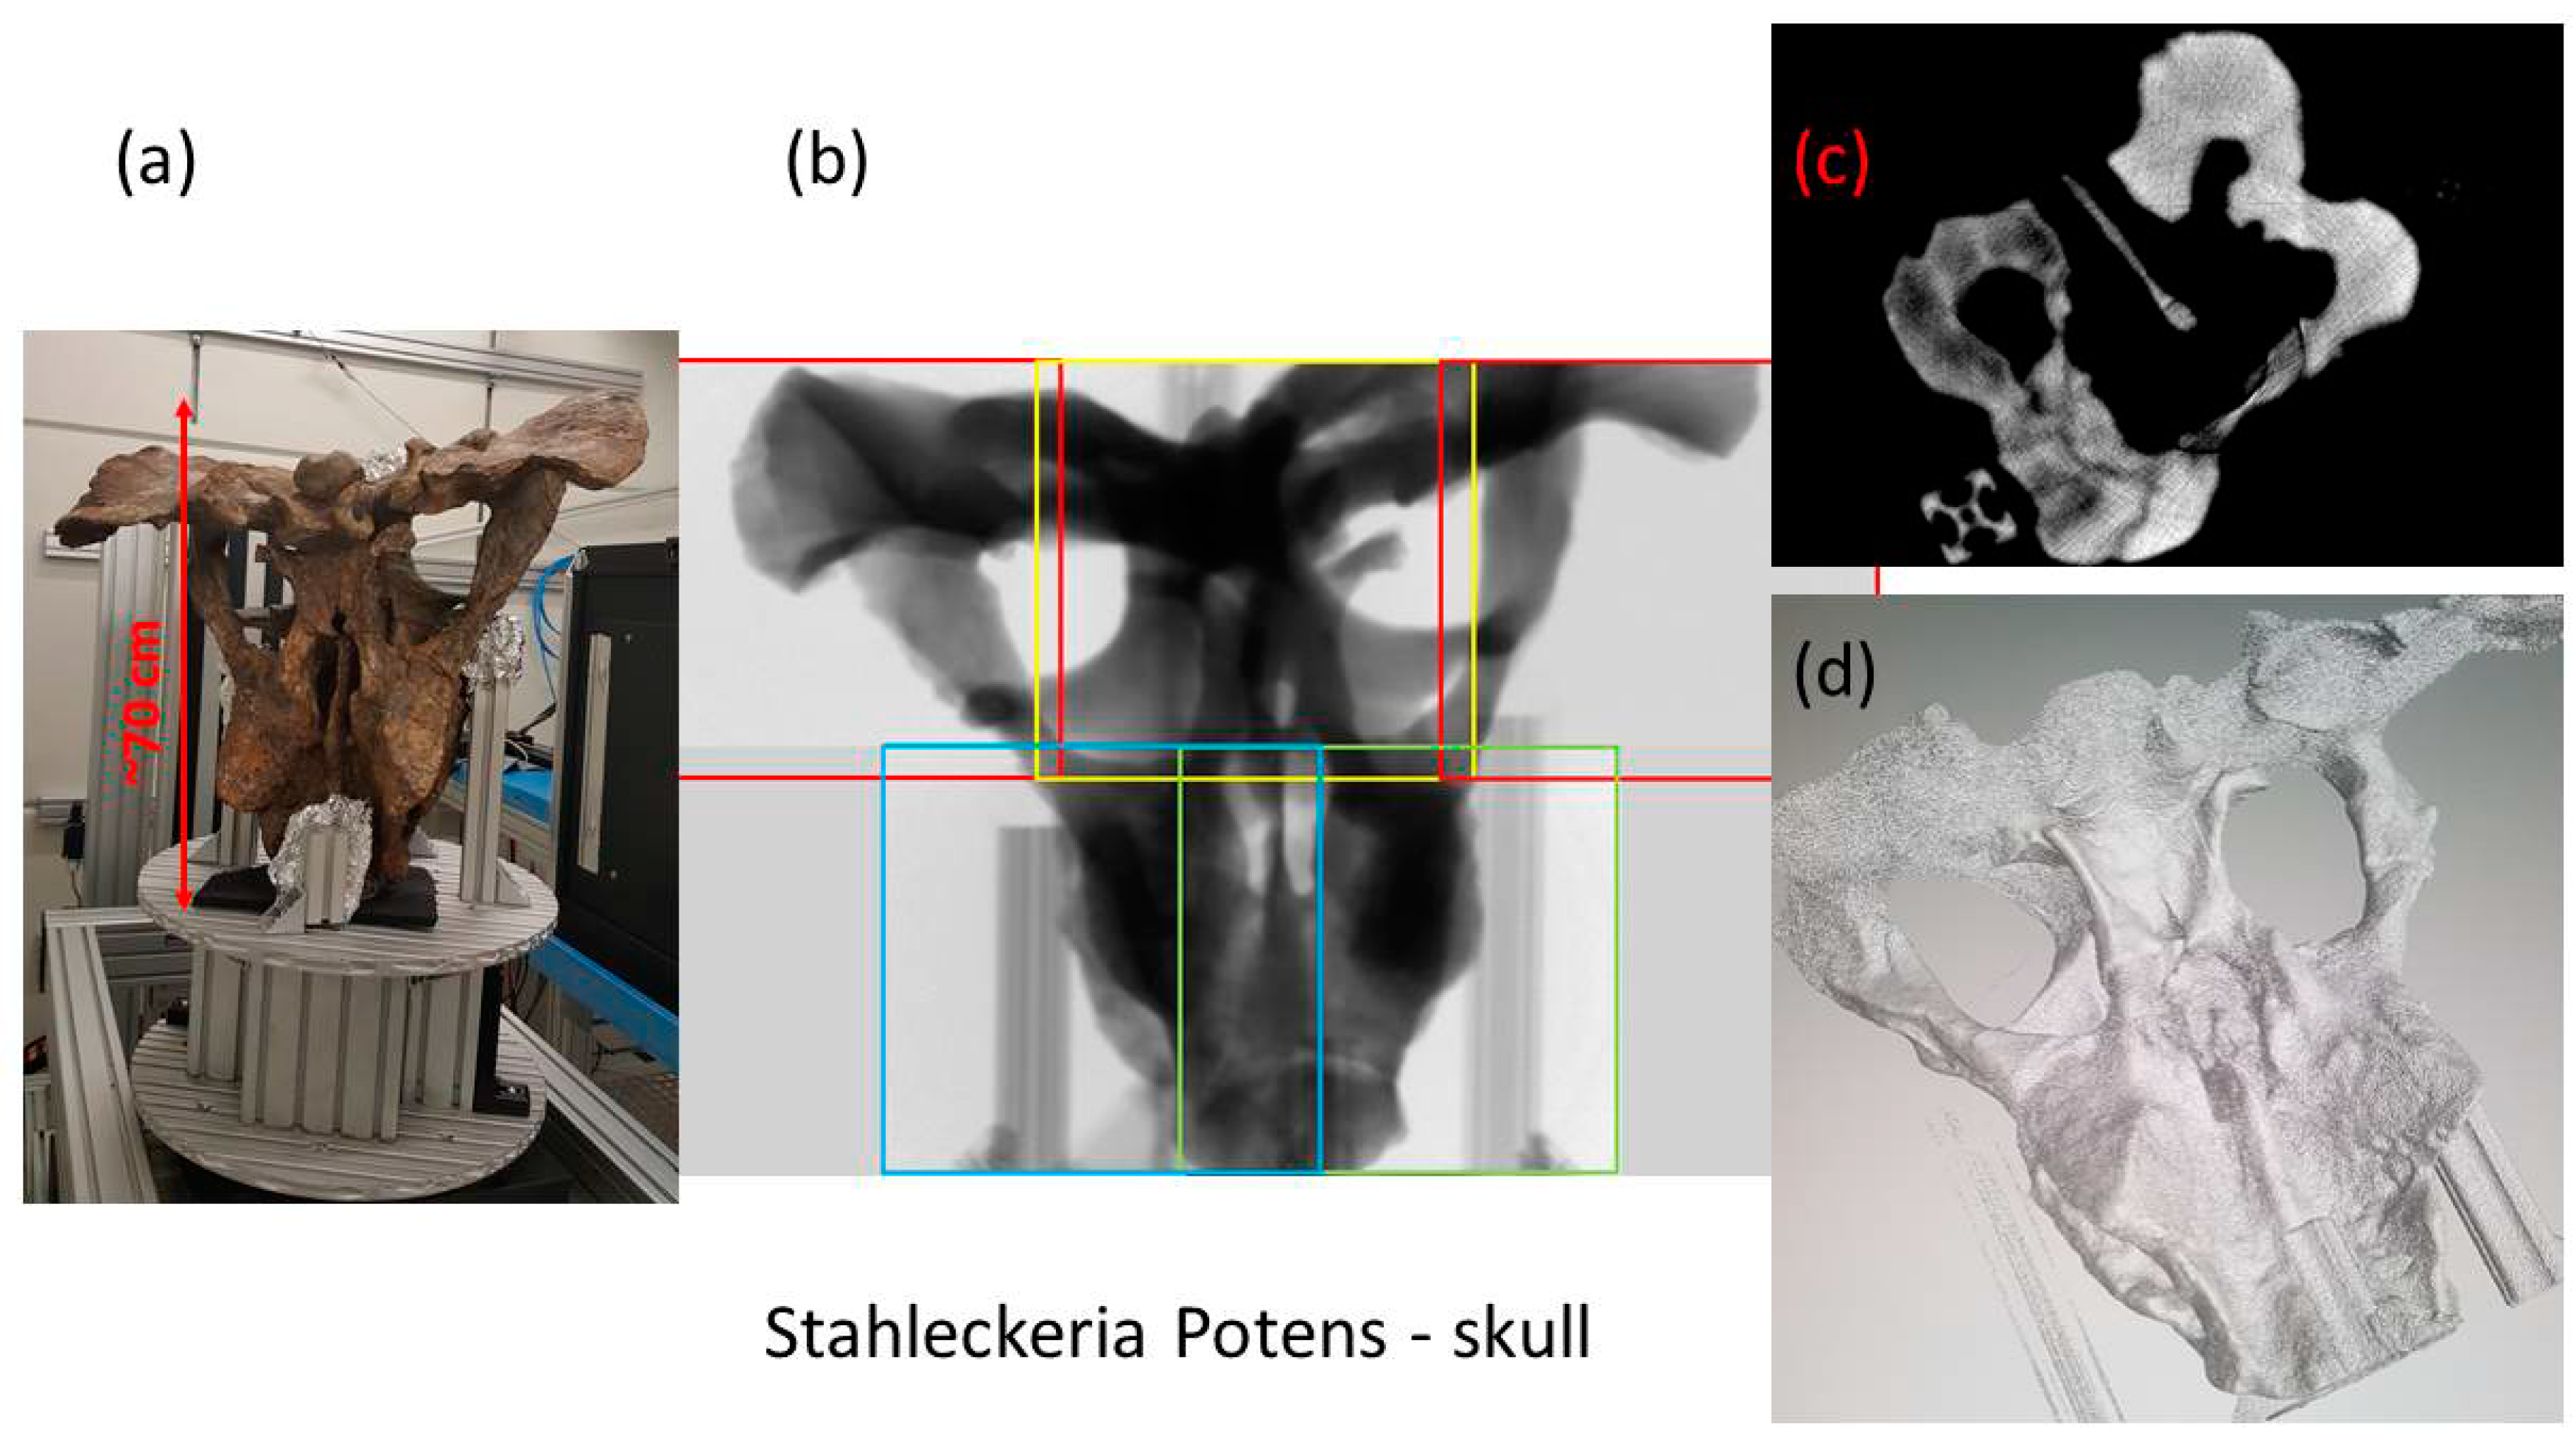
4. Neutron Computed Tomography with Fast Neutrons
Huge Fossils Examined at NECTAR
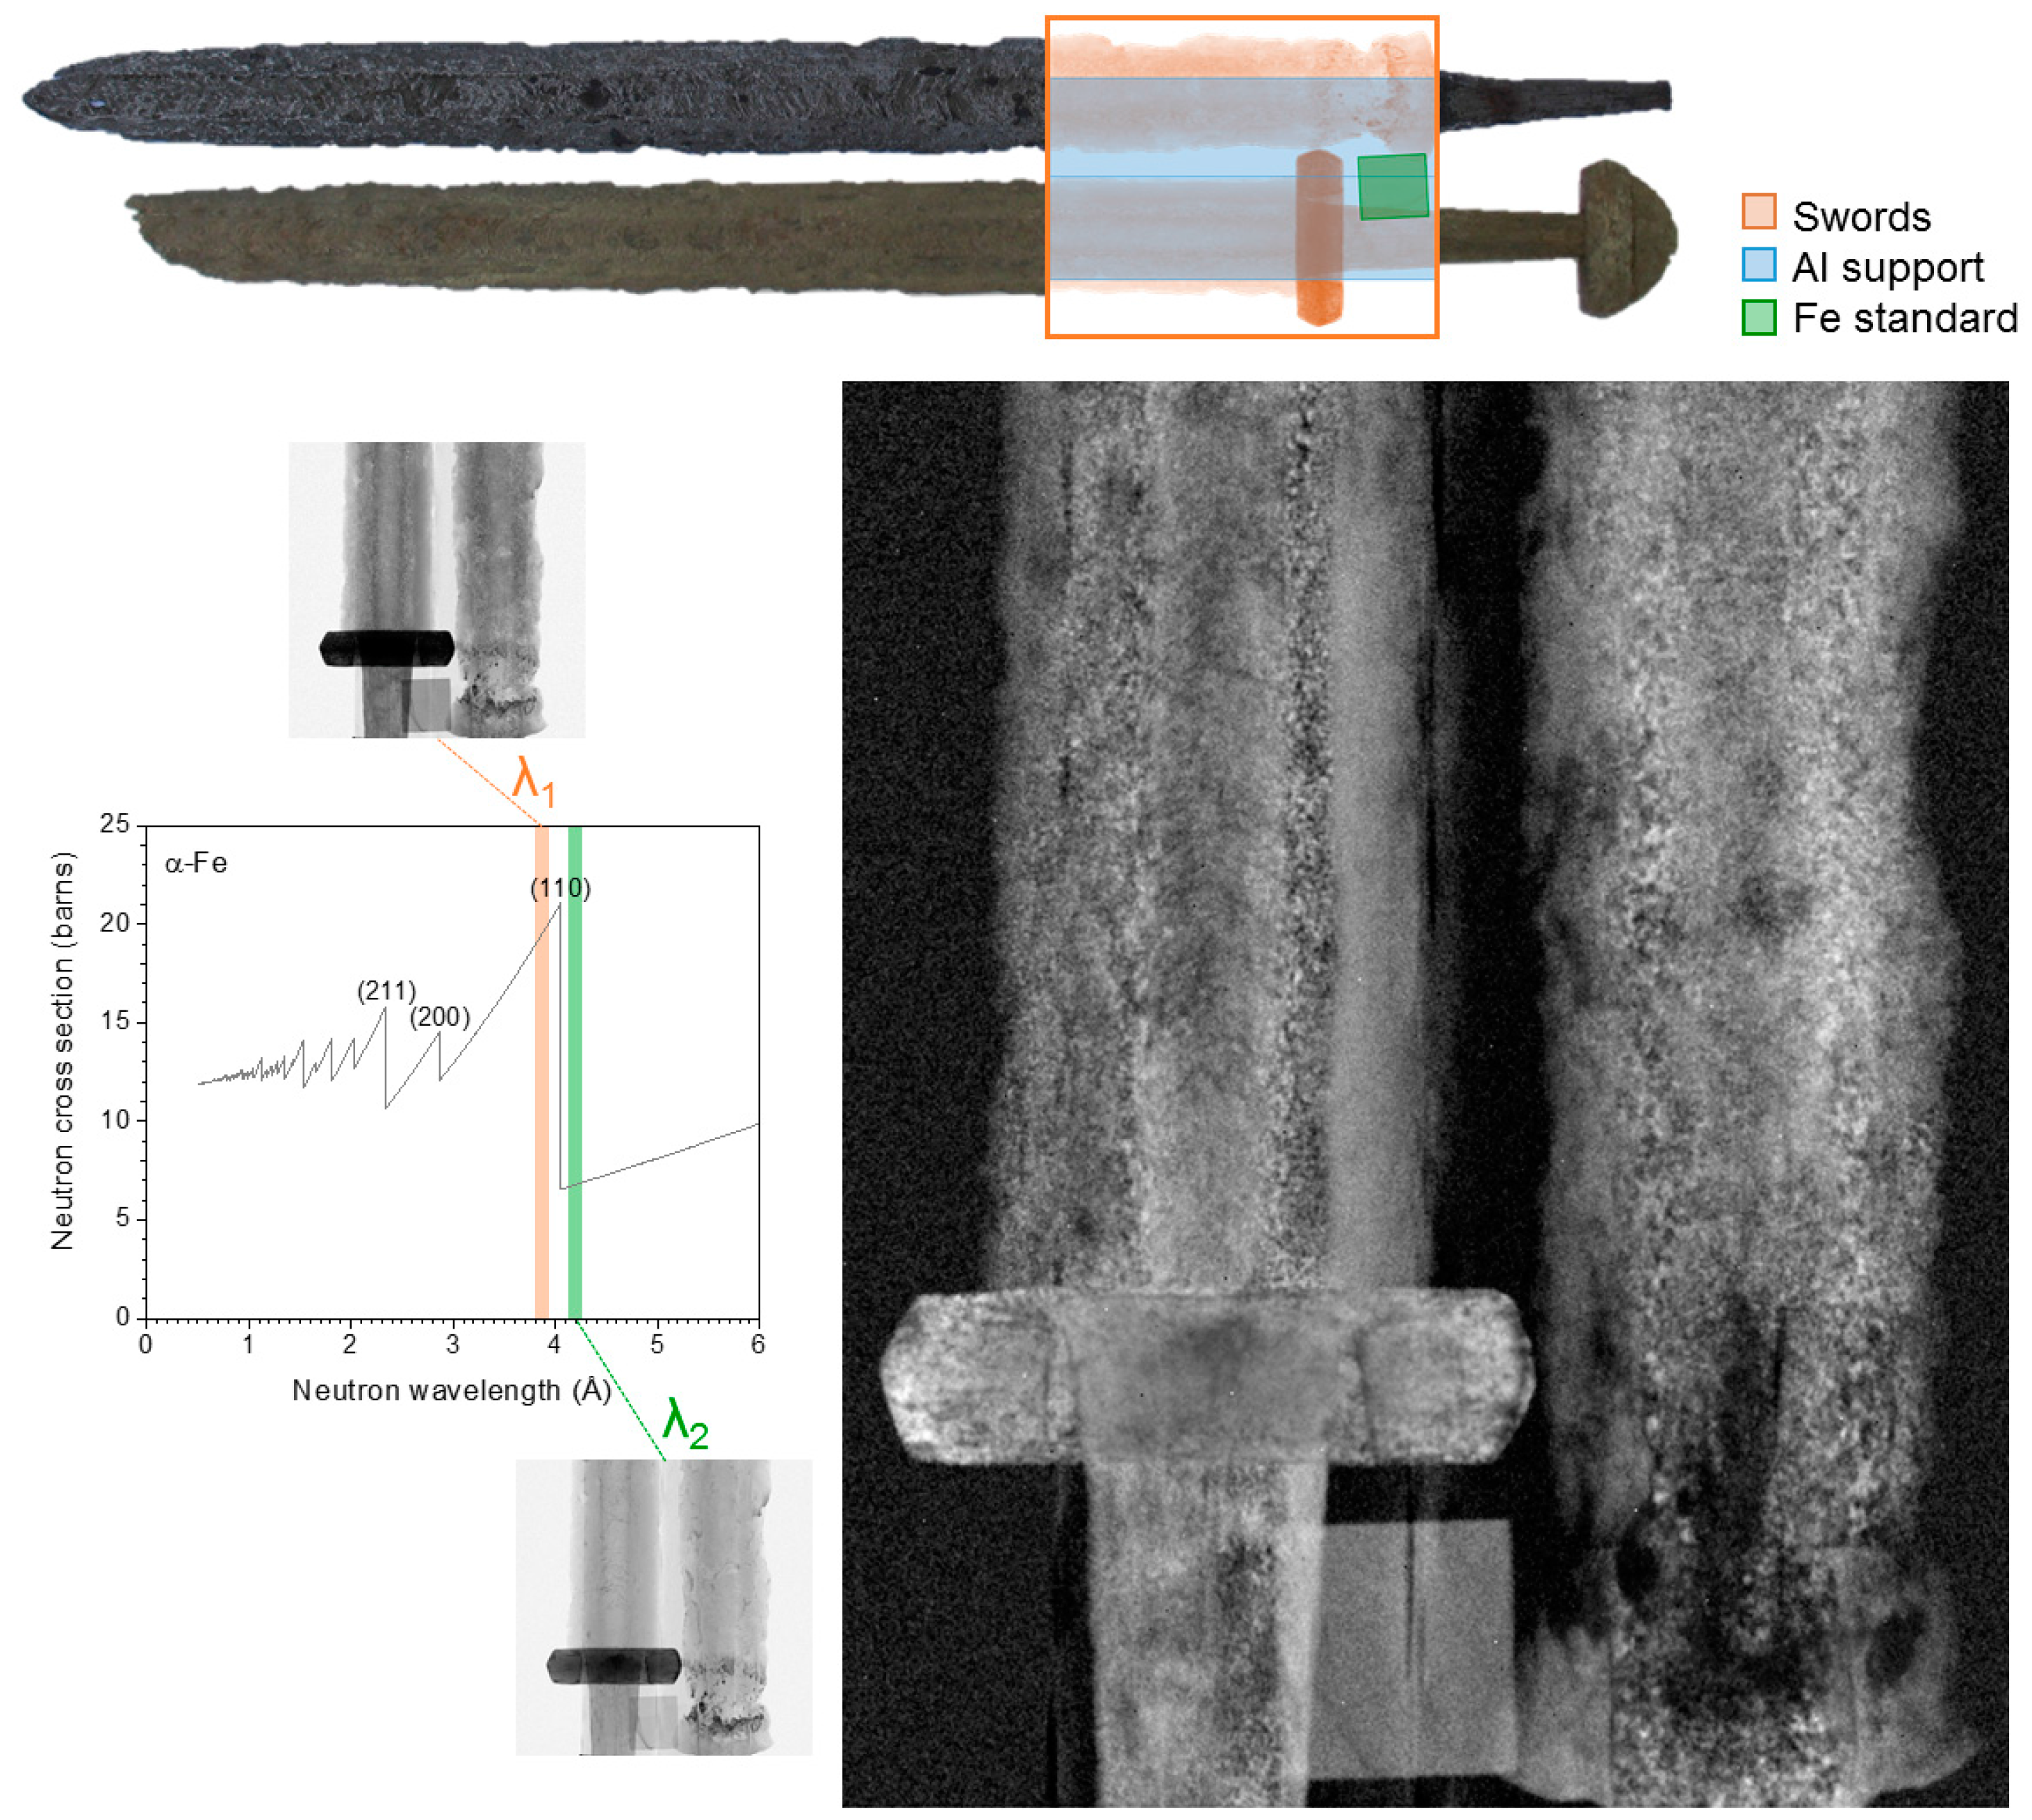
5. Energy Selective or Bragg Edge Imaging with Cold Neutrons
Metallurgic Examinations on Medieval Swords
6. Conclusions
Acknowledgments
Author Contributions
Conflicts of Interest
References
- Schillinger, B. Why use neutrons? Restaur. Archäol. 2015, 8, 1–7. [Google Scholar] [CrossRef]
- Schulz, M.; Schillinger, B.; Calzada, E.; Bausenwein, D.; Schmakat, P.; Reimann, T.; Böni, P. The new neutron imaging beam line ANTARES at FRM II. Restaur. Archäol. 2015, 8. [Google Scholar] [CrossRef]
- Schillinger, B.; Schulz, M. ANTARES Facility. Available online: http://mlz-garching.de/antares (accessed on 30 October 2017).
- Bücherl, T.; Söllradl, S. NECTAR: Radiography and tomography station using fission neutrons. J. Large-Scale Res. Facil. 2015, 1. [Google Scholar] [CrossRef]
- Mühlbauer, M.J.; Bücherl, T.; Genreith, C.; Knapp, M.; Schulz, M.; Söllradl, S.; Wagner, F.M.; Ehrenberg, H. The thermal neutron beam option for NECTAR at MLZ. Phys. Procedia 2017, 88, 148–153. [Google Scholar] [CrossRef]
- Kellermeier, M.; Bücherl, T.; Makowska, M. The NECTAR Facility. Available online: http://www.mlz-garching.de/instrumente-und-labore/bildgebende-verfahren-und-analyse/medapp-und-nectar.html (accessed on 30 October 2017).
- Converter Facility. Available online: http://www.frm2.tum.de/en/the-neutron-source/secondary-sources/converter-facility/ (accessed on 30 October 2017).
- Beaudet, A.; Braga, J.; De Beer, F.; Schillinger, B.; Steininger, C.; Vodopivec, V.; Zanolli, C. Neutron microtomography-based virtual extraction and analysis of a cercopithe oid partial cranium (STS 1039) embedded in a breccia fragment from sterkfontein member 4 (South Africa). Am. J. Phys. Anthropol. 2016, 159, 737–745. [Google Scholar] [CrossRef] [PubMed]
- Zanolli, C. Additional evidence for morpho-dimensional tooth crown variation in a new Indonesian H. erectus sample from the Sangiran Dome (Central Java). PLoS ONE 2013, 8. [Google Scholar] [CrossRef] [PubMed]
- Zanolli, C.; Grine, F.E.; Kullmer, O.; Schrenk, F.; Maccharelli, R. The early Pleistocene deciduous hominid molar FS-72 from the Sangiran dome of java, Indonesia: A taxonomic reappraisal based on its comparative endostructural characterization. Am. J. Phys. Anthropol. 2015, 157, 666–674. [Google Scholar] [CrossRef] [PubMed]
- Zanolli, C.; Schillinger, B.; Beaudet, A.; Kullmer, O.; Macchiarelli, R.; Mancini, L.; Schrenk, F.; Tuniz, C.; Vodopivec, V. Exploring hominin and non-hominin primate dental fossil remains with neutron microtomography. Phys. Procedia 2017, 88, 109–115. [Google Scholar] [CrossRef]
- Laaß, M.; Schillinger, B.; Werneburg, I. Neutron tomography and X-ray tomography as tools for the morphological investigation of non-mammalian synapsids. Phys. Procedia 2017, 88, 100–108. [Google Scholar] [CrossRef]
- Laaß, M. Bone conduction hearing and seismic sensitivity of the late permian anomodont Kawingasaurus fossilis. J. Morphol. 2014, 276, 121–143. [Google Scholar] [CrossRef] [PubMed]
- Laaß, M. The origins of the cochlea and impedance matching hearing in synapsids. Acta Palaeontol. Pol. 2016, 61, 267–280. [Google Scholar] [CrossRef]
- Fedrigo, A.; Strobl, M.; Williams, A.R.; Lefmann, K.; Lindelof, P.E.; Jørgensen, L.; Pentz, P.; Bausenwein, D.; Schillinger, B.; Kovyakh, A.; et al. Neutron imaging study of ‘pattern-welded’ swords from the Viking Age. Archaeol Anthropol Sci. 2016, 1–15. [Google Scholar] [CrossRef]
- Available online: http://www.mlz-garching.de/user-office (accessed on 20 December 2017).


© 2018 by the authors. Licensee MDPI, Basel, Switzerland. This article is an open access article distributed under the terms and conditions of the Creative Commons Attribution (CC BY) license (http://creativecommons.org/licenses/by/4.0/).
Share and Cite
Schillinger, B.; Beaudet, A.; Fedrigo, A.; Grazzi, F.; Kullmer, O.; Laaß, M.; Makowska, M.; Werneburg, I.; Zanolli, C. Neutron Imaging in Cultural Heritage Research at the FRM II Reactor of the Heinz Maier-Leibnitz Center. J. Imaging 2018, 4, 22. https://doi.org/10.3390/jimaging4010022
Schillinger B, Beaudet A, Fedrigo A, Grazzi F, Kullmer O, Laaß M, Makowska M, Werneburg I, Zanolli C. Neutron Imaging in Cultural Heritage Research at the FRM II Reactor of the Heinz Maier-Leibnitz Center. Journal of Imaging. 2018; 4(1):22. https://doi.org/10.3390/jimaging4010022
Chicago/Turabian StyleSchillinger, Burkhard, Amélie Beaudet, Anna Fedrigo, Francesco Grazzi, Ottmar Kullmer, Michael Laaß, Malgorzata Makowska, Ingmar Werneburg, and Clément Zanolli. 2018. "Neutron Imaging in Cultural Heritage Research at the FRM II Reactor of the Heinz Maier-Leibnitz Center" Journal of Imaging 4, no. 1: 22. https://doi.org/10.3390/jimaging4010022