Article

A Study of Different Classifier Combination Approaches for Handwritten Indic Script Recognition

Department of Computer Science and Engineering, Jadavpur University, Kolkata-700032, West Bengal, India
*
Authors to whom correspondence should be addressed.
J. Imaging 2018, 4(2), 39; https://doi.org/10.3390/jimaging4020039
Submission received: 15 December 2017 / Revised: 6 February 2018 / Accepted: 8 February 2018 / Published: 13 February 2018
(This article belongs to the Special Issue Document Image Processing)

Abstract

:
Script identification is an essential step in document image processing especially when the environment is multi-script/multilingual. Till date researchers have developed several methods for the said problem. For this kind of complex pattern recognition problem, it is always difficult to decide which classifier would be the best choice. Moreover, it is also true that different classifiers offer complementary information about the patterns to be classified. Therefore, combining classifiers, in an intelligent way, can be beneficial compared to using any single classifier. Keeping these facts in mind, in this paper, information provided by one shape based and two texture based features are combined using classifier combination techniques for script recognition (word-level) purpose from the handwritten document images. CMATERdb8.4.1 contains 7200 handwritten word samples belonging to 12 Indic scripts (600 per script) and the database is made freely available at https://code.google.com/p/cmaterdb/. The word samples from the mentioned database are classified based on the confidence scores provided by Multi-Layer Perceptron (MLP) classifier. Major classifier combination techniques including majority voting, Borda count, sum rule, product rule, max rule, Dempster-Shafer (DS) rule of combination and secondary classifiers are evaluated for this pattern recognition problem. Maximum accuracy of 98.45% is achieved with an improvement of 7% over the best performing individual classifier being reported on the validation set.

1. Introduction

In the domain of document images processing, Optical Character Recognition (OCR) systems are, in general, developed keeping a particular script in mind, which implies that such systems can read characters written in a specific script only. This is because the number of characters, shape of the characters or the writing style of using a particular character set is so different that designing a common feature set applicable for recognizing any character set is practically impossible. As an alternative, a pool of OCR systems that correspond to different scripts [1] can be used to solve this said problem. This statement infers that before the document images are fed to an OCR system, it is required to identify the script in which the document is written so that those document images can be suitably converted into a computer-editable format using that OCR system. This summarizes the problem of script identification. There are some important applications of script identification system such as automatic archiving as well as indexing of multi-script documents, searching required information from digitized archives of multi-scripts document images.
In this paper, script identification from handwritten document images written in different scripts is considered. In this regard, it is to be noted that hurdles are multi-fold when handwritten document images are considered compared to its printed counterpart. The main difficulty which researchers need to deal with is the non-uniformity of the shape and size of the characters written by different writers. Along with these, problems like skew, slant etc. are commonly seen in handwritten documents. Even the paper and ink qualities make things much difficult. Apart from the intrinsic complexities of handwritings, similarities among the characters belonging to different script augment the challenges of script recognition from the handwritten document images. It is worth mentioning that, usually, script recognition is performed at page, text-line or at word level. But in this paper, this is done at word-level because of two reasons: (a) feature extraction at word-level is less time consuming than at page or at text-line level and (b) sometimes, it is seen that a single document page or a single text line contains multiple scripts. In that case, word-level script identification is appropriate.
Script recognition articles for handwritten documents are relatively limited in comparison to its printed counterpart. Ubul et al. [2] comprehensively showed the state-of-the-art performance results for different identification, feature extraction and classification methodologies involved in the process. Recently, Singh et al. [1] provided a survey considering various feature extraction and classification techniques associated with the offline script identification of the Indic scripts. Spitz [3] proposed a method for distinguishing between Asian and European languages by analysing the connected components. Tan et al. [4] developed a method based on texture analysis for automatic script identification from document images using multiple channel (Gabor) filters and Gray level co-occurrence matrices(GLCM) for seven languages: Chinese, English, Greek, Koreans, Malayalam, Persian and Russian. Hochberg et al. [5,6] described an algorithm for script and language identification from handwritten document images using statistical features based on connected component analysis. Wood et al. [7] demonstrated a projection profile method to determine Roman, Russian, Arabic, Korean and Chinese characters. Chaudhuri et al. [8] discussed an OCR system to read two Indian languages viz., Bangla and Devanagari (Hindi). Pal et al. [9] proposed an algorithm for word-wise script identification from document containing English, Devanagari and Telugu text, based on conventional and water reservoir features. Chaudhury et al. [10] proposed a method for identification of Indian languages by combining Gabor filter based techniques and direction distance histogram classifier for Hindi, English, Malayalam, Bengali, Telugu and Urdu. Some analysis of the variability involved in the multi-script signature recognition problem as compared to the single-script scenario is discussed in [11,12].
Various classification algorithms are applied for different pattern recognition problems and the same fact also applies to the script recognition problem. Till date, for Indic script recognition purpose, different classifiers have been used such as k-Nearest Neighbours (k-NN) [13,14], Linear Discriminant Analysis (LDA) [15], Neural Networks (NN) [15,16], Support Vector Machine (SVM) [16,17], Tree based classifier [18,19], Simple Logistic [20] and MLP [21,22]. Though good results have already been achieved in this pattern recognition task but with a single classifier it is still hard to achieve acceptable accuracy. Studies expose that the fusion of multiple classifiers can be a viable solution to get better classification results as the error amassed by any single classifier is generally compensated using information from other classifiers. The reason for this is that different classifiers may offer complementary information about the patterns under consideration. Based on this fact, since long, a section of researchers has focused on devising different algorithms for combining classifiers in an intelligent way so that the combination can achieve better results than any of the individual classifier used for combining. The key idea is that instead of relying on a single decision maker, all the designs or their subsets are applied for the decision making by combining their individual beliefs in order to come up with a consensus decision. This fact motivates many researchers to apply the classifier combination methods to different pattern recognition problems. The popular methodologies for classifier combination include: Majority Voting [23,24], Subset-combining and re-ranking approach [25], Statistical model [26], Bayesian Belief Integration [27], Combination based on DS theory of evidence [27,28] and Neural Network combinator [29].
But till date, classifier combination approach for script recognition problem, either handwritten or printed, has not been tested much, though it has enormous potential. To bridge this research gap, this paper applies different classifier combination techniques in the field of Indic script recognition. The main contribution of the present work is the comprehensive evaluation of the major classifier combination approaches which are either rule based or apply a secondary classifier for information fusion. The motivation is to improve the classification accuracy at the word-level handwritten script recognition by combining the results of the best performing classifier on three previously used feature sets. It is a multi-class classification problem and in the present case, 12 officially used Indic-scripts are considered which are: Devanagari, Bangla, Odia, Gujarati, Gurumukhi, Tamil, Telugu, Kannada, Malayalam, Manipuri, Urdu and Roman. Three different sets of feature vectors based on both shape and texture analysis have been estimated from each of the handwritten word images. Identification of the scripts in which the word images are written, is done with these feature values by feeding the same into different MLP classifiers. Soft-decisions provided by the individual classifiers are then combined using an array of classifier combination techniques. This kind of work is implemented for the first time assuming the number of Indic scripts undertaken and the range of combination techniques applied. The system developed for the script recognition task here, is a part of the general framework where different feature sets and classifier outputs can be modelled into a single system without much increase in the computation involved. Block diagram of the present work is shown in Figure 1.

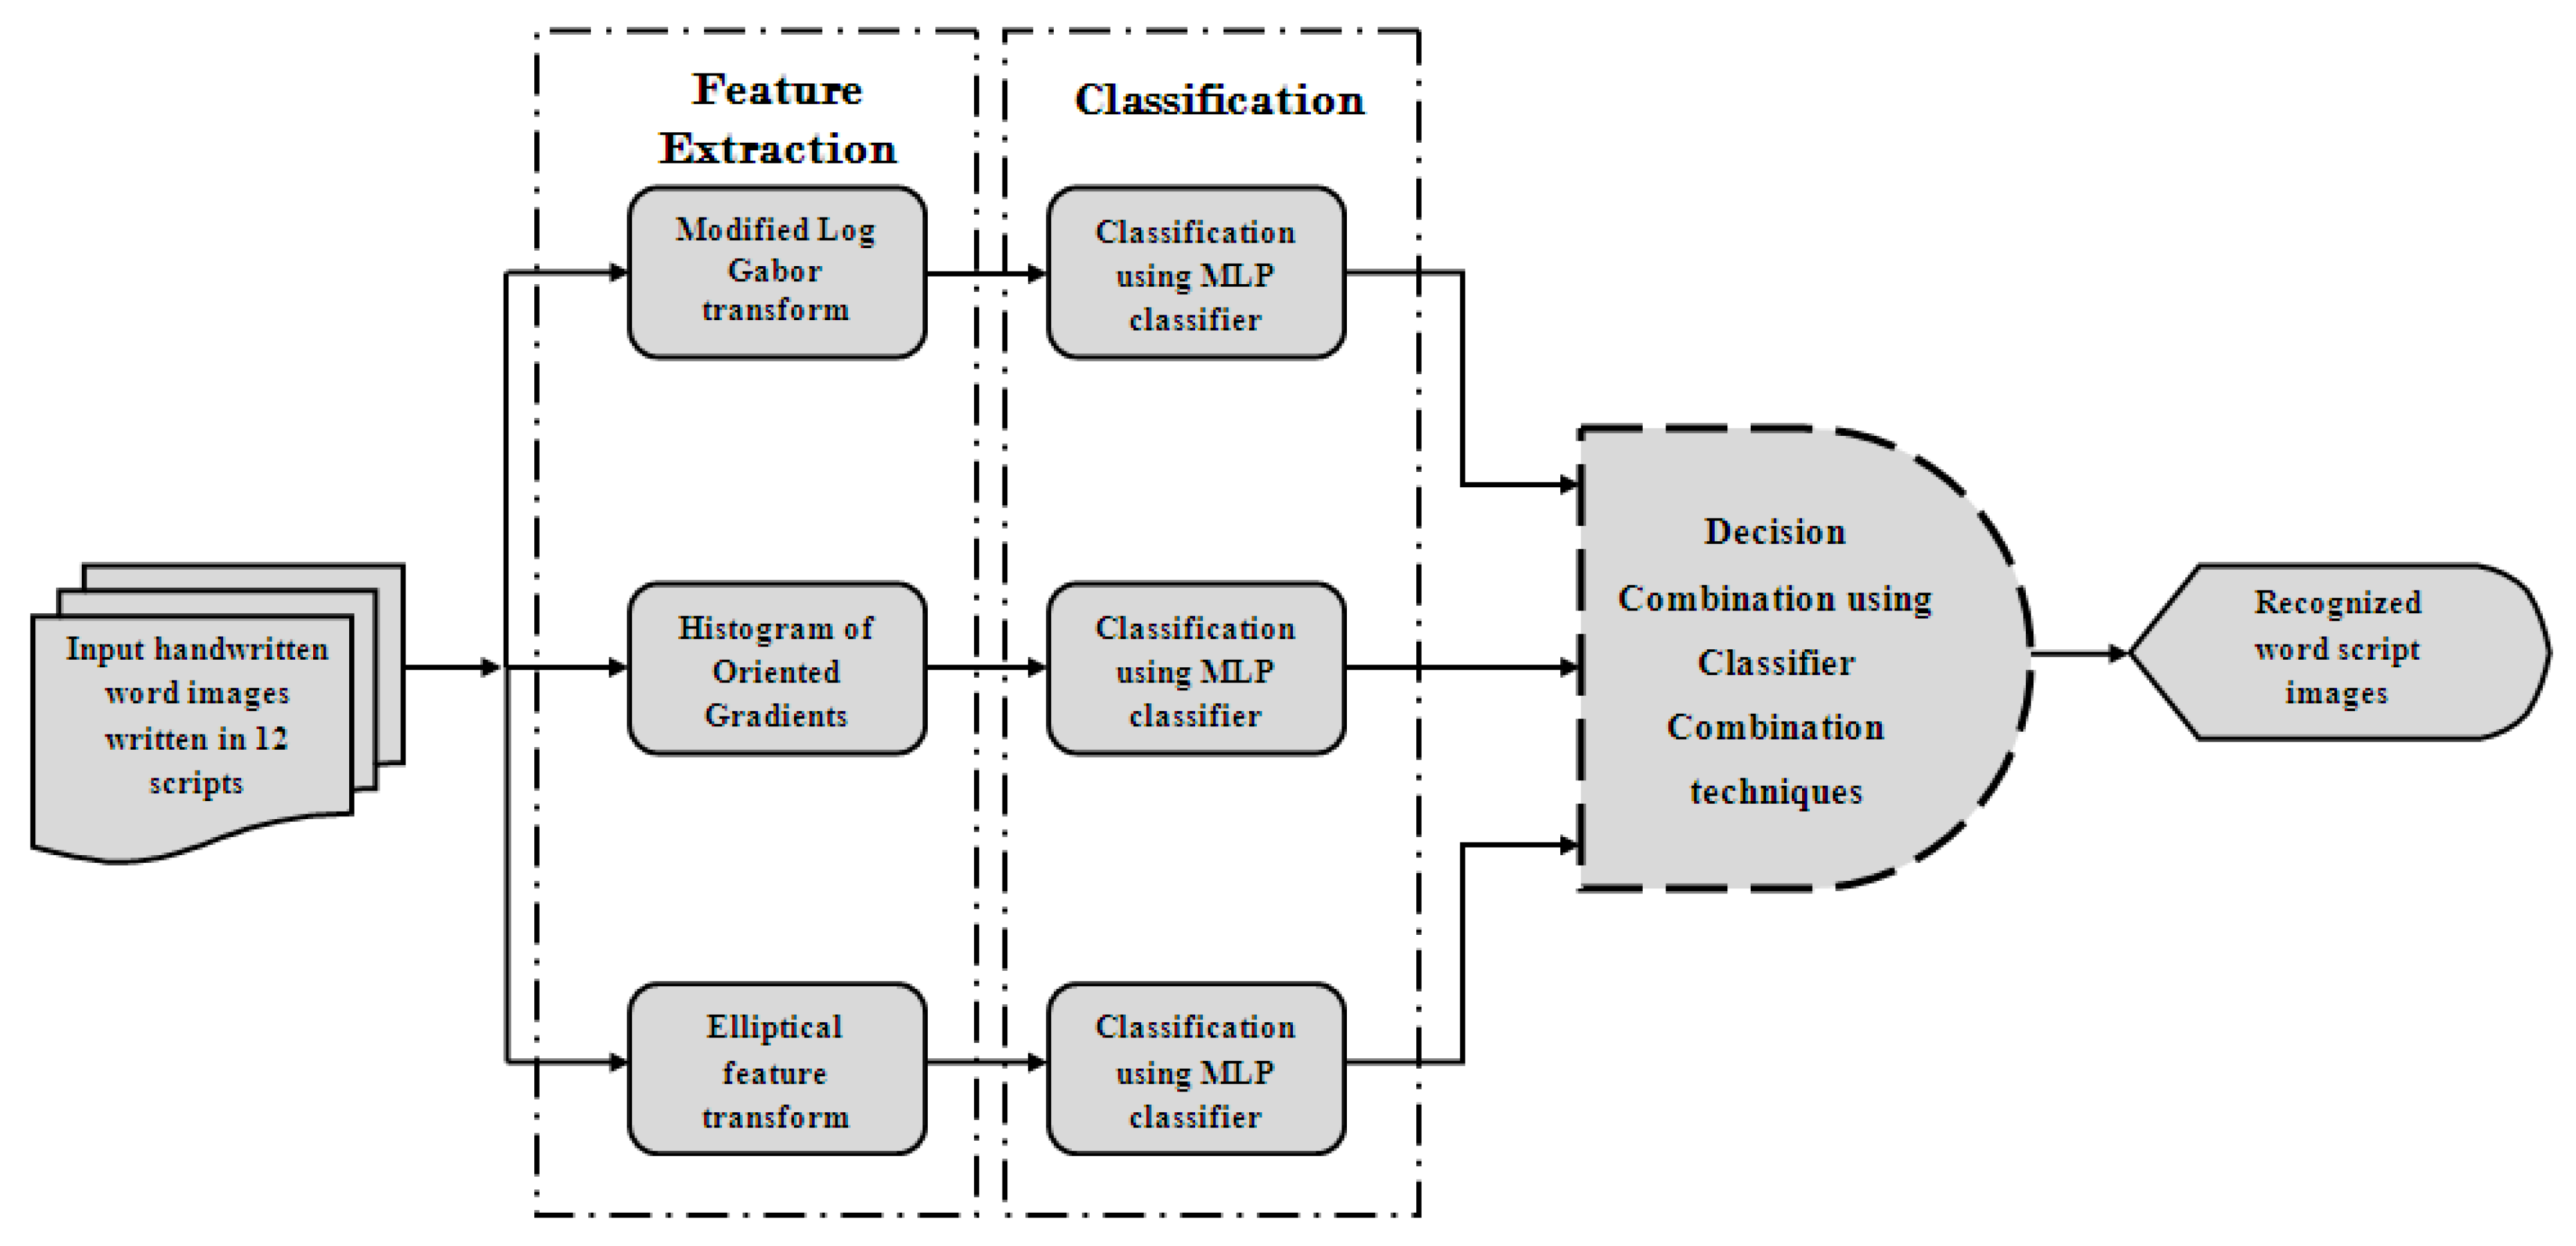
2. Feature Extraction

In this paper, three popular feature extraction methodologies have been used for the combination namely, Elliptical Features [21], Histogram of Oriented Gradients (HOG) [30] and Modified log-Gabor filter transform [20]. The first feature set is applied to capture the overall structure present in the script word images whereas the rest two feature sets deal with the texture of the same. These features have already provided satisfactory results to this challenging task of handwritten script identification.

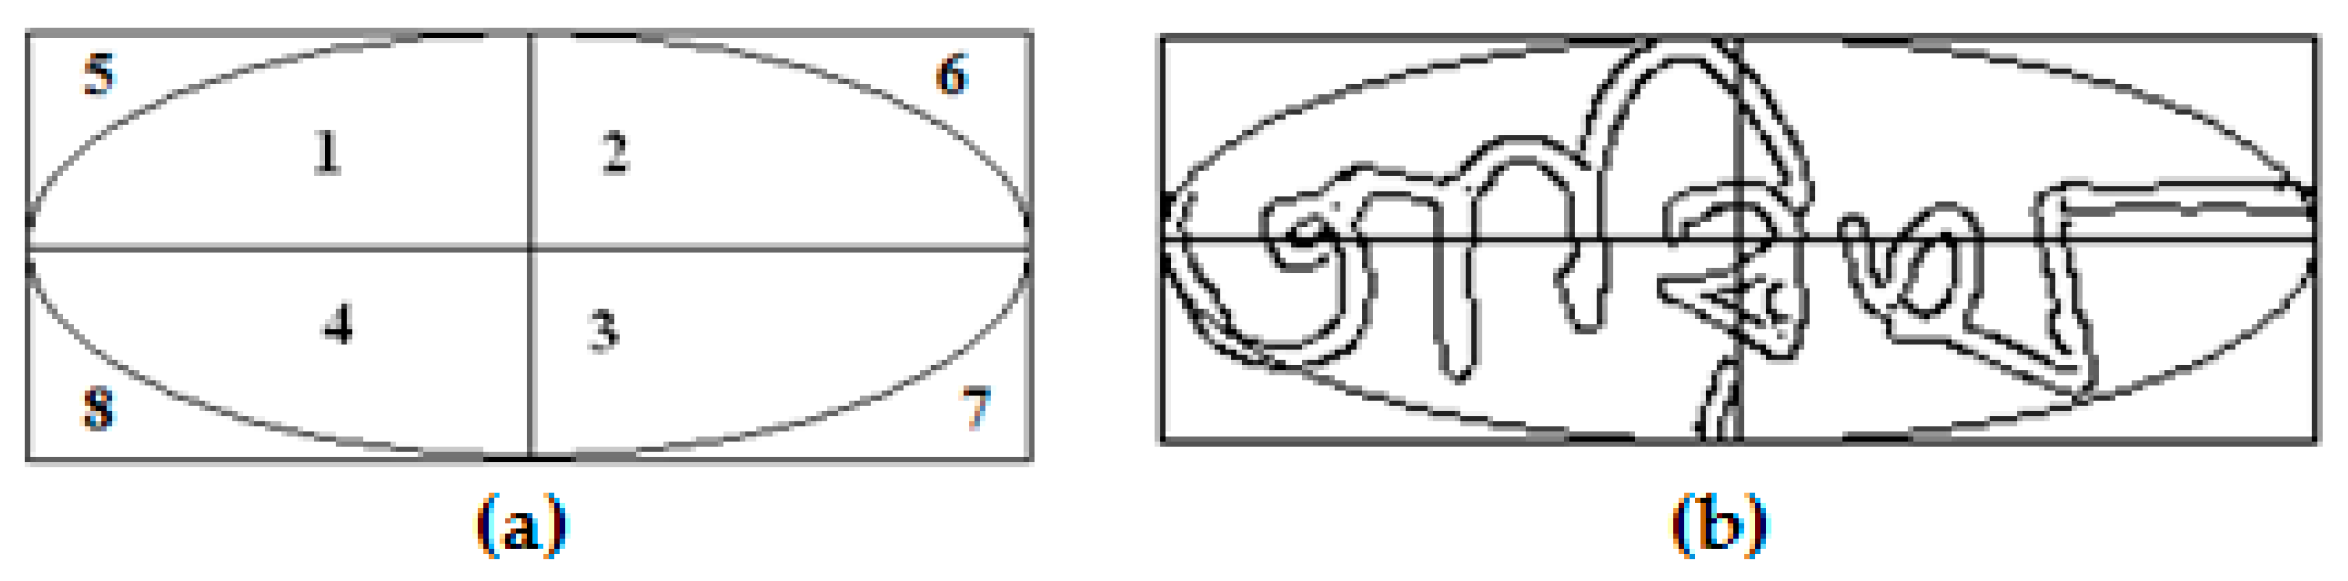
2.1. Elliptical Features

The word images are generally found to be elongated in nature which can better covered by an ellipse. That is why; elliptical features are extracted from the contour and the local regions of a word image so that it is easier to isolate a particular script. Two more important notations used in this subsection are: (a) Pixel ratio (Pr) and (b) Pixel count (Pc). Pr is defined as the ratio of the number of contour pixels (object) to the number of background pixels and the pixel count whereas Pc is defined as the number of contour pixels. The features are described in detail:

2.1.1. Maximum Inscribed Ellipse

The height and width of the bounding box are calculated for each word image. A representative ellipse is then inscribed (considering the orientation of the ellipse) inside this bounding box having major and minor axes equal to the width and the height of the bounding box and the centre of an ellipse is also the centre of the corresponding bounding box. This ellipse divides the word image into eight regions Ri, I = 1, 2…, 8. The bounding box along with the inscribed ellipse for a handwritten Bangla word image are shown in Figure 2b. Taking the values of Pr from these eight regions, as shown in Figure 2a, eight features (F1–F8) for each handwritten word image are estimated. Now, another type of feature, Pcalong N (N = 8 for the present work) lines parallel to major/minor axis of the representative ellipse are computed. The mean and standard deviation of the values of Pcalong major/minor axis are taken as four additional features (F9–F12).

2.1.2. Sectional Inscribed Ellipse

Each of the word images surrounded by the minimum bounding box is again divided into four equal rectangles and a representative ellipse is fit into each of these rectangles using the same procedure as described in the previous subsection. As a result, every ellipse produces eight regions inside its rectangular area namely, R i j where 1 i 4 and 1 j 8 which makes 8 × 4 = 32 regions in total. A total of 32 feature values (F13–F44) using the Pr values is computed from the 32 ellipses in similar fashion.

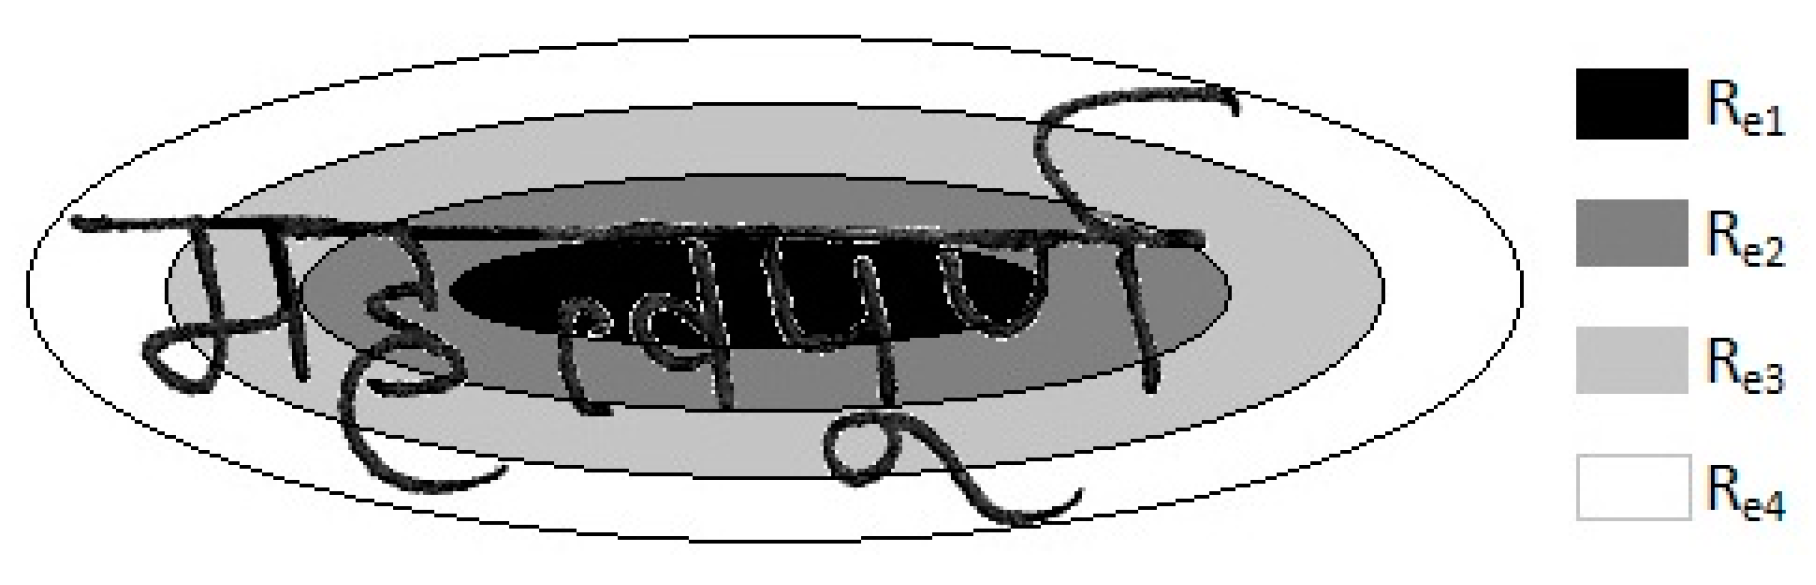
2.1.3. Concentric Ellipses

These feature values are computed by taking the entire topology of the word image. A primary ellipse is made circumscribing the word image with centre taken to be the midpoint of its minimum bounding box. The values of the major and minor axes of the ellipse are taken into consideration. After fitting the primary ellipse, three concentric ellipses are drawn inside the primary ellipse having the same centre point as the primary ellipse and major and minor axes equal to 1/4th, 2/4th and 3/4th of major and minor axes of the primary ellipse respectively. These four ellipses divide each of the word images into four regions- Re1, Re2, Re3 and Re4. The partitioning of the four regions on a sample handwritten Devanagari word image is shown in Figure 3. From the four regions, four features values (F45–F48) considering the Pr’s and four feature values (F49–F52) considering the Pc’s of the regions Re1, Re2, Re3 and Re4 are estimated. The remaining six features (i.e., F53–F58) are taken as the corresponding differences of the Pr’s and Pc’s between the regions Re1 and Re2, Re2 and Re3, Re3 and Re4 respectively. The elliptical features (F1–F58) are suitably normalized by the height and width of the corresponding word image.

2.2. Histogram of Oriented Gradients (HOG)

HOG descriptor [31] counts occurrences of gradient orientation in localized portions of an image which was first proposed for pedestrian detection in steady images. The essential thought behind the HOG descriptor is that local object appearance and shape within an image can be described by the distribution of intensity gradients or edge directions. At first, the values of the magnitude and direction of all the pixels for each of the word images are calculated. Next, each pixel is pigeonholed in certain category according to its direction which is known as orientation bins. Then, the word image is divided into n (here n = 10) connected regions, called cells and for each cell, a histogram of gradient directions or edge orientations is computed for the pixels within the cell. The combination of these histograms then represents the descriptor. Since the number of orientation bins is taken as 8 for the present work, an 80-D (i.e., 10 × 8) feature vector has been extracted using HOG descriptor [30]. The magnitude and direction of each pixel of a sample handwritten Telugu word image are also shown in Figure 4.

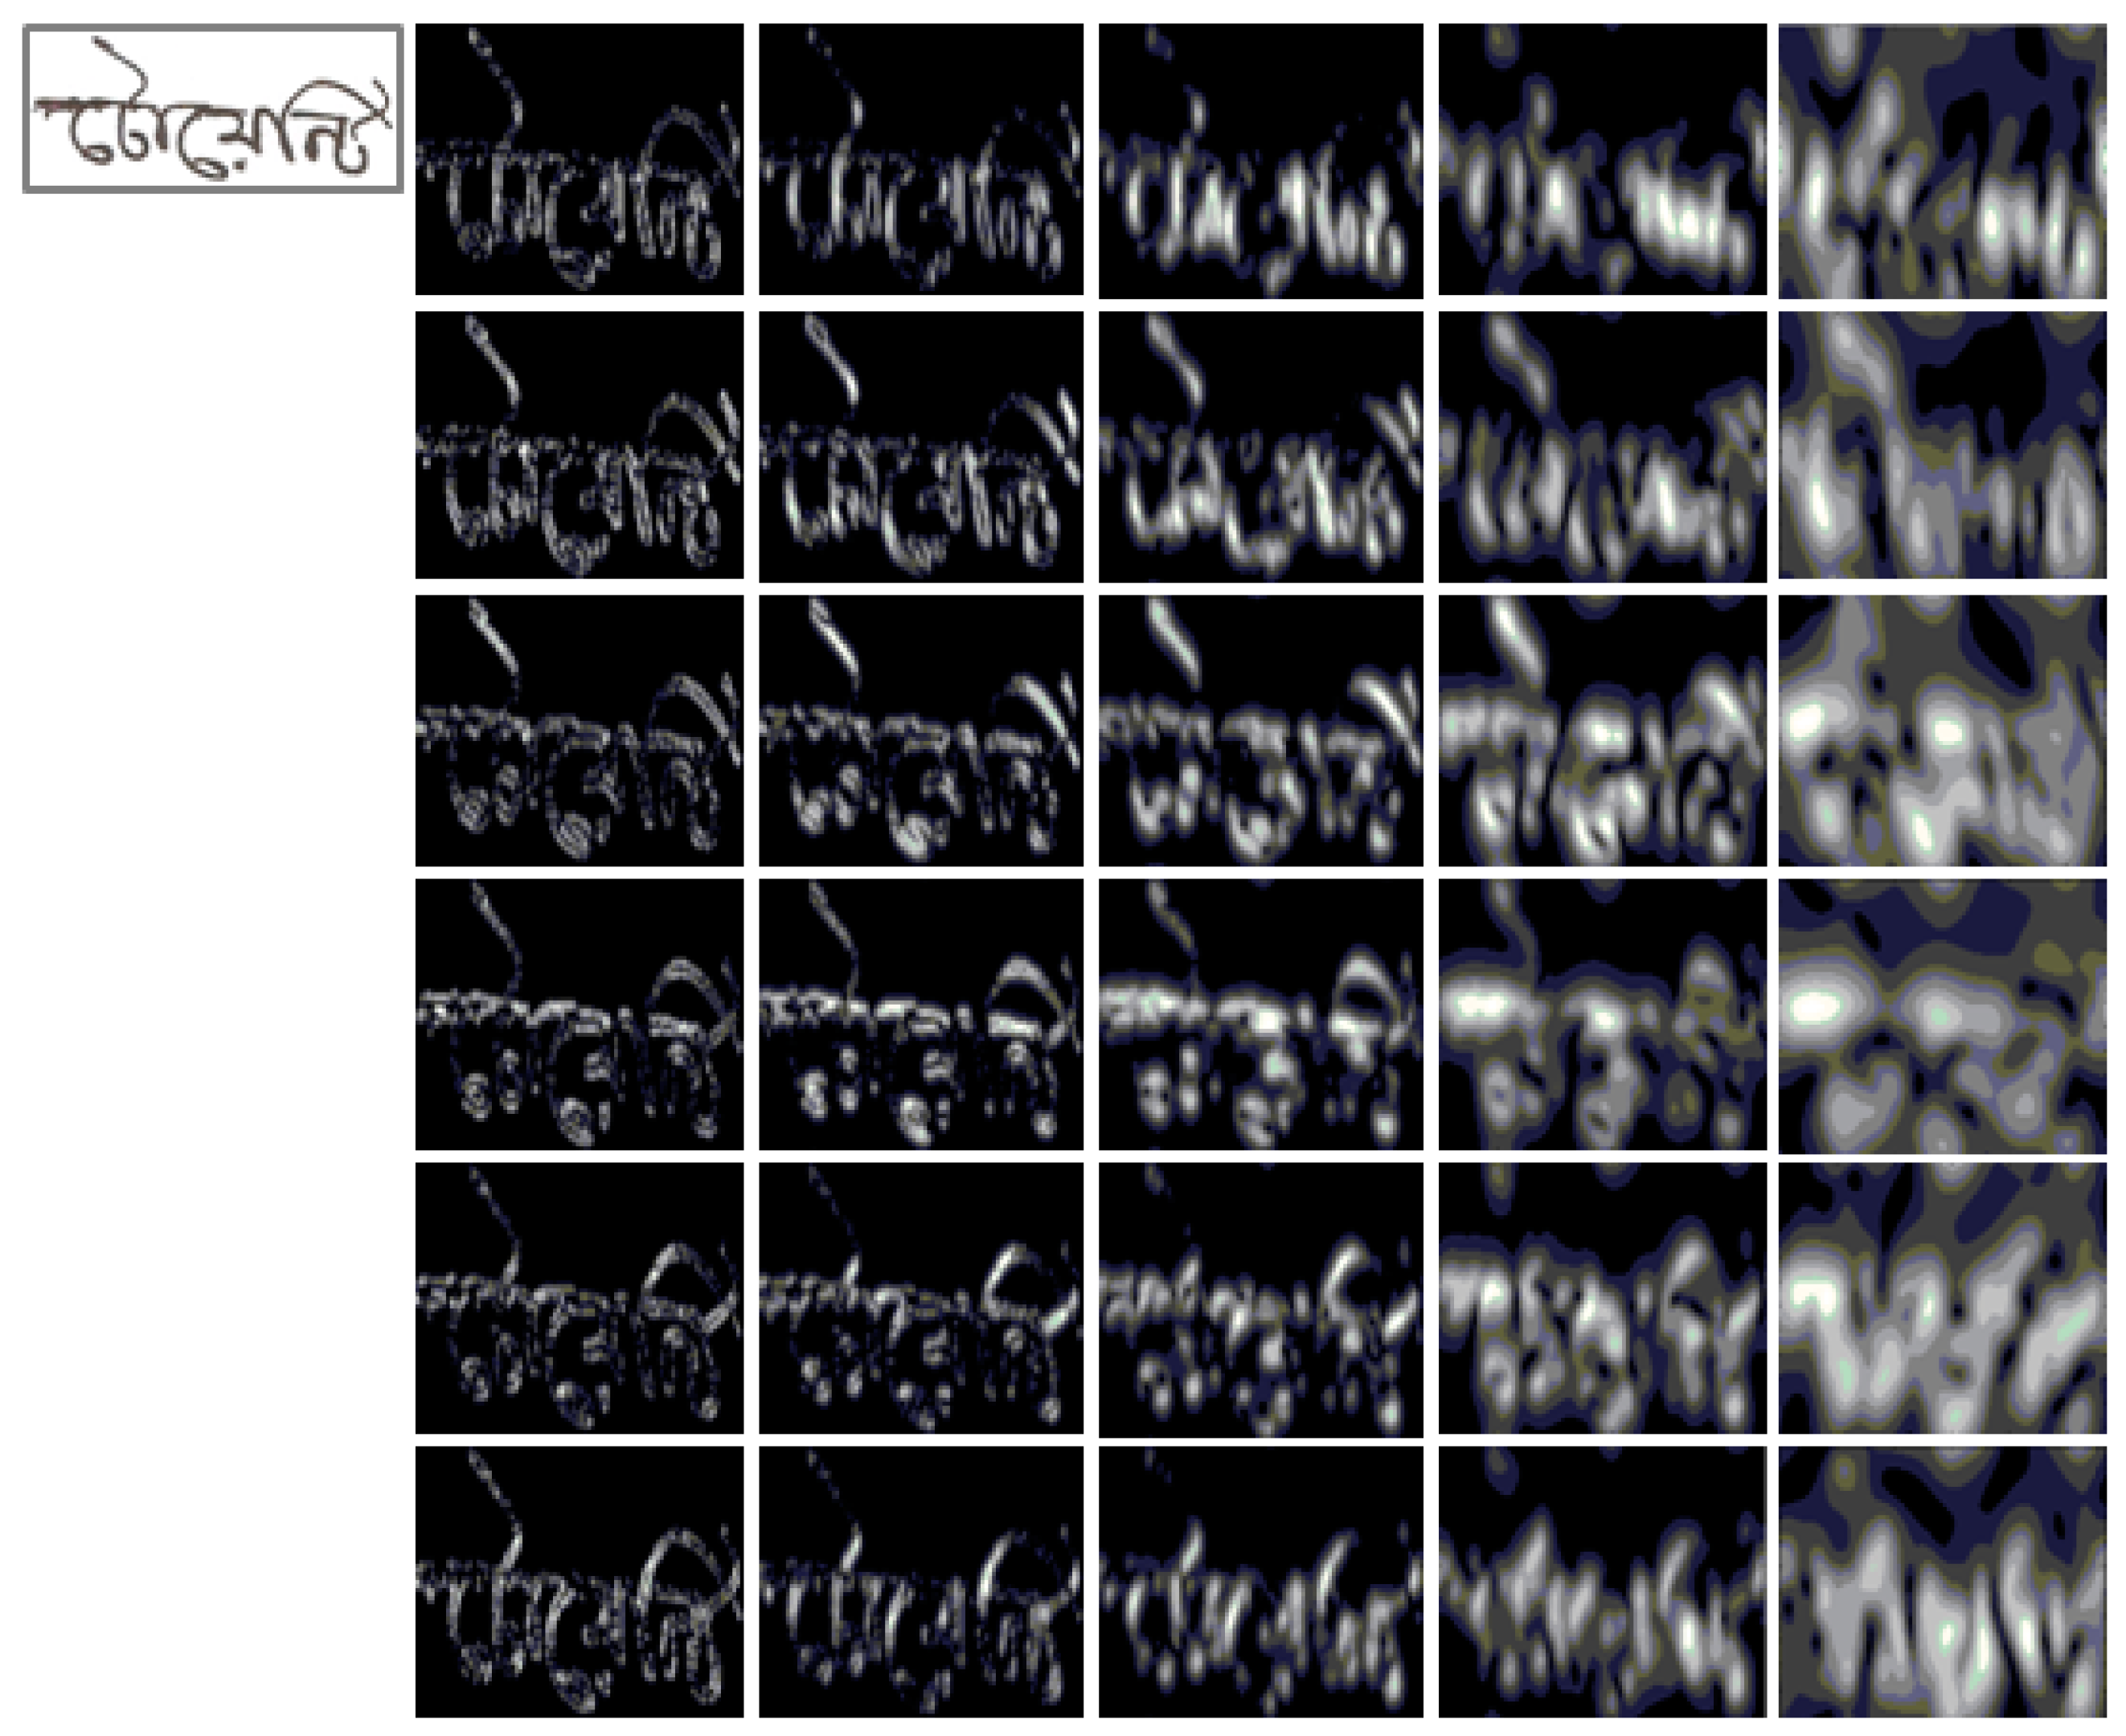
2.3. Modified Log-Gabor Filter Transform (MLG Transform)

Modified log-Gabor filter transform-based features, proposed in Reference [20], had performed well in the script classification task and therefore are also chosen as one of the feature descriptors of our proposed methodology in order to identify the script of the word images. In order to preserve the spatial information, a Windowed Fourier Transform (WFT) is considered in the present work. WFT involves multiplication of the image by the window function and the resultant output is followed by applying the Fourier transform. WFT is basically a convolution of the image with the low-pass filter. Since for texture analysis, both spatial and frequency information are preferred, the present work tries to achieve a good trade-off between these two. Gabor transforms use a Gaussian function as the optimally concentrated function in the spatial as well as in the frequency domain [32]. Due to the convolution theorem, the filter interpretation of the Gabor transform allows the efficient computation of the Gabor coefficients by multiplication of the Fourier transformed image with the Fourier transform of the Gabor filter. The inverse Fourier transform is then applied on the resultant vector to get the output filtered images.
The images, after low pass filtering, are passed as input to a function that computes Gabor energy feature from them. The input image is then passed to a function to yield a Gabor array which is the array equivalent of the image after Gabor filtering. The function displays the image equivalent of the magnitude and the real part of the Gabor array pixels.
For the present work, both energy and entropy features [33] based on Modified log-Gabor filter transform have been extracted for 5 scales (1, 2, 3, 4 and 5) and 6 orientations (0°, 30°, 60°, 90°, 120° and 150°) to capture complementary information found in different script word images. Here, each filter is convolved with the input image to obtain 60 different representations (response matrices) for a given input image. Figure 5 shows output images formed after the application of Modified log-Gabor filter transform for a sample handwritten Bangla word image.

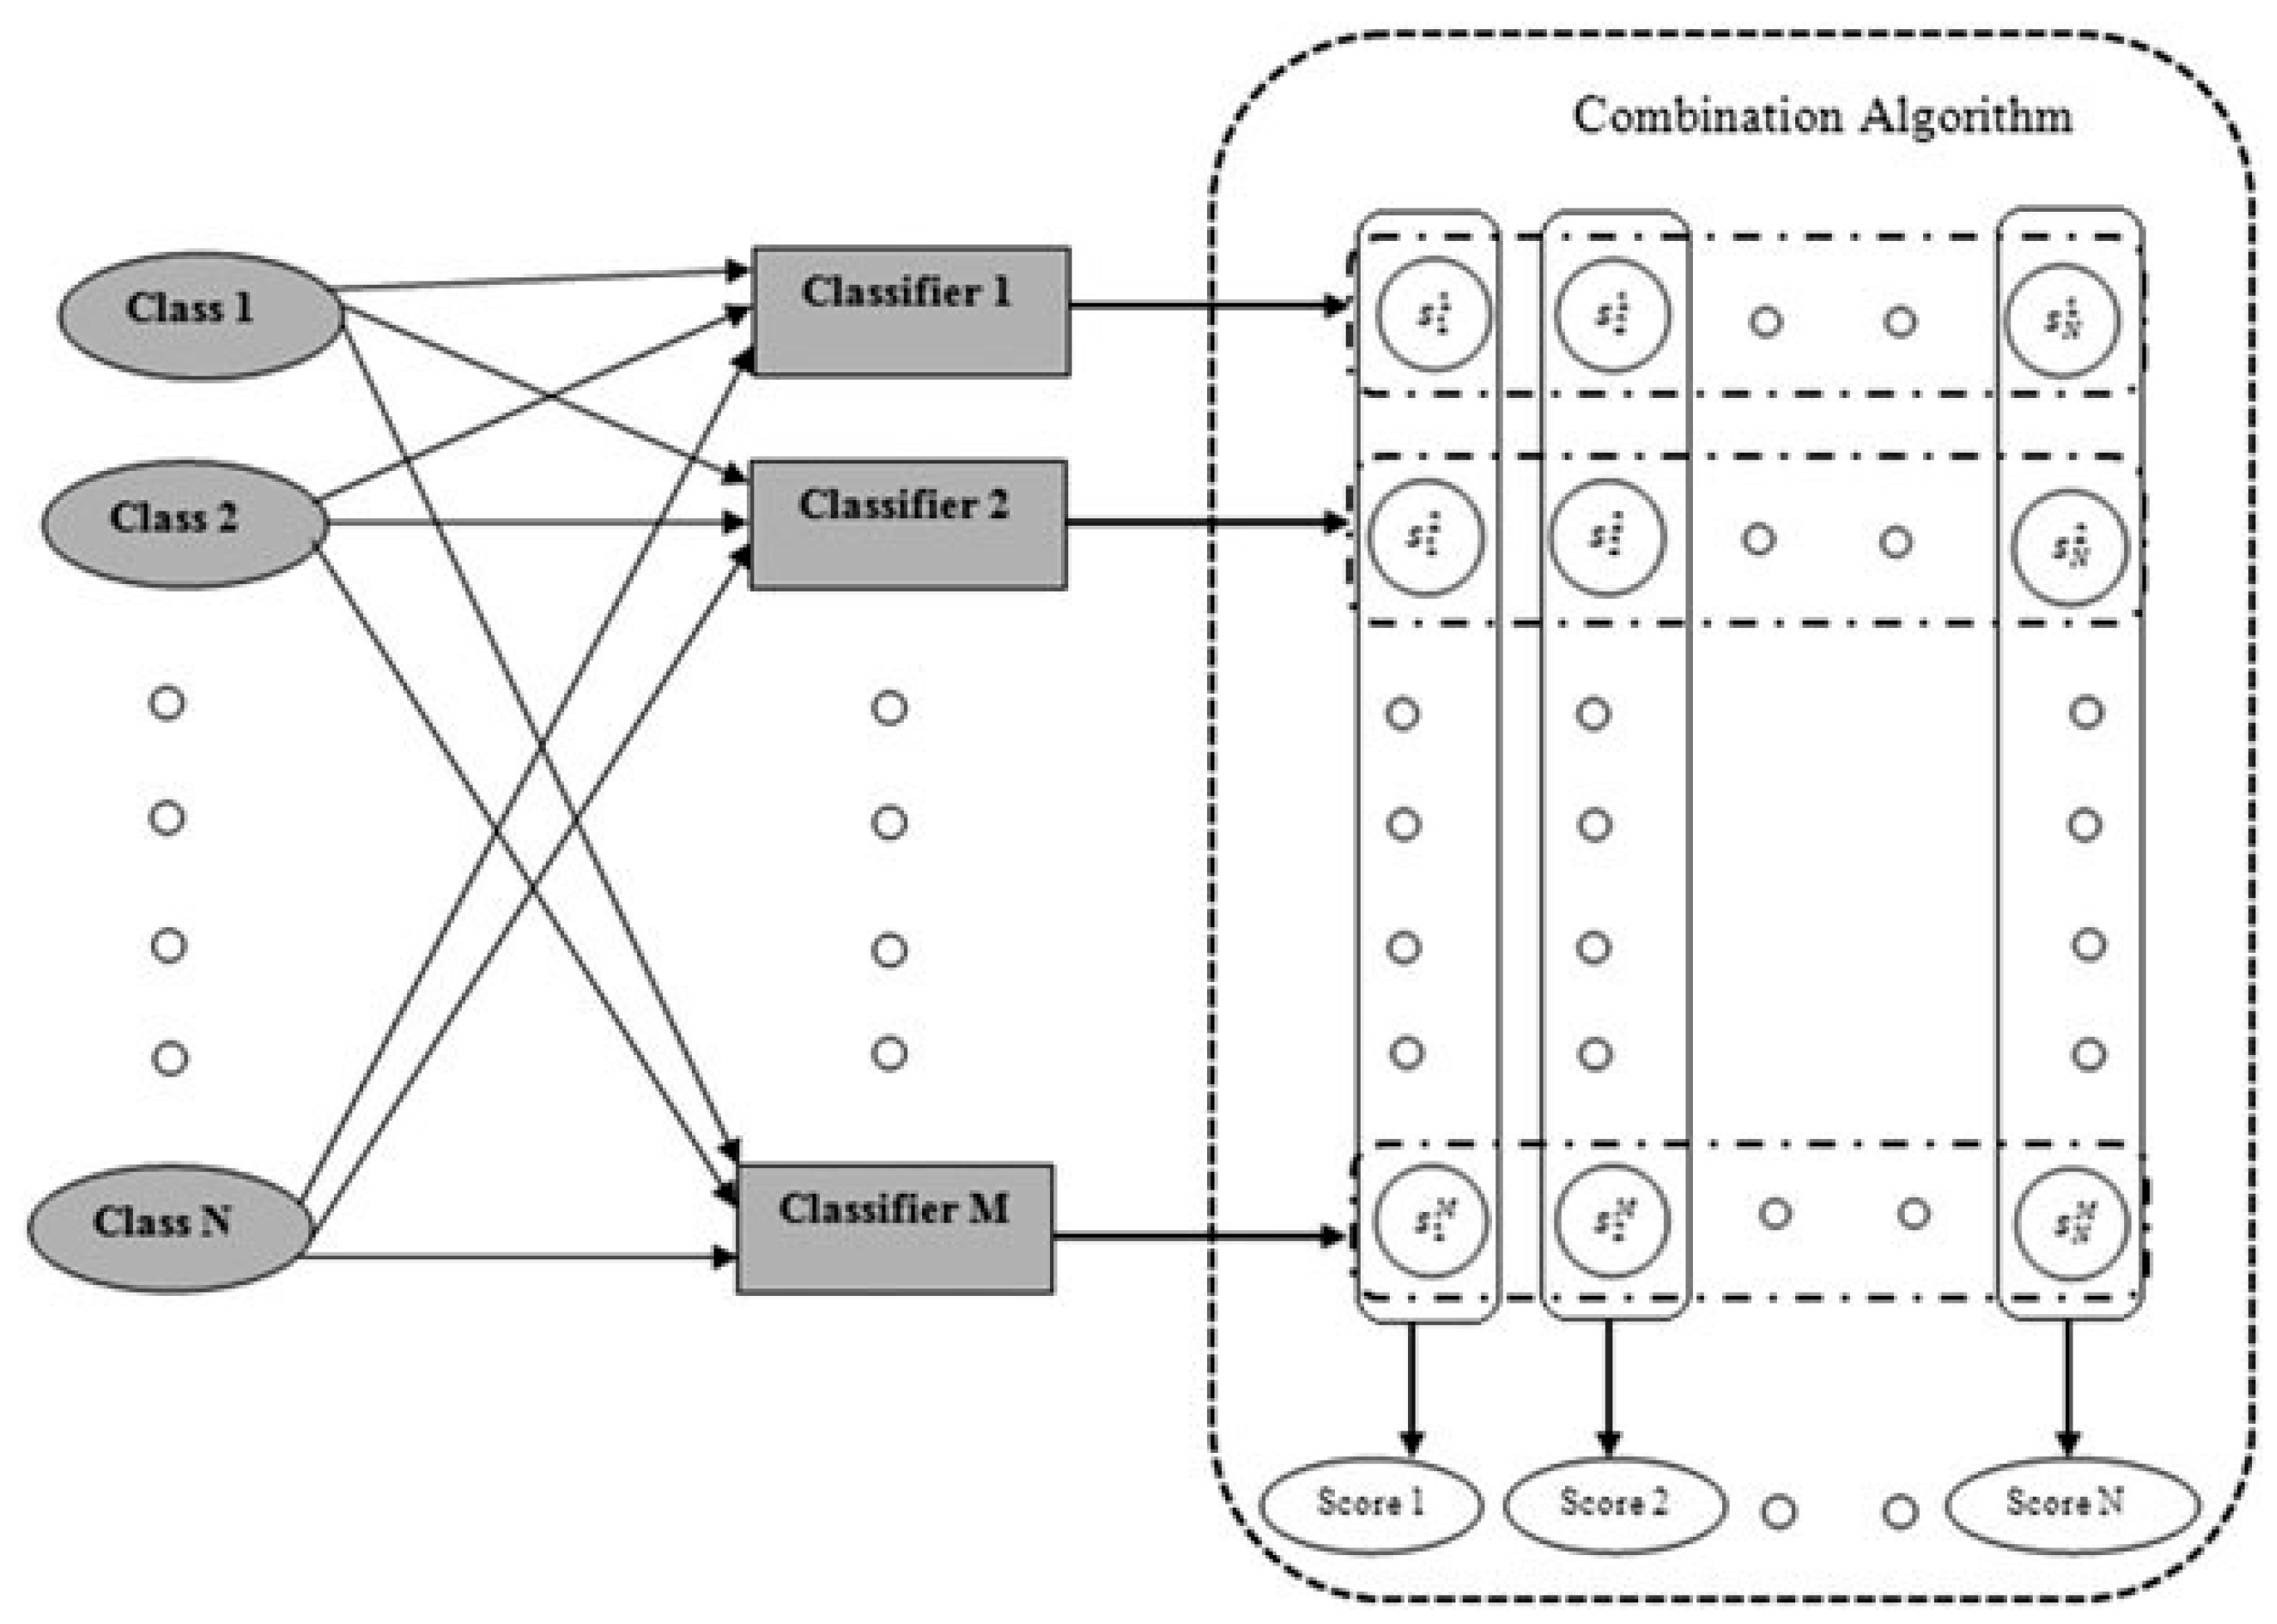
3. Classifier Combination

Classifier combination tries to improve on the task of pattern recognition performance through mathematical models. The outputs of classifiers can be represented as vectors of numbers where the dimension of vectors is equal to the number of classes. As a result, the combination problem can be defined as a problem of finding the combination function accepting N-dimensional score vectors from M classifiers and outputting N final classification scores (see Figure 6), where the function tries to minimize the misclassification cost.
The field of classifier combination can be grouped into different categories [35] based on the stage at which the process is applied, type of information (classifier output) being fused and the number and type of classifiers being combined.
Based on the operating level of the classifiers, classifier combination can be done at the feature level. Multiple features can be joined to provide a new feature set which provide more information about the classes. But with the increase in dimensionality of the data, training becomes expensive.
The classifier outputs after the extraction of the individual feature sets can be combined to provide better insights at the decision level. Decision level combination techniques are popular as it cannot need any understanding of the ideas behind the feature generation and classification algorithms.
Feature level combination is performed by concatenating the feature sets in all possible combinations and passing it through the base classifier, MLP in this case. Apart from that, all the other combination processes worked out operate at the decision level.
Classifier combination can also be classified by the outputs of the classifiers used in the combination. Three types of classifier outputs are usually considered [36]:
  • Type I (Abstract level): This is the lowest level in a sense that the classifier provides the least amount of information on this level. Classifier output is a single class label informing the decision of the classifier.
  • Type II (Rank level): Classifier output on the rank level is an ordered sequence of candidate classes, the so-called n-best list. The candidate classes are ordered from the most likely class at the front and the least likely class index featuring at the last of the list. There are no confidence scores attached to the class labels on rank level and the relative positioning provides the required information.
  • Type III (Measurement level): In addition to the ordered n-best lists of candidate classes on the rank level, classifier output on the measurement level has confidence values assigned to each entry of the n-best list. These confidences, or scores, are generally real numbers generated using the internal algorithm for the classifier. This soft-decision information at the measurement level thus provides more information than the other levels.
In this paper, Type II (rank level) and Type III (measurement level) combination procedures are worked out because they allow the inculcation of a greater degree of soft-decision information from the classifiers and find use in most practical applications.
The focus of this paper is to explore the classifier combination techniques on a fixed set of classifiers. The purpose of the combination algorithm is to learn the behaviour of these classifiers and produce an efficient combination function based on the classifier outputs. Hence, we use non-ensemble classifier combinations which try to combine heterogeneous classifiers complementing each other. The advantage of complementary classifiers is that each classifier can concentrate on its own small sub problem and together the single larger problem is better understood and solved. The heterogeneous classifiers, here, are generated by training the same classifier with different feature sets and tuning them to optimal values of their parameters. This procedure does away with the need for normalization of the confidence scores provided by different classifiers which do not tend to follow a common standard and depend of the algorithm. For example, in the MLP classifier used here, the last layer has each node containing a final score for one class. These scores can then be used for the rank level and decision level combination along with the maximum being chosen for the individual classifier decision.
In the next sub-section, the set of major classification algorithms evaluated in this paper are categorized into two approaches based on how the combination process is implemented. In the first approach, rule based combination practices are demonstrated that apply a given function to combine the classifier confidences into a single set of output scores. The second approach employs another classifier, called the ‘secondary’ classifier that operates on the outputs of the base classifier and automatically account for the strengths of the participants. The classification algorithm is trained on these confidence values with output classes same as the original pattern recognition problem. Essentially, both the approaches apply a function on the confidence score inputs, where the rule based functions are simpler operations like sum rule, max rule, etc. and classifiers like k-NN and MLP apply more complicated functions.

3.1. Rule Based Combination Techniques

Rules are applied on the abstract level, rank level and measurement level outputs from the classifiers to obtain a final set of confidence scores that can take into account the insights provided by the previous stage of classification. Elementary combination approaches like majority voting, Borda count, sum rule, product rule and the max rule come under this approach of classifier combination. DS theory of evidence is a relatively complex technique that is adopted for this purpose, utilising the rule of combination for information sources with the same frame of discernment.

3.1.1. Majority Voting

A straightforward voting technique is majority voting operating at the abstract level. It considers only the decision class provided by each classifier and chooses the most frequent class label among this set. In order to reduce the number of ties, the number of classifiers used for voting is usually odd.

3.1.2. Borda Count

Borda count is a voting technique on rank level [37]. For every class, Borda count adds the ranks in the n-best lists of each classifier so that for every output class the ranks across the classifier outputs get accumulated. The class with the most likely class label, contributes the highest rank number and the last entry has the lowest rank number. The final output label for a given test pattern X is the class with highest overall rank sum. In mathematical terms, this reads as follows: Let N be the number of classifiers and r i j the rank of class i in the n-best list of the j -th classifier. The overall rank r i of class i is thus given by
r i = j = 1 N r i j
The test pattern X is assigned the class i with the maximum overall rank count r i . Borda count is very simple to compute and requires no training. There is also a trainable variant that associates weights to the ranks of individual classifiers. The overall rank count for class i is then computed as given below
r i = j = 1 N w j r i j
The weights can be the performance of each individual classifier measured on a training or validation set.

3.1.3. Elementary Combination Approaches on Measurement Level

Elementary combination schemes on measurement level apply simple rules for combination, such as sum rule, product rule and max rule. Sum rule simply adds the score provided by each classifier from a set of classifier for every class and assigns the class label with the maximum score to the given input pattern. Similarly, product rule multiplies the score for every class and then outputs the class with the maximum score. The max rule predicts the output by the selecting the class corresponding to the maximum confidence value among all the participating classifiers’ output scores.
Interesting theoretical results, including error estimations, have been derived for these simple combination schemes. Kittler et al. showed that sum rule is less sensitive to noise than other rules [38]. Despite their simplicity, simple combination schemes have resulted in high recognition rates and shown comparable results to the more complex procedures.

3.1.4. Dempster-Shafer Theory of Evidence

The DS framework [39] is based on the view whereby propositions are represented as subsets of a given set W , referred to as a frame of discernment. Evidence can be associated to each proposition (subset) to express the uncertainty (belief) that has been observed or discerned. Evidence is usually computed based on a density function m called Basic Probability Assignment ( B P A ) and m ( p ) represents the belief exactly committed to the proposition p.
DS theory has an operation called Dempster’s rule of combination that aggregates two (or more) bodies of evidence defined within the same frame of discernment into one body of evidence. Let m 1 and m 2 be two B P A s defined in W . The new body of evidence is defined by the BPA m 1 , 2 as:
m 1 , 2 ( A ) = { 0 i f   A = 1 1 K B C = A m 1 ( B ) m 2 ( C ) i f   A
where, K = B C = m 1 ( B ) m 2 ( C ) and A is the intersection of subsets B and C .
In other words, the Dempster’s combination rule computes a measure of agreement between two bodies of evidence concerning various propositions determined from a common frame of discernment. The rule focuses only on those propositions that both bodies of evidence support.
The denominator is a normalization factor that ensures that m is a B P A , called the conflict. The Yagar’s modification of the DS theory [40] has been implemented in the paper with the normalizing factor as 1. This reduces some of the issues regarding the conflict factor.
Earlier, DS theory based combination has been applied on different fields like handwritten digit recognition [41], skin detection [42], 3D palm print recognition [43] among other pattern recognition domains.

3.2. Secondary Classifier Based Combination Techniques

The confidence values provided by the classifiers act as the feature set for the secondary classifier which acts on the second stage of the framework. With the training from the classifier scores, it learns to predict the outcome for a set of new confidence scores from the same set of classifiers. The advantage of using such a generic combinator is that it can learn the combination algorithm and can automatically account for the strengths and score ranges of the individual classifiers. For example, Dar-Shyang Lee [29] used a neural network to operate on the outputs of the individual classifiers and to produce the combined matching score. Apart from the neural network, other classifiers like k-NN, SVM and Random Forest have been fitted and tested in this paper.

4. Results and Interpretation

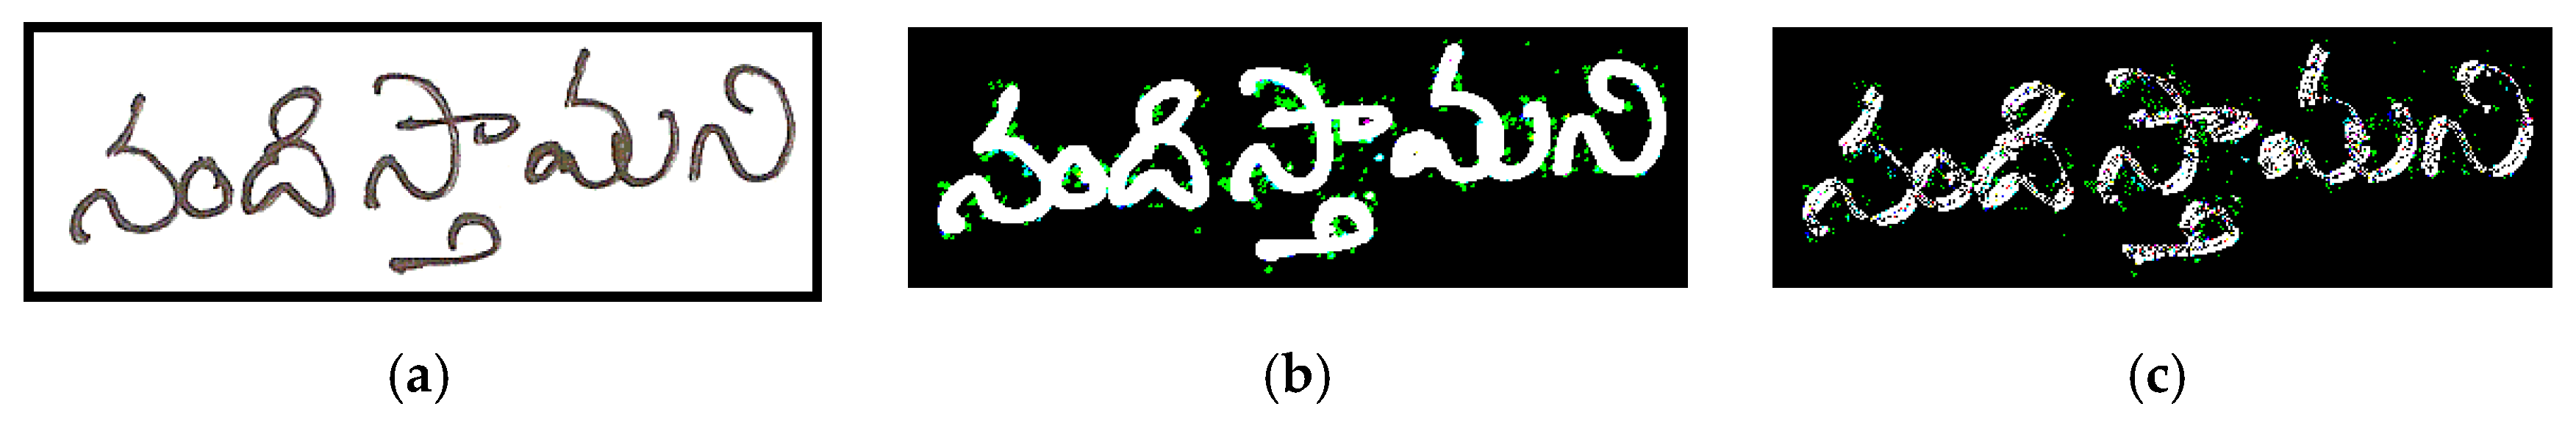
4.1. Preparation of Database

At present, no standard benchmark database of handwritten Indic scripts is freely available in the public domain. Hence, we have created our own database of handwritten documents in the laboratory. The document pages for the database were collected from different sources on request. Participants of this data collection drive were asked to write few lines on A-4 size pages. No other restrictions were imposed regarding the content of the textual materials. The documents were written in 12 official scripts of India. The document pages are digitized at 300 dpi resolution and stored as grey tone images. The scanned images may contain noisy pixels which are removed by applying Gaussian filter [33]. The text words are automatically extracted from the handwritten documents by using a page-to-word segmentation algorithm described in [44]. A sample snapshot of word images written in 12 different scripts is shown in Figure 7. Finally, a total of 7200 handwritten word images are prepared, with exactly 600 text words per script.
Our developed database has been named as CMATERdb8.4.1, where CMATER stands for ‘Centre for Microprocessor Applications for Training Education and Research,’ a research laboratory at Computer Science and Engineering Department of Jadavpur University, India, where the current database is prepared. Here, db symbolizes database, the numeric value 8 represents handwritten multi-script Indic image database and the value 4 indicates word-level. In the present work, the first version of CMATERdb8.4 has been released as CMATERdb8.4.1. The database is made freely available at https://code.google.com/p/cmaterdb/.

4.2. Performance Analysis

The classifier combination approaches, described above, are applied on a dataset of 7200 words divided into 12 classes with equal number of instances in each of them. 12 classes refer to the 12 Indic scripts that have been studied before and for which the MLP classifier results can be obtained with high accuracy. The classes numbered from A to L are Devanagari, Bangla, Oriya, Gujarati, Gurumukhi, Tamil, Telugu, Kannada, Malayalam, Manipuri, Urdu and Roman in that particular order.
First, the confusion matrix that is obtained from the MLP based classifier on the dataset by using MLG feature along with the overall accuracy is presented. Then, the result generated by the same classifier on the HOG and Elliptical feature sets applied on the same dataset is also presented. Results have been cross-validated for the classifier parameter values to obtain the optimal results for the dataset and the values are provided in the result section.
The MLG feature set consisting of 60 feature values for every input image is fed into the MLP classifier with 30 hidden layer neurons and a learning rate of 0.8. Here, 500 iterations are allowed with an error tolerance of 0.1. The overall accuracy obtained is 91.42% and the confusion matrix generated in this case is given in Table 1. The R column in the table refers to the rejection of the input by the recognition module but the class confidences that are associated with them get accounted for during the combination process.
The HOG feature set, consisting of 80 feature values for every input data, is fed into the MLP classifier with 40 hidden layer neurons and a learning rate of 0.8. Same error tolerance and the number of iterations, as applied in case of MLG features, are allowed here. A maximum recognition accuracy of 78.04% has been noted. The confusion matrix is shown in Table 2.
The Elliptical feature set containing 58 feature values derived from each image data forms the training set for the MLP classifier with 30 hidden neurons with a learning rate of 0.7. The error tolerance and number of iterations remain the same as the previous cases. An accuracy of 79.2% is achieved and represented in the confusion matrix given in Table 3.
Now, the confidence values provided to the classes for every input data by the classifiers on the three sets of features form the input for the classifier combination procedures. The confusion matrix resulting from the Majority voting procedure is presented in Table 4. An overall accuracy of 95.6% is achieved on this dataset containing 7200 samples divided equally among the 12 script classes. It is seen that Devanagari script has got the least accuracy and gets confused with Telugu whereas high accuracies are shown for Manipuri and Odia and Bangla.
Borda count algorithm gives an accuracy of 93.5% which is an increase of 2.1% over the best performing individual classifier. It provides the highest recognition rate for Devanagari among all the combination schemes and good accuracies for other popular scripts like Bangla and Odia and hence can be the preferred choice for wide usage. The trainable version of the algorithm with weights based on overall accuracy of the classifiers improves the results further. The increase is 2.9% with satisfactory results for scripts like Telugu, Kannada and Urdu. The accuracy for the Gurumukhi script remains low irrespective of the weights. The results are presented in Table 5 and Table 6.
The simple rules at the measurement level to combine the decisions provide good results in the present work. The sum rule attains an accuracy of 97.76% with almost close to perfect recognition for Urdu, Gurumukhi and Roman. The product rule and max rule have accuracies of 95.73% and 94.60% respectively. Highest accuracy is found for Odia script whereas product rule suffers in case of Gurumukhi and max rule in case of Devanagari. The results for the elementary rules of combination are tabulated in Table 7, Table 8 and Table 9.
Sum rule outperforms all other rule based combination approaches in this work and testifies the results presented by Kittler et al. mentioned in [38] by being less prone to noise and unclean data. The DS theory results combine the results, two at a time and then all three together. The class-wise performance based BPA, which outperforms the global performance based BPA, has been implemented for the multi-classifier combination using the DS theory [45]. The rule applied for this process is quasi-associative and hence the results of combining two sources cannot be combined with the third. The rule has to be extended to include all the three sources together. Results for the combination of the classifier results on HOG and Elliptical features, MLG and Elliptical features, and, HOG and MLG features are presented in Table 10, Table 11 and Table 12respectively. The combination result including all the three sources of information is given in Table 13.
There is no improvement shown by the combination of the results from MLG and HOG feature sets. But when the Elliptical feature set is involved in the combination process there is much improvement over the participating classifiers. Overall accuracies of 91.2% and 97.04% are achieved by combining sources having 78.1% and 79.4% accuracies and 91.4% and 79.4% accuracies respectively. So, improvements of 6% and 10% are found by applying the DS theory of evidence. Combining all three, an accuracy of 95.64%, more than 4% over the better performing classifier is seen. In both the schemes all the script classes have accuracies over 90% and with almost 100% accuracy for certain scripts like Manipuri, Gujarati and Urdu, thus proving to be the model to be used where these scripts are widely used.
In order to understand why the results from the Elliptical feature set combine so well with the two other feature sets, correlation analysis is performed on the confidence score outputs. Spearman rank correlation is done on the rank level information provided by the classifiers to arrive at mean values for the measure of the correlation. HOG and MLG show an index of 0.619 which is almost the double of the scores obtained by comparing the Elliptical features with these two. With values of 0.32 and 0.27, the low correlation index is an indication of better possibilities for the combination processes. Thus, complementary information is provided by the output of Elliptical feature set which helps in the improvement the overall combined accuracy.
Secondary classifiers are applied to learn the patterns from the primary classifier outputs and develop a way to combine them. The confidence scores from the three sources are concatenated to form a larger training set with its correct label. This set is the new feature set which undergoes classification using well-known algorithms. Classifiers like k-NN, Logistic Regression, MLP and Random Forest are applied to report final results which are tabulated in Table 14, Table 15, Table 16 and Table 17 respectively. The results are reported after 3-fold cross validation and tuning of the parameters involved. This process is computationally costly and takes a processing step along with much higher complexity but is compensated by the high accuracy results that are obtained. 3-NN provides an accuracy of 98.30%, Random Forest classified 98.33% of the 7200 samples correctly and Logistic Regression attained 98.48% accuracy. Using MLP again as the secondary classifier, 98.36% accuracy is obtained. Devanagari is the most confused script in all the cases but still has accuracy over 95%. The other scripts are predicted to almost certainty.
Script recognition is a difficult task given the variation in the words for a particular script. But the results are really encouraging for building a model that can identify the script with certainty. The results obtained after the combination exceeds the reported accuracies for this certain task and hence set the new benchmark. Table 18 provides the class wise accuracy along with the overall accuracy achieved by each procedure used in the paper. It shows that the Logistic Regression classifier acting on the MLP classifier outputs provide the best result where 98.45% accuracy is obtained with an improvement of 7.05%. Results are also obtained from the feature level combination. Natural combination or concatenation of two features at a time and all three together are done. The new feature set formed in each case undergoes the same process of classification through the MLP classifier. The comprehensive results for comparison are given in the following Table 19.

5. Conclusions

This is the first application of classifier combination approaches in the domain of script recognition considering the number of scripts being undertaken and the range of classifier combination procedures that are evaluated. Combination is performed at the feature level as well as decision level using abstract level, rank level and measurement level information provided by the classifiers. Encouraging results are obtained from the experiments. High accuracies in the range of 95–98% have been achieved by using combination techniques as shown in the previous Result section. There is an increase of over 7% with the best performing MLP classifier when Logistic Regression is used as the secondary classifier for 7200 samples from 12 different scripts. So, this model proves to be useful for this complex pattern recognition problem and makes a better decision based on the information provided by the base classifier.
Though, in the present work, three sources of information with different feature sets have been combined using their respective classifier results but this process can be extended to include more input sources along with different classifier. With the increase in the number of sources, an intelligent and dynamic selection procedure needs to be employed in order to facilitate combination in a more meaningful way. The combination being an overhead to the classification task, it is important to develop methods that can indicate if the combination would work or not qualitatively. In future, the work can be extended for a larger dataset so that the robustness of the procedures can be established. The script recognition system here is a general framework which can be applied to other similar pattern recognition tasks like block and line level recognition of scripts to establish its usefulness in document analysis research.

Acknowledgments

The authors are thankful to the Center for Microprocessor Application for Training Education and Research (CMATER) and Project on Storage Retrieval and Understanding of Video for Multimedia (SRUVM) of Computer Science and Engineering Department, Jadavpur University, for providing infrastructure facilities during progress of the work. The authors of this paper are also thankful to all those individuals who willingly contributed in developing the handwritten Indic script database used in the current research.

Author Contributions

Anirban Mukhopadhyay and Pawan Kumar Singh conceived and designed the experiments; Anirban Mukhopadhyay performed the experiments; Anirban Mukhopadhyay and Pawan Kumar Singh analyzed the data; Ram Sarkar amd Mita Nasipuri contributed reagents/materials/analysis tools; Anirban Mukhopadhyay and Pawan Kumar Singh wrote the paper.

Conflicts of Interest

The authors declare no conflict of interest. The founding sponsors had no role in the design of the study; in the collection, analyses, or interpretation of data; in the writing of the manuscript and in the decision to publish the results.

References

  1. Singh, P.K.; Sarkar, R.; Nasipuri, M. Offline Script Identification from Multilingual Indic-script Documents: A state-of-the-art. Comput. Sci. Rev. 2015, 15–16, 1–28. [Google Scholar] [CrossRef]
  2. Ubul, K.; Tursun, G.; Aysa, A.; Impedovo, D.; Pirlo, G.; Yibulayin, T. Script Identification of Multi-Script Documents: A Survey. IEEE Access 2017, 5, 6546–6559. [Google Scholar] [CrossRef]
  3. Spitz, A.L. Determination of the script and language content of document images. IEEE Trans. Pattern Anal. Mach. Intell. 1997, 19, 234–245. [Google Scholar] [CrossRef]
  4. Tan, T.N. Rotation Invariant Texture Features and their use in Automatic Script Identification. IEEE Tran. Pattern Anal. Mach. Intell. 1998, 20, 751–756. [Google Scholar] [CrossRef]
  5. Hochberg, J.; Kelly, P.; Thomas, T.; Kerns, L. Automatic script identification from document images using cluster-based templates. IEEE Trans. Pattern Anal. Mach. Intell. 1997, 19, 176–181. [Google Scholar] [CrossRef]
  6. Hochberg, J.; Bowers, K.; Cannon, M.; Keely, P. Script and language identification for hand-written document images. IJDAR 1999, 2, 45–52. [Google Scholar] [CrossRef]
  7. Wood, S.; Yao, X.; Krishnamurthi, K.; Dang, L. Language identification for printed text independent of segmentation. In Proceedings of the International Conference on Image Processing, Washington, DC, USA, 23–26 October 1995; pp. 428–431. [Google Scholar]
  8. Chaudhuri, B.B.; Pal, U. An OCR system to read two Indian language scripts: Bangla and Devnagari (Hindi). In Proceedings of the 4th IEEE International Conference on Document Analysis and Recognition (ICDAR), Ulm, Germany, 18–20 August 1997; pp. 1011–1015. [Google Scholar]
  9. Pal, U.; Sinha, S.; Chaudhuri, B.B. Word-wise Script identification from a document containing English, Devnagari and Telgu Text. In Proceedings of the -Second National Conference on Document Analysis and Recognition, PES, Mandya, Karnataka, India, 11–12 July 2003; pp. 213–220. [Google Scholar]
  10. Chaudhury, S.; Harit, G.; Madnani, S.; Shet, R.B. Identification of scripts of Indian languages by Combining trainable classifiers. In Proceedings of the Indian Conference on Computer Vision, Graphics and Image Processing, Bangalore, India, 20–22 December 2000; pp. 20–22. [Google Scholar]
  11. Das, A.; Ferrer, M.; Pal, U.; Pal, S.; Diaz, M.; Blumenstein, M. Multi-script vs. single-script scenarios in automatic off-line signature verification. IET Biom. 2016, 5, 305–313. [Google Scholar] [CrossRef]
  12. Diaz, M.; Ferrer, M.A.; Sabourin, R. Approaching the Intra-Class Variability in Multi-Script Static Signature Evaluation. In Proceedings of the 23rd International Conference on Pattern Recognition (ICPR), Cancun, Mexico, 4–8 December 2016; pp. 1147–1152. [Google Scholar]
  13. Padma, M.C.; Vijaya, P.A. Global Approach for Script Identification using Wavelet Packet Based Features. Int. J. Signal Process. Image Process. Pattern Recognit. 2010, 3, 29–40. [Google Scholar]
  14. Hiremath, P.S.; Shivshankar, S.; Pujari, J.D.; Mouneswara, V. Script identification in a handwritten document image using texture features. In Proceedings of the 2nd IEEE International Conference on Advance Computing, Patiala, India, 19–20 February 2010; pp. 110–114. [Google Scholar]
  15. Pati, P.B.; Ramakrishnan, A.G. Word level multi-script identification. Pattern Recognit. Lett. 2008, 29, 1218–1229. [Google Scholar] [CrossRef]
  16. Dhanya, D.; Ramakrishnan, A.G.; Pati, P.B. Script identification in printed bilingual documents. Sadhana 2002, 27, 73–82. [Google Scholar] [CrossRef]
  17. Chanda, S.; Pal, S.; Franke, K.; Pal, U. Two-stage Approach for Word-wise Script Identification. In Proceedings of the 10th IEEE International Conference on Document Analysis and Recognition (ICDAR), Barcelona, Spain, 26–29 July 2009; pp. 926–930. [Google Scholar]
  18. Pal, U.; Chaudhuri, B.B. Identification of different script lines from multi-script documents. Image Vis. Comput. 2002, 20, 945–954. [Google Scholar] [CrossRef]
  19. Pal, U.; Sinha, S.; Chaudhuri, B.B. Multi-Script Line identification from Indian Documents. In Proceedings of the 7th IEEE International Conference on Document Analysis and Recognition (ICDAR), Edinburgh, UK, 6 August 2003; pp. 880–884. [Google Scholar]
  20. Singh, P.K.; Chatterjee, I.; Sarkar, R. Page-level Handwritten Script Identification using Modified log-Gabor filter based features. In Proceedings of the 2nd IEEE International Conference on Recent Trends in Information Systems (ReTIS), Kolkata, India, 9–11 July 2015; pp. 225–230. [Google Scholar]
  21. Singh, P.K.; Sarkar, R.; Nasipuri, M.; Doermann, D. Word-level Script Identification for Handwritten Indic scripts. In Proceedings of the 13th IEEE International Conference on Document Analysis and Recognition (ICDAR), Tunis, Tunisia, 23–26 August 2015; pp. 1106–1110. [Google Scholar]
  22. Singh, P.K.; Das, S.; Sarkar, R.; Nasipuri, M. Line Parameter based Word-Level Indic Script Identification System. Int. J. Comput. Vis. Image Process. 2016, 6, 18–41. [Google Scholar] [CrossRef]
  23. Nadal, C.; Legault, R.; Suen, C.Y. Complementary algorithms for the recognition of totally uncontrained handwritten numerals. In Proceedings of the 10th International Conference on Pattern Recognition, Atlantic City, NJ, USA, 16–21 June 1990; Volume A, pp. 434–449. [Google Scholar]
  24. Suen, C.Y.; Nadal, C.; Mai, T.; Legault, R.; Lam, L. Recognition of totally unconstrained handwritten numerals based on the concept of multiple experts. In Proceedings of the International Workshop on Frontiers in Handwriting Recognition, Montreal, QC, Canada, 2–3 April 1990; pp. 131–143. [Google Scholar]
  25. Ho, T.K. A Theory of Multiple Classifier Systems and Its Application to Visual Word Recognition. Ph.D. Thesis, State University of New York, Buffalo, NY, USA, 1992. [Google Scholar]
  26. Ho, T.K.; Hull, J.J.; Srihari, S.N. Decision combination in multiple classifier systems. IEEE Trans. Pattern Anal. Mach. Intell. 1994, 16, 66–75. [Google Scholar]
  27. Xu, L.; Krzyzak, A.; Suen, C. Methods of combining multiple classifiers and their applications to handwritten recognition. IEEE Trans. Syst. Man Cybern. 1992, 22, 418–435. [Google Scholar] [CrossRef]
  28. Mandler, E.; Schuerman, J. Pattern Recognition and Artificial Intelligence; North-Holland: Amsterdam, The Netherlands, 1988. [Google Scholar]
  29. Lee, D. A Theory of Classifier Combination: The Neural Network Approach. Ph.D. Thesis, State University of New York, Buffalo, NY, USA, 1995. [Google Scholar]
  30. Singh, P.K.; Mondal, A.; Bhowmik, S.; Sarkar, R.; Nasipuri, M. Word-level Script Identification from Multi-script Handwritten Documents. In Proceedings of the 3rd International Conference on Frontiers in Intelligent Computing Theory and Applications (FICTA); Springer: Cham, Switzerland, 2014; AISC Volume 1, pp. 551–558. [Google Scholar]
  31. Dalal, N.; Triggs, B. Histograms of Oriented Gradients for Human Detection. In Proceedings of the IEEE Computer Society Conference on Computer Vision and Pattern Recognition (CVPR), San Diego, CA, USA, 20–25 June 2005; pp. 886–893. [Google Scholar]
  32. Daugman, J.G. Uncertainty relation for resolution in space, spatial-frequency and orientation optimized by two-dimensional visual cortical filters. J. Opt. Soc. Am. 1985, 2, 1160–1169. [Google Scholar] [CrossRef]
  33. Gonzalez, R.C.; Woods, R.E. Digital Image Processing; Prentice-Hall: India, 1992; Volume I. [Google Scholar]
  34. Singh, P.K.; Sarkar, R.; Nasipuri, M. Correlation Based Classifier Combination in the field of Pattern Recognition. Comput. Intell. 2017. [Google Scholar] [CrossRef]
  35. Tulyakov, S.; Jaeger, S.; Govindaraju, V.; Doermann, D. Review of classifier combination methods. In Machine Learning in Document Analysis and Recognition; Springer: Berlin/Heidelberg, Germany, 2008; pp. 361–386. [Google Scholar]
  36. Kittler, J. Combining Classifiers: A Theoretical Framework. Pattern Anal. Appl. 1998, 1, 18–27. [Google Scholar] [CrossRef]
  37. Van Erp, M.; Vuurpijl, L.G.; Schomaker, L. An Overview and Comparison of Voting Methods for Pattern Recognition. In Proceedings of the 8th International Workshop on Frontiers in Handwriting Recognition (IWFHR-8), Niagara-on-the-Lake, ON, Canada; 2002; pp. 195–200. [Google Scholar]
  38. Kittler, J.; Hatef, M.; Duin, R.; Matas, J. On combining classifiers. IEEE Trans. Pattern Anal. Mach. Intell. 1998, 20, 226–239. [Google Scholar] [CrossRef]
  39. Shafer, G. A Mathematical Theory of Evidence; Princeton University Press: Princeton, NJ, USA, 1976. [Google Scholar]
  40. Yager, R.R. On the Dempster-Shafer framework and new combination rules. Inf. Sci. 1987, 41, 93–137. [Google Scholar] [CrossRef]
  41. Basu, S.; Sarkar, R.; Das, N.; Kundu, M.; Nasipuri, M.; Basu, D.K. Handwritten Bangla Digit Recognition Using Classifier Combination through DS Technique. In Proceedings of the 1st International Conference on Pattern Recognition and Machine Intelligence (PReMI), Kolkata, India, 20–22 December 2005; pp. 236–241. [Google Scholar]
  42. Shoyaib, M.; Abdullah-Al-Wadud, M.; Chae, O. A Skin detection approach based on the Dempster-Shafer theory of evidence. Int. J. Approx. Reason. 2012, 53, 636–659. [Google Scholar] [CrossRef]
  43. Ni, J.; Luo, J.; Liu, W. 3D Palmprint Recognition Using Dempster-Shafer Fusion Theory. J. Sens. 2015, 2015, 7. [Google Scholar] [CrossRef]
  44. Singh, P.K.; Chowdhury, S.P.; Sinha, S.; Eum, S.; Sarkar, R. Page-to-Word Extraction from Unconstrained Handwritten Document Images. In Proceedings of the 1st International Conference on Intelligent Computing and Communication (ICIC2); Springer: Singapore, 2016; AISC Volume 458, pp. 517–524. [Google Scholar]
  45. Zhang, B.; Srihari, S.N. Class-wise multi-classifier combination based on Dempster-Shafer theory. In Proceedings of the 7th IEEE International Conference on Control, Automation, Robotics and Vision (ICARCV 2002), Singapore, 2–5 December 2002; Volume 2. [Google Scholar]
Figure 1. Schematic diagram of the proposed methodology.
Jimaging 04 00039 g001
Figure 2. Illustration of fitting (a) an imaginary ellipse inside the minimum boundary box which divides a Bangla handwritten word image in 8 regions as shown in (b).
Jimaging 04 00039 g002
Figure 3. Figure showing the elliptical partition of four regions on a sample handwritten Devanagari word image.
Jimaging 04 00039 g003
Figure 4. Illustration of: (a) handwritten Telugu word image, (b) its magnitude part and (c) its direction part.
Jimaging 04 00039 g004
Figure 5. Output word images of Modified log-Gabor filter transform on a sample handwritten Bangla word image (shown on left-side) for 5 different scales and 6 different orientations (the first row shows the output for n o = 0 0 and five scales, the second row shows the output for n o = 30 0 and five scales and so on).
Jimaging 04 00039 g005
Figure 6. Classifier combination takes a set of s i j score for class i by classifier j and produces combination scores S i for each class i [34].
Jimaging 04 00039 g006
Figure 7. Sample word images written in 12 different Indian scripts.
Jimaging 04 00039 g007
Table 1. Classification results for HOG feature set with MLP Classifier.
ClassABCDEFGHIJKLR
Class
A34596221321644227044727
B2754807901010700
C005570613119210138
D384051633409020310
E106112449265200137630
F300233464173336614127
G272151012164463412124110
H100271716418420281114838
I38241601034334550800
J001707001605531638
K386535221442310240412
L2214615241901355090
Table 2. Classification results for MLG feature set with MLP Classifier.
ClassABCDEFGHIJKLR
Class
A5280213111995012100
B0576060000003151
C105960001110002
D2905740000100140
E000059260100010
F00201655302009004
G409301528152601047
H705053085121618812
I12071001225600420
J0000340505880019
K193172024240527113
L322529249421184134480
Table 3. Classification results for Elliptical feature set with MLP Classifier.
ClassABCDEFGHIJKLR
Class
A3552949480253442106292
B25500701320000827
C270479811921131181332
D3290514013230324066
E66121441424710204296
F96361563971641912141255
G5513754617402131922125
H25023026049128104117
I702333387349310490
J0010165229553662
K20167171202754608
L822106620136915080
Table 4. Classification results after combination using Majority voting procedure.
ClassABCDEFGHIJKL
Class
A53423103216713055
B15900300000006
C00597002001000
D23059000000023
E01005912000105
F1205013561171000
G206451554147340
H40431605677251
I91120172572050
J00102003059400
K402541104105672
L021036211153566
Table 5. Classification results after combination using Borda count procedure without weight.
ClassABCDEFGHIJKL
Class
A56705700547032
B165800400000000
C10586005043001
D251057200000011
E60004661080111008
F160207571011101
G2504202548310150
H3005002105336014
I390210266540040
J00202007058900
K500300120105790
L401022401333568
Table 6. Classification results after combination using Borda count procedure using weight.
ClassABCDEFGHIJKL
Class
A56304700867032
B145820400000000
C00586005053001
D152058000000021
E50004661020172008
F130006576021101
G1403201558310180
H2205001405466016
I300210165551040
J00202006059000
K20020090005870
L401012401233570
Table 7. Classification result after combination using Sum rule.
ClassABCDEFGHIJKL
Class
A54914601131011032
B35890200000015
C00597001011000
D13059300000003
E00005952000003
F60208576070001
G305310568103250
H20200505824131
I160110163569030
J00000001059900
K00022053005880
L10613000132583
Table 8. Classification result after combination using Product rule.
ClassABCDEFGHIJKL
Class
A56604600669012
B75840800001000
C00597002001000
D52059100000011
E40004679701020713
F80005582030101
G50220157831080
H1204001505624003
I310000182556020
J00101004059400
K20010040005930
L20200101023589
Table 9. Classification result after combination using Max rule.
ClassABCDEFGHIJKL
Class
A512641342171317084
B15870300200007
C00599010000000
D25058000203035
E110456630101023
F7060105562122113
G31654155387480
H304415056611231
I81112165569051
J00101004059400
K31456456105641
L03395222252565
Table 10. Classification results after combination using DS theory for HOG and Elliptical features.
ClassABCDEFGHIJKL
Class
A512641342171317084
B15870300200007
C00599010000000
D25058000203035
E110456630101023
F7060105562122113
G31654155387480
H304415056611231
I81112165569051
J00101004059400
K31456456105641
L03395222252565
Table 11. Classification results after combination using DS theory for Elliptical and MLG features.
ClassABCDEFGHIJKL
Class
A56403801748005
B05930100000006
C00600000000000
D07059000100002
E10005898010100
F00005580170412
G504300563310381
H301011605677212
I60102021583212
J00000000060000
K10100050105920
L36337042222566
Table 12. Classification results after combination using DS theory for HOG and MLG features.
ClassABCDEFGHIJKL
Class
A511241251191912087
B65730520000059
C10590011052000
D44058000102045
E311654060100339
F7050185491180200
G71752053021111132
H100106813452411572
I26124001711535040
J00305009058003
K223411311511325223
L3119812412263539
Table 13. Classification results after combination using DS theory for Elliptical, HOG and MLG features.
ClassABCDEFGHIJKL
Class
A5481573112512024
B45840500000016
C00598000011000
D52059200000001
E0105548220312315
F101205572160102
G100333055697180
H80402805684141
I1711200123561030
J00001002059700
K60120270005820
L21542020031580
Table 14. Classification results using 3-NN secondary classifier.
ClassABCDEFGHIJKL
Class
A57313500853011
B15970200000000
C10598000001000
D12059500000002
E00005991000000
F00004590050001
G71530057115160
H20000915851020
I110200000586010
J00000002059800
K10001040005940
L10301101010592
Table 15. Classification results using Logistic Regression secondary classifier.
ClassABCDEFGHIJKL
Class
A58301200542012
B05980200000000
C10598000001000
D12059400010002
E10005953000001
F00004589051001
G40320057823080
H30000615861012
I60100023587010
J00000201059601
K10000050005940
L10102021000593
Table 16. Classification results using MLP secondary classifier.
ClassABCDEFGHIJKL
Class
A57512400444024
B15970200000000
C10598000001000
D32059400010000
E00005991000000
F00002594030001
G71213057702160
H40001715831102
I70210030586010
J00100000059900
K00000070005930
L10004010000594
Table 17. Classification results using Random Forest secondary classifier.
ClassABCDEFGHIJKL
Class
A58103200814001
B05970200100000
C10595000201001
D22059300000003
E00005982000000
F00007585060101
G30410058512040
H40200805821012
I90100032584010
J00000202059501
K00000060005931
L10401001010592
Table 18. Class-wise percentage accuracy for the classifier combination methods.
ClassAbstract LevelRank LevelMeasurement Level Combination RulesDS Theory of Evidence Secondary Classifier
Majority VotingBorda CountSum RuleProduct RuleMax RuleDS with 2 SourcesDS with 3 Sources3-NNRandom ForestMLPLogistic Regression
A89.093.891.594.385.394.091.395.596.896.597.1
B98.397.098.297.397.898.897.399.599.599.899.6
C99.597.799.599.599.8100.099.699.699.199.599.6
D98.396.798.898.596.698.398.699.198.898.899.0
E98.577.799.177.894.398.191.399.899.699.599.1
F93.596.096.097.092.696.695.398.397.598.198.1
G92.393.094.696.392.193.892.695.197.595.596.3
H94.591.097.093.694.394.594.697.597.097.197.6
I95.391.894.892.694.897.193.597.697.397.697.8
J99.098.399.899.099.0100.099.599.699.199.599.3
K94.597.898.098.894.098.697.099.098.899.599.0
L94.395.097.298.194.194.396.698.698.698.698.8
Overall95.694.397.895.794.697.095.698.398.398.398.5
Table 19. Final combination results at feature level.
Feature/MethodologyRecognition Accuracy (%)
MLG91.42
HOG78.04
Elliptical79.57
MLG + HOG86.03
HOG + Elliptical86.57
MLG + Elliptical93.44
MLG + HOG + Elliptical91.03
Best result after classifier combination98.45

