Article

Stochastic Capsule Endoscopy Image Enhancement

1
Department of Computer Science, Norwegian University of Science and Technology, 2815 Gjøvik, Norway
2
Department of Gastroenterology, Innlandet Hospital Trust, Institute of Clinical Medicine, University of Oslo, 0315 Oslo, Norway
3
Department of Information Security and Communication Technology Norwegian University of Science and Technology, 2815 Gjøvik, Norway
*
Author to whom correspondence should be addressed.
J. Imaging 2018, 4(6), 75; https://doi.org/10.3390/jimaging4060075
Submission received: 25 March 2018 / Revised: 16 May 2018 / Accepted: 29 May 2018 / Published: 6 June 2018
(This article belongs to the Special Issue Computational Colour Imaging)

Abstract

:
Capsule endoscopy, which uses a wireless camera to take images of the digestive tract, is emerging as an alternative to traditional colonoscopy. The diagnostic values of these images depend on the quality of revealed underlying tissue surfaces. In this paper, we consider the problem of enhancing the visibility of detail and shadowed tissue surfaces for capsule endoscopy images. Using concentric circles at each pixel for random walks combined with stochastic sampling, the proposed method enhances the details of vessel and tissue surfaces. The framework decomposes the image into two detailed layers that contain shadowed tissue surfaces and detail features. The target pixel value is recalculated for the smooth layer using similarity of the target pixel to neighboring pixels by weighting against the total gradient variation and intensity differences. In order to evaluate the diagnostic image quality of the proposed method, we used clinical subjective evaluation with a rank order on selected KID image database and compared it to state-of-the-art enhancement methods. The result showed that the proposed method provides a better result in terms of diagnostic image quality and objective quality contrast metrics and structural similarity index.

1. Introduction

Capsule video endoscopy (CVE) has revolutionized the diagnostic work-up in the field of esophagus, small bowel and colon imaging. The colon traditionally has been examined via optical colonoscopy, a procedure perceived by many to be uncomfortable and embarrassing. Colon capsule endoscopy (CCE) is an alternative way to visualize the colon. Some commercially available CCE devices include PillCam COLON I and II from Given Imaging. CCE devices are equipped with a miniaturized camera, LED light source, radio transmitter and battery contained in an easy-to-swallow capsule. Unfortunately, due to power and volume limitations, capsule endoscopy does not provide image quality equivalent to traditional colonoscopy. As the capsule progresses though the colon by peristalsis of the digestive tract, orientation of the capsule is uncontrolled and images are taken under low illumination. In addition, CCE images suffer from high compression ratio, noise from CMOS (complementary metal-oxide semiconductor) image sensor and low image resolution (commonly 256 × 256). The problem of capsule image quality enhancement has been an active research topic since capsules appeared commercially in 2006. The present review here is brief due to space limitations, but is intended to highlight the broad categories of existing algorithms and to provide appropriate background for our work.
We categorize CVE image enhancement techniques based on particular image attributes which is the focus for accurate diagnosis of pathologies. Regardless of the specific method, the goals of any CVE image enhancement techniques can be categorized into four main objectives: making blood vessels visible; removing or de-emphasizing specular reflections and illumination variation; making tissues visible; keeping the original color tone (because where the colors are changed, the physician requires re-training to view such images [1]).
Works on blood vessel detail enhancement mostly focus on exploiting optical properties of blood vessels for enhancement of lesions and vascular patterns. For example, the 415 nm image channel analyzes the fine surface architecture of the mucosa and the superficial capillary network, whilst the 540 nm image channel analyzes the collective vessels in the depth of the mucosa. Flexible spectral imaging color enhancement (FICE) [2] takes white-light endoscopic images from the video processor and processes them by emphasizing certain ranges of wavelengths by spectral decompositions. On the other hand, Narrow Band Imaging (NBI) [3] uses a special set of filters that are interposed after the light source to restrict the incident light to two narrow bands of wavelengths (blue centered on 415 nm and green centered on 540 nm).
The other topic discussed in the literature is illumination variation across the image. The amount of illumination from point sources incident on the scene being viewed changes slower than the reflectance. Using this concept, Ramaraj et al. [4], proposed a homomorphic filtering technique. By applying frequency domain transformation to the input image using DFT and appropriate design of Butterworth filter they claimed to obtain an enhancement result compared to contrast limited adaptive histogram equalization (CLAHE) [5]. More recently, Okuhata et al. [6] applied retinex theory to the problem of CVE image enhancement  [7]. The authors modelled the problem with a total variational model algorithm that was constructed to minimize the cost function in terms of reflectance and illuminance images. On the other hand, in order to make tissue details visible, many methods have been proposed to deal with image denoising and contrast enhancement. Palanisamy et al.  [8] proposed CVE image denoising using dual tree double density complex wavelet transform. By thresholding the wavelet coefficients in all sub bands based on a maximum a posteriori probability estimator, the algorithm calculated the denoised image. Liu et al.  [9] proposed CVE image de-blurring using total variation minimization. By incorporating the monotone fast iterative shrinkage or thresholding algorithm (MFISTA) combined with the fast gradient projection algorithm (proposed recently by Beck et al. [10]) total variation deblurring was extended to deal with multichannel (e.g., color) images for CVE. Considering the importance of color for the assessment of abnormalities, contrast enhancement should also preserve the color tones of CVE images. Vu et al. [11] proposes image enhancement techniques that can preserve the original color tones. This work is based on the idea that the color gamut of the human small bowel is generally restricted to a subspace of the imaging system’s color space (e.g., 24 bit RGB), and which is more specific than that of typical natural images. Theoretically, an image is considered more informative if its histogram resembles a uniform distribution over a color space. Therefore, to preserve the original color tones, a histogram equalization technique is applied in the proposed gastro-intestine color space. Similarly, Imtiaz et al. [12] proposed endoscopic image enhancement using an adaptive sigmoidal function and space-variant color reproduction. By using texture information, a new chrominance component was generated modifying the old chrominance component. The method was claimed to highlight some of the tissue and vascular patterns. Other works on tissue detail enhancement include that by Li et al. [13], in which they propose enhancement via adaptive contrast diffusion. This was done by applying diffusion in the contrast domain through eigenvalues of the Hessian at the target pixel.
In addition, several image and video processing algorithms (not tailored for a specific CVE platform) have been proposed to enhance CVE images. Attar et al. [14] combined histogram equalization with an edge preserving process to enhance WCE images. Other similar works include [5,15,16]. Among recent computational methods that are proposed for capsule endoscopy image enhancement include Rukundo et al. [17], where the authors proposed an algorithm that uses a half-unit weighted-bilinear filter for darker areas and threshold weighted-bilinear method to avoid overexposure and enlargement of specular highlight spots while preserving the hue. Moreover, in order to deal with uneven illumination and poor contrast and to reduce highlighted areas as much as possible, gamma correction, masking and histogram equalization, which are categorized into an image enhancement technique, can be found in the literature.
To summarize, most of the methods proposed for CVE image enhancement repurpose existing methods of natural image enhancement and fail to preserve detailed texture for different segment of CVE images. In addition, they address the four requirements that we discussed earlier as separate and independent problems.
This paper is based on previous works by Kolås et al. [18], Black et al. [19] and Estrada et al. [20]. Kolås et al. [18] proposed a framework based on stochastic sampling for each pixel in the local neighborhood, where the local reference lightness and darkness points in each chromatic channel are calculated to find an average estimate of the target pixel. On the other hand Black et al. [19] introduced connection between random walks and robust anisotropic diffusion. Following that line, Azzabou et al. [21] proposed random walks for image denoising on similar structures by recovering probabilistic densities, capturing co-occurrences of visual appearances at scale spaces. Similarly, Estrada et al. [20] proposed image denoising based on random walks across (unlike Azzabou et al. [21]) arbitrary neighborhoods surrounding a given pixel. The size and shape of each neighborhood was determined by the configuration and similarity of nearby pixels. By noting the connection between stochastic sampling and random walks, the contribution of this work can be summarized as follows. Firstly, we propose a method that can enhance shadows and detail structures for CVE images. Using concentric circles for random walks and stochastic sampling, the proposed method captures similar structures, together with local reference lightness and darkness points, simultaneously. The second contribution, which is part of the detail enhancement, is edge-aware smoothing that is based on the similarity of the target and neighboring pixels. This is estimated based on a new weighting function of total gradient variation and intensity difference.
The outline of the article is as follows: in Section 2, we re-visit the subjects of random walks and stochastic sampling. In Section 3, we present our approach and a detailed theoretical and numerical derivation. In Section 4, we present implementation and pseudocode of the proposed method. In Section 5, we evaluate the framework’s results both subjectively and with objective metrics, along with comparison to other works. Finally, in Section 6 we present discussion and conclusion, respectively.

2. Background

2.1. Edge-Aware Smoothing and Random Walks

Image enhancement can be achieved by a two-step process. First, the original image is decomposed into a base layer (smooth) and detail layers. In the second step, the base layer and the detail exaggerated layers are combined to give the final output image. This approach relies on accurate edge preserving smoothing for estimating the base layer [22]. Some previous edge preserving smoothing methods suffer from halo artifacts when they are applied for image enhancement [23]. Earlier works in edge-aware smoothing include diffusion process [24]. Given a heat equation, described by I x , y , t / t = d i v c x , y , t I and I x , y , 0 is the original image at time t = 0 , I is the image gradient and c x , y , t is a constant conduction coefficient. By modifying the original formulation to include a variable conduction coefficient c x , y , t = g I where g is a monotonically decreasing function, they showed that edge aware smoothing could be obtained. Despite numerous advantages, theoretical justification [19], and numerous provisions of such a method, one can claim that it can not deal with image textures [21]. Following this work many alternative formulation of diffusion process have been formulated using a total variation approach [25] and iterative wavelet shrinkage [26,27]. Fattal et al. [28] proposed using bilateral filtering to compute the smooth layer. Bilateral filtering provides an alternative approach to edge-aware image smoothing. It uses a local, non-iterative, explicit, data dependent filter. Farbman et al. [29] propose to perform edge-preserving smoothing using the weighted least square (WLS) framework. WLS computes the smooth component of the input image by optimizing a quadratic energy based on squared gradients with spatially-varying weights and solving a large linear system. The most interesting alternative formulation of edge-aware filtering for our current work involves random walks [19,20,21]. Black et al. [18] points out a connection between random walks in neighborhoods and robust anisotropic diffusion. Consider image intensity difference between target pixel s and neighboring pixel p. Within piecewise constant image regions, these neighbor differences will be small, zero-mean, and normally distributed. Hence, an optimal estimator for the “true” value of the image intensity s is equivalent to choosing the mean of the neighboring intensity values. The neighbor differences will not be normally distributed, however, for an image region that includes a boundary (intensity discontinuity).

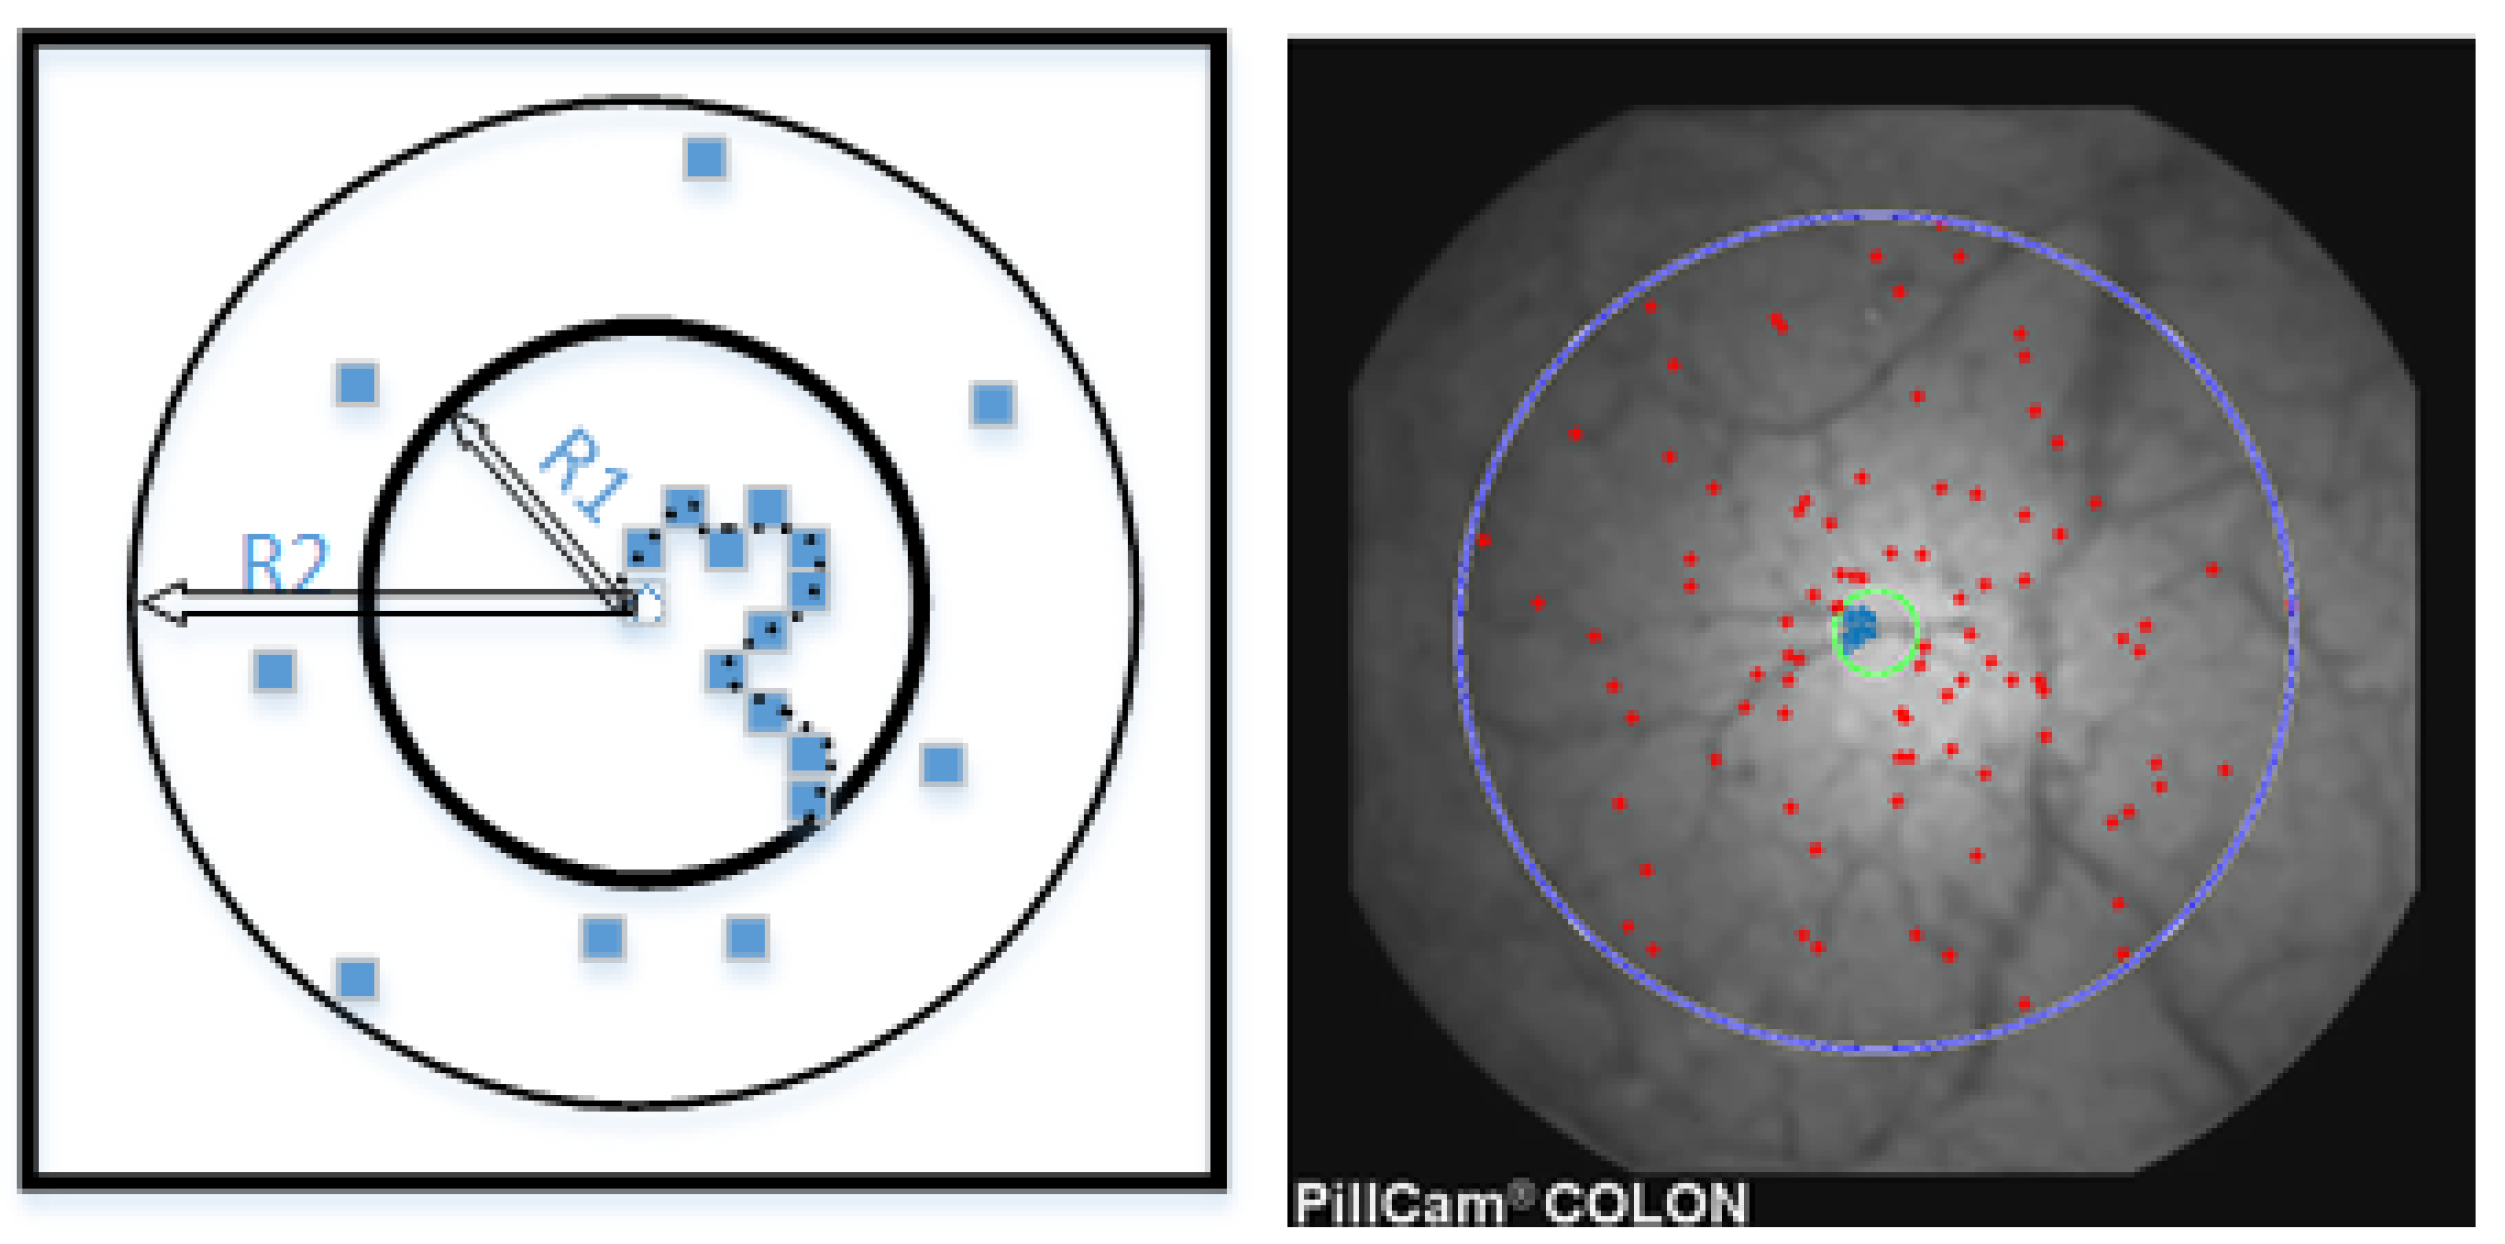
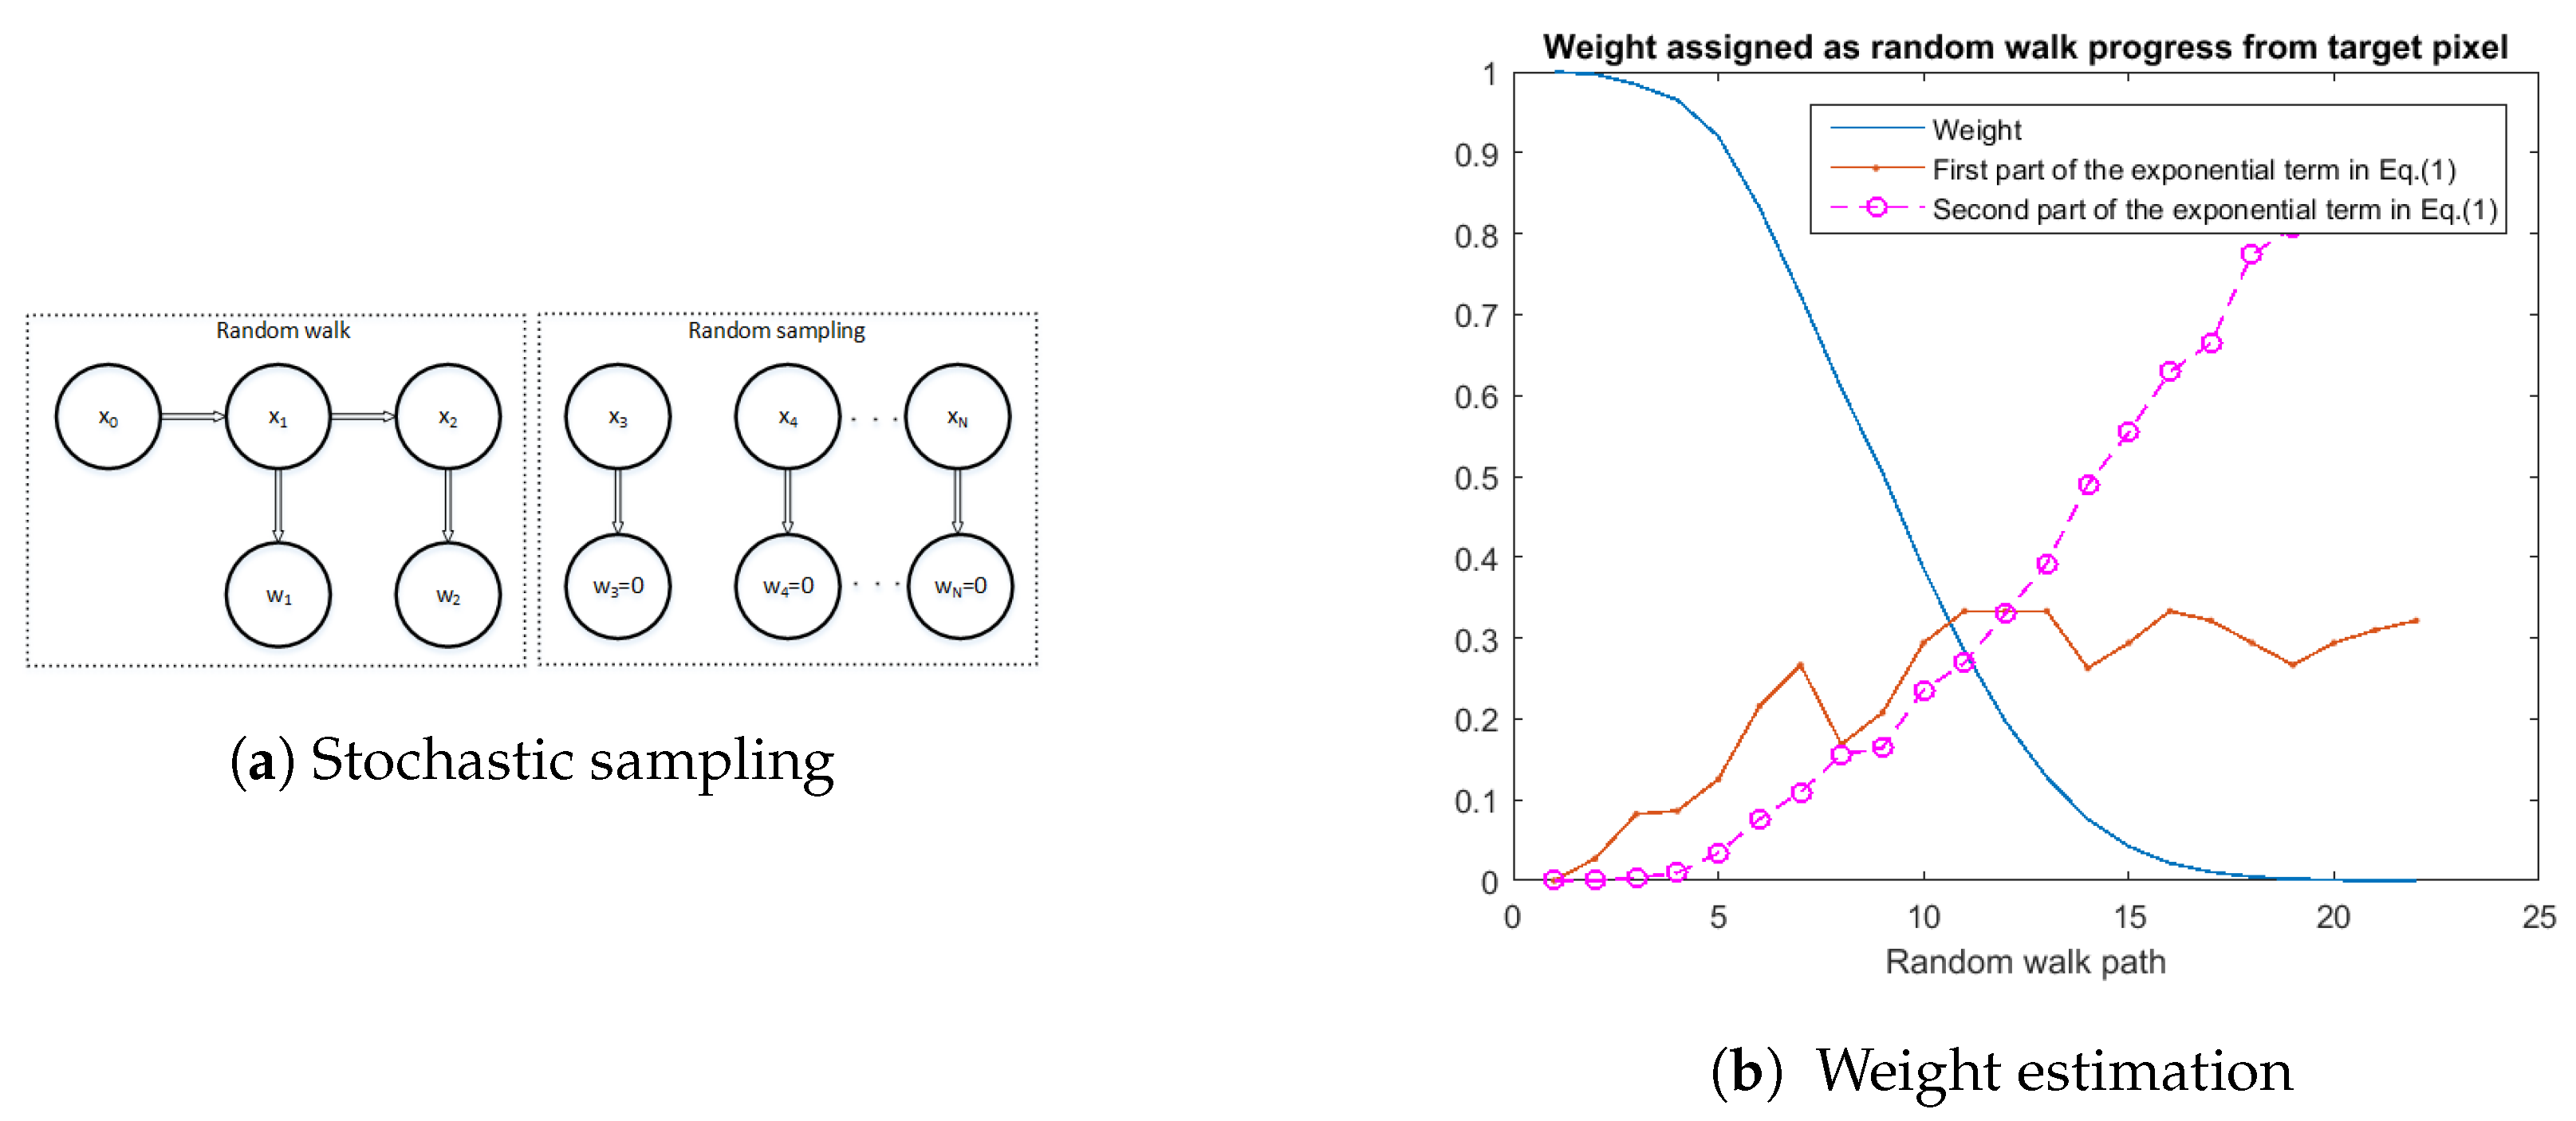
2.2. Retinex-Inspired Envelope with Stochastic Sampling

The Human Visual System (HVS) has complex and robust mechanisms to acquire useful information from the physical environment. The intensity of a target pixel is heavily influenced by neighboring pixel values. In [18] Kolås proposed a framework, where the random sprays were used to calculate two envelope functions representing the local reference black and white points. Given the two envelopes, target pixel s is adjusted by contrast stretching as S = s E min E max E min , where S is the modified intensity value, E min and E max are the minimum and maximum values of the envelope at the target pixel. For further details see [18]. Inspired by anisotropic diffusion and stochastic sampling in that work, a new method to enhance CVE image shadow and detail structures is presented. In the next section, we discuss the proposed method.

3. Stochastic Cve Image Enhancement
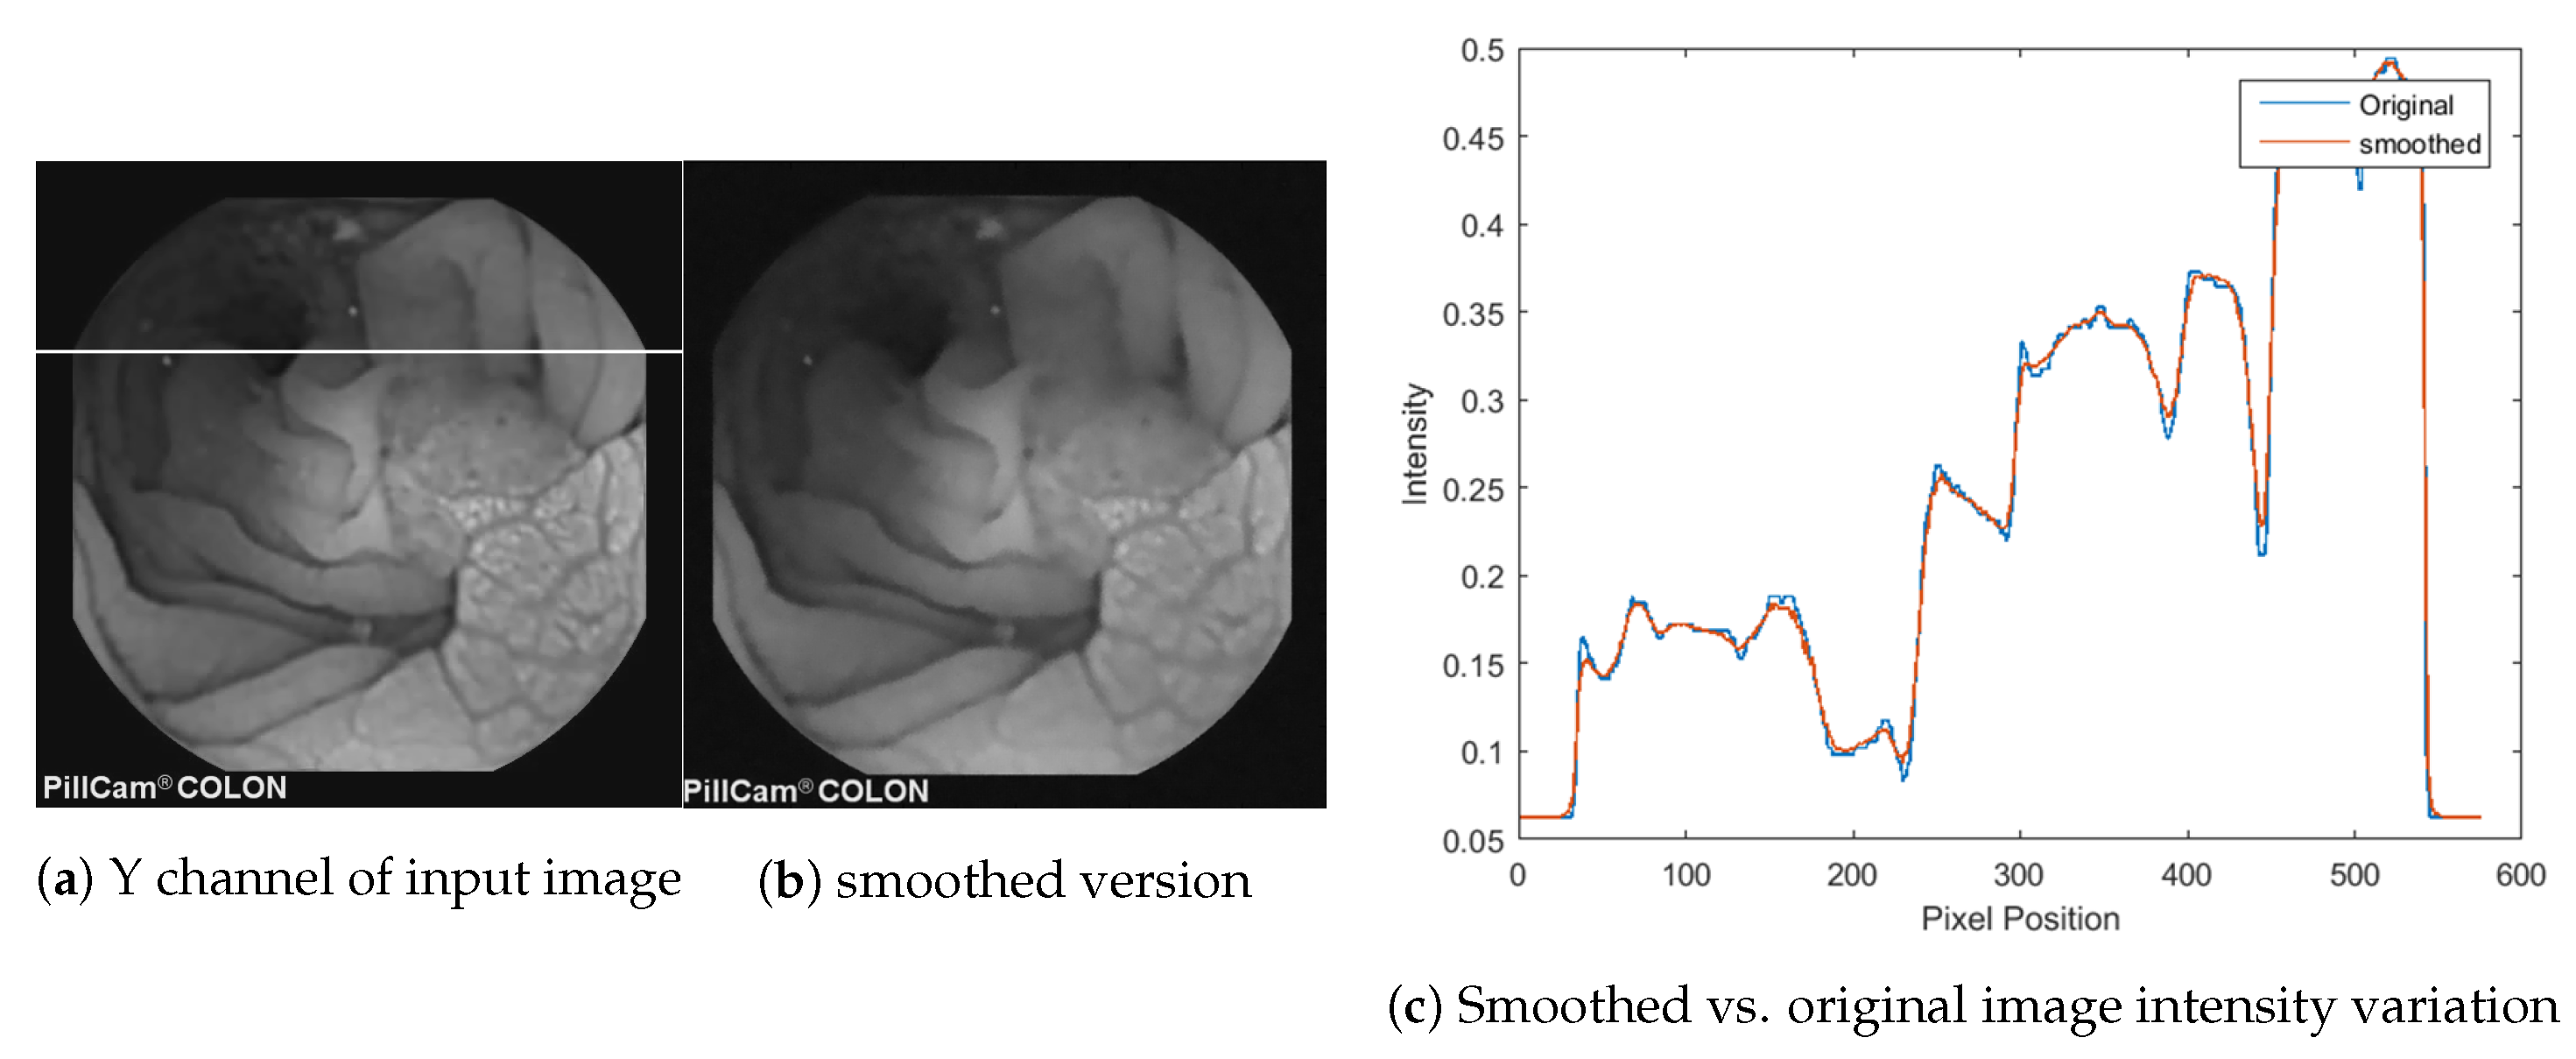
The HVS uses saccades several times per second to move the fovea between points of interest and build an understanding of our visual environment. This has been the origin of many local contrast enhancement techniques. Different spatial sampling techniques have been applied to estimate the relative value of the target pixel [18]. In this article, we propose a different type of sampling for the neighborhood of the target pixel versus other image-wide regions.
Our approach involves exploring similar local neighborhoods and lightness as well as darkness pixels. Consider a target pixel at the center of the circle in Figure 1. In order to smooth and contrast-enhance the target pixel simultaneously, similar local neighborhood pixels are explored through random walk within the inner circle, R 1 whilst local lightness and darkness pixels are explored in the outer circle, R 2 . Starting from each pixel, a random walk is initialized in a 3 × 3 neighborhood until it passes the inner circle. This enables us to determine similar local texture. Once the random walk is out of the inner circle, it samples randomly in-between the inner circle and outer circle to estimate local lightness and darkness see Figure 2. Finally, both random walk and random sampling are combined to estimate the final local lightness and darkness, which result in local contrast enhanced image. In the next subsections, we will go through the details of the proposed sampling method.

3.1. Smoothing

Given initial pixel position x 0 , the random walk explores the local neighborhood within the inner circle. Let us assume for a given iteration the random walk passed through the pixel positions x X , where X is a set of all samples in a single chain (N number of iteration is done for each pixel and in subsequent sections, we refer the total number of samples in each iteration, as a chain). Since we are interested in exploring similar texture in the neighborhood, the similarity of the target pixel and x depends on the image gradient between the starting pixel, the neighboring pixel, and their intensity difference. By noting this fact, for each chain m the similarity of neighboring pixel x j + 1 and initial pixel x 0 can be expressed by Equation (1). Introducing artifacts in smoothing could lead to artificial texture on the tissue surface, which might result in inaccurate diagnosis. Hence, by using a structural tensor description of the gradient features, which allows a more precise description of the local gradient, the similarity is given as follows:
m w 0 j + 1 ( x 0 | x j + 1 ) = e x 0 x j + 1 σ I 1 + T V ( I ) σ g 1
The first part of the exponential term in Equation (1) represents the l 1 norm of the intensity difference between the initial pixel and neighboring pixel normalized to a constant. The second term represents the total variation of eigenvalues of the structural tensors at each pixel normalized to a constant. The total variation term measures whether the random walk has crossed edges or not. Similar to anisotropic diffusion, by controlling the normalization constant, edge aware smoothing is obtained. The total variation of the gradient can be rewritten as
T V I = n = x 0 x j + 1 λ + n + 1 λ n + 1 λ + n λ n = D G 1
where . 1 is the l 1 norm, G is the gradient of the neighboring pixel along the random walk path (chain) and D is given by
D = 1 1 1 1 G = λ + n + 1 λ n + 1 λ + n λ n λ + 0 λ 0
Formulating the similarity of the target and neighboring pixels in this way gives us the flexibility to quantify if the random walk is in a different regions or texture, since the total variation of the gradient accumulates as the random walk moves to the next pixel. Moreover, regions of similar texture with gradual intensity variation due to uneven illumination variation from the point light source onboard the CVE are given equal weights when estimating the final value of the target pixel (see Figure 2).
As discussed in the introduction section, color distortions are undesirable in CVE image enhancement. Therefore, smoothing is done on the luma channel only in the YCbCr color space. One of the motivations for using a color gradient is the extra photometric information that is retained, which would be lost by utilizing a luminance-based gradient. In addition, for isotropic structures, where there is no preferred direction of gradient, as the directional derivative results in a zero magnitude. Hence, for a given RGB image I, the structural tensor is given by Equation (4).
H = R x 2 + G x 2 + B x 2 R x R y + G x G y + B x B y R x R y + G x G y + B x B y R y 2 + G y 2 + B y 2
where R x , G x , B x , R y , G y , B y are horizontal and vertical spatial derivatives of RGB color channels respectively. The eigenvalue analysis of the H leads to two eigenvalues λ + λ , which can be solved using standard techniques. Finally, given number of samples, and number of iterations, the final smoothed estimate of the target pixel, can computed as a weighted sum of pixels in the chain as in Equation (5).
x d e n = n = 1 N j = 0 M n w 0 j + 1 ( x j | x j + 1 ) x j n = 1 N j = 0 M n w 0 j + 1 ( x j | x j + 1 )
In computing the smoothed image, Figure 3, we found that the contribution of pixels from the random sampling was very small as might be expected and so they were set to zero for numerical  stability.

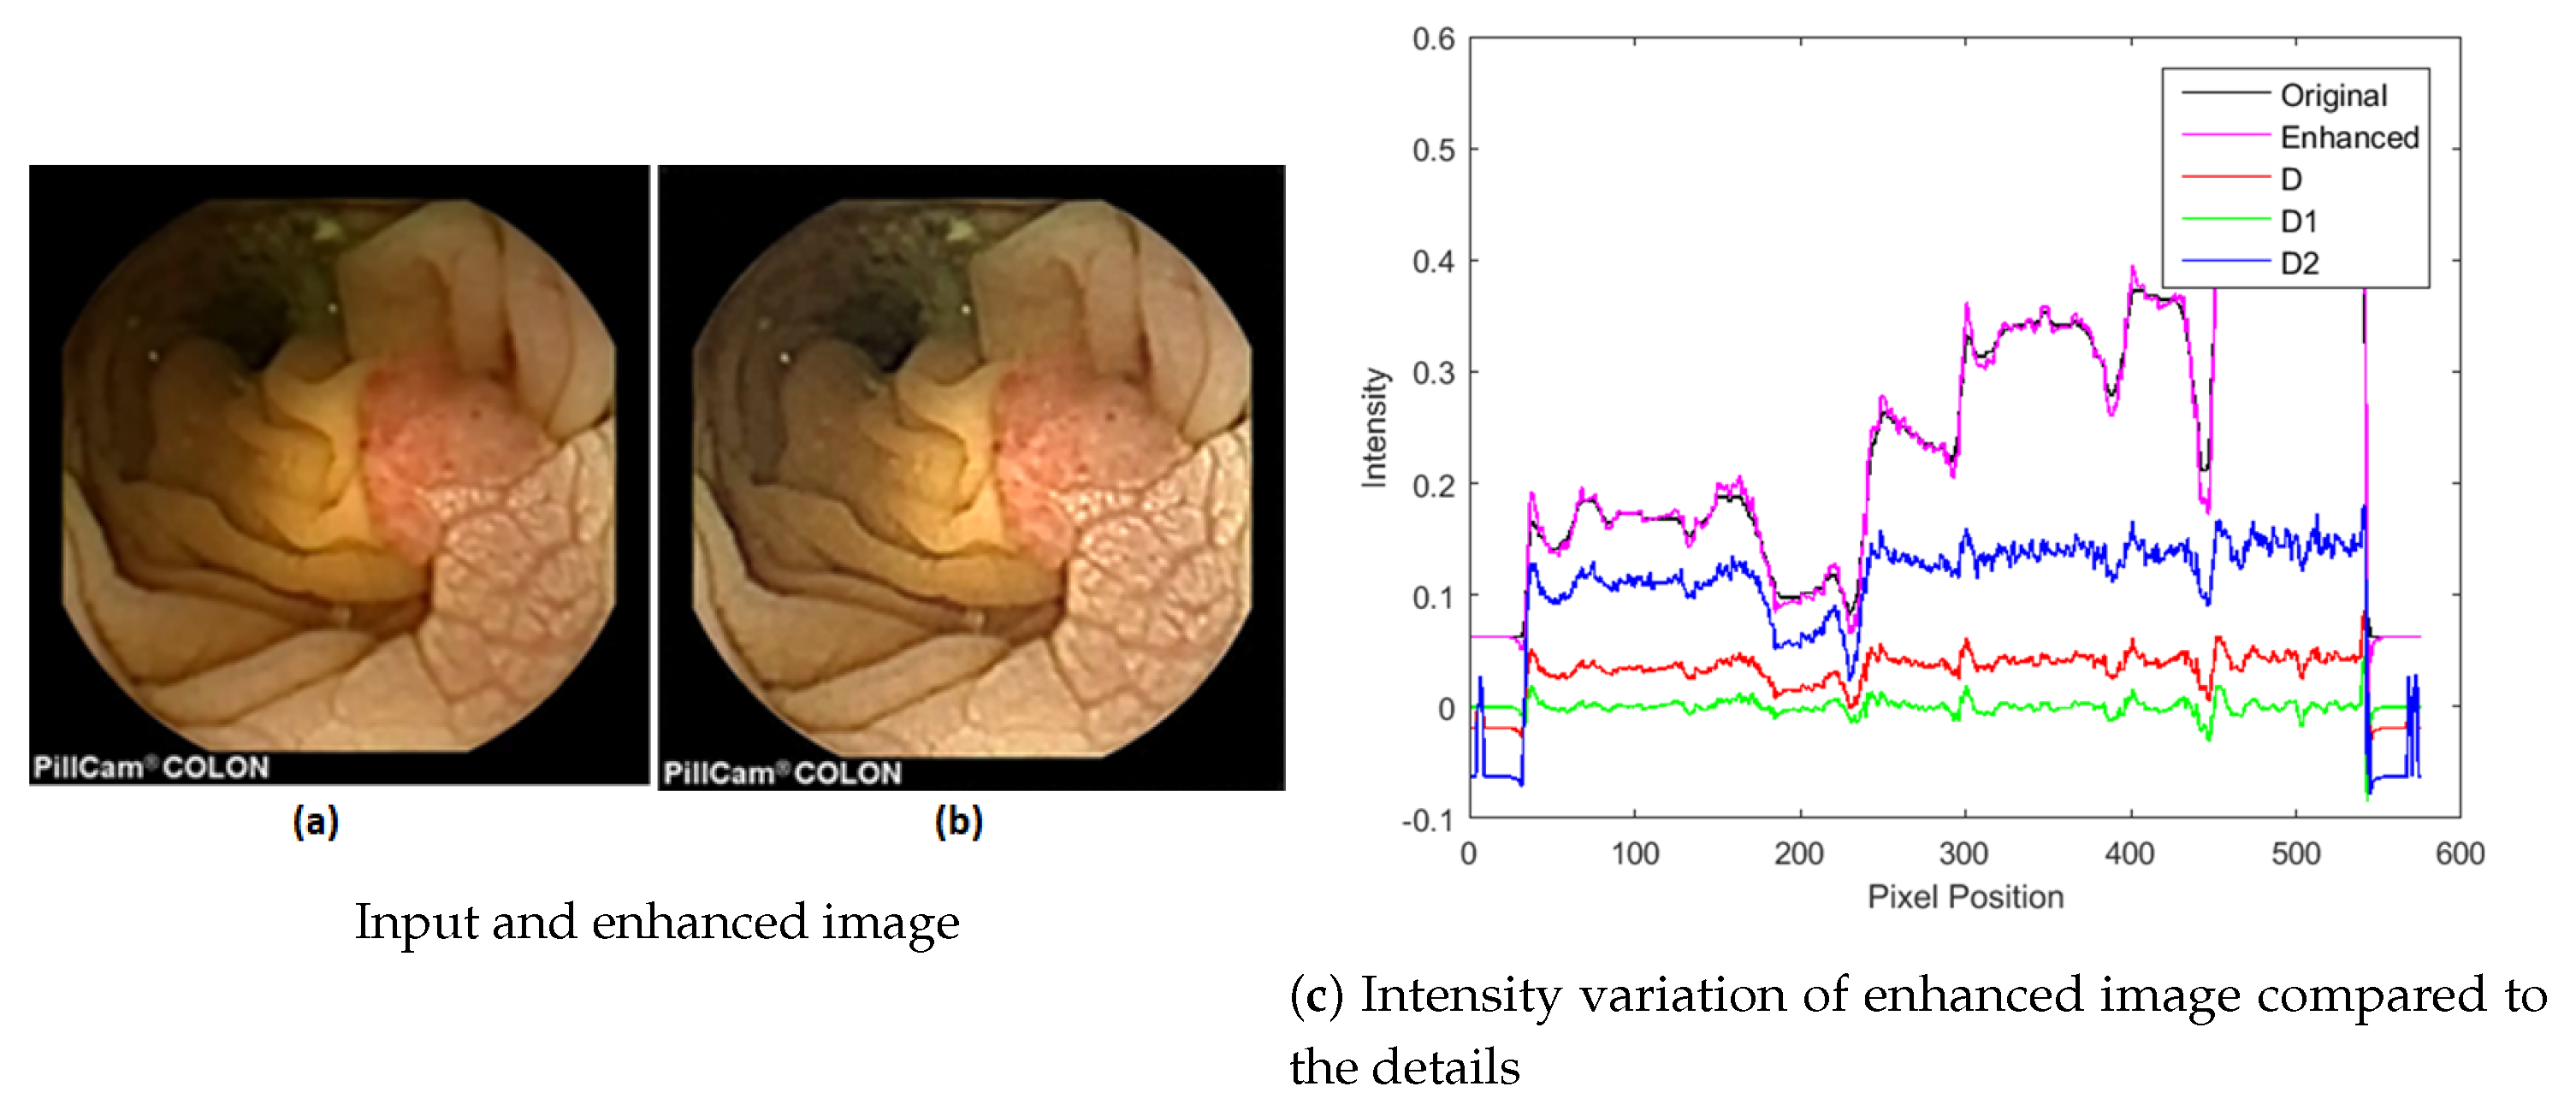
3.2. Local Contrast Enhancement

As discussed in the introduction section, local contrast enhancement is obtained by finding the local darkness and lightness. From M samples using random walk and random sampling in chain X, the minimum and maximum pixels of chain M are found as:
I max n = max i = 0 M x i n I min n = min i = 0 M x i n
where I max n and I min n are maximum and minimum intensity values of chain n 1 , . . . , N respectively. It is noted that as the target pixel is also a sample point it is bounded by the maximum and minimum intensity of the samples. Similar to [18] the variation intensity of the samples, the range, R n and the relative value of the target pixel, V n , is given as follows:
V n = 1 2 if R n = 0 x I min R n otherwise R n = I max n I min n
The final estimate of local contrast enhanced target pixel and range is obtained by averaging to the total number of iterations.
v ¯ = 1 N n = 1 N V n r ¯ = 1 N n = 1 N R n
The extremal envelopes can simply be constructed from the estimated average and pixel value as  follows:
E min = x 0 v ¯ r ¯ E max = x 0 + ( 1 v ¯ ) r ¯ = E min + r ¯

3.3. Image Decomposition

Exploiting the information provided by local contrast enhancement of the shadow details in the image and edge preserving smoothing, our framework is based on two key observations. Firstly, shadow details are characterized by a large variation in the contrast-enhanced image and secondly, detail vessel texture is characterized by local intensity variation in the original image. Hence, the two layers containing vessel detail texture D 1 and shadow details D 2 are given as
D 1 = I o I r w s D 2 = I C E I r w s
where I o , I C E , I r w s and are the original, local contrast enhanced (using Equation (8)) and smoothed image (using random walk Equation (5)) respectively. The final detail and shadow tissue texture enhanced image I e n h is obtained by convex linear combination of the two layers of detail and adding them back to the smoothed image as follows:
D = γ D 1 + ( 1 γ ) D 2 I e n h = K D + I r w s
where γ is a mixing coefficient that controls the amount of shadow details against tissue details and K is a scalar constant. Figure 4 shows the enhanced image along its smooth , detail, and shadow layers.

4. Implementation

The proposed framework was tested with the following parameter settings. Denoising and local contrast enhancement can be controlled by choosing appropriate parameters as follows. The number of samples and iterations controls the robustness of the estimated local contrast and smoothed pixel value. For our experiment, we used N = 50 iterations and M = 150 sample pixels per iteration. Edge aware smoothing was controlled though intensity and gradient normalization constants σ I and σ g respectively. σ I controls intensity difference, while σ g controls how total variation of gradient penalizes crossing edges. Moreover, it is possible to control the locality of smoothing and local contrast enhancement by choosing appropriate sampling dimensions for R 1 and R 2 . For this experiment R 1 is set to 10 and R 2 is set to length of the diagonal of the image. We will go into more details about parameter settings in Section 5.5. The Pseudo-code for the proposed method is given in Algorithm A1.      
Algorithm A1: Stochastic CVE image enhancement
Data:
  • Y c b c r : Input image
  • R 1 , R 2 : Inner and outer sampling circles, Figure 1
  • N , M : Number of samples and total number of iterations
Result: Enhanced image
PROCEDURE:
G = color gradient Equation (4)
foreachpixeldo
Jimaging 04 00075 i001

5. Result and Evaluation

5.1. Experimental Setup and Procedure

Subjective image quality assessment is the most reliable way to evaluate the visual quality of digital images perceived by trained medical doctor. To assess the performance of the proposed method for clinical application, rank order, an ordinal scaling method were used. The observers, who are trained physicians, were asked to rank the image samples in order of, from best to worst along diagnostic value of an image. The images were positioned side by side in a random order position as shown on Figure 5. The images are shown side by side to make it easy for the observers to see the detail difference between the candidate images. Four images were placed side by side for comparison. The test images are reproductions of the same original image using proposed, Bilateral [28] and weighted least square (WLS) [29] image decomposition techniques. The methods selected for subjective experiments are based on similarity of their approaches, i.e., image decomposition technique and their full-reference image quality metric evaluation. The experiments took place in a controlled room simulating a colonoscopy examination room. We used BENQ BL series display, with screen resolution of 3840 × 2160. The display is color managed for sRGB with luminance level of 80 cd/m 2 . Moreover, to measure screen uniformity, a middle gray patch is used, and three points are sampled from left to right of the display. Our benchmark shows a 3.8 standard deviation in CIE XYZ values. To measure color uniformity different patches of red, green and blue patches were measured along black and white patches with average CIE2000 value of 1.57, which is on the order of the just noticeable difference (JND).

5.2. Dataset

Several guidelines have been given in the literature for the selection of images for psychophysical experiments. Holmet al. [30] recommend the use of a broad range of images as well as test charts to reveal the quality issues. Thirty sample images were chosen by a medical doctor from the KID dataset [31] with pathologies and normal images from different parts of the colon. The sample images are selected based on lack of clarity and details for visual diagnosis and should be enhanced for better visualization. The images were taken by GivenImaging Pillcam COLON and Mirocam capsules with a resolution of 576 × 576. In addition, three sample images from Pillcam COLON II were also included having a resolution of 256 × 256.

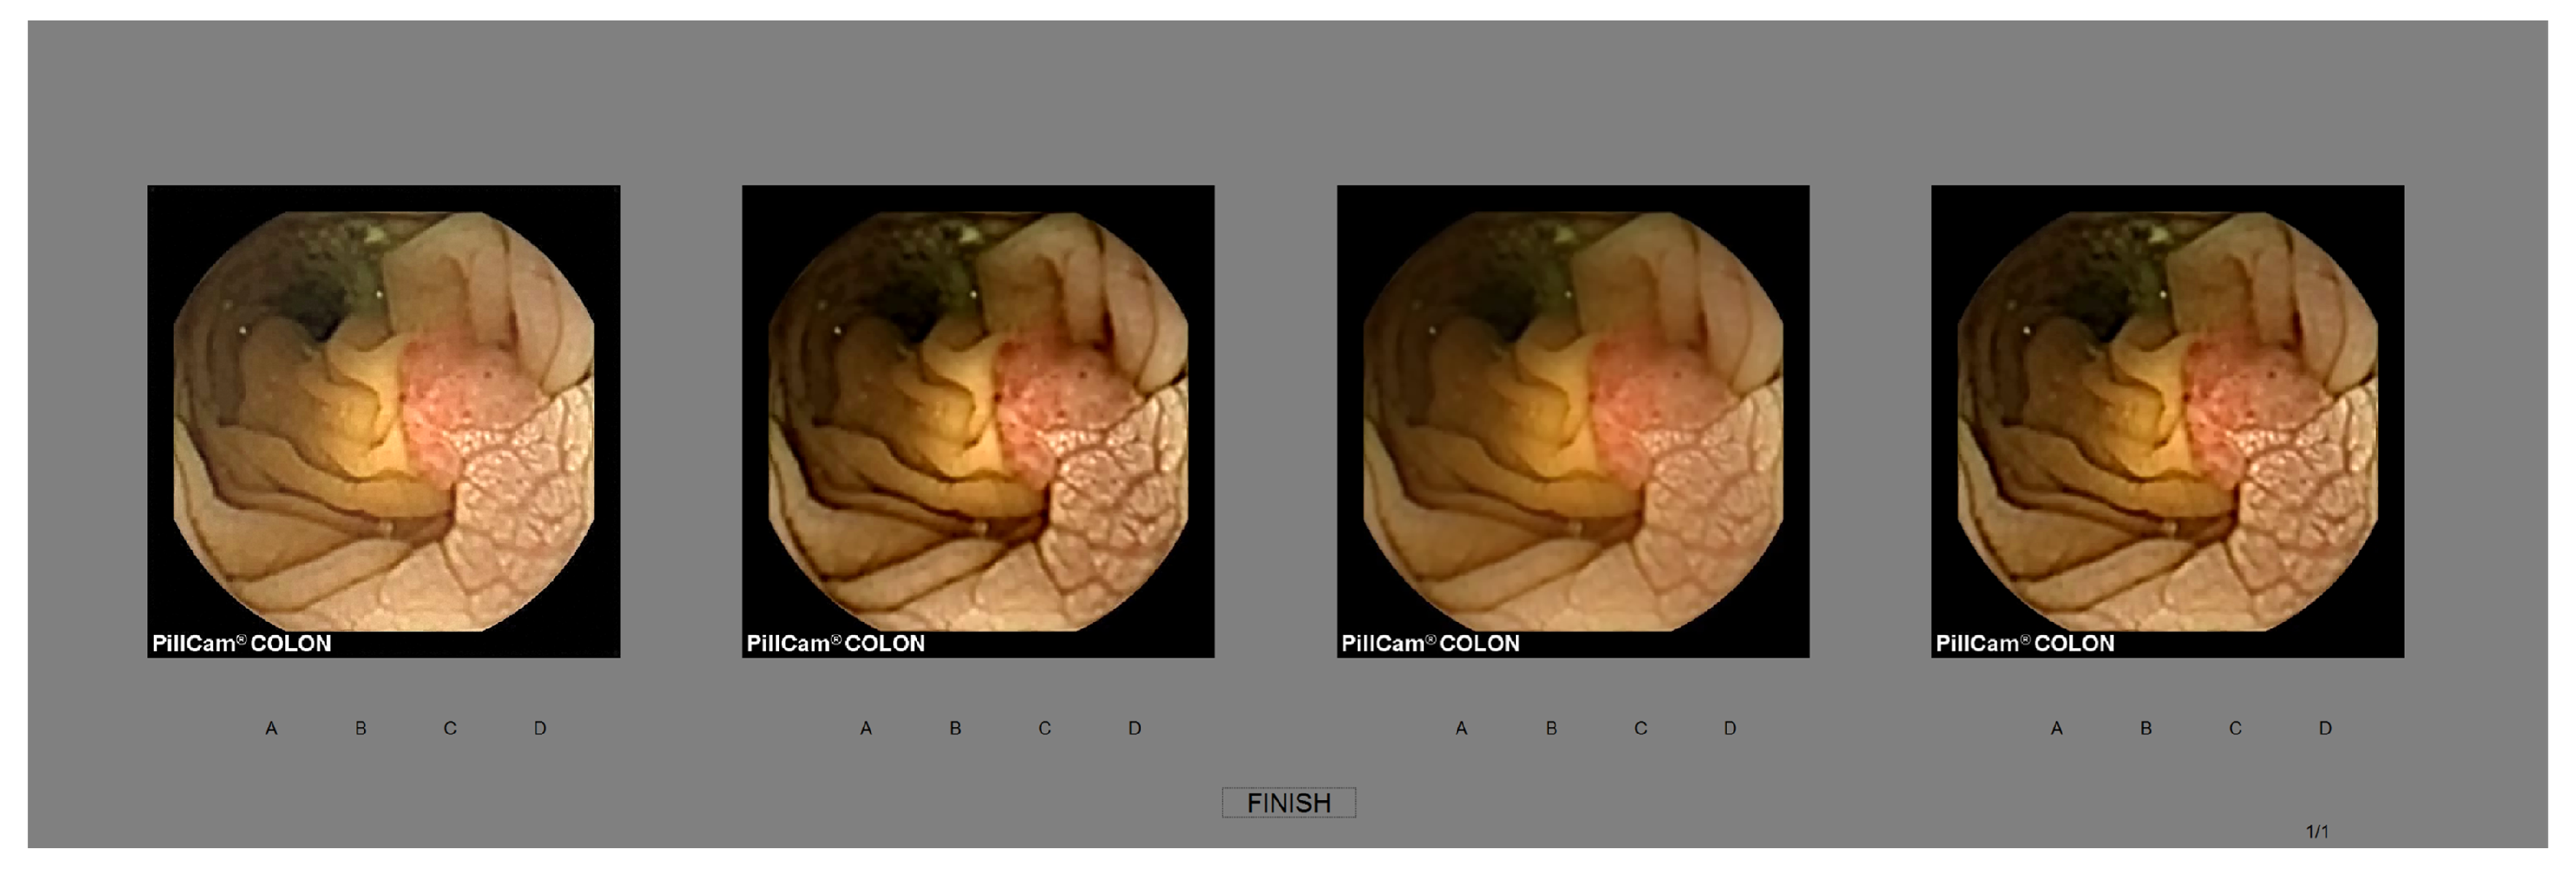
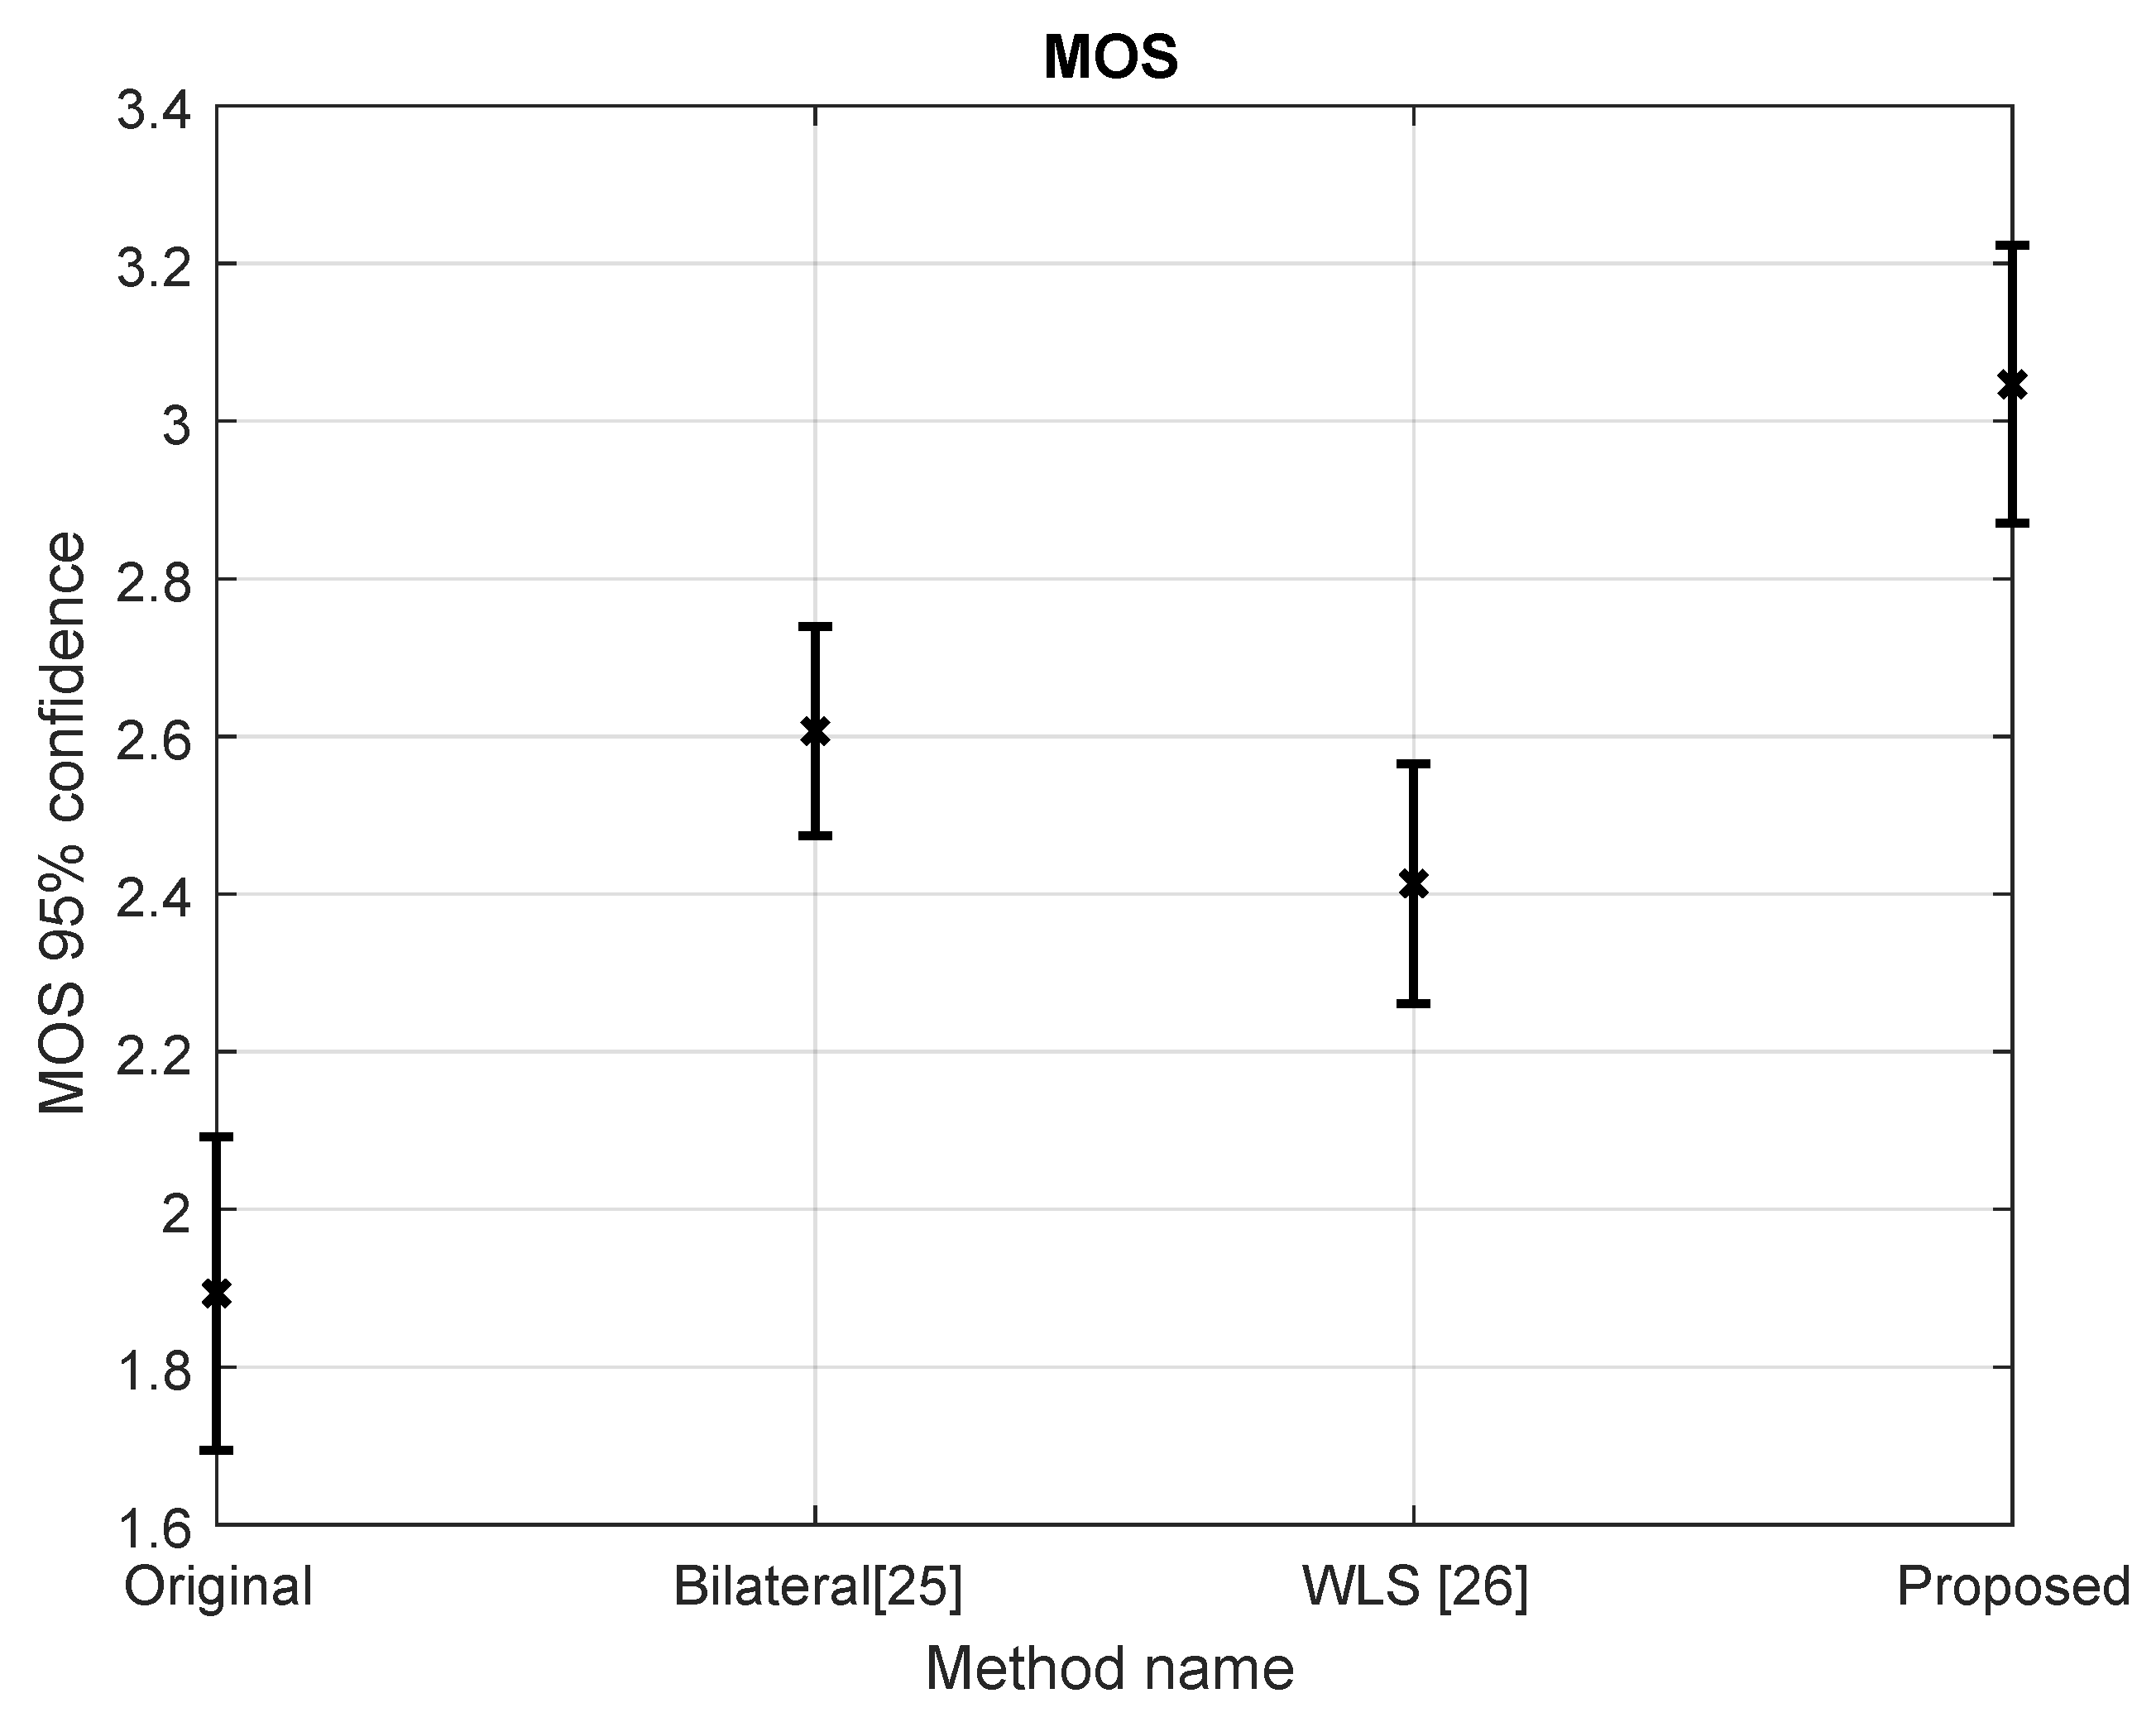
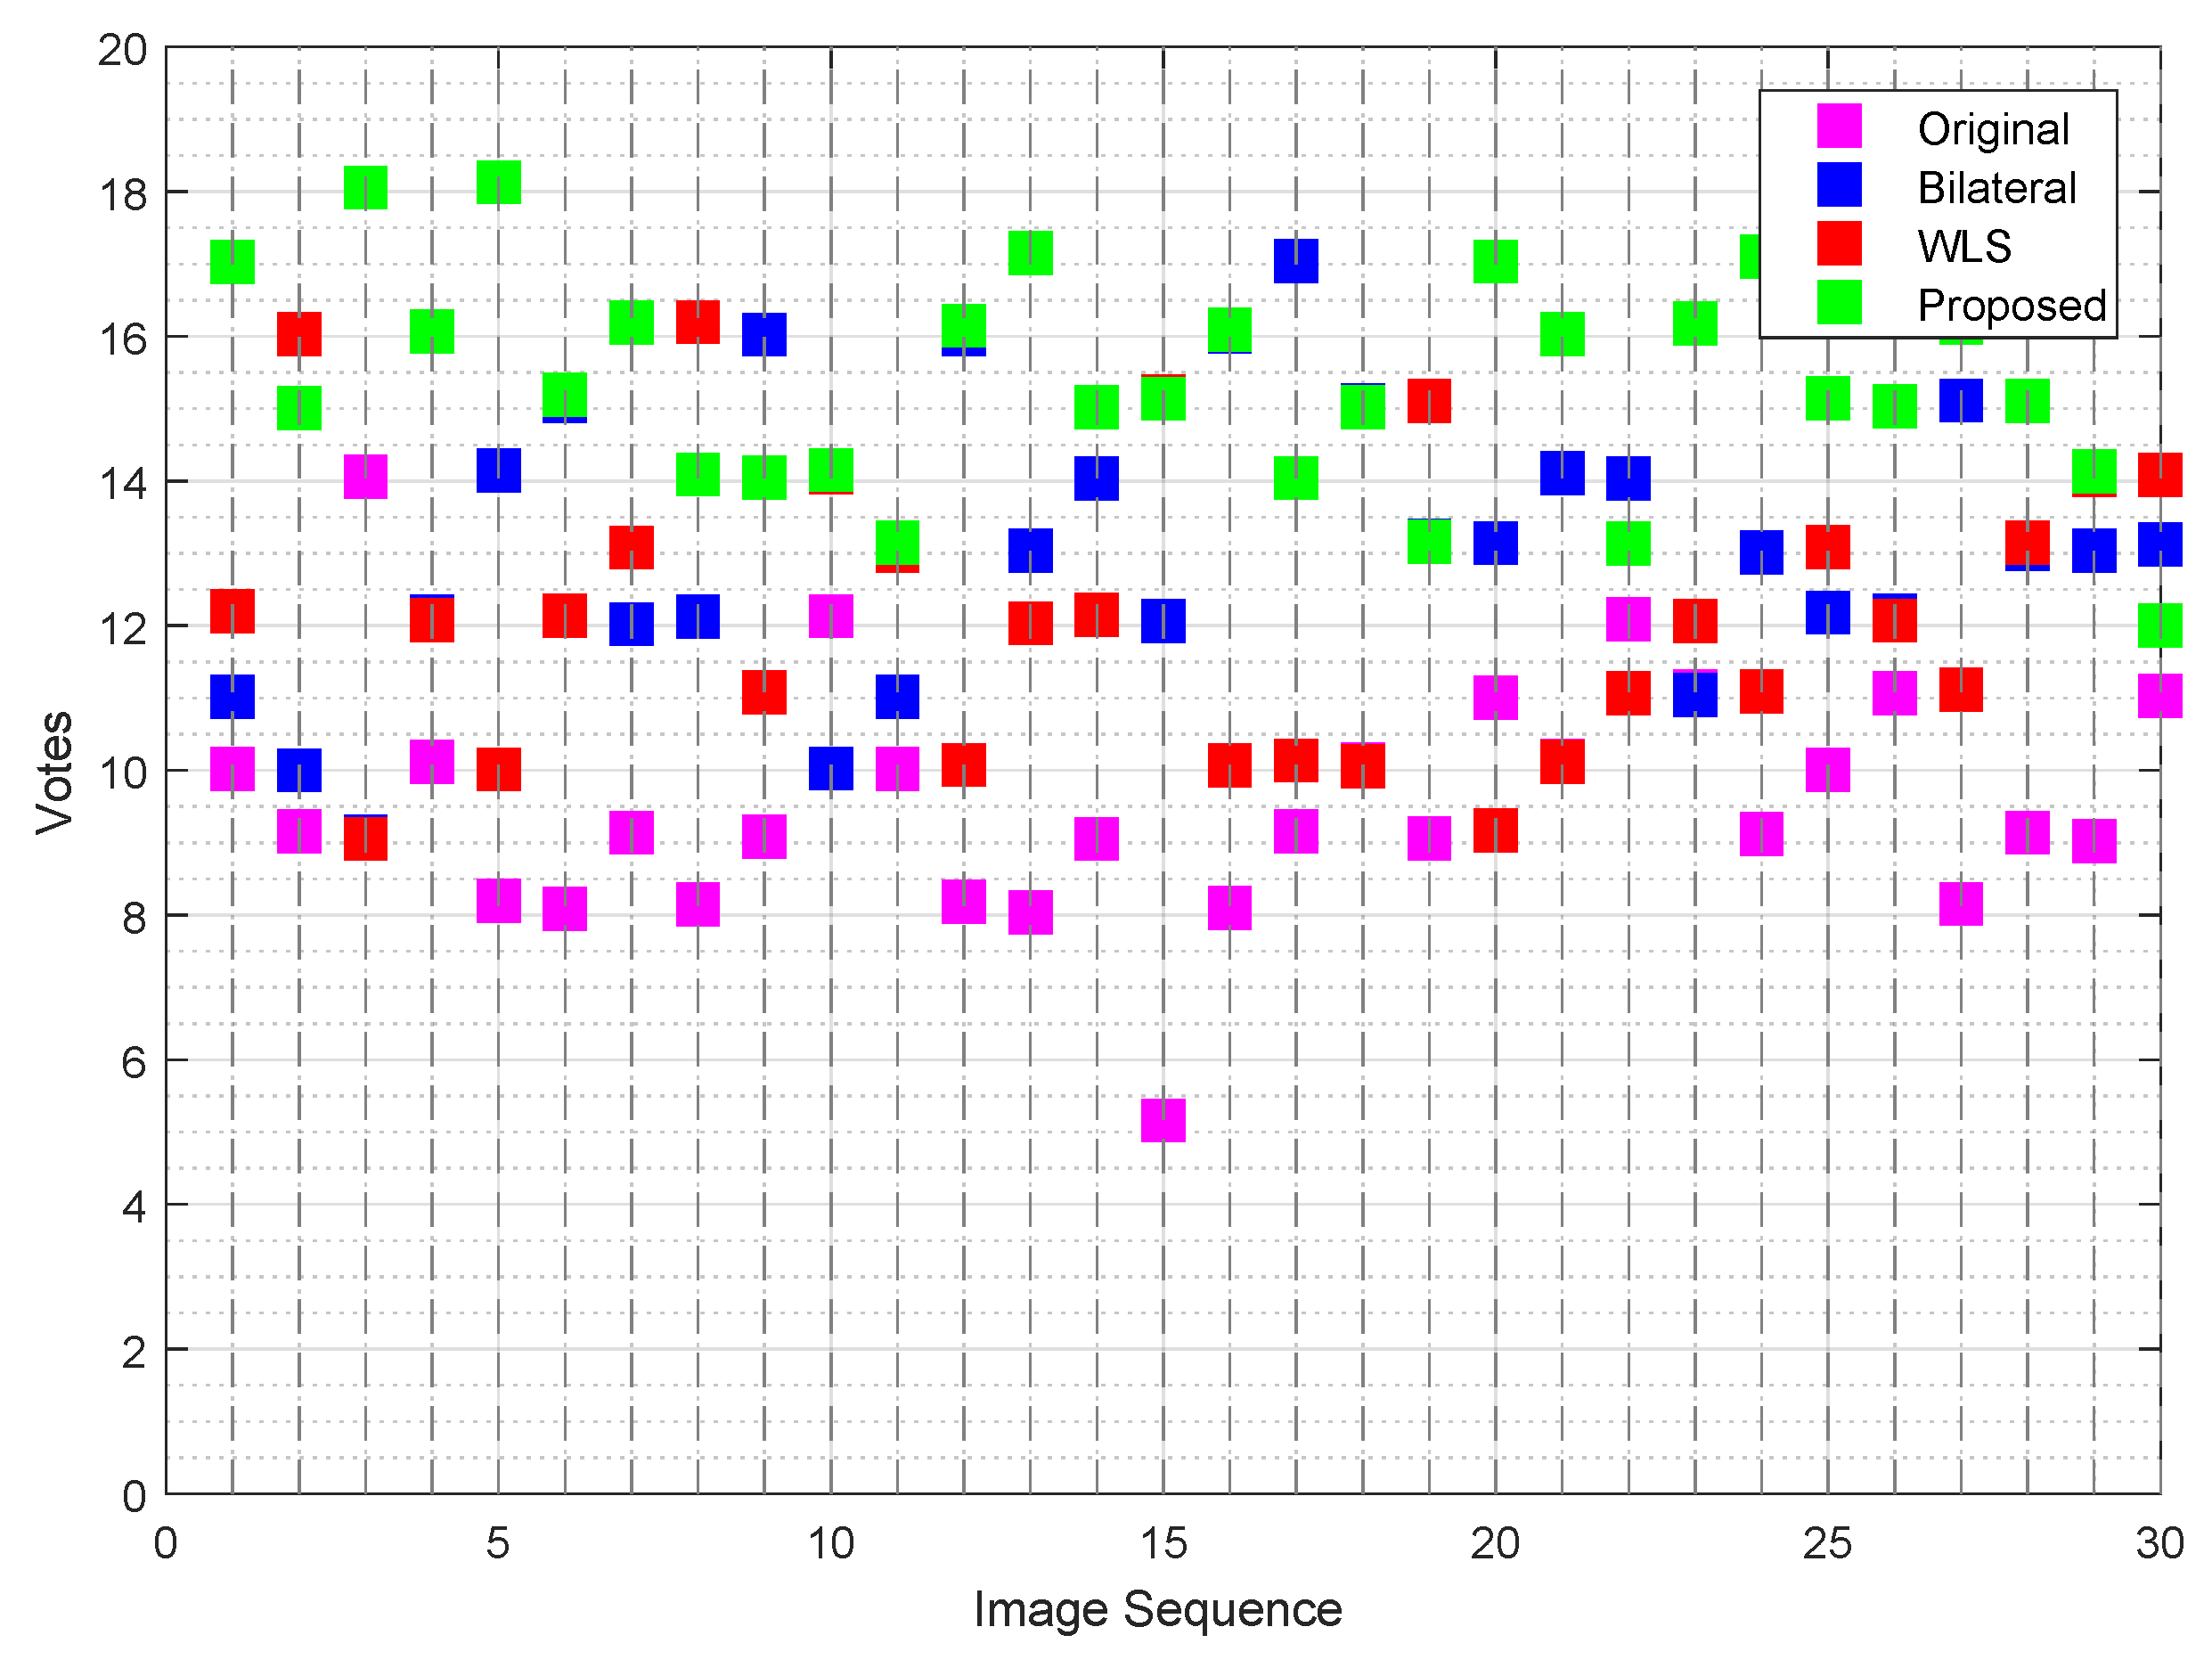
5.3. Subjective Evaluation

Five medical doctors who specialized in colonoscopy imaging participated in the subjective experiment. Observers were asked the standard question “Decide which image has the best diagnostic image quality. Once you make a decision click on the letters below each image indicating their rank. ‘A’ being the best image and ‘D’ being the worst image. And no tie is allowed”. The user interface for the subjective evaluation is shown on Figure 5. The rank order data were converted to into pairwise comparison for ease of analysis. The pairwise raw scores were used compute z-score ranking with Montag confidence interval [32]. The z-score ranking result from the subjective experiment is summarized on Figure 6.
The subjective evaluation across different observers were also consistent. As it shown on Figure 7, the proposed method performed better for the sample images in the dataset. In general, it can be deduced from Figure 6 and Figure 7 that image enhancement provides a better image quality as compared to original image for diagnosis.

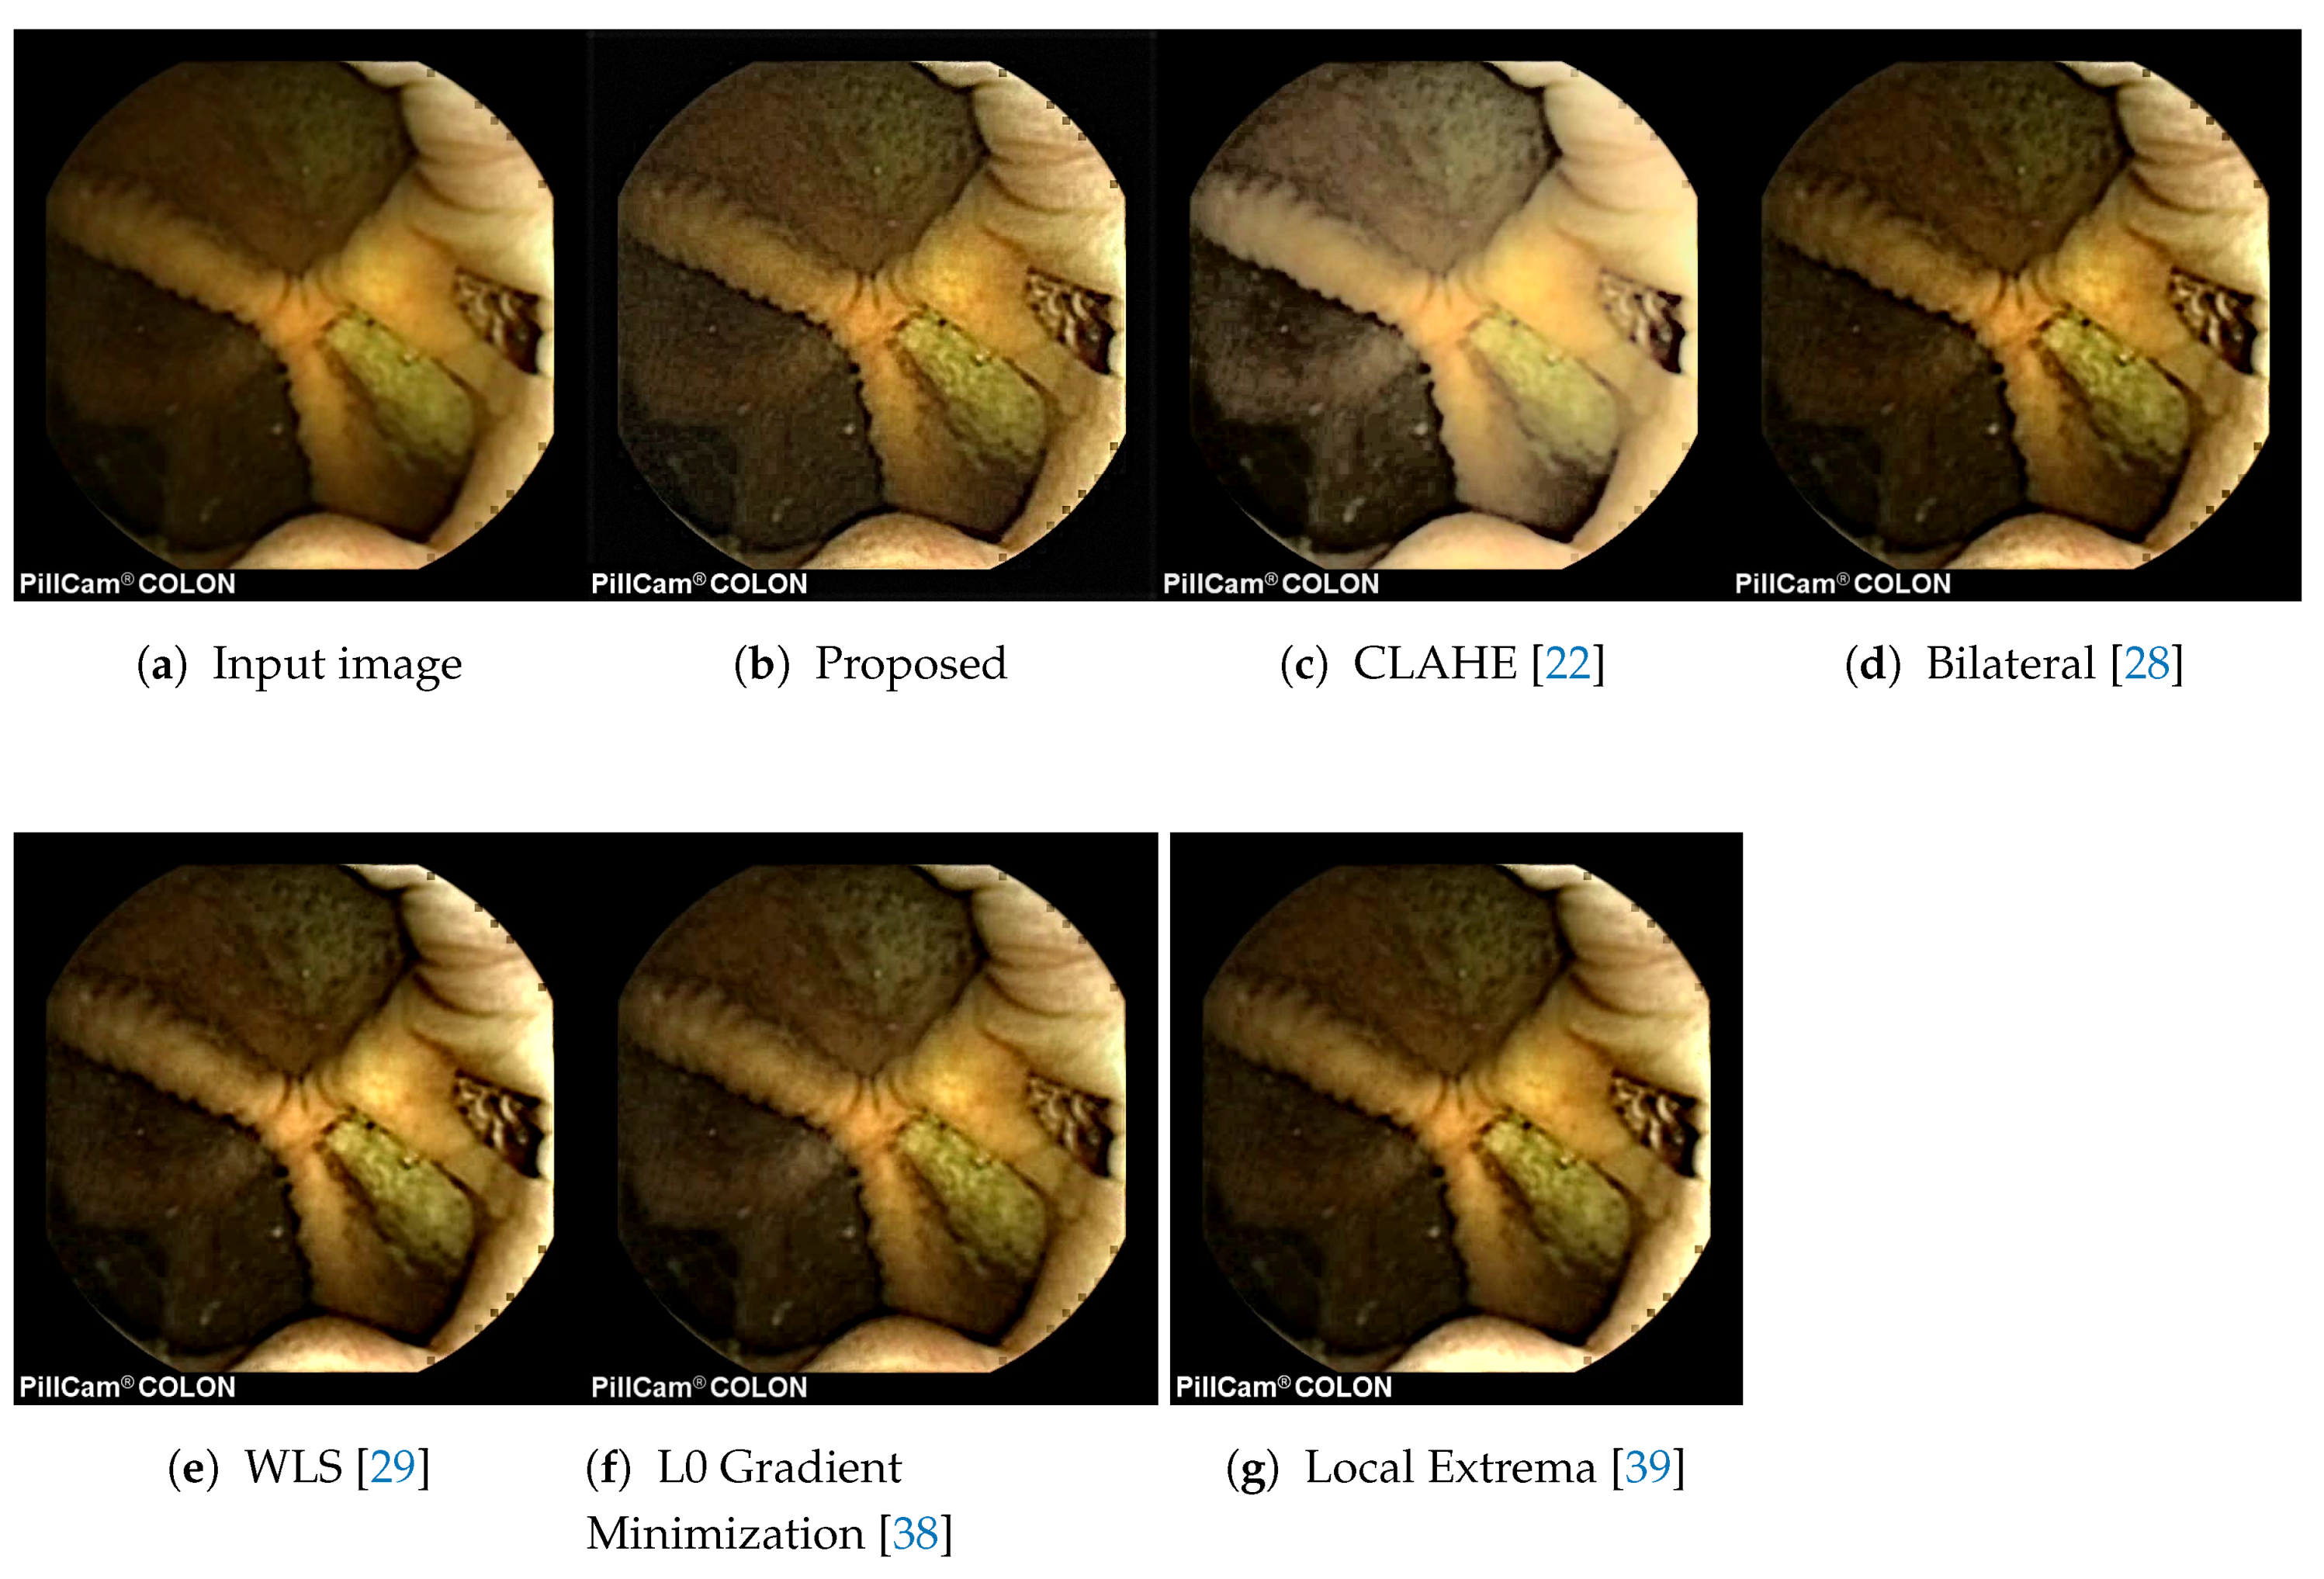
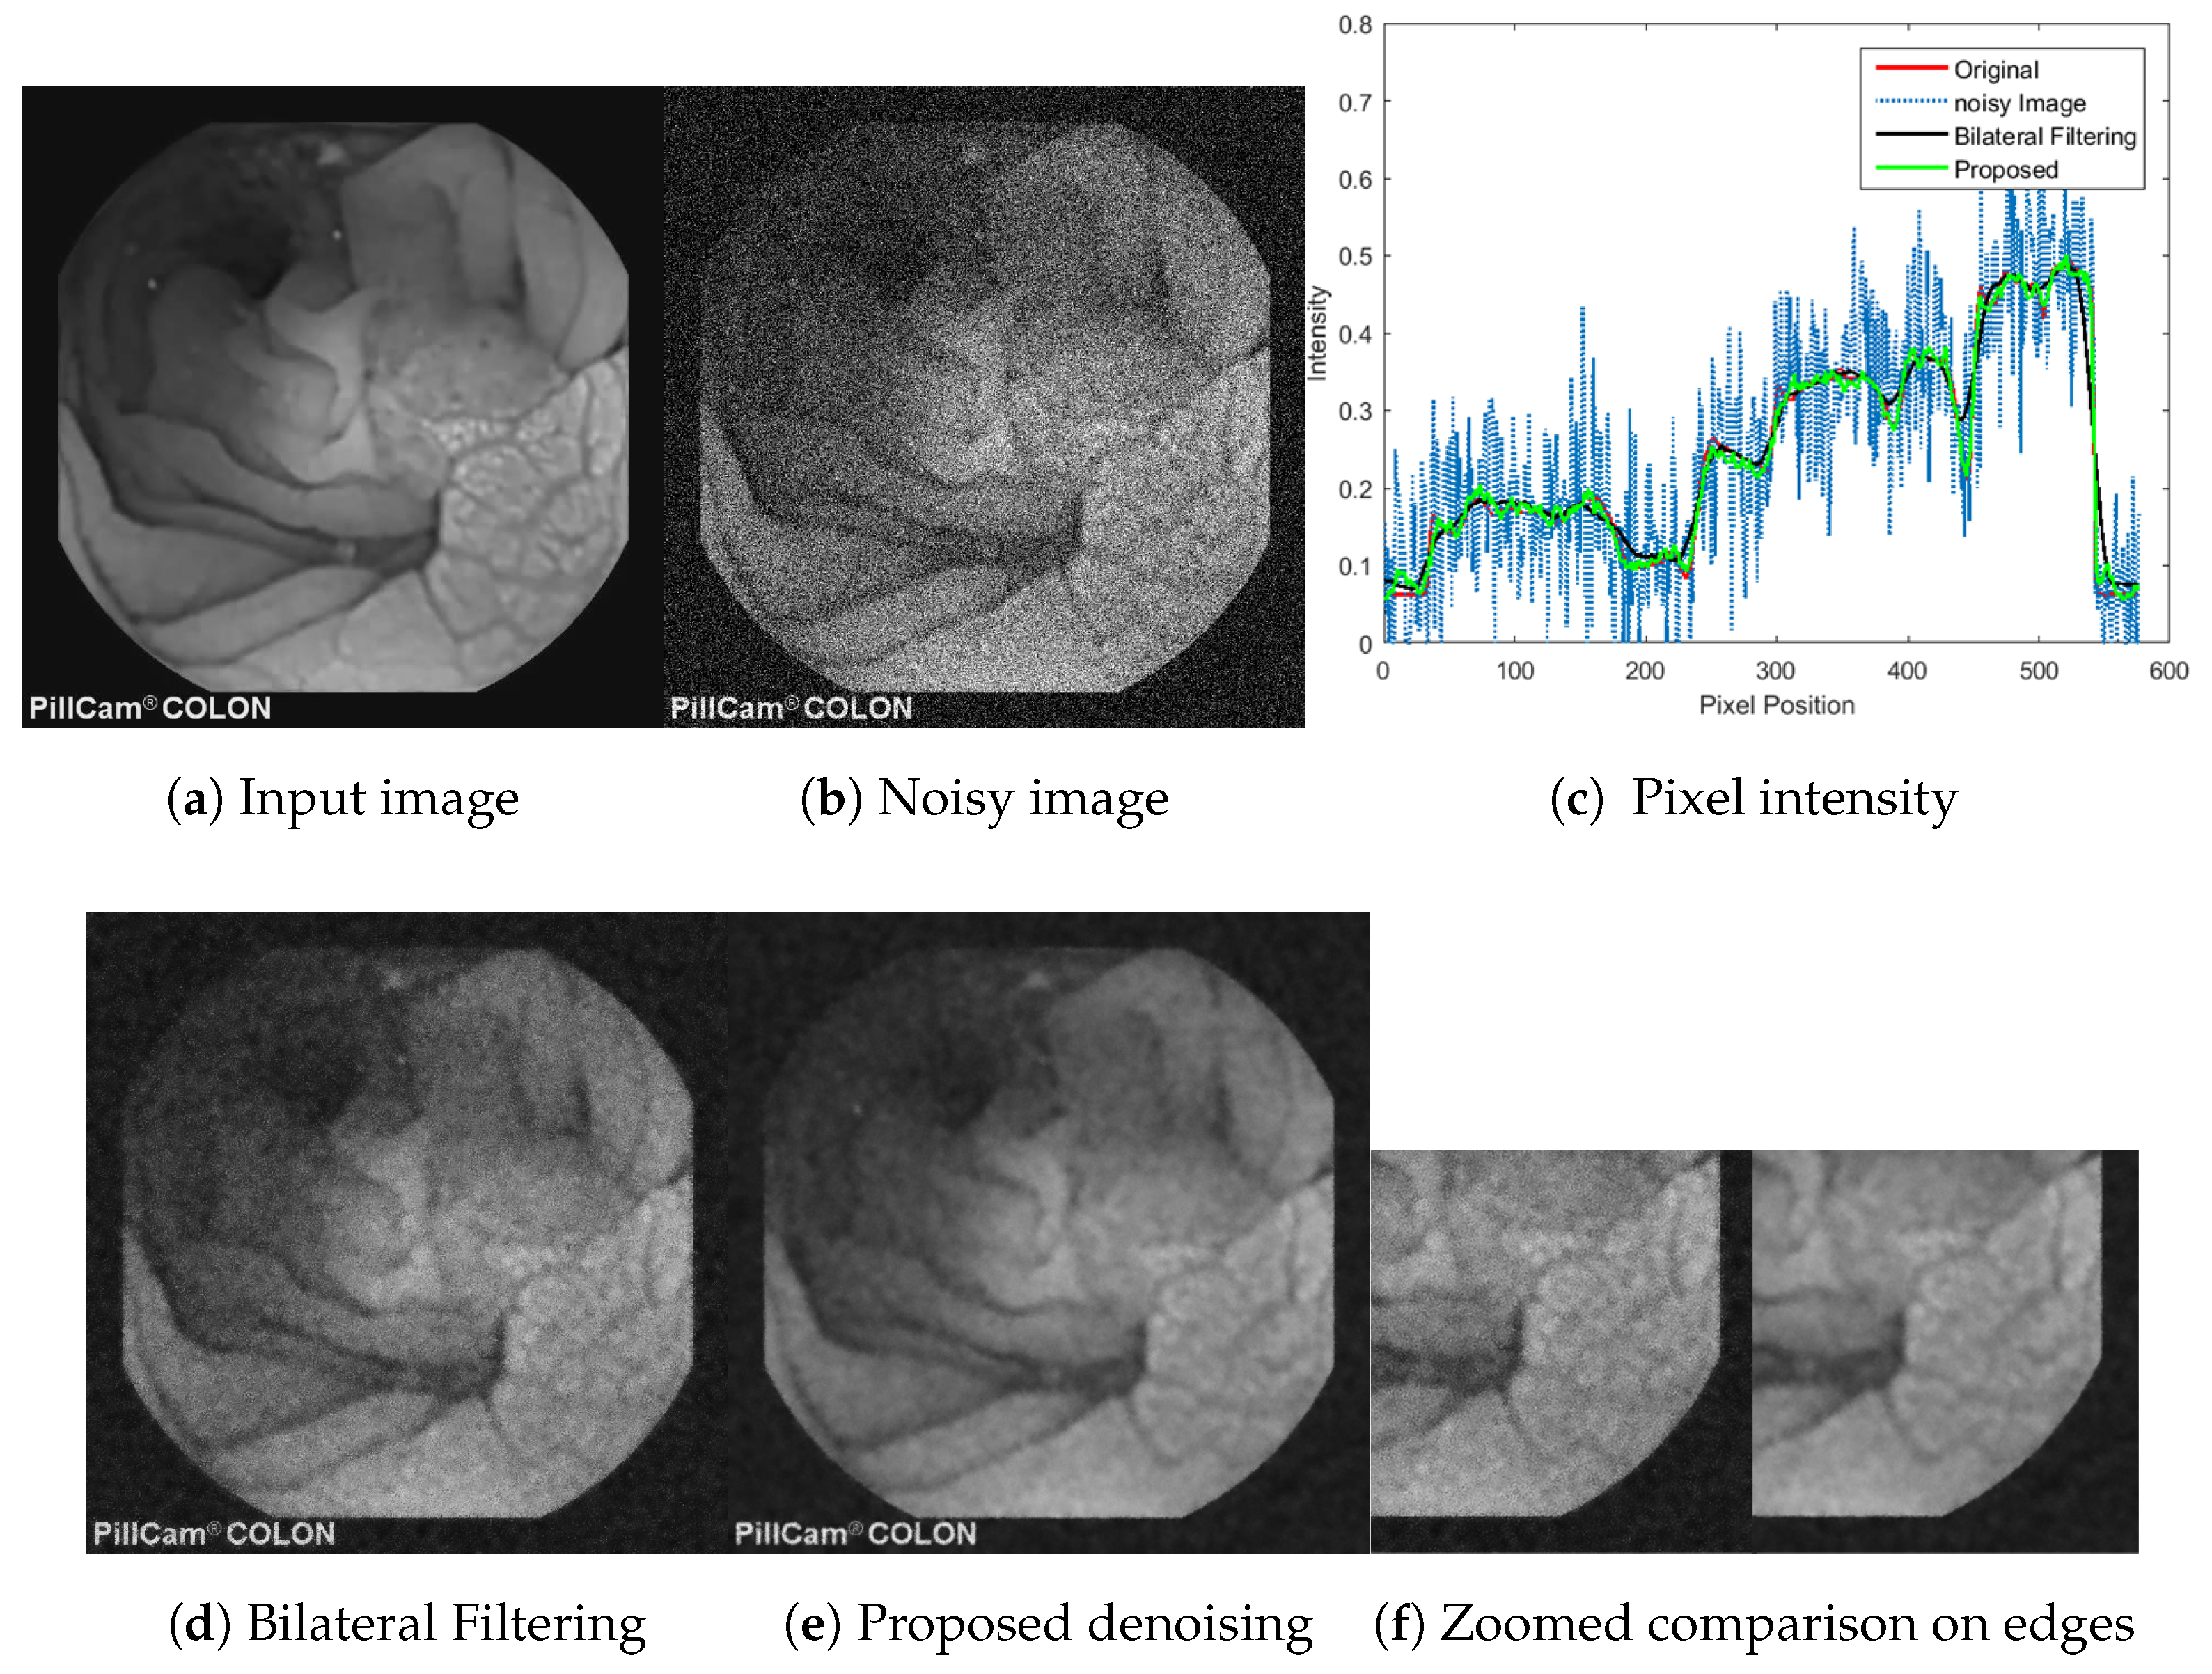
5.4. Objective Evaluation and Comparison

Vision research does not offer an answer as to which objective image quality metrics corresponds to diagnostic qualities of capsule images for natural images.
In this section, we present our evaluation of existing natural image quality metrics. Our objective here is to show how existing natural image quality metric compare with the subjective evaluation result presented in Section 5.3. Table 1 shows the evaluation result using weighted-level framework(WLF) [33] , structural similarity index (SSIM) [34], feature-similarity (FSIM) index [35] and information content weighted structural similarity measure (IW-SSIM) [36] metrics. Assuming the readers are familiar with SSIM, we limit the discussion to WLF. WLF is a no reference image contrast metric, which measure perceptual contrast by computing the global contrast. WLF is used as it has a good correlation in relation to observer perceived contrast. It is done by subsampling each channel separately into a pyramidal structure and obtaining a contrast map of each level. The overall measure of each channel is a weighted recombination of the average contrast for each level. IW-SSIM is an extension of SSIM index which adopts a new information content weighting-based quality score pooling strategy. FSIM [35] uses phase congruency and the gradient magnitude to compute the local similarity map and utilized the phase congruency map as a weighting function. The CIE2000 metric is applied to understand the perceived color difference between the enhancement and the original image. Given the subjective evaluation result for image decomposition techniques such as Bilateral [28], weighted least square (WLS) [29] and the proposed method, we compared the objective quality metrics. Furthermore, we evaluate contrast limited adaptive histogram equalization (CLAHE) [37], which represent detail and contrast enhancement techniques , using the best discriminative objective image quality metric with the subjective experiment. The average performance is summarized in Table 1. The WLF value displayed in Table 1, is a ratio of average WLF value of the method to the WLF value of the original image. As it can be seen from Table 1 and Figure 6, WLF ratio and IW-SSIM are better discriminative with subjective experiment and could provide better image quality predictors for capsule endoscopy images. From Table 1 and Figure 8, CLAHE enhanced images scored the smallest value in-terms of IW-SSIM as they lack details of tissue surfaces . It is interesting to note that based on a single objective quality metric it difficult to assess the diagnosis values of these images in relation to the subjective evaluation of these images by medical doctors. Many of other related works in capsule image enhancement use standard natural image quality metrics [5,6,8,9]. However, these metrics are proposed for natural images where relative smoothness is preferred. Therefore, further research is required to investigate a single image quality metrics for visual inspection of capsule endoscopy images. As the capsule images exist in smaller color space and are taken under low light conditions, quantifying the diagnostic value of these images is essential. More results can be downloaded from http://www.ansatt.hig.no/mariusp/ColonCapsuleImages.zip.

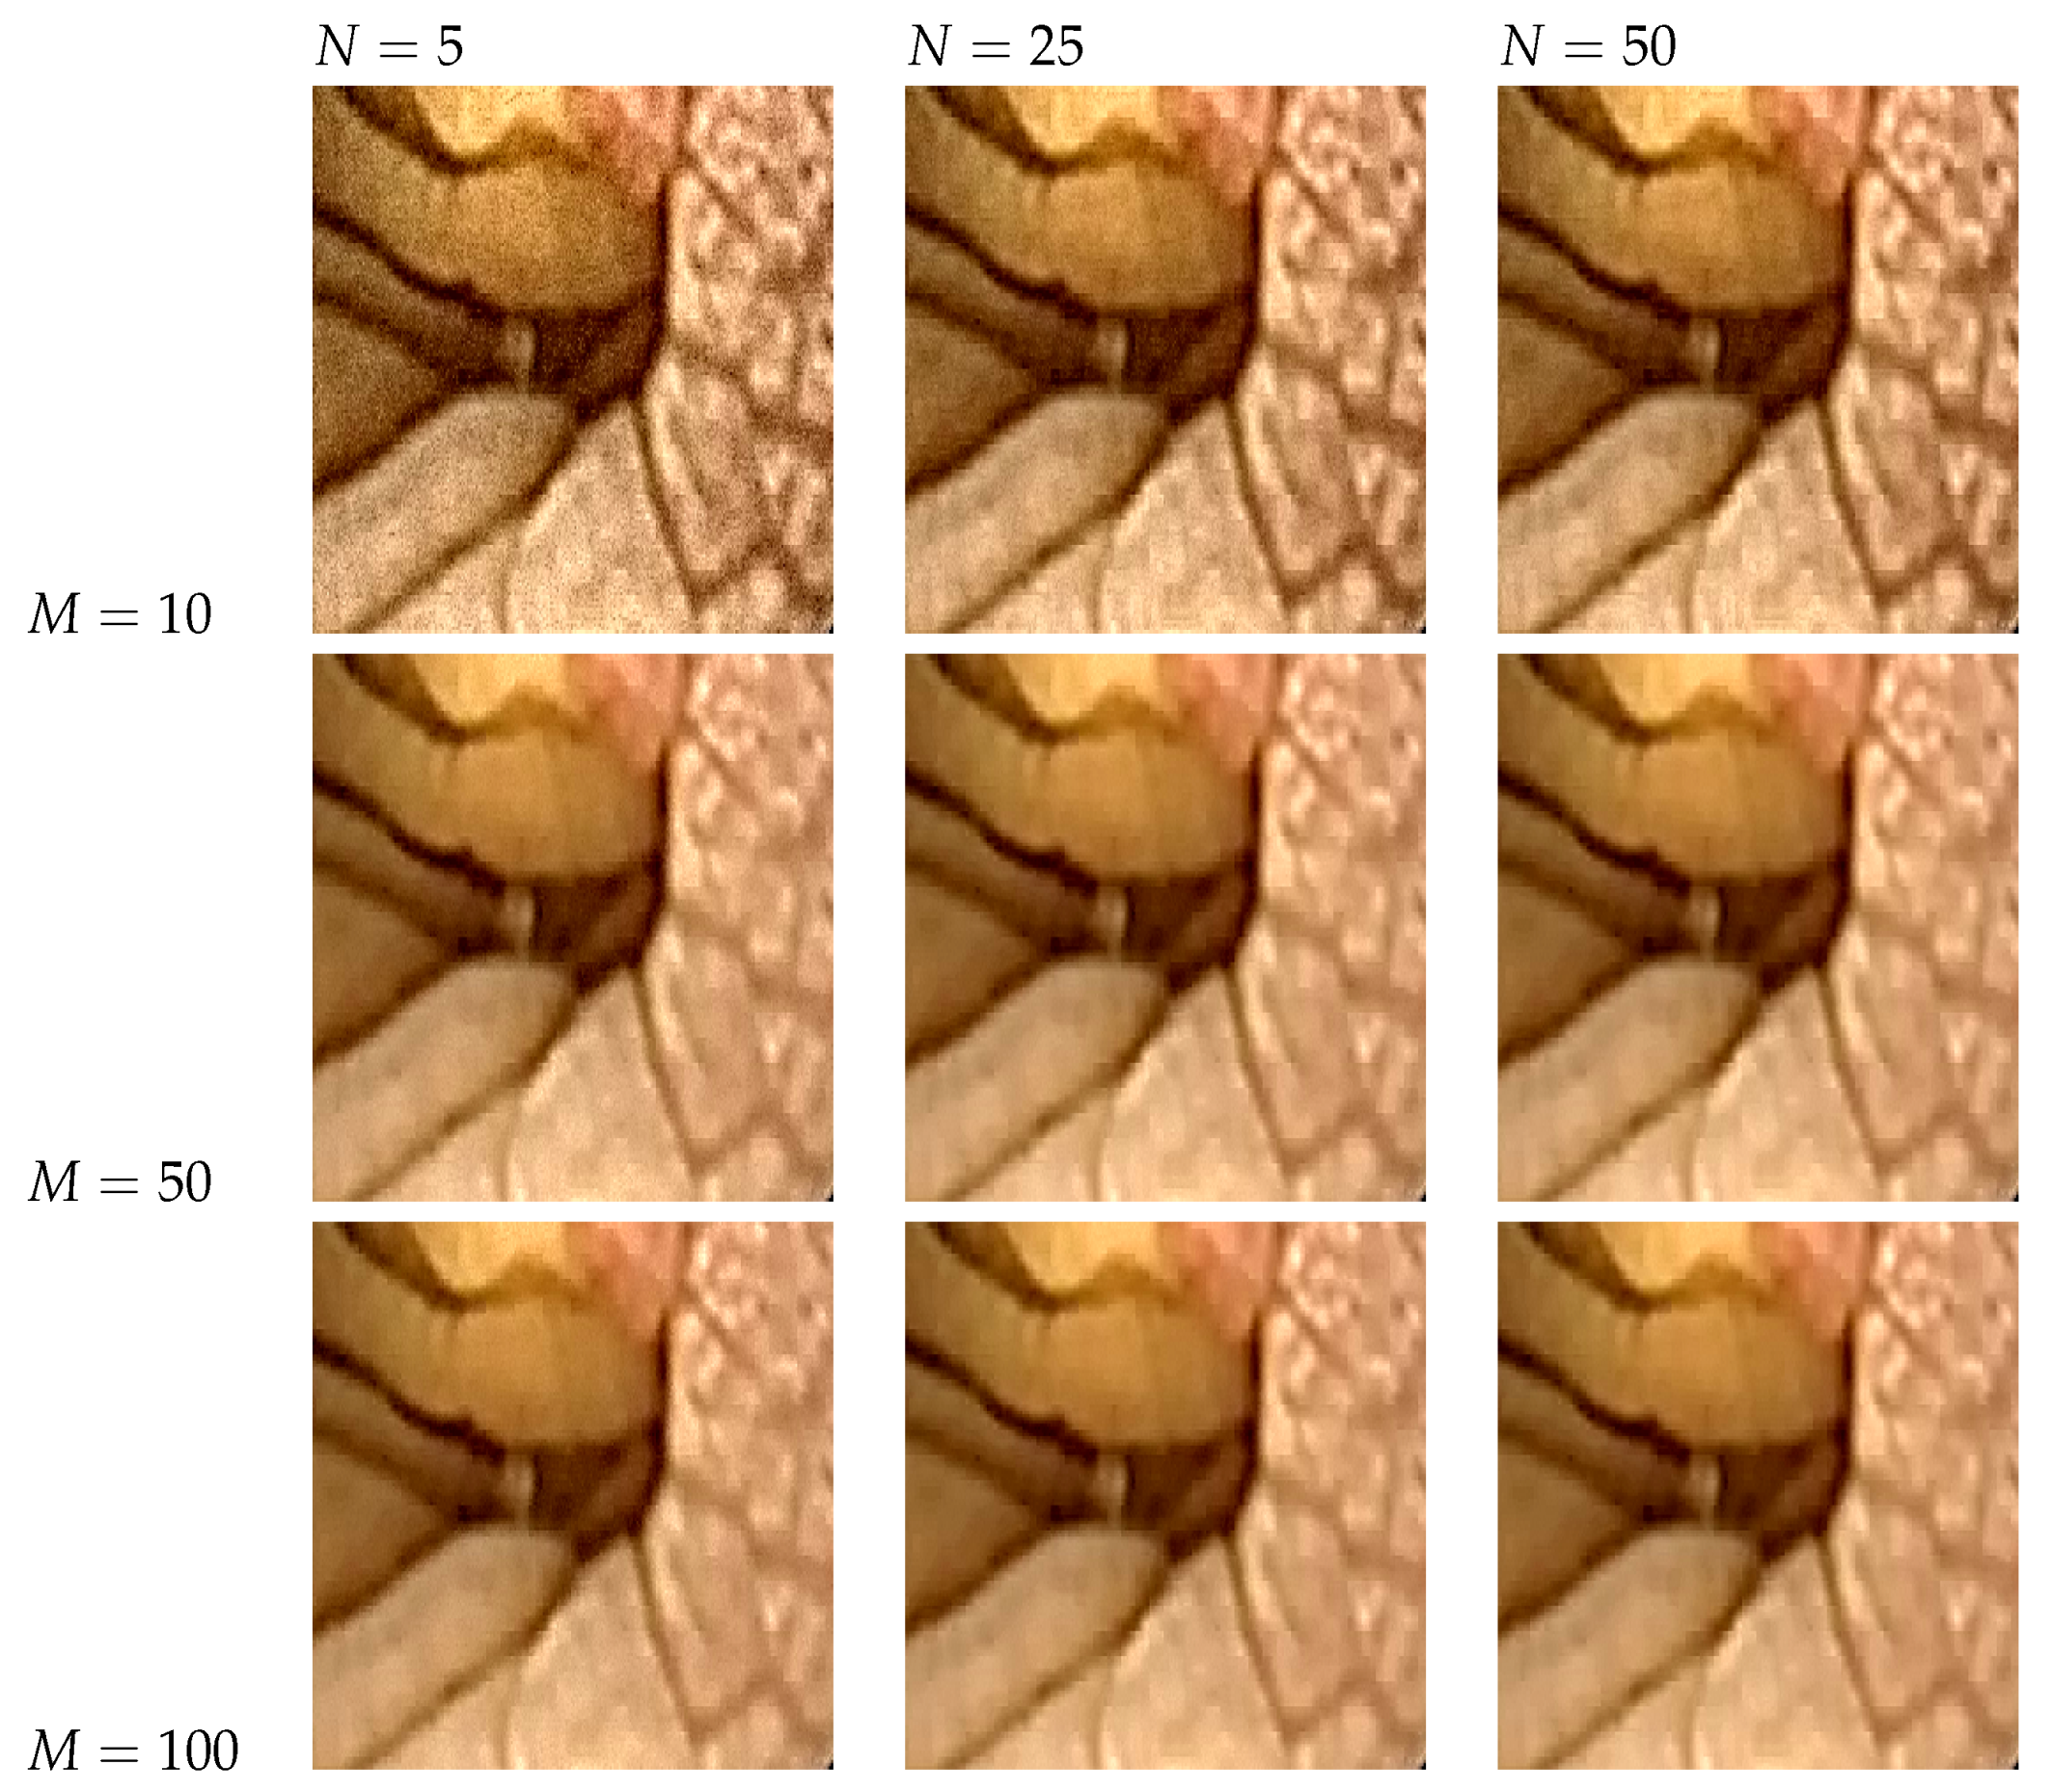
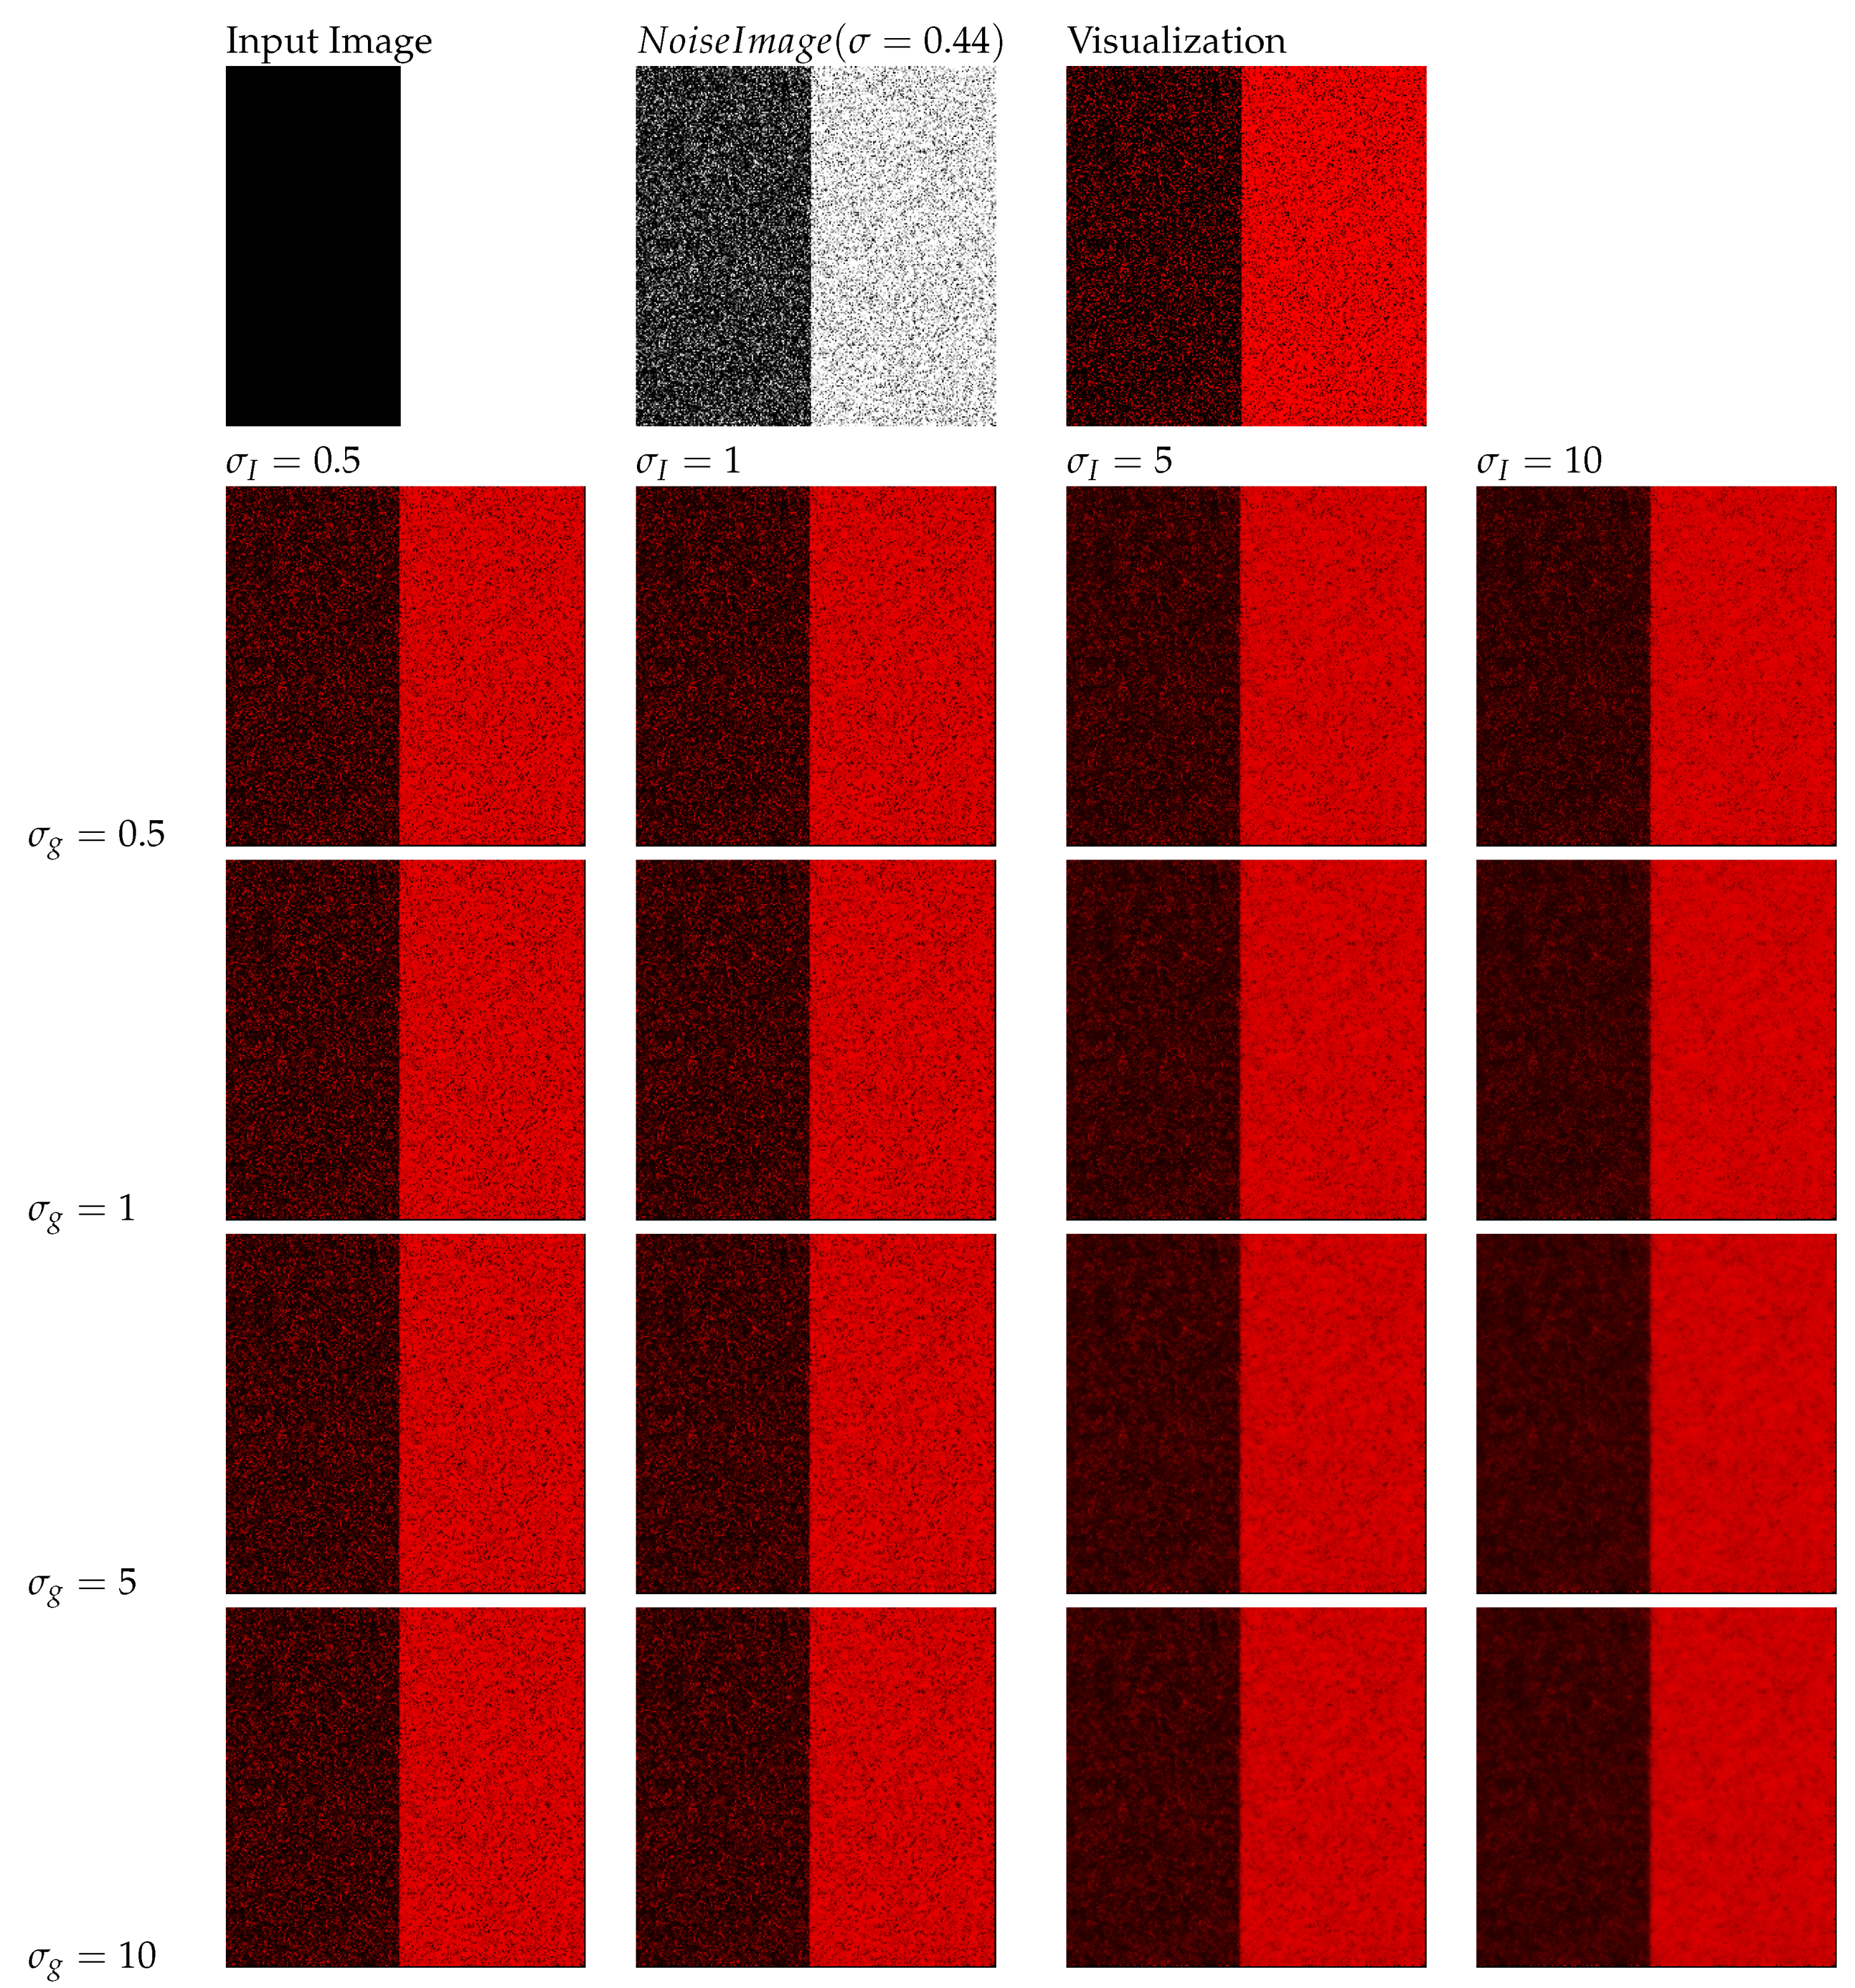
5.5. The Effect of Parameter Selection

Sampling method controls the way the algorithm enhances the contrast and details texture features. The number of iteration, M and samples N, affect the locality of the method. Large number of samples and iteration gives smoother and better result. This is due to a high number of samples give a robust representative of the neighborhood pixel values. The effect of number of iteration and samples in presented in Figure 9. To get a better estimate of the local lightness and blackness together with smooth estimate of the target pixel, the sampling process is iterated several times and averaged as given in Equation (8). This strongly decreases the noise level at the cost of increased time of computation. The radius parameter is the maximum distance from the pixel where the stochastic sampling can be done. It is set in similar way to [18] and controls the locality of the spatial maxima and minima for the adjustment. It is not a critical parameter as long as it is large enough to sample reasonably across the entire image. The inner radius R 1 , determines the size of the random walk and the size of the neighborhood circular window for exploring similar textural features. If R 1 = 0 , the method performs only contrast enhancement similar to [18]. The other parameters that are closely related to R 1 are the σ I and σ g . Taking smaller values of σ I gives lower weights for pixels that have different intensity values from the target pixel. On the other hand, small values of σ g weights on edges crossed during the random walk. For a pixel position that is similar to the target pixel but located on different texture or across edges are given less weights in computing the final estimate of the smoothed image. Large values of R 1 with large values of σ I and σ g result in mean value of the image. Figure 10 shows how the value of σ I and σ g influence the estimation of the base (smooth) layer. As it can be seen large values of σ I and σ g smooth the details and tend to smooth the edges. Hence, we set these parameters to optimal values σ I = 9 for intensity and σ I = 4 for gradient normalization. These parameters do not require changing from image to image and were kept the same for all our experiment.

5.6. Base Layer Estimation

In order to elaborate more on estimation of the base layer i.e., smoothing, we tested the proposed method discussed in Section 3.1 against bilateral filtering for a Gaussian noise type. Smoothing a Gaussian type noise could be required in texture-pattern extraction. These patterns could be capillaries on tissue surface or vascular patterns. Detail textures are critical in defining the progress of inflammatory bowel diseases such as Ulcerative colitis in CVE. The proposed formulation for smoothing, Equation (5), preserves texture and fine details along prominent edges that are inherent in CVE images. The level of smoothing can be controlled by choosing appropriate values of R 1 , σ I and σ g which controls region for the random walk, and penalty for intensity and total gradient variation as the random walk progress from the target pixel to neighboring pixels as defined Section 3.
We tested the proposed method for smoothing on 30 sample images from a KID dataset against bilateral filtering [39] and anisotropic diffusion [24]. A Gaussian noise with standard deviation σ is added to Y channel of the input image. We used PSNR to measure the perceived quality improvement. The parameters of all methods were set initially and were averaged for all test images. The proposed method parameters were set to N = 50 and M = 150 with σ I = 9 , σ g = 4 . For bilateral filtering we used σ s = 5 , σ r = 0 . 1 , and w 1 2 = 5 for spatial, range standard deviation and half window size respectively. Anisotropic diffusion was done for 15 iterations. The results are summarized in Table 2.
As it can be seen in Figure 11, the proposed method results in smooth images yet has no halo effect on edges. As it is noted in Figure 8a and in [22] methods such as bilateral filter and weighted least square (WLS) filter tend to blur edges. As shown in Figure 11c, intensity variation across the sharp edge varies gradually for bilateral filtering hence blurring the edges. Bilateral filter parameters are fine-tuned for a best result with window size of 5. The proposed method has minimal blurring. The small intensity variation of proposed method shown in Figure 11c, which are not present in the original image can be avoided by choosing appropriate values of R 1 , σ I and σ g , which acts as a trade-off parameter between keeping the texture and smoothing the noise.

5.7. Applicability the Proposed Method and Computational Cost

CVE is the best method to evaluate the entire mucosal surface of the small bowel and it plays a key role in evaluation of obscure gastrointestinal bleeding. However, the diagnostic yield of CVE can be affected by many factors, such as indications, bowel preparation, technical errors, view mode and frame rate during interpretation, reviewers experience, and etc. [40]. Contrast enhancement techniques such as flexible spectral imaging color enhancement (FICE) have been reported to improves detection of angioectasia [41]. Moreover, the new contrast image capsule endoscope (CICE) developed by Olympus medical systems has been shown to improved the visibility of minute structures of adenomatous polyps [42]. Hence, enhancement methods are helpful in increasing the visibility and demarcate lesions.
In terms of computational cost, Matlab implementation of the proposed method takes close to 30 s per CVE image. The random walk and stochastic sampling is done only once for a given image and the samples are saved. For the remaining frames, we used the saved sample points to speed up the computation of random walk. As a future work, inspired by recent works in deep edge aware filtering [43], we are working towards training a deep neural network on the proposed enhancement method to speed up the computation. In addition, recent works in generalized random walk [44] for image smoothing could also be used to speed-up the proposed method. Moreover, currently CVE videos are examined off-line and enhancement methods are provided as optional feature in addition to original frame. Therefore, the proposed method can be used in clinical setting as optional view to provide detail and shadow enhanced view of GI tract.

6. Conclusions and Future Work

In this work, we have proposed a framework that could enhance detail and shadow texture of tissues for CVE images. Based on stochastic sampling and edge-aware smoothing, the proposed method delivers a state-of-the-art result for clinical applications. Computational complexity is a limitation of the method. A smaller random walk circle substantially reduces the time required as a trade-off between the number of samples and the level of the details that will be enhanced. To this end, the random walk problem has been posited as solving a Dirichlet problem for image segmentation [45]. For our future work, a similar approach could be used to reformulate the proposed method for faster implementation. Moreover, we are planning to investigate the effect of enhancement for the automated detection of polyps and ulcerative colitis.

Author Contributions

The work presented in this paper was carried out in collaboration between all authors. A.M. conceived and carried out the main part of this manuscript. I.F. contributed in analysis and implementation, S.Y.Y. and M.P. are a supervisors of this research. Ø.H. evaluated the result for clinical application. All authors read and approved the final manuscript.

Acknowledgments

We would like to thank Per Arthur Johansson (M.D), Trond Fladsrud (M.D), Øivind Asak (M.D) and Jan- Arne Skjold (M.D) for participating in the subjective experiment. This research has been supported by the Research Council of Norway through project no. 247689 “IQ-MED: Image Quality enhancement in MEDical diagnosis, monitoring and treatment”.

Conflicts of Interest

The authors declare no conflict of interest.

Abbreviations

The following abbreviations are used in this manuscript:
CVECapsule video endoscopy
CCEColon capsule endoscopy
CLAHEContrast limited adaptive histogram equalization
CMOSComplementary metal-oxide semiconductor)
DFTDiscrete Fourier transform
FICEFlexible spectral imaging color enhancement
HVSHuman Visual System
JNDJust noticeable difference
NBINarrow Band Imaging
SSIMStructural similarity index
WLFWeighted-level framework
WLSweighted least square

References

  1. Rimbaş, M.; Negreanu, L.; Ciobanu, L.; Benguş, A.; Spada, C.; Băicuş, C.R.; Costamagna, G. Is virtual chromoendoscopy useful in the evaluation of subtle ulcerative small-bowel lesions detected by video capsule endoscopy? Endosc. Int. Open 2015, 3, E615. [Google Scholar] [CrossRef] [PubMed]
  2. Sakai, E.; Endo, H.; Kato, S.; Matsuura, T.; Tomeno, W.; Taniguchi, L.; Uchiyama, T.; Hata, Y.; Yamada, E.; Ohkubo, H.; et al. Capsule endoscopy with flexible spectral imaging color enhancement reduces the bile pigment effect and improves the detectability of small bowel lesions. BMC Gastroenterol. 2012, 12, 83. [Google Scholar] [CrossRef] [PubMed]
  3. Lambert, R.; Kuznetsov, K.; Rey, J. Narrow-band imaging in digestive endoscopy. Sci. World J. 2007, 7, 449–465. [Google Scholar] [CrossRef] [PubMed]
  4. Ramaraj, M.; Raghavan, S.; Khan, W.A. Homomorphic filtering techniques for WCE image enhancement. In Proceedings of the 2013 Computational Intelligence and Computing Research (ICCIC), Enathi, India, 26–28 December 2013; pp. 1–5. [Google Scholar]
  5. Ibrahim, H.; Kong, N.S.P. Brightness preserving dynamic histogram equalization for image contrast enhancement. IEEE Trans. Consum. Electr. 2007, 53, 1752–1758. [Google Scholar] [CrossRef]
  6. Okuhata, H.; Nakamura, H.; Hara, S.; Tsutsui, H.; Onoye, T. Application of the real-time Retinex image enhancement for endoscopic images. In Proceedings of the 35th Annual International Conference of the Engineering in Medicine and Biology Society (EMBC), Osaka, Japan, 3–7 July 2013; pp. 3407–3410. [Google Scholar]
  7. Provenzi, E. Computational Color Science: Variational Retinex-Like Methods; John Wiley & Sons: Hoboken, NJ, USA, 2017. [Google Scholar]
  8. Gopi, V.P.; Palanisamy, P.; Niwas, S.I. Capsule endoscopic colour image denoising using complex wavelet transform. In Wireless Networks and Computational Intelligence; Springer: Heidelberg/Berlin, Germany, 2012; pp. 220–229. [Google Scholar]
  9. Liu, H.; Lu, W.S.; Meng, M.Q.H. De-blurring wireless capsule endoscopy images by total variation minimization. In Proceedings of the 2011 IEEE Pacific Rim Conference on Communications, Computers and Signal Processing (PacRim), Victoria, BC, Canada, 23–26 August 2011; pp. 102–106. [Google Scholar]
  10. Beck, A.; Teboulle, M. Fast gradient-based algorithms for constrained total variation image denoising and deblurring problems. IEEE Trans. Image Process. 2009, 18, 2419–2434. [Google Scholar] [CrossRef] [PubMed]
  11. Vu, H.; Echigo, T.; Yagi, K.; Okazaki, H.; Fujiwara, Y.; Yagi, Y.; Arakawa, T. Image-Enhanced capsule endoscopy preserving the original color tones. In Proceedings of the International MICCAI Workshop on Computational and Clinical Challenges in Abdominal Imaging, Cambridge, MA, USA, 14 September 2011; Springer: Heidelberg/Berlin, Germany, 2011; pp. 35–43. [Google Scholar]
  12. Imtiaz, M.S.; Wahid, K.A. Color enhancement in endoscopic images using adaptive sigmoid function and space variant color reproduction. Comput. Math. Methods Med. 2015, 2015, 3905–3908. [Google Scholar] [CrossRef] [PubMed]
  13. Li, B.; Meng, M.Q.H. Wireless capsule endoscopy images enhancement via adaptive contrast diffusion. J. Vis. Commun. Image Represent. 2012, 23, 222–228. [Google Scholar] [CrossRef]
  14. Attar, A.; Xie, X.; Zhang, C.; Wang, Z.; Yue, S. Wireless Micro-Ball endoscopic image enhancement using histogram information. In Proceedings of the 2014 36th Annual International Conference of the Engineering in Medicine and Biology Society (EMBC), Chicago, IL, USA, 26–30 August 2014; pp. 3337–3340. [Google Scholar]
  15. Srivastava, R.; Gupta, J.; Parthasarthy, H.; Srivastava, S. PDE based unsharp masking, crispening and high boost filtering of digital images. In Proceedings of the International Conference on Contemporary Computing, Aachen, Germany, 19–21 August 2009; Springer: Heidelberg/Berlin, Germany, 2009; pp. 8–13. [Google Scholar]
  16. Sheet, D.; Garud, H.; Suveer, A.; Mahadevappa, M.; Chatterjee, J. Brightness preserving dynamic fuzzy histogram equalization. IEEE Trans. Consum. Electr. 2010, 56, 2475–2480. [Google Scholar] [CrossRef]
  17. Rukundo, O.; Pedersen, M.; Hovde, Ø. Advanced Image Enhancement Method for Distant Vessels and Structures in Capsule Endoscopy. Comput. Math. Methods Med. 2017, 2017. [Google Scholar] [CrossRef] [PubMed]
  18. Kolås, Ø.; Farup, I.; Rizzi, A. Spatio-temporal Retinex-inspired envelope with stochastic sampling: A framework for spatial color algorithms. J. Imag. Sci. Technol. 2011, 55, 40503-1–40503-10. [Google Scholar]
  19. Black, M.J.; Sapiro, G.; Marimont, D.H.; Heeger, D. Robust anisotropic diffusion. IEEE Trans. Image Process. 1998, 7, 421–432. [Google Scholar] [CrossRef] [PubMed] [Green Version]
  20. Estrada, F.J.; Fleet, D.J.; Jepson, A.D. Stochastic Image Denoising. In Proceedings of the British Machine Vision Conference, London, UK, 7–10 September 2009; pp. 1–11. [Google Scholar]
  21. Azzabou, N.; Paragios, N.; Guichard, F. Random Walks, Constrained Multiple Hypothesis Testing and Image Enhancement; Springer: Heidelberg/Berlin, Germany, 2006; pp. 379–390. [Google Scholar]
  22. Subr, K.; Soler, C.; Durand, F. Edge-preserving multiscale image decomposition based on local extrema. ACM Trans. Graph. 2009, 28, 147. [Google Scholar] [CrossRef] [Green Version]
  23. Wang, Z.; Wang, H.; Sun, X.; Zheng, X. An Image Enhancement Method Based on Edge Preserving Random Walk Filter; Springer: Heidelberg/Berlin, Germany, 2015; pp. 433–442. [Google Scholar]
  24. Perona, P.; Malik, J. Scale-space and edge detection using anisotropic diffusion. IEEE Trans. Patt. Anal. Mach. Intell. 1990, 12, 629–639. [Google Scholar] [CrossRef] [Green Version]
  25. Easley, G.R.; Labate, D.; Colonna, F. Shearlet-based total variation diffusion for denoising. IEEE Trans. Image Process. 2009, 18, 260–268. [Google Scholar] [CrossRef] [PubMed]
  26. Shih, A.C.; Liao, H.Y.; Lu, C.S. A new iterated two-band diffusion equation: theory and its application. IEEE Trans. Image Process. 2003, 12, 466–476. [Google Scholar] [CrossRef] [PubMed]
  27. Rajpoot, K.; Rajpoot, N.; Noble, J.A. Discrete Wavelet Diffusion for Image Denoising; Springer: Heidelberg/Berlin, Germany, 2008; pp. 20–28. [Google Scholar]
  28. Fattal, R.; Agrawala, M.; Rusinkiewicz, S. Multiscale shape and detail enhancement from multi-light image collections. ACM Trans. Graph. 2007, 26, 51. [Google Scholar] [CrossRef] [Green Version]
  29. Farbman, Z.; Fattal, R.; Lischinski, D.; Szeliski, R. Edge-preserving decompositions for multi-scale tone and detail manipulation. ACM Trans. Graph. 2008, 27, 67. [Google Scholar] [CrossRef]
  30. Holm, J.; Tastl, I.; Johnson, T. Definition & use of the ISO 12640-3 reference color gamut. In Proceedings of the Color and Imaging Conference Society for Imaging Science and Technology, Scottsdale, AZ, USA, 6–10 November 2006; Volume 2006, pp. 62–68. [Google Scholar]
  31. Koulaouzidis, A.; Iakovidis, D. KID: Towards a Reference Database for Intelligent Capsule Endoscopy. In Proceedings of the IEEE Engineering in Medicine and Biology Conference (EMBC), Milan, Italy, 25–29 August 2015; pp. 1–2. [Google Scholar]
  32. Montag, E.D. Empirical formula for creating error bars for the method of paired comparison. J. Electr. Imag. 2006, 15, 010502. [Google Scholar] [CrossRef] [Green Version]
  33. Simone, G.; Pedersen, M.; Hardeberg, J.Y. Measuring perceptual contrast in digital images. J. Vis. Commun. Image Represent. 2012, 23, 491–506. [Google Scholar] [CrossRef]
  34. Wang, Z.; Bovik, A.C.; Sheikh, H.R.; Simoncelli, E.P. Image quality assessment: from error visibility to structural similarity. IEEE Trans. Image Process. 2004, 13, 600–612. [Google Scholar] [CrossRef] [PubMed]
  35. Zhang, L.; Zhang, L.; Mou, X.; Zhang, D. FSIM: A feature similarity index for image quality assessment. IEEE Trans. Image Proces. 2011, 20, 2378–2386. [Google Scholar] [CrossRef] [PubMed]
  36. Wang, Z.; Li, Q. Information content weighting for perceptual image quality assessment. IEEE Trans. Image Process. 2011, 20, 1185–1198. [Google Scholar] [CrossRef] [PubMed]
  37. Zuiderveld, K. Contrast limited adaptive histogram equalization. In Graphics Gems; Academic Press Inc.: Cambridge, UK, 1994; pp. 474–485. [Google Scholar]
  38. Xu, L.; Lu, C.; Xu, Y.; Jia, J. Image smoothing via L 0 gradient minimization. ACM Trans. Graph. 2011, 30, 174. [Google Scholar] [CrossRef]
  39. Tomasi, C.; Manduchi, R. Bilateral filtering for gray and color images. In Proceedings of the Sixth International Conference on Computer Vision, Bombay, India, 7 Januray 1998; pp. 839–846. [Google Scholar] [Green Version]
  40. Shim, K.N.; Jeon, S.R.; Jang, H.J.; Kim, J.; Lim, Y.J.; Kim, K.O.; Song, H.J.; Lee, H.S.; Park, J.J.; Kim, J.H.; et al. Quality indicators for small bowel capsule endoscopy. Clin. Endosc. 2017, 50, 148. [Google Scholar] [CrossRef] [PubMed]
  41. Imagawa, H.; Oka, S.; Tanaka, S.; Noda, I.; Higashiyama, M.; Sanomura, Y.; Shishido, T.; Yoshida, S.; Chayama, K. Improved detectability of small-bowel lesions via capsule endoscopy with computed virtual chromoendoscopy: a pilot study. Scand. J. Gastroenterol. 2011, 46, 1133–1137. [Google Scholar] [CrossRef] [PubMed]
  42. Hatogai, K.; Hosoe, N.; Imaeda, H.; Rey, J.F.; Okada, S.; Ishibashi, Y.; Kimura, K.; Yoneno, K.; Usui, S.; Ida, Y.; et al. Role of enhanced visibility in evaluating polyposis syndromes using a newly developed contrast image capsule endoscope. Gut liver 2012, 6, 218. [Google Scholar] [CrossRef] [PubMed]
  43. Xu, L.; Ren, J.; Yan, Q.; Liao, R.; Jia, J. Deep edge-aware filters. In Proceedings of the 32nd International Conference on Machine Learning, Lille, France, 6–11 July 2015; pp. 1669–1678. [Google Scholar]
  44. Wang, Z.; Wang, H. Image smoothing with generalized random walks: Algorithm and applications. Appl. Soft Comput. 2016, 46, 792–804. [Google Scholar] [CrossRef]
  45. Grady, L. Random walks for image segmentation. IEEE Trans. Patt. Anal. Mach. Intell. 2006, 28, 1768–1783. [Google Scholar] [CrossRef] [PubMed]
Figure 1. Concentric sampling regions for the target pixel at the center to characterize local visual context. As shown in the right-hand image, once the random walk is beyond the inner circle random sampling is done, marked by the red dots. All of the samples are aggregated to form one chain.
Jimaging 04 00075 g001
Figure 2. (a) Stochastic sampling: Random walks capture low variance neighbors that are essential for smoothing whilst random sampling captures high variance intensity variations that are essential for local contrast enhancement Therefore, random walks are used for smoothing whilst random samples weights are set to zero. (b) Weight estimation of random walks along path starting from target pixel. Pixels inside the inner circle are assigned weights according to Equation (1).
Jimaging 04 00075 g002
Figure 3. (a) Y channel of input image; (b) shows the smoothed image using random walk. From the intensity variation across, row 165 of the image, in (c) the smoothing preserves edges and smooths only detail variation on the surface. Hence captures the surface texture of the tissues.
Jimaging 04 00075 g003
Figure 4. (a) Input image from PillCam COLON camera showing a Polyp of 9 mm size (b) Enhanced image using proposed method, in which color tone is kept whilst the details are enhanced; Compared to the original it can be seen that lumen and shadow details of the surface texture are more visible on the enhanced image; (c) Shows different layers of image decomposition D 1 , D 2 , and D of Equation (10) as compared to the original and enhanced image Equation (11). As it is shown the two detail layers captures low contrast shadows and surface details.
Jimaging 04 00075 g004
Figure 5. Psychometric experimental setup for subjective evaluation of diagnostic quality of an image. The observer gives letters from A (best) to D (worst) quality image for diagnosis.
Jimaging 04 00075 g005
Figure 6. Rank order z-score showing observer preference for diagnostic image quality.
Jimaging 04 00075 g006
Figure 7. Average observers preference for the sample images selected for the subjective experiment.
Jimaging 04 00075 g007
Figure 8. Comparison of different methods on PillCam COLON images. (a) Input image showing a splenic flexure (b) It is visually easy to see that our framework enhances the local contrast and the details of the tissue surface simultaneously. On both images, the proposed method gives a consistent result under different illumination variation. (c) Shows result from CLAHE and (d)-(g) are results from different image decomposition techniques. (e) WLS [29], (f) L0 Gradient Minimization [38], (g) Local Extrema [39]. Bilateral [28] (d) image decomposition technique enhances the details, but creates a halo effect on edges which appear to widen the blood vessels and other tissue surfaces. Moreover; (c) enhances the local contrast but the details of the tissue surface are lost.
Jimaging 04 00075 g008
Figure 9. The effect of number of samples (N) and iteration (M). The input image is size of 174 × 294. R1 and R2 are set to 3 and 200 respectively with σ I = 9 and σ g = 4 .
Jimaging 04 00075 g009
Figure 10. Parameter setting for σ I and σ g . The top row shows the input setup. The first image is noise free image input image size 255 × 255 . A Gaussian noise of σ = 0 . 44 is added to the image. We converted the image to color for better visualization. Smaller value of σ I and σ g gives smaller weight to neighboring pixels intensity and gradient respectively. With higher values of σ I and σ g the neighboring pixels have higher weights Equation (5) and could result in blurring the edges. Hence, any value of σ I > σ g and σ g > 5 gives reasonable estimate of the base layer of the image.
Jimaging 04 00075 g010
Figure 11. Comparison of smoothing methods: (a) Input image. (b) A Gaussian noise of σ = 0 . 09 is added on the input image (c) Shows intensity variation across row 165 of noisy image and smoothed image using bilateral filtering and the proposed method. From (df) we can see that the proposed method gives a better edge-aware filtering compared to bilateral filtering. Moreover, it is easier to see that bilateral filtering creates a halo effect around edges.
Jimaging 04 00075 g011
Table 1. Average performance of different methods using WLF, SSIM, CIE2000, FSIM, IW-SSIM metrics respectively. SSIM, FSIM and IW-SSIM represent full reference and WLS representes no-reference image quality metric.
Average Performance of Enhancement Methods Based on Objective Quality Metrics
MethodsWLF RatioSSIMCIE2000FSIMIW-SSIM
Bilateral [28]1.060.923.030.950.93
WLS [29]1.280.923.290.940.92
CLAHE [37]2.650.823.600.890.83
Proposed1.480.903.450.920.93
Table 2. PSNR values of different denoising algorithms for a Gaussian noise with a standard deviation σ .
Denoising
σ ValueBilateral FilterAnisotropic DiffusionRandom Walks
σ = 0.0336.0827.5935.17
σ = 0.0933.4027.2932.45
σ = 0.2719.4132.4523.85

