Article

Automated Analysis of Spatially Resolved X-ray Scattering and Micro Computed Tomography of Artificial and Natural Enamel Carious Lesions

1
Biomaterials Science Center, University of Basel, Gewerbestrasse 14, 4123 Allschwil, Switzerland
2
UCLA School of Dentistry, University of California, 10833 Le Conte Ave., Los Angeles, CA 90095-1668, USA
3
Paul Scherrer Institute (PSI), 5232 Villigen, Switzerland
*
Author to whom correspondence should be addressed.
J. Imaging 2018, 4(6), 81; https://doi.org/10.3390/jimaging4060081
Submission received: 10 April 2018 / Revised: 11 June 2018 / Accepted: 13 June 2018 / Published: 15 June 2018
(This article belongs to the Special Issue Phase-Contrast and Dark-Field Imaging)

Abstract

:
Radiography has long been the standard approach to characterize carious lesions. Spatially resolved X-ray diffraction, specifically small-angle X-ray scattering (SAXS), has recently been applied to caries research. The aims of this combined SAXS and micro computed tomography (µCT) study were to locally characterize and compare the micro- and nanostructures of one natural carious lesion and of one artificially induced enamel lesion; and demonstrate the feasibility of an automated approach to combined SAXS and µCT data in segmenting affected and unaffected enamel. Enamel, demineralized by natural or artificial caries, exhibits a significantly reduced X-ray attenuation compared to sound enamel and gives rise to a drastically increased small-angle scattering signal associated with the presence of nanometer-size pores. In addition, X-ray scattering allows the assessment of the overall orientation and the degree of anisotropy of the nanostructures present. Subsequent to the characterization with µCT, specimens were analyzed using synchrotron radiation-based SAXS in transmission raster mode. The bivariate histogram plot of the projected data combined the local scattering signal intensity with the related X-ray attenuation from µCT measurements. These histograms permitted the segmentation of anatomical features, including the lesions, with micrometer precision. The natural and artificial lesions showed comparable features, but they also exhibited size and shape differences. The clear identification of the affected regions and the characterization of their nanostructure allow the artificially induced lesions to be verified against selected natural carious lesions, offering the potential to optimize artificial demineralization protocols. Analysis of joint SAXS and µCT histograms objectively segmented sound and affected enamel.

1. Introduction

Tooth enamel, a unique body tissue, presents some distinctive challenges to study. Compared to other human tissues, it is extremely dense and homogenous, comprising almost entirely of elongated hydroxyapatite crystallites. The organization of tooth enamel is particularly complex with orientation and structure at nanometer, micrometer, and millimeter levels, but the remarkably uniform composition obscures structural subtlety to most forms of examination.
Carious dissolution of tooth enamel, the most common disease to afflict mankind, has been studied since the late 19th century [1,2,3]. Caries detection, characterization and diagnosis remain a problematical issue [4]. Diagnosis is the art of identifying a disease through signs and symptoms, but early enamel caries may present few if any symptoms to the patient and few if any signs to the clinician. Hence, much attention has focused upon caries detection, primarily through radiography and optical inspection. In a clinical setting, radiographic appearance alone, specifically the depth of radiolucency, is often used to make a decision as whether to treat or not.
Radiographic sensitivity to early stage subsurface lesions, however, is limited and often even inadequate [5]. Substantial carious dissolution must occur before the lesion is reliably detected in vivo [6]. Attenuation coefficient in projection might therefore be insufficient. Scattering arising from micro/nano-porosity provides a different type of contrast. It is reasonable to hypothesize that the combination of X-ray attenuation and scattering signals allows for a better caries detection.
For in vitro detection, more sensitive X-ray methods can be used, because the X-ray dose is hardly relevant, thus allowing the exploration of alternative methods for caries identification, still a matter of investigation [7,8,9]. Improved objective measures of the early carious lesion would be of inestimable clinical and research utility [10].
Spatially resolved micro-beam small-angle (SAXS) and wide-angle (WAXS) X-ray scattering was first applied to complex hierarchically organized biological structures two decades ago [11]. Such reciprocal-space techniques have been frequently used to analyze calcified tissues ex vivo, often combined with more or less surface sensitive electron and light microscopies. SAXS and WAXS yield information complementary to hard X-ray transmission (radiography) [12,13,14] and similar to that obtained in grating-based X-ray dark-field imaging [15].
Likewise, micro-beam diffraction techniques have been applied to nanostructural and crystallographic investigations of healthy enamel as well as on artificially induced and natural caries [16,17,18,19,20,21,22]. The degree of co-alignment of hydroxyapatite crystallites within unaffected and carious enamel has been quantified using WAXS [17,19]. Crystallite loss, measured using WAXS, has been related to void formation, measured using SAXS, in subsurface lesions [22]. In such studies, information from complementary techniques was compared, but classification of enamel as being either carious or unaffected was performed using one selected standard alone. We propose combining X-ray imaging, i.e., radiography and micro computed tomography (µCT) with spatially resolved SAXS to segment the carious enamel on about 0.5 mm-thick crown slices. Here, we use radiographic projections obtained by forward-projecting µCT data to enhance the segmentation of the two-dimensional SAXS data. The three-dimensional data is ultimately not necessary, but useful for validation purposes. Data from spatially resolved SAXS and µCT have not previously been combined with a (semi-)automated histogram analysis approach to segment affected and unaffected tissues. Both techniques have previously been used independently for the in vitro characterization of carious lesions [23,24,25,26].
Micro-beam diffraction was proposed as an analytic tool, e.g., in bone [27], or for breast [28] and brain cancer [29] characterization. Our approach could extend these methods for the segmentation of normal and diseased, or normal and repaired tissues.
Hence, we comparatively study one artificial lesion prepared within days and one selected natural carious lesion formed over a comparatively much longer period of time in the order of months or even years by means of the complementary experimental techniques SAXS and radiography/µCT using specifically developed software for their combined analysis. The goal of the investigation is to demonstrate the feasibility of the (semi-)automated analysis of the joint SAXS and forward-projected µCT histogram to localize normal and affected enamel within a crown slice of clinically relevant thickness. This approach also extends the scope of application for both characterization techniques to an artificially induced lesion and the additional benefit resulting from dedicated data analysis of their combination. The questions of whether and how far quickly generated artificial lesions correspond to natural lesions is, thus, directly addressed for the first time using the combination of multiple parameters.

2. Materials and Methods

2.1. Ethical Approval

A naturally occurring surface carious lesion, a white spot, and an artificially induced carious lesion, obtained from second and third molars, were studied. All procedures were conducted in accordance with the Declaration of Helsinki and according to the ethical guidelines of the Canton of Basel, Switzerland. The responsible Ethical Committee approved the study with the number 290/13. The teeth were previously scheduled for extraction for clinical reasons unrelated to this study. Patients gave written consent for the use of their extracted teeth in the registration form of the Volkszahnklinik in Basel, Switzerland. The donated teeth were anonymized.

2.2. Sample Preparation

Immediately after extraction, the teeth were immersed in a 0.1% thymol solution. Soft tissue, calculus, and alveolar bone remaining on the extracted teeth were removed using a scalpel. The artificial lesion was defined by painting the tooth with a layer of nail varnish, leaving a window about 2 mm × 2 mm in size, see reference [29]. Subsequently, the tooth was incubated for three days in an acidic demineralization buffer (50 mM acetic acid, 2.2 mM CaCl2, 2.2 mM NaH2PO4, titrated with 1 M KOH to pH 4.4) [30]. All chemicals were supplied by Sigma-Aldrich Co. LLC (Sigma-Aldrich Chemie GmbH, Buchs, Switzerland). Tooth slices were cut using a band saw (Exakt Apparatebau GmbH, Norderstedt, Germany). The slices, 1300 and 500 µm thin, were stored in water before and during measurements to prevent drying. The schemes in Figure 1a,b show the sample preparation steps for the teeth with artificial and natural lesion, respectively.

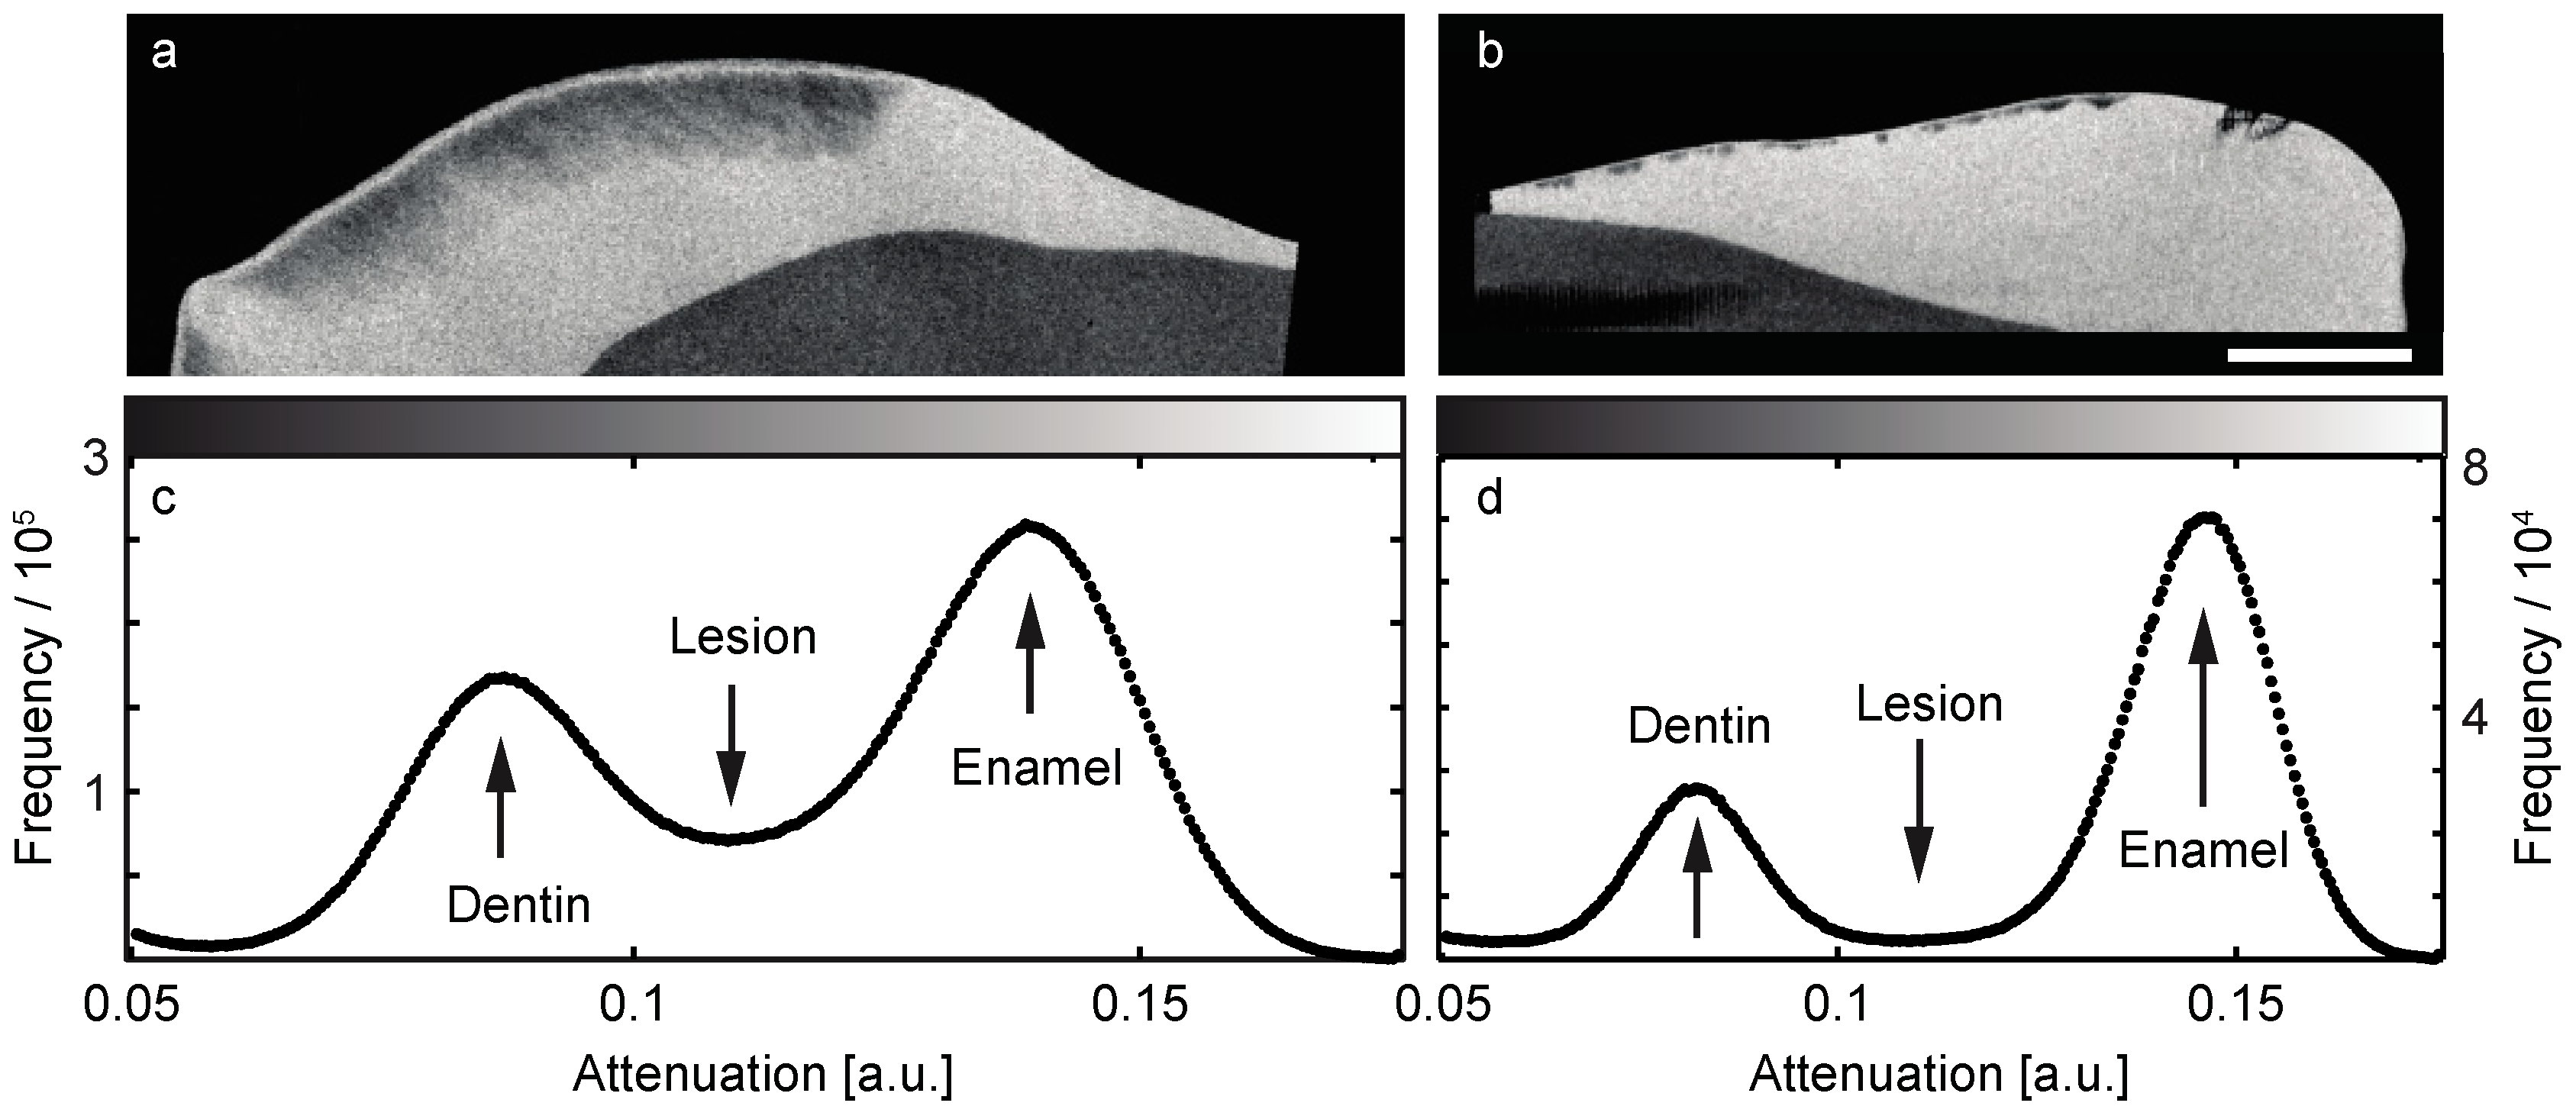
2.3. Micro Computed Tomography

The tooth slices were individually transferred into a deionized water-filled Eppendorf tube to maintain a wet environment and prevent drying. This Eppendorf tube was glued onto the holder of the manipulator in the μCT-system. Micro computed tomography data sets were acquired using a nanotom® m (phoenix|X-ray, GE Sensing and Inspection Technologies GmbH, Wunstorf, Germany) [31]. The voxel length corresponded to 7.0 μm. A 0.2 mm-thick copper filter was placed into the beam path to increase the mean photon energy and reduce beam hardening. For all specimens, the acceleration voltage was set to 90 kV with a tungsten-on-diamond target.
The acquired data were reconstructed using phoenix datos|x 2.0 reconstruction software (phoenix|X-ray, GE Sensing & Inspection Technologies GmbH, Wunstorf, Germany). Segmentation through thresholding was performed in MATLAB (2014a, MathWorks, Natick, MA, USA) in order to extract information about the magnitude of the local attenuation coefficients, directly related to density, within the selected parts of the teeth. The performance of the advanced laboratory µCT system for the analysis of crown of human teeth is comparable to synchrotron radiation-based setups [32].

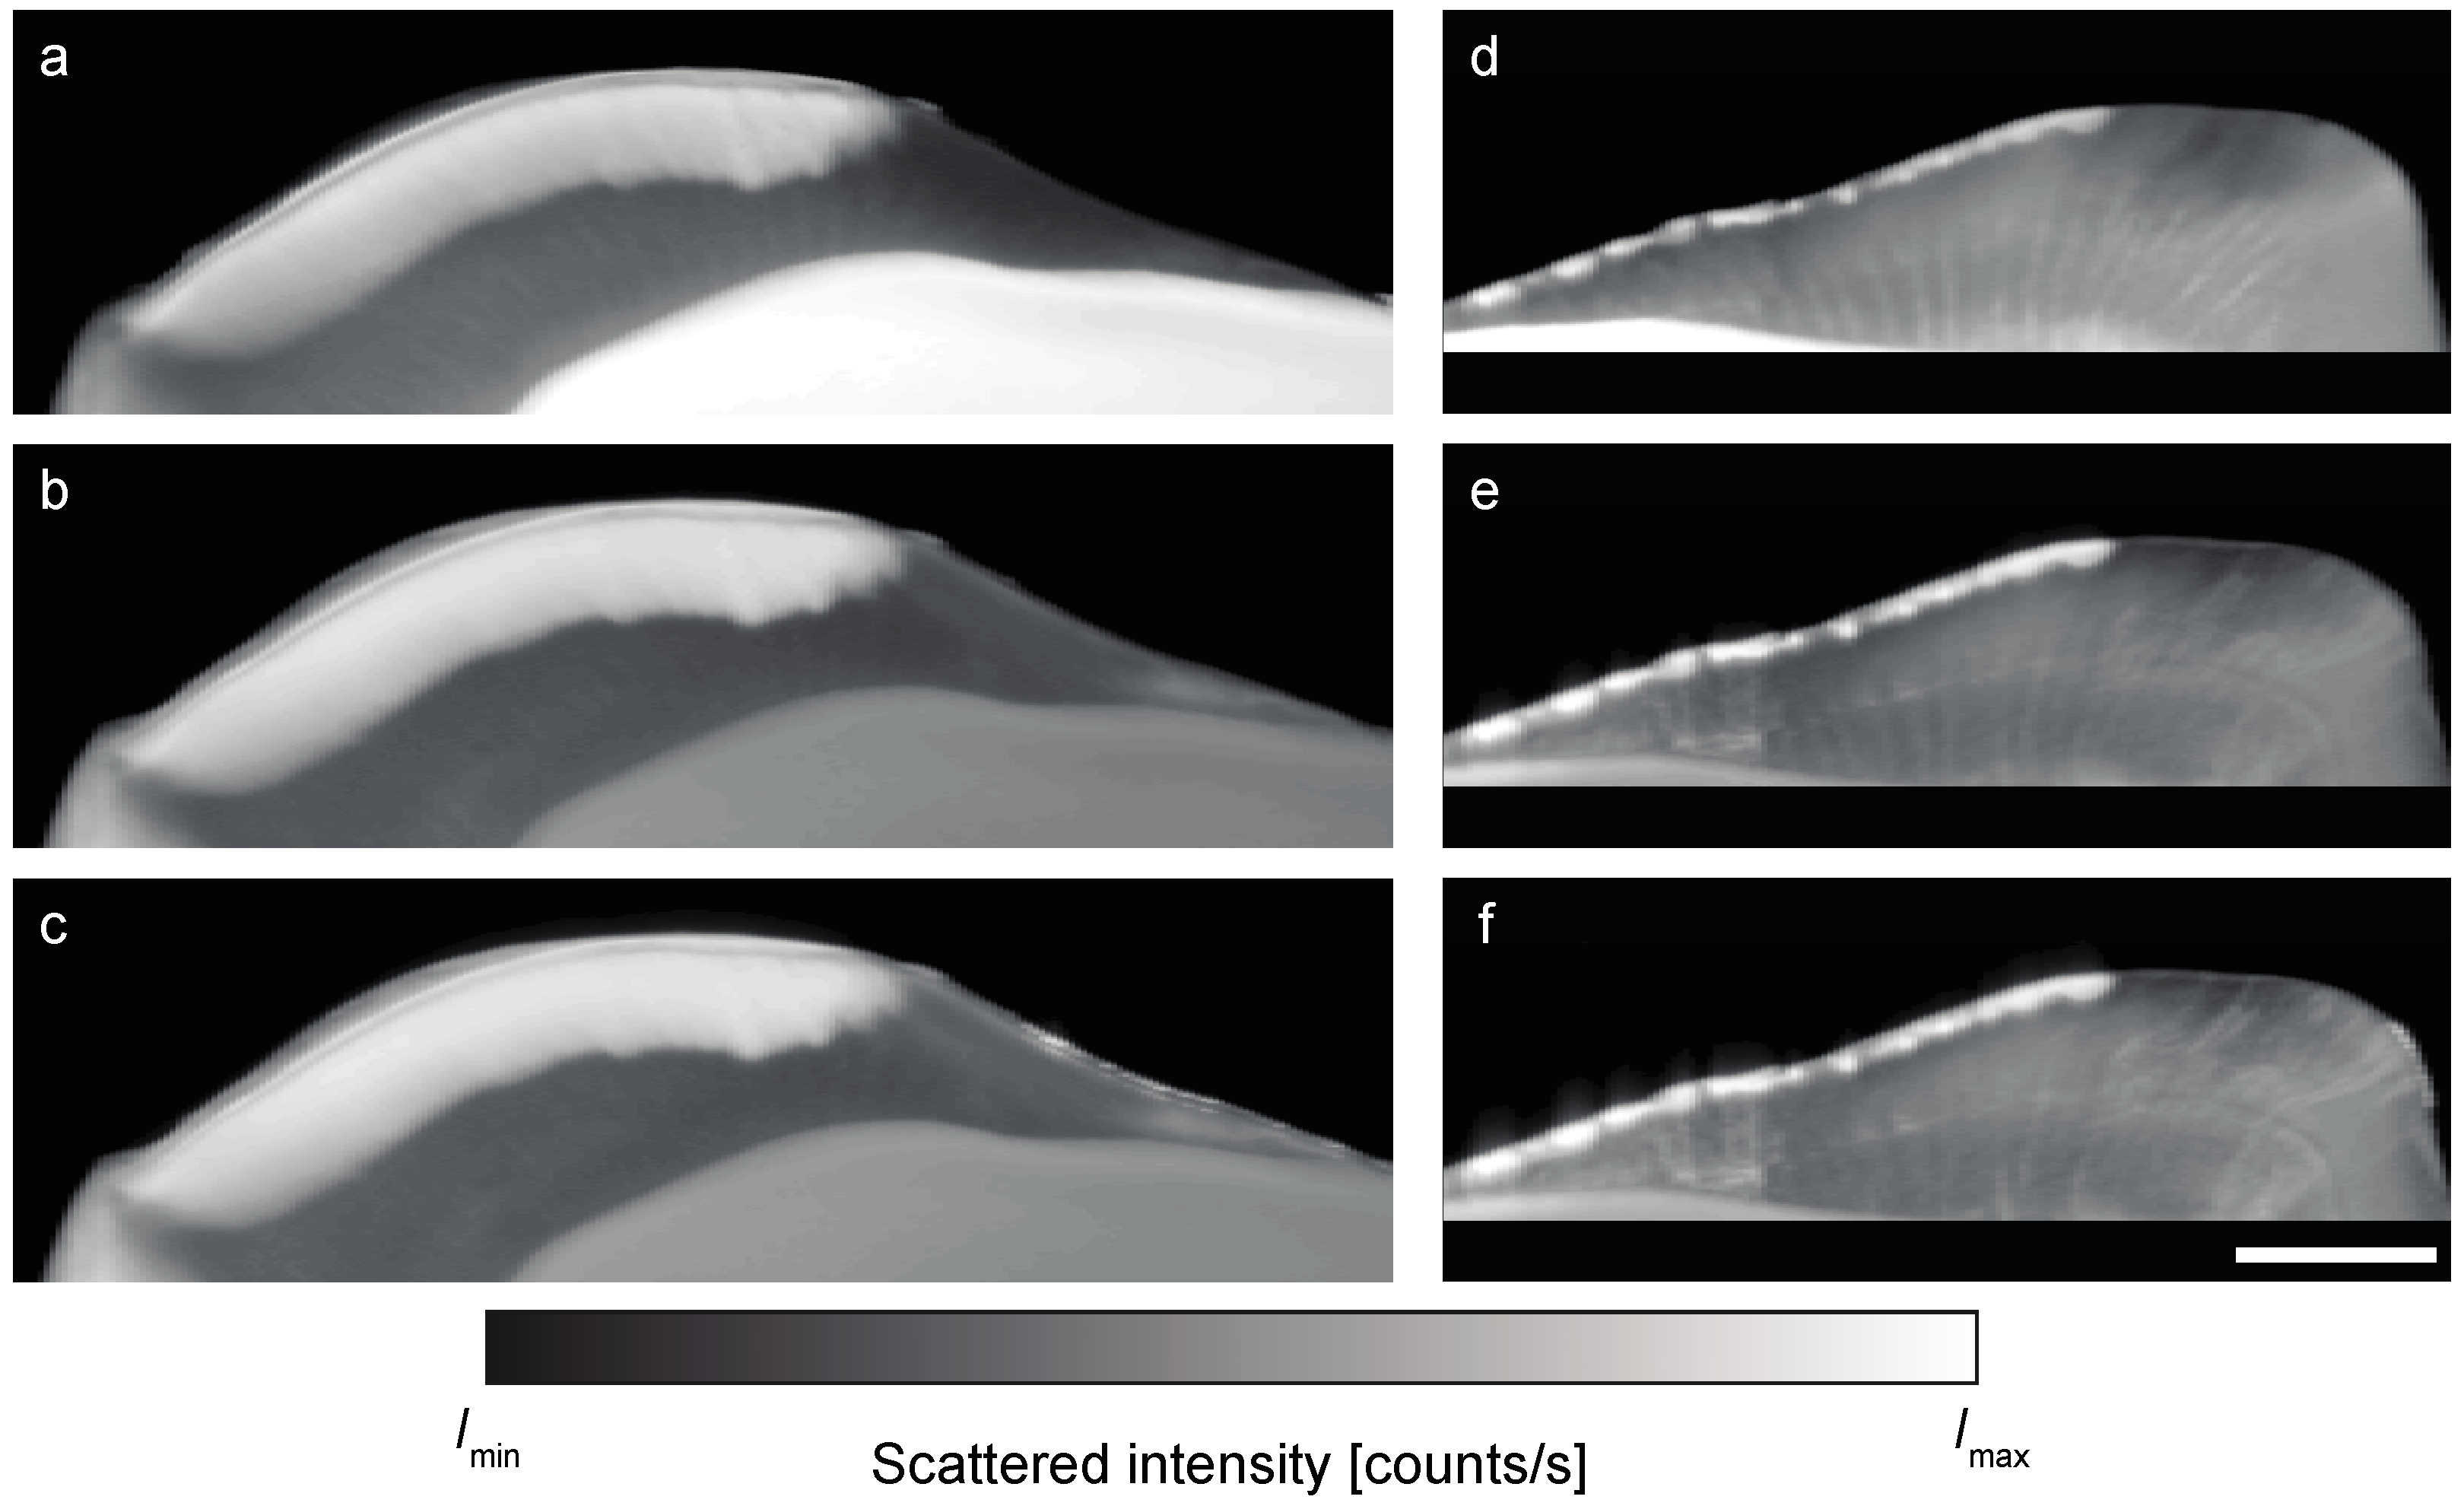
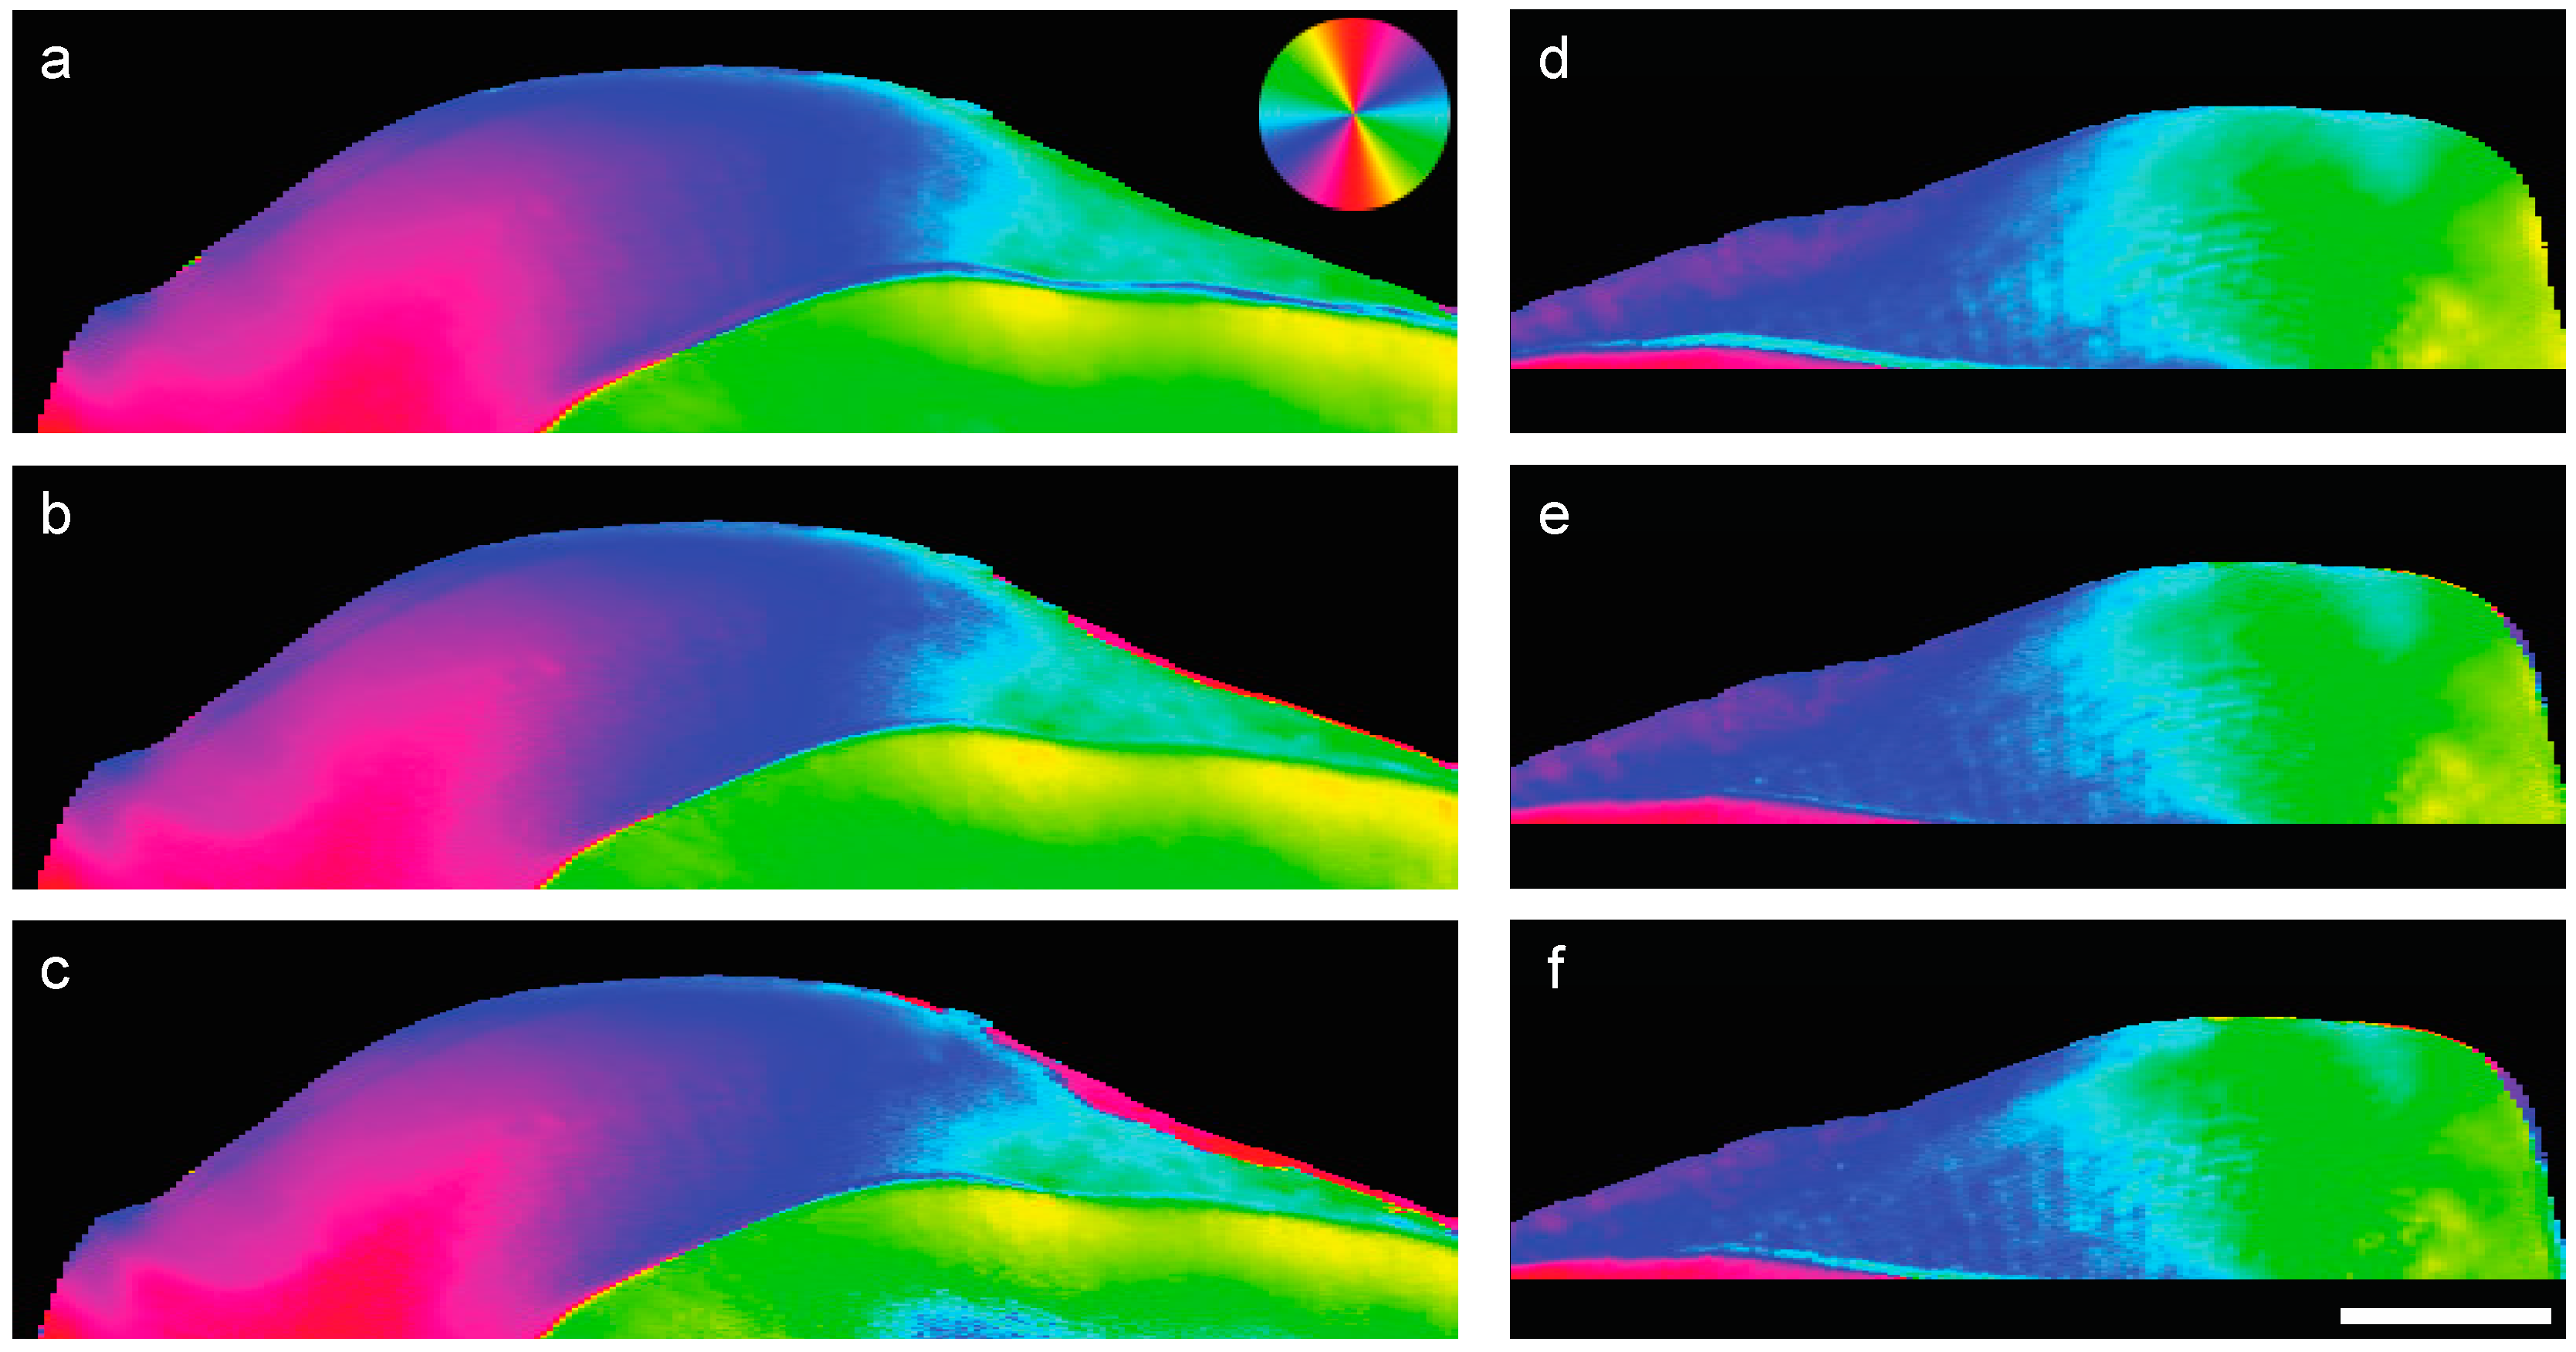
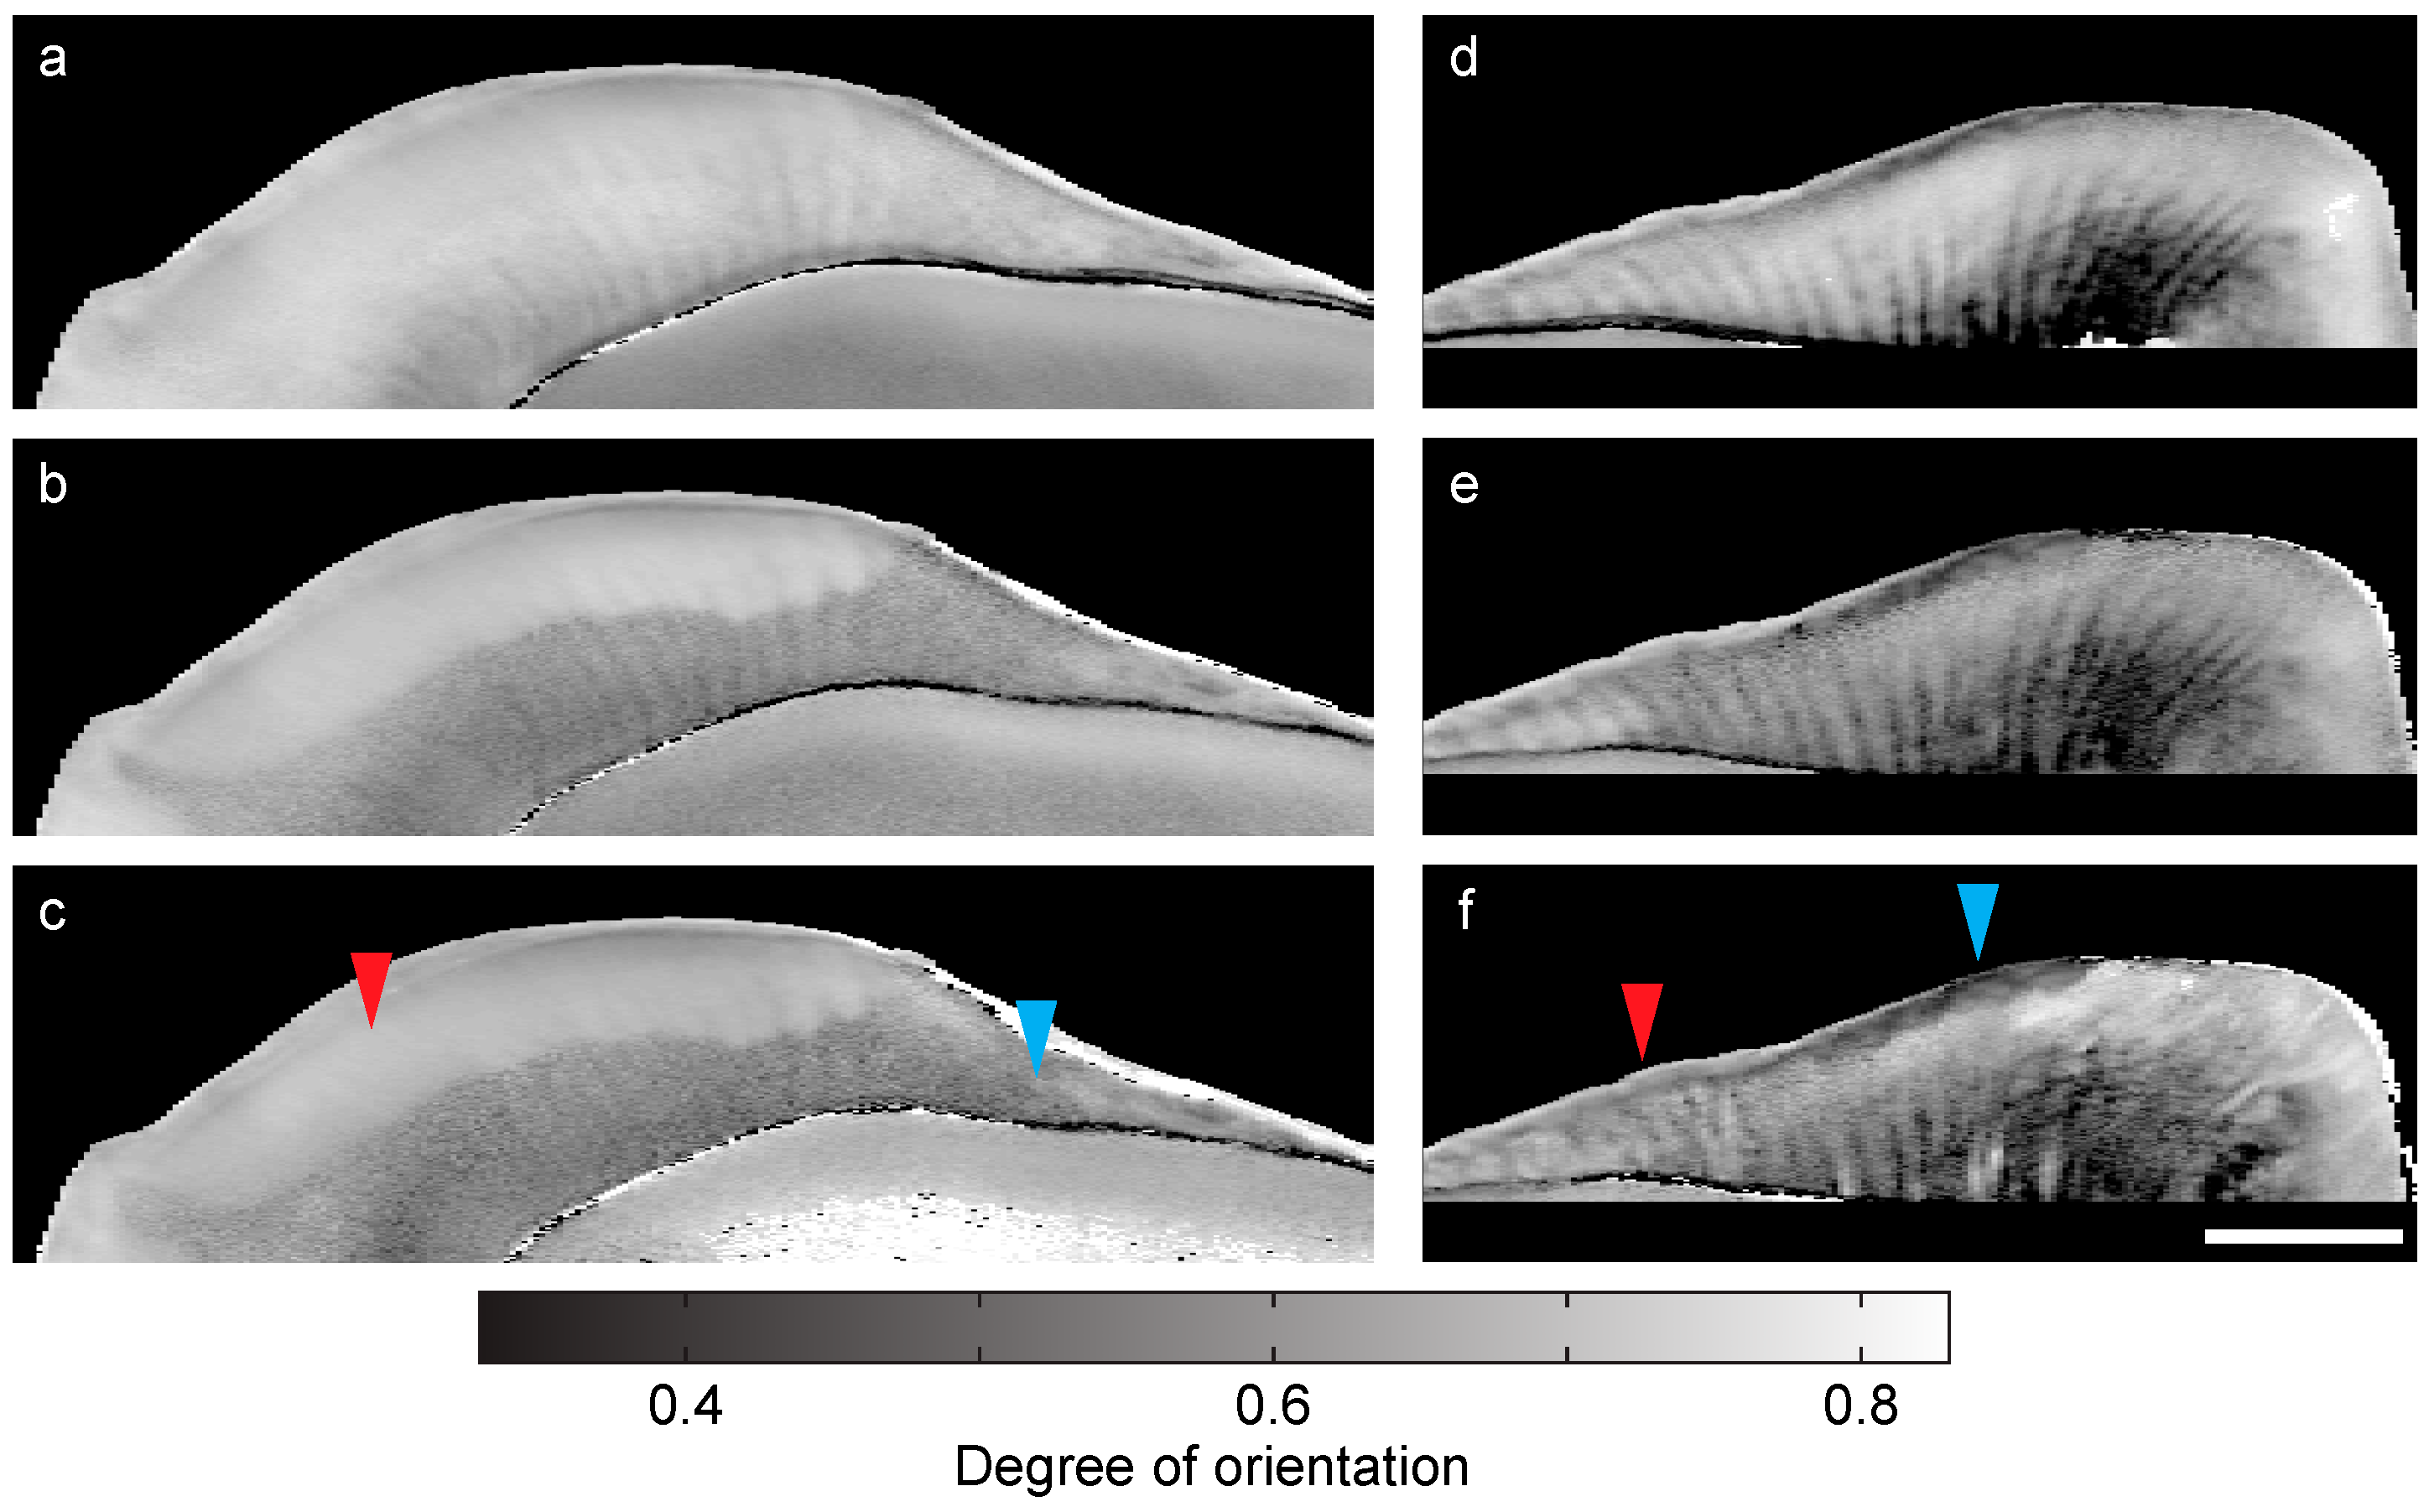
2.4. Small-Angle X-ray Scattering Data Acquisition

Spatially resolved small-angle X-ray scattering measurements (SAXS) were performed at the cSAXS beamline of the Swiss Light Source (Paul Scherrer Institute, Villigen, Switzerland) [33]. The specimens were stored in polyimide sachets to keep the specimens hydrated, and raster-scanned in 30 μm × 10 μm steps in x- and y-directions (cf. Figure 1) through a monochromatic X-ray beam, with a photon energy of 18.6 keV, focused to 30 μm × 10 μm full-width-at-half-maximum spot size at the specimen location. The specimen to detector distance Dsd of 7.1 m (cf. Figure 1c) was determined with the first-order scattering ring of silver-behenate powder. With this setup, q-ranges corresponding to real-space periodicities (d-spacing) from 4 to 180 nm were investigated. To reduce the air scattering, an evacuated flight tube was placed between specimen and detector. A diode on the beam stop in front of the detector recorded the transmitted intensity of the X-ray beam during data acquisition. SAXS data treatment was performed with the cSAXS Matlab package available at https://www.psi.ch/sls/csaxs/software [33]. Additionally, the degree of orientation of the point-symmetric scattering patterns was defined as 1 − (FWHMdeg/180°), where FWHMdeg denotes the full-width-at-half maximum (FWHM) of the azimuthal SAXS intensity [17].

2.5. Segmentation

The carious regions were segmented from the volumetric µCT data of the tooth slices via thresholding. To increase the contrast-to-noise ratio, a 5 × 5 × 5 median filter was applied to the data prior to thresholding.
In addition, bivariate histogram plots of the total scattered intensity from the SAXS measurements and the X-ray attenuation within the tooth slices were generated. For this purpose, the local X-ray attenuation values of the reconstructed µCT data of the slices were integrated along the direction perpendicular to the slice (z-direction, cf. Figure 1). The bivariate histogram plots were segmented using the k-means clustering algorithm [34] implemented in the MATLAB statistics and machine learning toolbox. For this purpose, scattering intensities and X-ray attenuation data were rescaled to an arbitrary scale so that they presented the same minimum and maximum values, i.e., 1 and 200. This bin size was chosen to allow for a reasonable representation of the data, allowing the distinction of clusters without compromising segmentability through excessive noise. The k-means algorithm assigned each count in the bivariate histogram plot to one of three clusters. For each cluster, we defined an ellipse aligned along the eigenvectors of the covariance matrix and the length of the ellipse axes by three times the square root of the eigenvalues. The three ellipses were associated with the unaffected enamel, the dentin, and the lesion.

3. Results

Selected slices through the three-dimensional data from µCT, obtained from crowns with a natural and an artificial lesion, are illustrated in Figure 2a,b, respectively. The slices show the microstructure of lesions owing to the reduced mineral content. The mineralized, micrometer-thick outer shell encloses the body of the lesion. The natural lesion is about 250 µm deep, whereas the artificial lesion only extends about 50 µm.
Attenuation histograms of the entire µCT-datasets from the crown specimens with the natural and the artificial caries lesions are shown in the diagrams of Figure 2c,d, respectively. Enamel and dentin can be clearly discriminated; both exhibit the characteristic Gaussian distribution [35]. The enamel lesions exhibit attenuation values between those of dentin and enamel.
Subsequent to the characterization using µCT, the tooth slices were investigated by means of synchrotron radiation-based spatially resolved small-angle X-ray scattering in transmission mode to evaluate the anisotropy and the orientation of the nanostructures, foremost hydroxyapatite crystallites, within carious and unaffected enamel. Figure 3 shows the integrated scattered intensity at selected q-ranges corresponding to the real-space periodicities between 10 and 20 nm (a) and (d), 70 and 80 nm (b) and (e), and 140 and 150 nm (c) and (f). The images contain distinctive anatomical features, which allow correlating both datasets, as they are similar to those of the μCT-data. Both the natural and the artificially induced lesions exhibit an increased scattering intensity. These bright regions of higher scattering intensity correspond to the less mineralized and therefore darker regions in the µCT data (cf. Figure 2).
The main orientation of the scattering signal at each pixel position is displayed in Figure 4, according to the color-wheel. Since the scattering signal is related to the Fourier transform of the electron density of the specimen, the scattering signal orientation is perpendicular to the long extension of the nanoscale scatterers in the plane perpendicular to the X-ray beam, cf. x-y-plane in Figure 1c. The nanostructures in the enamel have an orientation that is radial to the dentin-enamel junction. The lesions that were prominently seen in the scattering intensity plots, cf. Figure 3, cannot be discerned from sound enamel in the orientation plots, see Figure 4. This indicates that the main orientation of the scatterers is preserved in both lesions.
The degree of anisotropy describes the co-alignment of the nanoscale structures, on average, over the area illuminated by the X rays, i.e., over several square-micrometers. A band of low anisotropy at the location of the dentin–enamel junction (DEJ) clearly delineates dentin and enamel. At larger scattering angles, corresponding to 10–20 nm real-space periodicities, the natural lesion and the sound enamel show similar values of degree of orientation, as represented in Figure 5a. For smaller scattering angles, i.e., larger periodicities, the differences between unaffected and carious enamel become distinct, see Figure 5b,c for 70–80 nm and 140–150 nm. The degree of anisotropy of carious enamel is around 0.7 for the q-ranges investigated, whereas the one of sound enamel decreases from 0.7 to 0.6 with decreasing q. In addition, one finds bands of alternating degree of orientation extend from the DEJ to the tooth surface, associated with the Hunter–Schreger bands. The artificial lesion is hardly identifiable at some investigated q-ranges, presenting regions of higher and lower anisotropy compared to the unaffected enamel, Figure 5d–f.
The local attenuation values integrated along the beam for the natural (a) and artificial (d) lesions and the related spatially resolved X-ray scattering intensities are shown in Figure 6b,e, respectively. The natural lesion appears as a dark region in the image of Figure 6a and bright in the image of Figure 6b. The artificially induced demineralization results in strongly enhanced SAXS intensity, see image in Figure 6e, (red-colored arrow). However, the artificial lesion was barely visible in the X-ray attenuation signal, represented in the image of Figure 6d. Only some spotted regions with reduced attenuation are present near the enamel surface of the artificial lesion. The images in Figure 6c,f show the thickness of the specimens’ unaffected hard tissues in yellow color and the thickness of the lesions in blue color as obtained from the volumetric µCT data. The image in Figure 6f reveals several regions of reduced thickness within the enamel, which present reduced attenuation (blue-colored arrow). The thickness of the hard tissue histological section or slices from the crown directly affects the scattered X-ray intensity and the X-ray attenuation. In contrast to the scattering signal, without the additional 3D information from µCT, it is impossible to determine whether the reduced attenuation within the enamel is caused by demineralization or by variations in the slice thickness.
The bivariate histogram plots for the two slices of the crowns are represented in Figure 7. First, the X-ray attenuation obtained from the µCT measurements was integrated along the beam direction (z-direction, cf. Figure 1), yielding a two-dimensional image akin to radiography. Then, it was plotted for each pixel position against the related scattered intensities, where the q-range corresponds to real-space periodicities between 5 and 150 nm. The frequency of counts is displayed by the brightness (see gray-scale bars). Since both attenuation and SAXS intensity are dependent on specimen thickness, scaling of the abscissa and ordinate are adapted accordingly. For the natural lesion, cf. Figure 7a, one can easily discriminate between the three clusters. For the artificially induced lesion such discrimination is more complex, cf. Figure 7b. Nevertheless, the bivariate histogram plots offer a better approach for segmenting the lesions than the individual histograms given by integration along abscissae or ordinates; see the related diagrams at the borders of Figure 7.
Next, each bivariate histogram plot was divided into three regions using the k-means algorithm implemented in MATLAB code. For each of the three regions the center of gravity C and moments of inertia were calculated. They define ellipses centered in C with the main axes in the direction of the moments of inertia and a magnitude three times the square root of the eigenvalues of the covariance matrix. All points within each ellipse were assigned to one region within the selected piece of the crown. The results are displayed in Figure 8. The red color marks the enamel affected by caries. The blue color relates to the unaffected enamel. For the crown slice containing the natural lesion, the yellow color corresponds to the dentin and to the intact surface layer. For the specimen containing the artificial lesion, cyan is associated with the enamel regions of reduced thickness. In the slice containing the artificial lesion, dentin is not correctly identified. Rather, thin enamel is identified as separate component. Nevertheless, a distinction is made between caries-affected and unaffected enamel.

4. Discussion

Natural and appropriately prepared artificial carious lesions exhibit a decreased density below intact surfaces, which gives rise to a decrease in X-ray attenuation because of the reduced mineral density. It is frequently observed that the X-ray scattering potential of enamel lesions is significantly higher than that of sound enamel, associated with the increased nanometer-scale porosity within the lesions [17,20,21,36]. It has been a matter of debate whether the SAXS signal originates from the crystallites or the voids in between them. Several studies report that at larger q, the scattering signal is often associated with the voids, since the crystallites are large compared to the corresponding ranges [15,20,21,37]. Yagi et al. also stated that increased SAXS signal depends more on the surface area than on void volume [21]. The setup in this study allowed us to access smaller q-values, down to 0.04 nm−1, corresponding to about 150 nm, well above the putative pore size of 5 nm [15]. We believe that the observed increase in anisotropy towards larger periodicities (cf. Figure 5) is associated with preferential etching of more arbitrarily oriented calcium phosphates within enamel between the rods. There is, however, consensus that the voids between rods are aligned to the rods themselves [20]. Our results support this notion, as we do not observe any change in the orientation of the anisotropic, nanometer-size components between the healthy and the diseased part of the crown, implying that the pores have the same orientation as the mineral crystallites. However, the pores do not have the same size and shape as the crystallites, because the experimental values for the degree of orientation differ between carious and healthy enamel.
Projections, as generated radiographically, do not allow for the discrimination between thickness-dependent and density-dependent phenomena. In Figure 6b, for example, the prominent dark region on the top left of the specimen, caused by reduced specimen thickness, cannot be distinguished from caries-affected regions if the geometry of the slice is unknown. Also, overlapping carious and unaffected enamel might lead to a misinterpretation or underestimation of the local degree of demineralization. Using the µCT data, the thickness is derived with micrometer precision, and the projected densities of overlapping features can be separated.
The segmentation of anatomical features with comparable X-ray attenuation and X-ray scattering potential is challenging. Especially the boundaries between features with gradual density changes, such as those between carious lesions and sound enamel, are difficult to identify. The exact registration of data from different modalities [38,39] or the data from the same modality obtained before and after tissue alteration permits the creation of a bivariate histogram plot for powerful feature segmentation [40]. Here, we have demonstrated that through the combination of X-ray attenuation and SAXS signal over a large q-range one can determine the size and shape of the natural and caries lesions in a (semi-)automated way, not biased by subjective interpretation of experts. This approach could be applied to other biological tissues, such as bone.
In the natural lesion, the presented approach reproduces the intact surface lesion, which is seen in the CT and radiography data, but is not reproduced in the SAXS intensity signal. Conversely, the region presenting reduced X-ray attenuation in the specimen with the artificial lesion was clearly identified as unaffected enamel by the segmentation process. Note that this approach assumed three regions for each specimen, namely sound dentin, sound enamel, and enamel lesion. While it succeeded in discriminating these regions in the specimen containing the natural lesion (cf. Figure 8a), it failed to do so for the specimen with the artificial lesion (Figure 8b). Here, strong variations in specimen thickness led to the dentin being associated with the affected enamel. Nevertheless, carious and sound enamel could be distinguished.
The natural and the artificial lesions of the present study show comparable characteristics, i.e., intact surface layers, reduced X-ray attenuation and increased X-ray scattering intensity within the lesions, but they also exhibit differences in size and shape. Such differences are even found for in vitro tests with artificial lesions and are manifested by inter-lab variability [41,42], implying that the challenging biomimetic in vitro generation of carious lesions. Thus, in situ reproduction of lesions was proposed [43]. Furthermore, the classically described lesion is by no means representative of all observed natural lesions [44]. This means that both in vitro and clinical studies should include a rather large and varied number of subjects before generalizable evidence is reached.

5. Conclusions

The present communication is not only a simple comparison of one artificially induced and one natural carious lesion but also describes a methodological approach combining radiographic data, spatially resolved X-ray scattering data and data treatment for the quantification and segmentation of lesions. The increased porosity within the lesion leads to a reduced X-ray attenuation and increased scattering intensity over the investigated q-ranges. The combination of the two results gives rise to a better differentiation within the projection data. This approach could be applied to other tissues.
Although a position-resolved SAXS setup, as presented in this study, is not well suited for a clinical environment, the future potential of the SAXS signal for caries diagnosis must not be underestimated. Other setup types, which are sensitive to small-angle scattering, as for example the dark-field signal obtained in X-ray Talbot–Lau interferometry measurements [45], might be more easily adapted for the in vivo diagnosis of mineral loss. The dark-field signal originates from scattering from entities smaller than the detector’s pixel size [46]. SAXS signal integrated over a large q-range is similar and related to the dark-field signal obtained from X-ray Talbot–Lau interferometry [47], and thus, similar results can be expected.

Author Contributions

H.D., S.N.W. and B.M. conceived and designed the experiments; H.D., L.B., M.L., M.G.-S. and O.B. performed the experiments; H.D. and M.G.-S. analyzed the data; H.D., S.N.W. and B.M. wrote the paper. All authors critically reviewed the manuscript.

Funding

The Swiss Nanoscience Institute and the Swiss National Science Foundation (SNSF) have partially financed the research activities within the nanocure project (Project No. 144617). The financial contribution of the Swiss National Science Foundation in the frame of the R’equip initiative (No. 133802) to acquire the micro computed tomography system is also acknowledged.

Acknowledgments

The technical support of F. Schmidli (University of Basel) for the tooth preparation is gratefully acknowledged. Extracted teeth were kindly provided by M. Jakobs (Volkszahnklinik, Basel, Switzerland). Scanning SAXS experiments were performed at the cSAXS beamline at the Swiss Light Source (proposal numbers 20131216 and 20131056), Paul Scherrer Institut, Villigen, Switzerland.

Conflicts of Interest

The authors declare no conflict of interest. The founding sponsors had no role in the design of the study; in the collection, analyses, or interpretation of data; in the writing of the manuscript, and in the decision to publish the results.

References

  1. Marcenes, W.; Kassebaum, N.J.; Bernabé, E.; Flaxman, A.; Naghavi, M.; Lopez, A.; Murray, C.J.L. Global burden of oral conditions in 1990–2010: A systematic analysis. J. Dent. Res. 2013, 92, 592–597. [Google Scholar] [CrossRef] [PubMed]
  2. Magitot, E. Treatise on Dental Caries. Experimental and Therapeutic Investigations; Houghton, Osgood and Company: Boston, MA, USA, 1878. [Google Scholar]
  3. Miller, W.D. Agency of micro-organisms in decay of human teeth. Dent. Cosmos 1883, 25, 1–12. [Google Scholar]
  4. Braga, M.M.; Mendes, F.M.; Martignon, S.; Ricketts, D.N.J.; Ekstrand, K.R. In vitro Comparison of Nyvad’s System and ICDAS-II with Lesion Activity Assessment for Evaluation of Severity and Activity of Occlusal Caries Lesions in Primary Teeth. Caries Res. 2009, 43, 405–412. [Google Scholar] [CrossRef] [PubMed]
  5. Neuhaus, K.W.; Rodrigues, J.A.; Hug, I.; Stich, H.; Lussi, A. Performance of laser fluorescence devices, visual and radiographic examination for the detection of occlusal caries in primary molars. Clin. Oral Investig. 2011, 15, 635–641. [Google Scholar] [CrossRef] [PubMed]
  6. Selwitz, R.H.; Ismail, A.I.; Pitts, N.B. Dental caries. Lancet 2007, 369, 51–59. [Google Scholar] [CrossRef]
  7. Bozdemir, E.; Aktan, A.M.; Ozsevik, A.; Kararslan, E.S.; Ciftci, M.E.; Cebe, M.A. Comparison of different caries detectors for approximal caries detection. J. Dent. Sci. 2016, 11, 293–298. [Google Scholar] [CrossRef]
  8. Boca, C.; Truyen, B.; Henin, L.; Schulte, A.G.; Stachniss, V.; De Clerck, N.; Cornelis, J.; Bottenberg, P. Comparison of micro-CT imaging and histology for approximal caries detection. Sci. Rep. 2017, 7, 9. [Google Scholar] [CrossRef] [PubMed]
  9. Abogazalah, N.; Ando, M. Alternative methods to visual and radiographic examinations for approximal caries detection. J. Oral Sci. 2017, 59, 315–322. [Google Scholar] [CrossRef] [PubMed] [Green Version]
  10. Cheng, R.X.; Shao, J.J.; Gao, X.X.; Tao, C.; Ge, J.Y.; Liu, X.J. Noninvasive Assessment of Early Dental Lesion Using a Dual-Contrast Photoacoustic Tomography. Sci. Rep. 2016, 6, 9. [Google Scholar] [CrossRef] [PubMed]
  11. Fratzl, P.; Jakob, J.F.; Rinnerthaler, S.; Roschger, P.; Klaushofer, K. Position-resolved small-angle X-ray scattering of complex biological materials. J. Appl. Crystallogr. 1997, 30, 765–769. [Google Scholar] [CrossRef]
  12. Gupta, H.S.; Roschger, P.; Zizak, I.; Fratzl-Zelman, N.; Nader, A.; Klaushofer, K.; Fratzl, P. Mineralized microstructure of calcified avian tendons: A scanning small angle X-ray scattering study. Calcif. Tissue Int. 2003, 72, 567–576. [Google Scholar] [PubMed]
  13. Paris, O. From diffraction to imaging: New avenues in studying hierarchical biological tissues with X-ray microbeams (Review). Biointerphases 2008, 3, FB16–FB26. [Google Scholar] [CrossRef] [PubMed]
  14. Zizak, I.; Roschger, P.; Paris, O.; Misof, B.M.; Berzlanovich, A.; Brenstorff, S.; Amenitsch, H.; Klaushofer, K.; Fratzl, P. Characteristics of mineral particles in the human bone/cartilage interface. J. Struct. Biol. 2003, 141, 208–217. [Google Scholar] [CrossRef]
  15. Gutierrez, P.; Piña, C.; Lara, V.H.; Bosch, P. Characterization of enamel with variable caries risk. Arch. Oral. Biol. 2005, 50, 843–848. [Google Scholar] [CrossRef] [PubMed]
  16. Al-Jawad, M.; Streuwer, A.; Kilconey, S.H.; Shore, R.C.; Cywinski, R.; Wood, D.J. 2D mapping of texture and lattice parameters of dental enamel. Biomaterials 2007, 28, 2908–2914. [Google Scholar] [CrossRef] [PubMed]
  17. Deyhle, H.; White, S.N.; Bunk, O.; Beckmann, F.; Müller, B. Nanostructure of the carious tooth enamel lesion. Acta Biomater. 2014, 10, 355–364. [Google Scholar] [CrossRef] [PubMed]
  18. Siddiqui, S.; Anderson, P.; Al-Jawad, M. Recovery of Crystallographic Texture in Remineralized Dental Enamel. PLoS ONE 2014, 9, e108879. [Google Scholar] [CrossRef] [PubMed]
  19. Simmons, L.M.; Al Jawad, M.; Kilcoyne, S.H.; Wood, D.J. Distribution of enamel crystallite orientation through an entire tooth crown studied using synchrotron X-ray diffraction. Eur. J. Oral Sci. 2011, 119, 19–24. [Google Scholar] [CrossRef] [PubMed]
  20. Tanaka, T.; Yagi, N.; Ohta, T.; Matsuo, Y.; Terada, H.; Kamasaka, K.; To-o, K.; Kometani, T.; Kuriki, T. Evaluation of the distribution and orientation of remineralized enamel crystallites in subsurface lesions by X-ray diffraction. Car. Res. 2010, 44, 253–259. [Google Scholar] [CrossRef] [PubMed]
  21. Yagi, N.; Ohta, T.; Matsuo, T.; Tanaka, T.; Terada, Y.; Kamasaka, H.; To-o, K.; Kometani, T.; Kuriki, T. Evaluation of enamel crystallites in subsurface lesion by microbeam X-ray diffraction. J. Synchrotron Radiat. 2009, 16, 398–404. [Google Scholar] [CrossRef] [PubMed]
  22. Shahmoradi, M.; Swain, M.V. Quantitative characterization and micro-CT mineral mapping of natural fissural enamel lesions. J. Dent. 2016, 46, 23–29. [Google Scholar] [CrossRef] [PubMed]
  23. Rovaris, K.; Matos Ferreira, L.; Oliveira Sousa, T.; Vieira Peroni, L.; Queiroz Freitas, D.; Wenzel, A.; Haiter-Neto, F. Feasibility of micro-computed tomography to detect and classify proximal caries lesions in vitro. Dent. Res. J. 2018, 15, 123–129. [Google Scholar]
  24. Yagi, N.; Ohta, T.; Matsuo, T.; Tanaka, T.; Terada, Y.; Kamasaka, H.; Kometani, T. A microbeam small-angle X-ray scattering study on enamel crystallites in subsurface lesion. J. Phys. Conf. Ser. 2010, 247, 012024. [Google Scholar] [CrossRef]
  25. Chien, Y.C.; Burwell, A.K.; Saeki, K.; Fernandez-Martinez, A.; Pugach, M.K.; Nonomura, G.; Habelitz, S.; Ho, S.P.; Rapozo-Hilo, M.; Featherstone, J.D.; et al. Distinct decalcification process of dentin by different cariogenic organic acids: Kinetics, ultrastructure and mechanical properties. Arch. Oral Biol. 2016, 63, 93–105. [Google Scholar] [CrossRef] [PubMed] [Green Version]
  26. Giannini, C.; Siliqi, D.; Ladisa, M.; Altamura, D.; Diaz, A.; Beraudi, A.; Sibillano, T.; De Caro, L.; Stea, S.; Baruffaldi, F.; et al. Scanning SAXS-WAXS microscopy on osteoarthritis-affected bone—An age-related study. J. Appl. Crystallogr. 2014, 47, 110–117. [Google Scholar] [CrossRef]
  27. Lewis, R.A.; Rogers, K.D.; Hall, C.J.; Towns-Andrews, E.; Slawson, S.; Evans, A.; Pinder, S.E.; Ellis, I.O.; Boggis, C.R.M.; Hufton, A.P.; et al. Breast cancer diagnosis using scattered X-rays. J. Synchrotron Radiat. 2000, 7, 348–352. [Google Scholar] [CrossRef] [PubMed] [Green Version]
  28. Falzon, G.; Pearson, S.; Murison, R.; Hall, C.; Siu, K.; Round, A.; Schultke, E.; Kaye, A.H.; Lewis, R. Myelin structure is a key difference in the X-ray scattering signature between meningioma, schwannoma and glioblastoma multiforme. Phys. Med. Biol. 2007, 52, 6543–6553. [Google Scholar] [CrossRef] [PubMed]
  29. Botta, L.-M.; White, S.N.; Deyhle, H.; Dziadowiec, I.; Schulz, G.; Thalmann, P.; Müller, B. Comparing natural and artificial carious lesions in human crowns by means of conventional hard X-ray micro-tomography and two-dimensional X-ray scattering with synchrotron radiation. Proc. SPIE 2016, 9967, 99670S. [Google Scholar]
  30. Kind, L.; Stevanovic, S.; Wuttig, S.; Wimberger, S.; Hofer, J.; Müller, B.; Pieles, U. Biomimetic remineralization of carious lesions by self-assembling peptide. J. Dent. Res. 2017, 96, 790–797. [Google Scholar] [CrossRef] [PubMed]
  31. Deyhle, H.; Schulz, G.; Khimchenko, A.; Bikis, C.N.; Hieber, S.E.; Jaquiery, C.; Kunz, C.; Müller-Gerbl, M.; Hoechel, S.; Saxer, T.; et al. Imaging tissues for biomedical research using the high-resolution micro-tomography system nanotom® m. Proc. SPIE 2016, 9967, 99670Q. [Google Scholar]
  32. Dziadowiec, I.; Beckmann, F.; Schulz, G.; Deyhle, H.; Müller, B. Characterization of a human tooth with carious lesions using conventional and synchrotron radiation-based micro computed tomography. Proc. SPIE 2014, 9212, 92120W. [Google Scholar]
  33. Bunk, O.; Bech, M.; Jensen, T.H.; Feidenhans’l, R.; Binderup, T.; Menzel, A.; Pfeiffer, F. Multimodal X-ray scatter imaging. New J. Phys. 2009, 11, 123016. [Google Scholar] [CrossRef]
  34. Lloyd, S.P. Least square quantization in PCM. IEEE Trans. Inf. Theory 1982, 28, 129–137. [Google Scholar] [CrossRef]
  35. Müller, B.; Beckmann, F.; Huser, M.; Maspero, F.; Szekely, G.; Ruffieux, K.; Thurner, P.; Wintermantel, E. Non-destructive three-dimensional evaluation of a polymer sponge by micro-tomography using synchrotron radiation. Biomol. Eng. 2002, 19, 73–78. [Google Scholar] [CrossRef]
  36. Deyhle, H.; Bunk, O.; Müller, B. Nanostructure of healthy and caries-affected human teeth. Nanomed. Nanotechnol. Biol. Med. 2011, 7, 694–701. [Google Scholar] [CrossRef] [PubMed] [Green Version]
  37. Sui, T.; Sandholzer, M.A.; Baimpas, N.; Dolbnya, I.P.; Landini, G.; Korsunsky, A.M. Hierarchical modelling of elastic behaviour of human enamel based on synchrotron diffraction characterisation. J. Struct. Biol. 2013, 184, 136–146. [Google Scholar] [CrossRef] [PubMed]
  38. Schulz, G.; Waschkies, C.; Pfeiffer, F.; Zanette, I.; Weitkamp, T.; David, C.; Müller, B. Multimodal imaging of human cerebellum—Merging X-ray phase microtomography, magnetic resonance microscopy and histology. Sci. Rep. 2012, 2, 826. [Google Scholar] [CrossRef] [PubMed]
  39. Stalder, A.; Ilgenstein, B.; Chicerova, N.; Deyhle, H.; Beckmann, F.; Müller, B.; Hieber, S.E. Combined use of micro computed tomography and histology to evaluate the regenerative capacity of bone grafting materials. Int. J. Mater. Res. 2014, 105, 679–691. [Google Scholar] [CrossRef] [Green Version]
  40. Deyhle, H.; Dziadowiec, I.; Kind, L.; Thalmann, P.; Schulz, G.; Müller, B. Mineralization of early stage carious lesions in vitro—A quantitative approach. Dent. J. 2015, 3, 111–122. [Google Scholar] [CrossRef] [PubMed]
  41. Ten Cate, J.M.; Dundon, K.A.; Vernon, P.G.; Damato, F.A.; Huntington, E.; Exterkate, R.A.M.; Wefel, J.S.; Jordan, T.; Stephen, K.W.; Roberts, A.J. Preparation and measurement of artificial enamel lesions, a four-laboratory ring test. Car. Res. 1996, 30, 400–407. [Google Scholar] [CrossRef] [PubMed]
  42. Jensen, T. Refraction and Scattering Based X-ray Imaging; University of Copenhagen: Copenhagen, Denmark, 2010. [Google Scholar]
  43. Lautensack, J.; Rack, A.; Redenbach, C.; Zabler, S.; Fischer, H.; Graber, H.G. In situ demineralisation of human enamel studied by synchrotron-based X-ray microtomography—A descriptive pilot-study. Micron 2013, 44, 404–409. [Google Scholar] [CrossRef] [PubMed]
  44. Arends, J.; Christoffersen, J. The nature of early caries lesions in enamel. J. Dent. Res. 1986, 65, 2–11. [Google Scholar] [CrossRef] [PubMed]
  45. Pfeiffer, F.; Bech, M.; Bunk, O.; Kraft, P.; Eikenberry, E.F.; Brönnimann, C.; Grünzweig, C.; David, C. Hard-X-ray dark-field imaging using a grating interferometer. Nat. Mater. 2008, 7, 134–137. [Google Scholar] [CrossRef] [PubMed]
  46. Revol, V.; Jerjen, I.; Kottler, C.; Schutz, P.; Kaufmann, R.; Luthi, T.; Sennhauser, U.; Straumann, U.; Urban, C. Sub-pixel porosity revealed by X-ray scatter dark field imaging. J. Appl. Phys. 2011, 110, 5. [Google Scholar] [CrossRef]
  47. Jensen, T.; Bech, M.; Zanette, I.; Weitkamp, T.; David, C.; Deyhle, H.; Feidenhans’l, R.; Pfeiffer, F. Directional X-ray dark-field imaging of strongly ordered systems. Phys. Rev. B 2010, 82, 214103. [Google Scholar] [CrossRef]
Figure 1. Sample preparation steps to obtain tooth slices with artificial (a) and natural (b) lesions and schematic representation of the spatially resolved SAXS set-up (c). The tooth slice is raster-scanned through the focused X-ray beam. At each position a two-dimensional scattering pattern is acquired. The direct beam transmitted by the sample is measured in intensity and absorbed by the beam stop in front of the detector.
Jimaging 04 00081 g001
Figure 2. Selected slices through the µCT datasets of tooth slices with natural (a) and artificial (b) lesions. Affected regions exhibit X-ray attenuation reduced with respect to the healthy enamel. The related histograms of the three-dimensional data are shown in the diagrams (c,d). The length of the bar corresponds to 1 mm.
Jimaging 04 00081 g002
Figure 3. Integrated scattered intensity for the q-ranges that corresponds to the real-space periodicities between 10 and 20 nm (a,d), 70 and 80 nm (b,e), and 140 and 150 nm (c,f) for the natural (left column) and the artificial (right column) lesions. For all ranges, the lesion appears as bright band in the upper part of the image, corresponding to high scattering intensity. The enamel yields lower scattering intensities compared to dentin and lesion. The intensities are logarithmically scaled with Imin and Imax corresponding to (a) 2.0–53.3, (b) 0.2–10.0, (c) 33.4–26,500.0, (d) 8.4–2,650.0, (e) 66.7–133,000.0, and (f) 21.1–13,000.0 counts per pixel, respectively. The length bar corresponds to 1 mm.
Jimaging 04 00081 g003
Figure 4. The color-coded images show the main azimuthal orientation of the scattering patterns for the q-ranges corresponding to the real-space periodicities between 10 and 20 nm (a,d), 70 and 80 nm (b,e), and 140 and 150 nm (c,f) for the natural (left column) and the artificial (right column) lesions. The direction of the scattered intensity is according to the color wheel in the inset. The carious lesions cannot readily be distinguished from the sound enamel, suggesting that the predominant orientation of the features on the investigated nanometer range is unaffected by the carious lesions generated. The scale bar corresponds to 1 mm.
Jimaging 04 00081 g004
Figure 5. The gray-scale images display the degree of orientation of the scattering patterns for the q-ranges corresponding to the real-space periodicities between 10 and 20 nm (a,d), 70 and 80 nm (b,e), and 140 and 150 nm (c,f) for the natural (left column) and the artificial (right column) lesions. For the natural lesion the degree of orientation at lower scattering angles, images (b,c), is increased (red-colored arrow) compared to the sound enamel (blue-colored arrow), whereas for the artificial lesion regions with higher (red-colored arrow) and lower (blue-colored arrow) anisotropy compared to the sound enamel appear for all length scales investigated. The scale bar corresponds to 1 mm.
Jimaging 04 00081 g005
Figure 6. Images (a,d) show the lateral µCT attenuation values integrated across the slice thickness. The mean scattered intensities for the natural (b) and the artificial lesions (e) for the q-range correspond to the real-space periodicities between 5 and 150 nm. The thicknesses of the lesion in blue color and of sound enamel in yellow color are given in (c,f). Brighter color indicates larger thickness, being black for zero and bright yellow/blue for 1330 µm (c) and 413 µm (f), respectively. Mixed colors indicate regions where unaffected enamel and caries are present along the X-ray beam (z-direction, cf. Figure 1). The scale bar corresponds to 1 mm.
Jimaging 04 00081 g006
Figure 7. The bivariate histogram plots of the scattering signal (ordinate) and the integrated X-ray attenuation (abscissa) are displayed for the natural (a) and the artificial (b) lesions.
Jimaging 04 00081 g007
Figure 8. The bivariate histogram plots allow segmenting some anatomical features and identifying regions that belong to the carious and the unaffected enamel. (a) The red color indicates the lesions, blue color is associated with the unaffected enamel, and the yellow color corresponds to dentin. In the slice containing the artificial lesion (b), dentin is not correctly identified. Rather, it is associated with the lesions, whereas the thinned enamel is assigned to an independent component.
Jimaging 04 00081 g008

