Article

Preliminary Evaluation of Moniliformin as a Potential Threat for Teleosts

1
BIOMIN Holding GmbH, Erber Campus 1, 3131 Getzersdorf, Austria
2
CCMAR, Centre of Marine Sciences, University of Algarve, 8005-139 Faro, Portugal
3
BIOMIN Research Center, Technopark 1, 3430 Tulln, Austria
4
Department of Biomedical Sciences and Medicine, University of Algarve, 8005-139 Faro, Portugal
*
Author to whom correspondence should be addressed.
Both authors contributed equally to this study.
Submission received: 10 November 2017 / Revised: 10 January 2018 / Accepted: 12 January 2018 / Published: 16 January 2018

Abstract

:
Aquaculture feed manufacturers and producers increasingly recognize the importance of mycotoxins, which contaminate plant-based meals used in compound aquafeeds, and their potential to negatively impact production. Though data on the worldwide occurrence of legislated mycotoxins e.g., trichothecenes and zearalenone (ZEN) are well documented, relatively little information is available regarding other mycotoxins also produced by Fusarium, notably moniliformin (MON). Given that MON is known to affect the survival, growth, skeletal formation and bone mineralization in terrestrial species, its widespread occurrence on maize and maize by-products typically used in aquaculture makes it relevant to study these parameters in teleost fish. In the present work we have tested the effect of MON exposure on survival, bone development and mineralization using zebrafish (Danio rerio) as a model species and fish derived osteo-chondroprogenitor cell line for in vitro studies. Moniliformin exposure did not decrease bone mineralization in zebrafish larvae or extracellular matrix mineralization in the mineralogenic cell line VSa13. Here, the minimal in vitro cytotoxicity concentration was found to be 1000 µg L−1 MON. Incidence of deformities was also not altered by MON at the concentration tested (450 µg L−1) although larval growth was affected, as shown by a decrease in the standard length of exposed specimens at 20 days post fertilization. Survival decreased significantly in larvae exposed to MON concentrations higher than 900 μg L−1. Influence of MON on survival and growth might be relevant for aquaculture industry. As MON is a water-soluble mycotoxin, its leaching from feed is highly probable, so MON assimilation into the surrounding aqueous environment should also be considered. Tested levels in fish larvae are within the reported occurrence levels of MON in commercial feed and plant meals.

1. Introduction

Climate change is expected to affect feed and food production systems, both in terms of productivity and safety. The presence of mycotoxins produced by Fusarium spp. is expected to increase due to climate change [1,2,3]. However, quantitative estimates are scarce. The genus Fusarium includes several species, which are important pathogens of maize and small grains, producing among other mycotoxins, trichothecenes and zearalenone (ZEN). While for trichothecenes and zearalenone, data on worldwide toxicity, occurrence, and contamination levels are available [4,5], for other metabolites also produced by Fusarium spp., such as moniliformin (MON), fusaproliferin (FUS), beauvericin (BEA) or enniatins (ENNs), limited information is available. Besides the typical legislated Fusarium mycotoxins (deoxynivalenol (DON), fumonisins (FUM) and ZEN, the occurrence of which is reportedly on the rise [6], a new diverse group of mycotoxins with previously low or unknown occurrence is also on the rise. These “emerging toxins” e.g., MON, FUS, BEA and ENNs, might be a response or an effort by plants to adapt to fungi in a changing climate context [6,7]. Information on emerging toxins, including co-occurrence with regulated toxins, remains scarce.
Concern about mycotoxins in aquaculture has been growing, partly due to the gradual replacement of animal-derived proteins, such as fishmeal, with plant sources [8,9]. The tendency to use plant-based ingredients in aquafeed is set to increase due to sustainability issues and the increasing price of fishmeal. Plant ingredients used in aquaculture are of varying origin and quality and recent reports put in evidence the risk of mycotoxin contamination in aquafeed [9,10].
MON is an emerging toxin with a significant occurrence in commodities normally used in aquaculture, making the understanding of its impact in farmed aquatic species particularly relevant. Recently, Kovalsky et al. [6] reported the presence of MON in 79% of the 1113 samples of global origin from three commodities (finished feed, maize and maize silage) sampled between 2012 and 2015. The authors observed a maximum contamination of 1367 µg kg−1 and median contamination of 16 µg kg−1 of MON on these samples. However, Jestoi [11] previously reported the occurrence of MON especially on maize and wheat at levels up to 425 mg kg−1. In data collected during 2006/07, Goertz et al. [12] reported the occurrence of MON on 43 and 45 maize samples. The authors found the 2006 samples contaminated with 280 µg kg−1 in average and maximums of 3330 µg kg−1. In 2007, samples were contaminated with 110 µg kg−1 in average and maximum of 1850 µg kg−1. In farmed animals, MON is generally responsible for reduced weight gain, reduced feed consumption, increased mortality (chicks and turkeys [13]), intestinal hemorrhage (rats [14]) pathological lesions in the heart and liver with degeneration and necrosis of myocardium, vacuolization and swelling of hepatocytes (chicks, ducklings and turkeys [15]). In fish, Yildirim et al. [16] observed lower weight gains in channel catfish (Ictalurus punctatus) fed diets with 20 mg kg−1 or higher of MON. Authors reported that hematocrits were lower in catfish fed MON at 60 mg kg−1, and smaller nuclei and vacuolization of hepatocytes were observed in fish fed MON at 120 mg kg−1. More recently Tuan et al. [17] observed that Nile tilapia (Oreochromis niloticus) fed MON at 70 mg kg−1 showed reduced growth and feed intake and an increased feed conversion ratio (FCR). The same author also observed that serum pyruvate concentrations in Nile tilapia were significantly higher in all diets containing MON, even at lower concentrations of 10 mg kg−1.
Despite the significance of the data reported previously [16,17] demonstrating the negative effects of MON, test concentrations are considerably higher and unlikely to be observed in commercial aquaculture feeds. In addition, the life stages used were juveniles and young adults that have all organs formed and fully functional. Besides the previously reported effects of MON in production animals, this toxin has also been shown to cause necrosis, apoptosis [18], and DNA damage [19] in human derived chondrocyte, and reported also as a possible causative factor of Kashin–Beck disease (KBD) an osteochodropathy prevalent in areas where MON is highly present in the human diet [19]. Regarding bone related pathologies, it was observed that MON decreased syntheses of extracellular matrix (ECM) components such as aggrecan and type II collagen, thereby accelerating the catabolism of ECM and causing disability [18]. This imbalance of ECM remodeling may change the mechanical properties of articular cartilages and induce the loss of their functions, eventually leading to cartilage degradation. The possible induction of skeletal abnormalities caused by MON are an interesting study subject, since skeletal malformations are still a major concern, accounting for economic losses in the European aquaculture sector estimated at more than €50 million per year [20]. Reasons for skeletal malformations are variable, e.g., pollutants, pathogens, unfavorable abiotic conditions, inappropriate nutrition and genetic factors. Occasionally, high incidences of bone malformation are reported for certain fish batches and frequently no causes are identified [21]. Recently, developments between BIOMIN (Getzersdorf, Austria) and some clients lead to discussions hypothesizing the influence of MON on fish bone malformation. Currently, no results of waterborne exposure to larval fish are available and this information will help understand the effect of the presence of MON in an aquaculture system and how it affects the produced fish.
The present study aims to evaluate the toxicity of MON over the mineralization/development of bone structures and its influence on survival, growth and gene expression using zebrafish (Danio rerio) as model species for in vivo experiments and gilthead seabream (Sparus aurata) mineralogenic cell line VSa13 as in vitro model.

2. Material and Methods

2.1. Ethics Statement on Animal Experiments

All the experimental procedures involving animals followed the EU Directive 2010/63/EU and National Decreto-Lei 113/2013 legislation for animal experimentation and welfare. Animal handling and experiments were performed by qualified operators accredited by the Portuguese Direção-Geral de Alimentação e Veterinária (DGAV).

2.2. Experimental Model

Sexually mature zebrafish (AB wild-type strain) were crossed using an in-house breeding program. Fertilized eggs were transferred into a 1-L container (TECNIPLAST, Buguggiate, Italy) with static water conditions and the following parameters: temperature 28 ± 0.1 °C, pH 7.6 ± 0.1, conductivity 700 ± 50 μS, NH3 and NO2 lower than 0.1 mg L−1, NO3 at 5 mg L−1 and a photoperiod of 14–10 h light-dark. Fish water was prepared by adding a salt mixture (Instant Ocean, Blacksburg, VA, USA) and sodium bicarbonate to reverse osmosis treated water in order to maintain stable pH and conductivity. Methylene blue (0.0002% w/v) was added to prevent fungal growth. At five days post-fertilization (dpf), water was fully renewed and larvae fed with Artemia (5 nauplii per mL; strain AF from INVE Aquaculture, Dendermonde, Belgium) three times every day.

2.3. Experimental Design

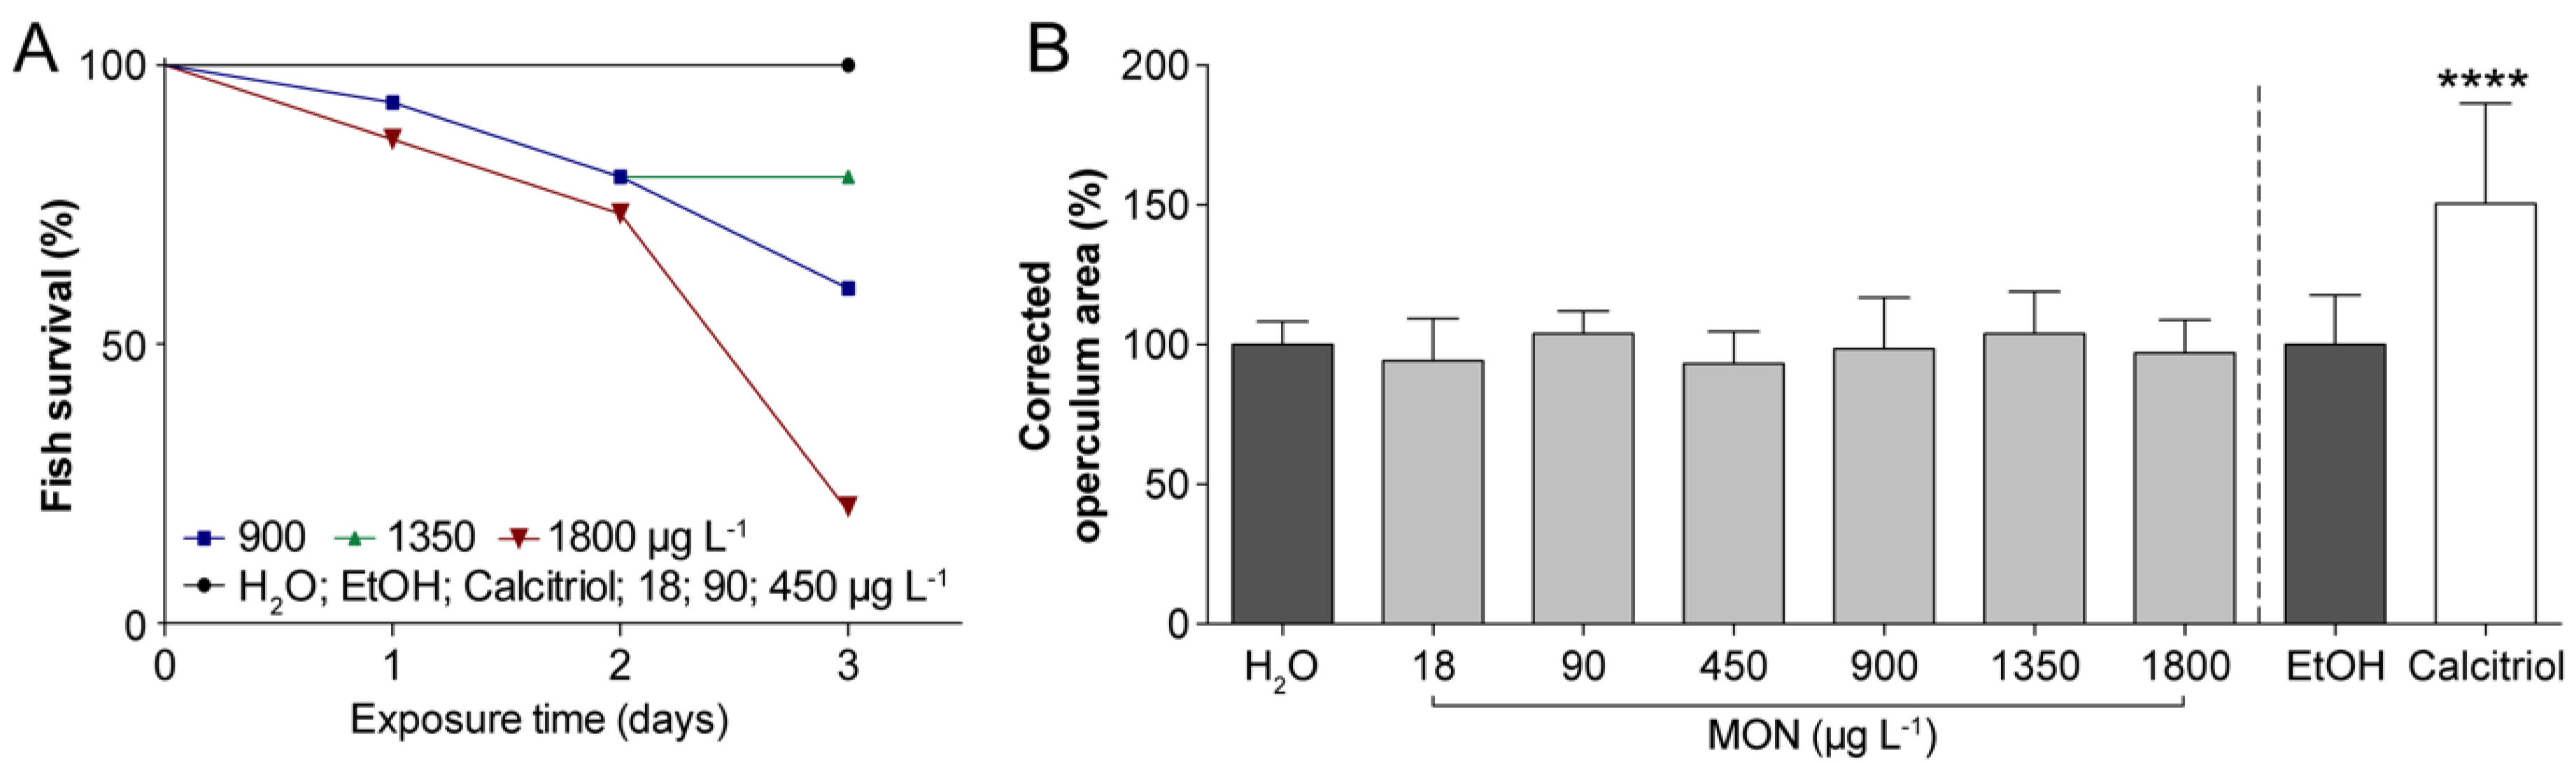
2.3.1. Assessment of the Effects on Operculum Mineralization in Zebrafish Larvae

At 3 dpf larvae were separated into 6 well-plates in triplicates for each experimental condition (15 larvae in 10 mL of water per well). Larvae were exposed for 3 days with 70% daily water renewal to different concentrations of MON (Sigma-Aldrich, St. Louis, MO, USA) (i.e., 18, 90, 450, 900, 1350 and 1800 µg L−1), a negative control (H2O) and a positive control already described as a known pro-osteogenic molecule [21] (calcitriol at 10 pg mL−1; Sigma-Aldrich) and its respective vehicle control (EtOH at 0.1%). Survival of exposed larvae was monitored every day. At 6 dpf larvae were sacrificed with a lethal dose of MS-222 (tricaine methanesulfonate) (0.6 mM, pH 7.0, Sigma-Aldrich), stained with alizarin red S (AR-S) and imaged to assess the effects of MON exposure over the operculum mineralization, through morphometric analysis as recently described. This exposure starting at three dpf and finishing at six dpf was previously determined as the optimal condition for assessing mineralogenic effects on the operculum [22].

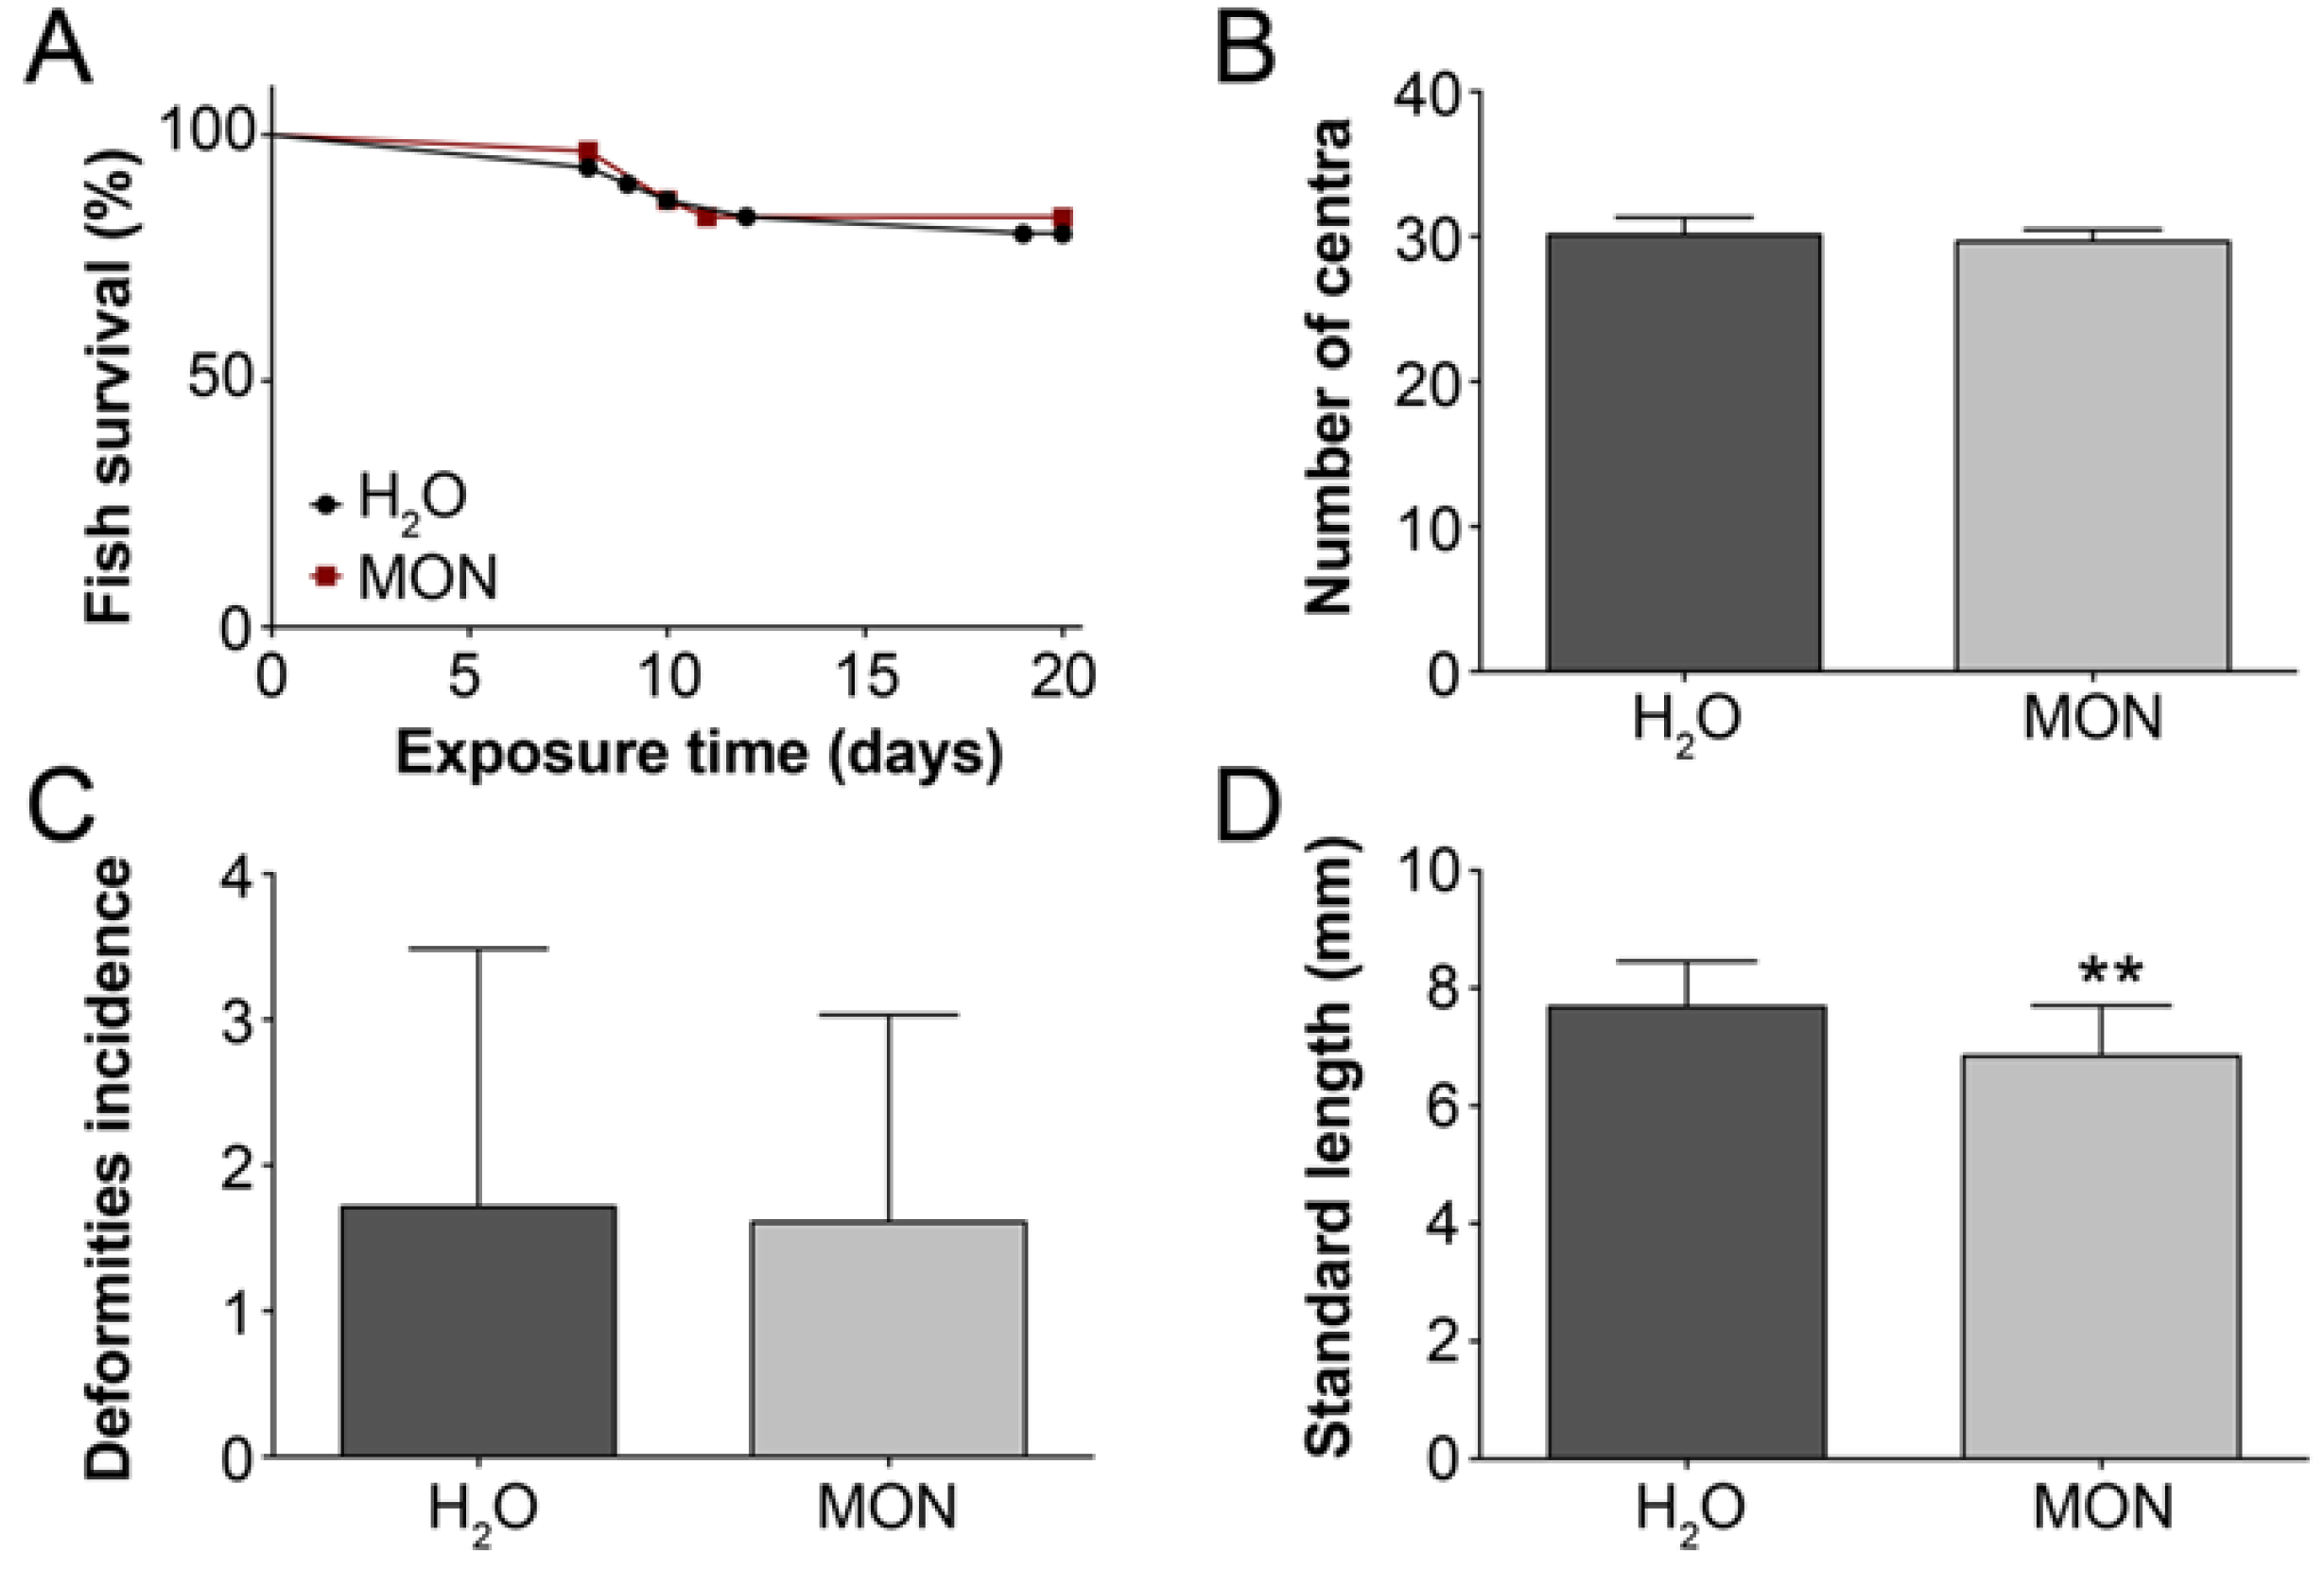
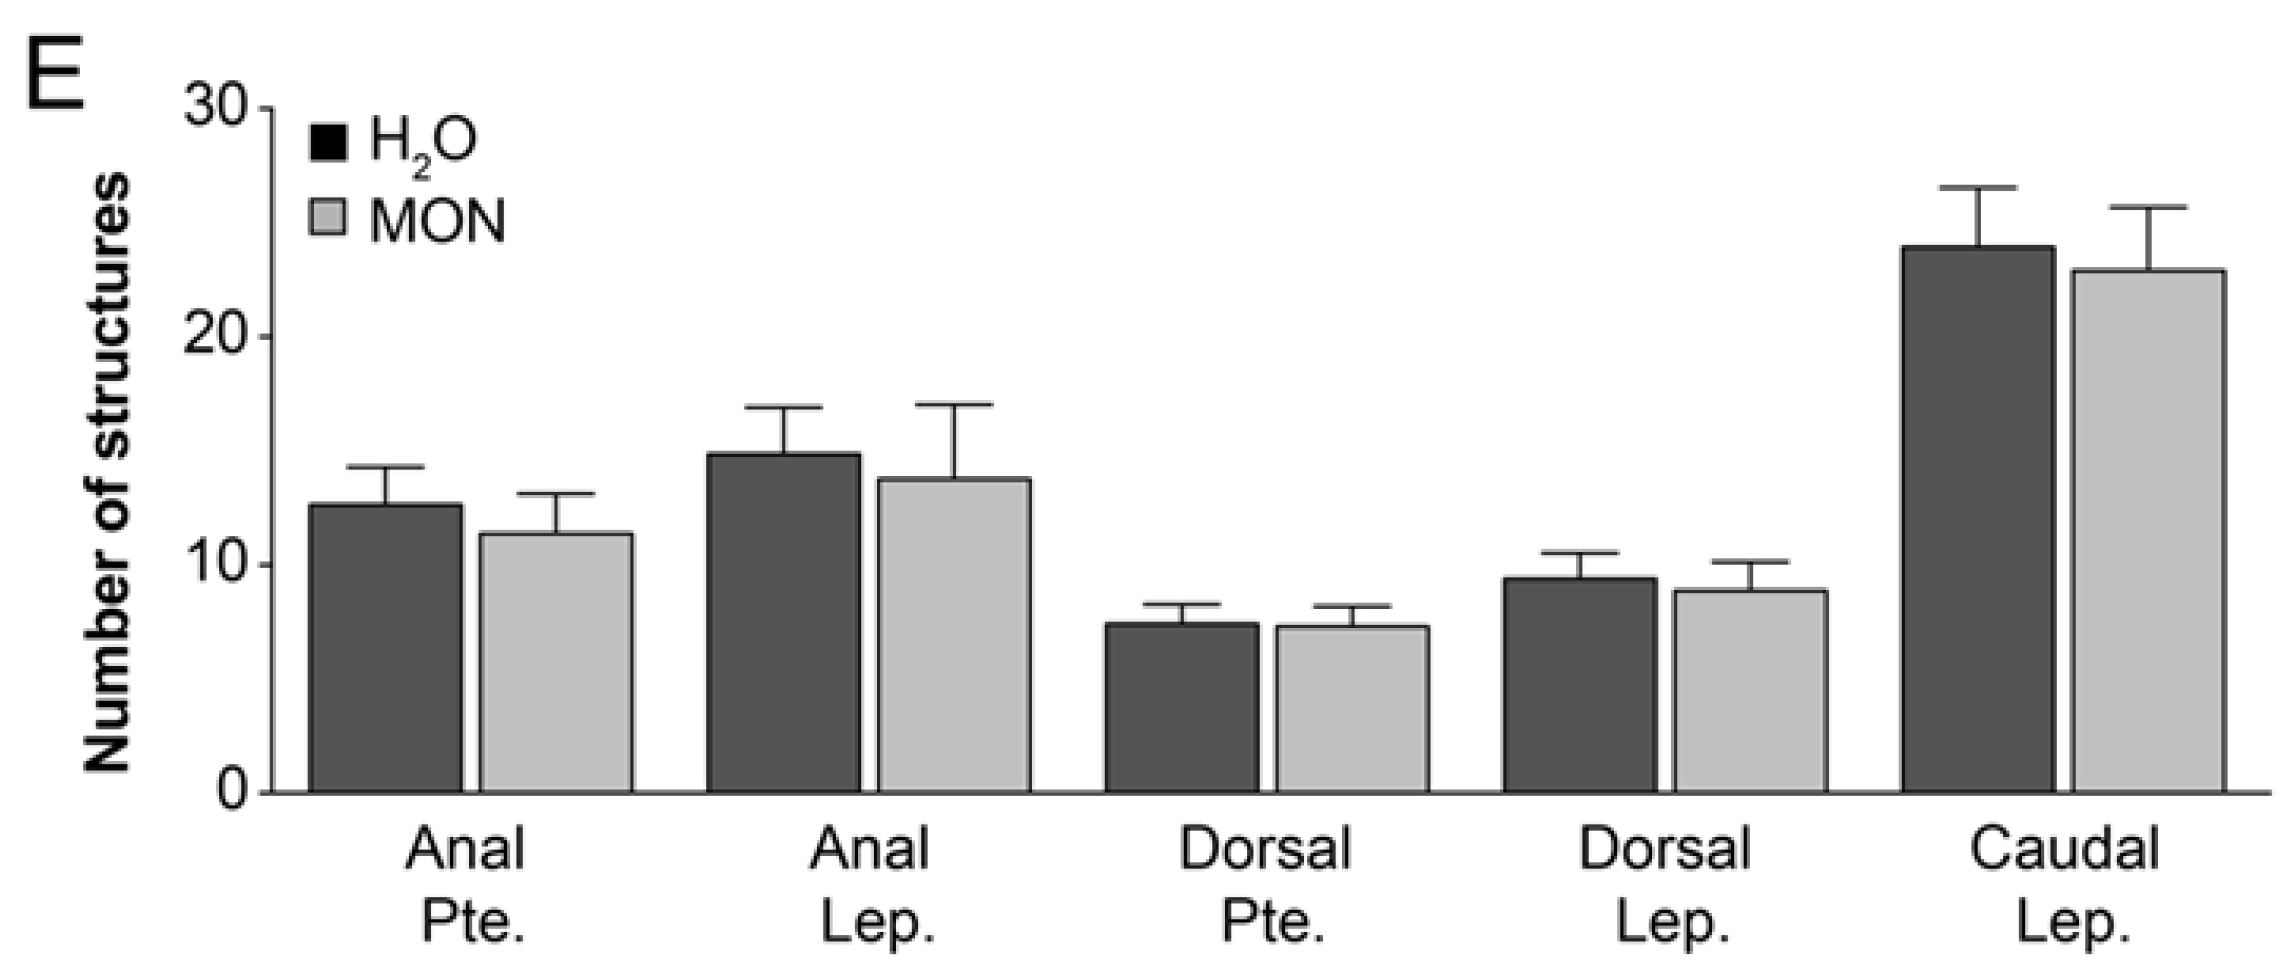
2.3.2. Assessment of the Effects on the Incidence of Deformities in Zebrafish Larvae

At 3 dpf larvae were separated into 6 well-plates in triplicates per experimental condition (30 larvae in 10 mL of water per well). Larvae were exposed for 3 days with daily water renewal to 450 µg L−1 of MON and a negative control (H2O). At 6 dpf, larvae were relocated into small plastic tanks (250 mL) and further exposed for 17 days to the same concentration of MON with water exchanges (80%) every 2 days. Survival was monitored throughout all the treatment and at 20 dpf larvae were collected for analysis of skeletal deformities and biological parameters. The quantification of the effects over growth was made by determining standard length of all larvae that survived during the treatment. For assessment of skeletal deformities, larvae were submitted to whole mount double staining of cartilage and bone according to the procedure by Gavaia et al. [23] and analyzed by stereomicroscopy observation and imaging. The incidence, typology and charge of skeletal deformities were determined in the axial and cranial skeletons of stained and cleared specimens [24].

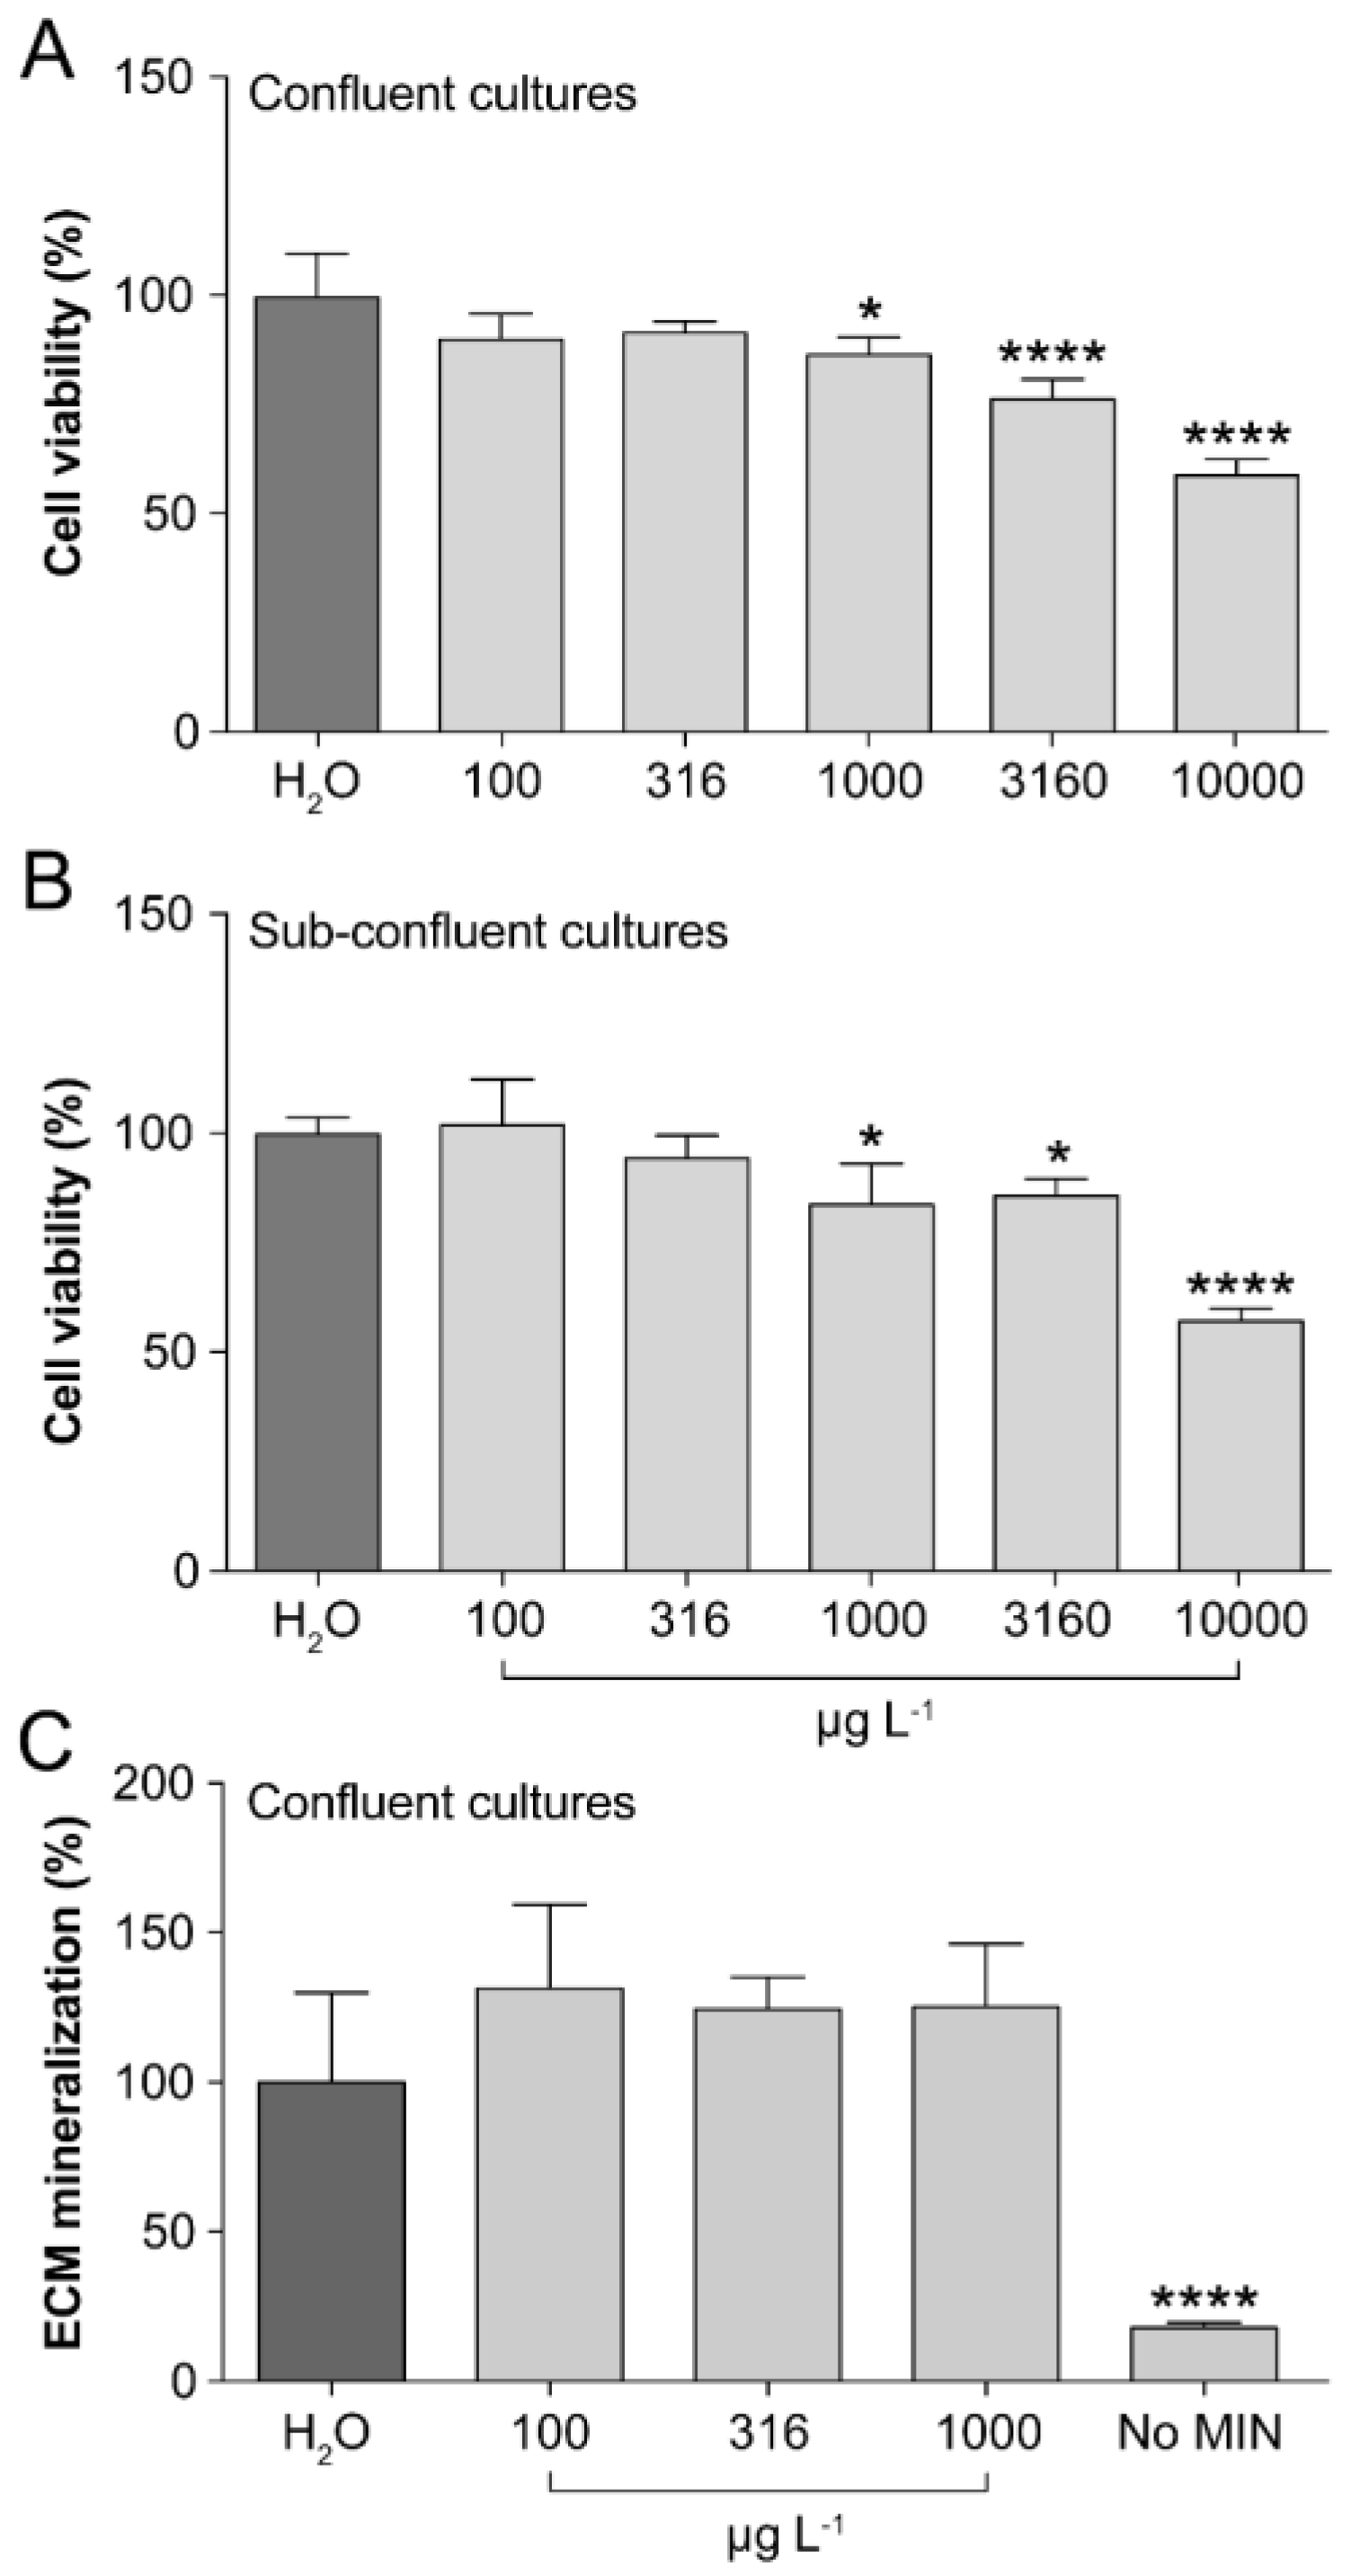
2.3.3. Assessment of the Cytotoxic, Proliferative and Mineralogenic Effects In Vitro

VSa13 cell line—a mineralogenic cell type derived from gilthead seabream S. aurata vertebra previously characterized by Pombinho et al. [25]—was maintained according to standardized conditions. Briefly, cells were maintained at 33 °C in a 10% CO2 humidified atmosphere and cultured in Dulbecco’s modified Eagle medium (DMEM; Invitrogen, Waltham, MA, USA) supplemented with 10% FBS (fetal bovine serum; Sigma-Aldrich), 1% penicillin-streptomycin, 1% L-glutamine and 0.2% fungizone (all from Invitrogen).
VSa13 cells were seeded in a 96-well plate (Thermo Scientific Nunc, Waltham, MA, USA) at a density of 3 × 10³ cells per well (cytotoxicity) or 1 × 10³ cells per well (proliferation) and further incubated under regular growth conditions until confluence to determine cytotoxicity. In order to determine proliferation, cells were allowed to adhere to the plate for 24 h previous to starting the exposure. Culture medium was supplemented with different concentrations of MON (i.e., 100, 316, 1000, 3160 and 10,000 μg L−1) added directly to the medium then filtered (0.2 μm) and applied to the cells. Control cells were exposed to vehicle (H2O). Treatments were applied for 9 days and renewed every 3.5 days. The cytotoxic and proliferative effects of MON were evaluated at 9 days (endpoint to assess cytotoxicity and proliferation) using XTT Cell Proliferation kit (AppliChem, Darmstadt, Germany). In particular, 50 μL of the XTT reaction mixture and 100 μL of fresh medium were added to each well and absorbance was determined at 460 nm and at 620 nm after 2 h of incubation using a Synergy 4 multiplate reader (BioTek, Swindon, UK).
Extracellular matrix mineralization was determined through AR-S staining after 21 days of exposure to the highest non-toxic concentrations (i.e., 100, 316 and 1000 μg L−1). VSa13 cell were seeded in 12-well plates at a density of 2.5 × 10⁴ cells per well and incubated in standard culture conditions [25] until confluence. Culture medium was exchanged every 3.5 days. After confluence, the ECM mineralization was induced by supplementing culture medium with a mineralogenic cocktail (MIN) [25]: 50 g mL−1 of ascorbic acid, 10 mM-glycerophosphate and 4 mM CaCl2. MON was applied at the time of renewal of the mineralogenic medium, i.e., every 3.5 days. At the end of the treatment, the medium was discarded and cells were washed 3 times with phosphate buffer saline 0.1 M (PBS; NaCl 137 mM, KCl 2.7 mM, Na2HPO4 8.1 mM, KH2PO4 1.47 mM). Cells were then fixed at 4 °C for 1 h in 4% formaldehyde (prepared in PBS, pH 7.4). Fixative was discarded and cells were washed 3 times with Milli-Q water (Millipore, Oeiras, Portugal). Cells were then stained with 40 mM AR-S in Milli-Q water (pH 4.2) for 15 min at room temperature and unbound dye was removed through multiple washes with Milli-Q water (until effluent was clear), then destained with 10% cetylpyridinium chloride (CPC; pH 7.0). Crystal-bound stain was quantified through the measurement of the absorbance (540 nm) in CPC suspensions using a multiplate reader (synergy BIOTEK). All chemicals were purchased from Sigma-Aldrich, unless otherwise stated.

2.3.4. RNA Extraction and Quantitative Real-Time PCR

In order to evaluate the effect of MON on the expression levels of selected genes markers for osteoblast and chondroblast differentiation, maturation and ECM formation and mineralization (runx2b, sp7, bglap, bglapl, col1a1a, col2a1a, col10a1a and bmp2b) and cartilage degradation (mmp13), zebrafish larvae at the age of 3 dpf were separated into 6 well-plates (15 larvae in 10 mL of water per well) and exposed for six days to 900 µg L−1 of MON and a negative control (H2O). The treatment and water were renewed daily. Total RNA was extracted from triplicate samples of nine dpf larvae stored in TRI-Reagent, following manufacturer instructions. RNA integrity and quantity was confirmed using Experion Automated Electrophoresis system (Bio-Rad, Portland, ME, USA). Total RNA (1 µg) was reverse-transcribed for 1 h at 37 °C using M-MLV reverse transcriptase (Invitrogen), oligo-d(T) primer and RNase OUT (Invitrogen). All quantitative real-time PCR (qPCR) reactions were performed using SensiFAST (Bioline, London, UK), 10 µM of isoform-specific primers (Table 1) and 1:10 dilution of reverse-transcribed RNA, in a CFX Connect Real-Time PCR detection system (Bio-Rad). PCR amplification was as follows: an initial denaturation step of 2 min at 95 °C and 40 cycles of amplification (10 s at 95 °C and 20 s at 65 °C). Efficiency of amplification was above 95% for all primer sets. Primer specificity was previously performed by sequence analysis and qPCR specificity assessed by melting curve analysis performed at the end of the PCR cycle. Levels of gene expression were calculated using the ∆∆Ct comparative method [26] and normalized using the average of three housekeeping genes (i.e., eef1a1l1, actb1 and rps18) whose expression stability was determined prior to qPCR quantification.

2.4. Data Analysis

Statistical differences were determined through one-way Analysis of variance (ANOVA) followed by Dunnett’s multiple comparison test (p < 0.05) or through unpaired t-tests with Welch’s correction (p < 0.05). Statistical analyses were performed using Prism version 6.00 (GraphPad Software, Inc. La Jolla, CA, USA).

3. Results

3.1. Assessment of the Effects on Operculum Mineralization in Zebrafish Larvae

Among all the concentrations tested, MON at 900 and 1350 μg L−1 decreased larvae survival by 40% and 20%, respectively, while the highest concentration (1800 μg L−1) presented the strongest effect, with a survival reduction of 80% over the control treatment (Figure 1A). The controls and the concentrations of MON below 450 μg L−1, inclusive, showed no effects on survival, with no mortality registered in the period studied.
Morphometric analysis of the operculum showed that none of the tested concentrations presented an effect on bone mineralization, while the positive control significantly increased mineral deposition (50.4 ± 7.7%) and operculum area (Figure 1B), as expected.

3.2. Assessment of the Effects on the Incidence of Deformities in Zebrafish Larvae

The highest non-lethal concentration tested in the early exposure trial was used for this study. A chronic exposure (17 days) to the highest non-lethal concentration previously tested (see Figure 1A), 450 µg L−1 of MON, showed not to be statistically different from control conditions, suggesting that the toxin did not affect larvae survival at the concentration tested (24, 22, 26 and 25, 25, 24 live larvae at 20 dpf for H2O and MON, respectively) (Figure 2A). Furthermore, the number of vertebral bodies (centra) formed and the incidence of deformities at 20 dpf did not present any statistical differences with the control group (Figure 2B,C). However, a significant reduction in the standard length was observed at the end of this trial, indicating that a chronic exposure to 450 µg L−1 of MON in the rearing water affects growth (Figure 2D).
Analysis of the meristic characters of the larvae (i.e., number of pterygiophores and lepidotrichia) showed no statistical differences between treatment and control conditions (Figure 2E).

3.3. Assessment of the Cytotoxic, Proliferative and Mineralogenic Effects In Vitro

Among the concentration range tested in VSa13 culture, only MON at 1000, 3160 and 10,000 µg L−1 decreased the number of confluent cells by 13.3% ± 4.0, 23.3% ± 4.0 and 41.0% ± 4.0, respectively, while the same concentrations decreased the number of sub-confluent cells by 42.8% ± 4.7, 14.1% ± 4.7 and 16.1% ± 4.7, respectively (Figure 3A,B). The highest non-toxic concentrations, i.e., 100, 316 and 1000 μg L−1 were evaluated for assessing their effects on ECM mineralization after 21 days of exposure (endpoint to assess ECM mineralization by alizarin red S staining). None of the concentrations tested affected the ECM mineralization (Figure 3C).

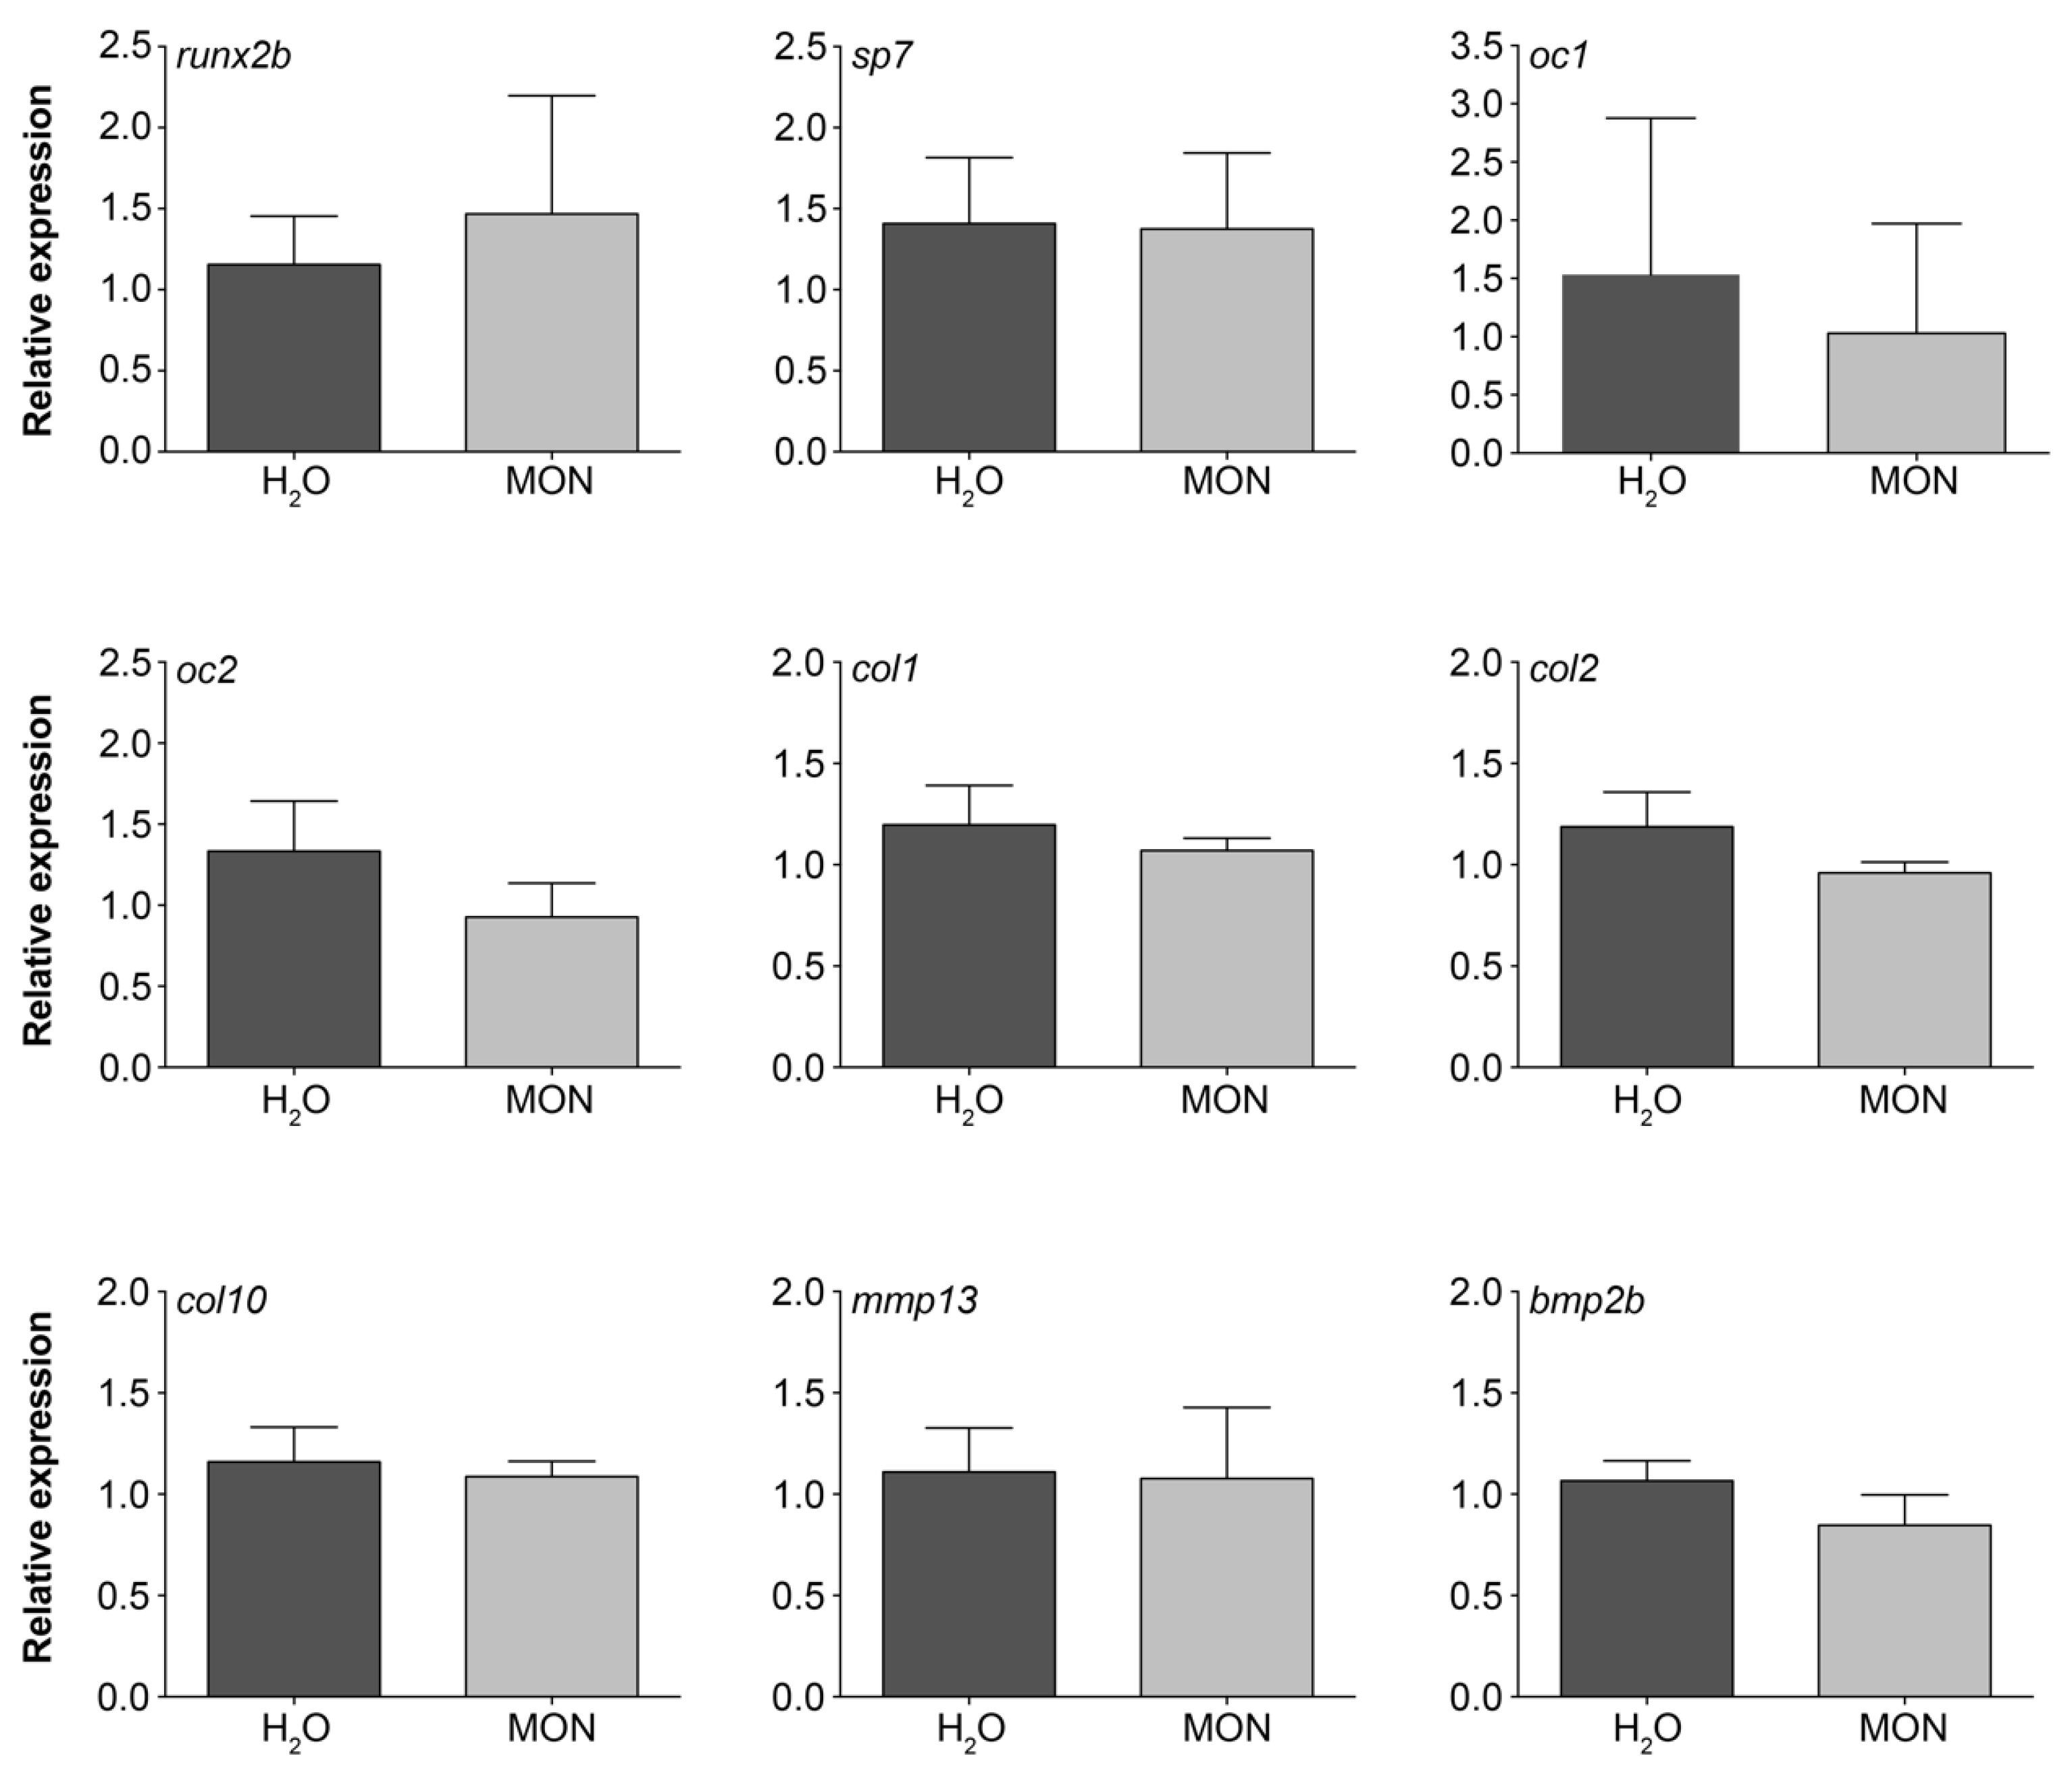
3.4. Assessment of the Effects on Gene Expression Levels in Zebrafish Larvae

The levels of expression of genes markers of osteoblast differentiation (runx2b, sp7 and bmp2) and mineralization (bglap and bglapl), ECM formation (col1a1a, col2a1a, col10a1a) and degradation (mmp13) were determined in order to evaluate the effects of MON exposure on the skeleton of zebrafish larvae. At the concentration tested (i.e., 900 µg L−1) none of these genes presented differences between treated and control larvae (Figure 4).

4. Discussion

Moniliformin at the highest concentrations tested in larvae (900, 1350 and 1800 μg L−1) decreased larvae survival by 40%, 20% and 80% respectively, over the control treatment. There were no differences among the two negative control conditions (H2O and EtOH). Influence of MON on survival might be relevant for the aquaculture industry, especially taking into account that MON is water soluble and that tested levels are within the reported occurrence levels of MON in commercial feed and plant meals [6,11]. The conditions chosen for testing MON in zebrafish ensure the maintenance of the tested concentration since MON is highly stable in water as described by Pineda-Valdes and Bullerman [27]. Despite zebrafish phylogenetic position, further research should be done on the effect of MON in important aquaculture species, especially for those using plant meals with high incidence of MON.
The data collected suggest that MON at the tested concentration range (18 to 1800 μg L−1 for larvae and 100 to 1000 μg L−1 in cell culture experiments) did not induce any effect on bone mineralization during early skeletogenesis of zebrafish larvae, a result confirmed both by in vivo and in vitro assays. Nevertheless, an exposure to the highest concentrations might affect other biological processes which are evidenced by the decreased larvae survival and growth. The number of specimens presenting skeletal deformities was also not altered by exposure to MON at 450 µg L−1. These results are interesting, especially taking into account the low level of contamination as well the short period of exposure. Taking into account that the lifecycle of most aquaculture species is considerably longer than that of the model used, it would be interesting to conduct further research based on these results in relevant commercial aquaculture species. Beside the lack of significant deformities, larval growth was significantly affected, as shown by the decrease in standard length of exposed specimens after 20 dpf. The present results go in the direction of previous reported effects of MON for aquatic species [16,17], however decreasing significantly the sensitivity levels, in this case for zebrafish, despite fact that the life stages used were different, with exposure starting in newly hatched larvae used in our study, while the studies in catfish [16] and tilapia [17] were performed with juveniles. The exact causes of the decrease in length of animals exposed to MON was not identified. However, if these effects could be transposed to farmed species as indicated by previous studies [16,17], they could have economic consequences for the aquaculture industry. It would be relevant to study the effects of long-term exposure of farmed species to MON and understand the impact of realistic MON contamination levels in combination with other Fusarium mycotoxins (e.g., DON and FUM).
Regarding cell viability, we observed that MON at 1000, 3160 and 10,000 µg L−1 decreased the number of confluent and sub-confluent cells. Similar in vitro effects have also been reported by Zhang et al. [18] where an exposure of human fetal chondrocytes for 5 days to MON (1000, 2000, 4000, 8000, 16,000 and 32,000 µg L−1) was enough to significantly decrease cell viability. The same authors have shown through immunohistochemistry that MON (4000 µg L−1) triggered the expression of MMP-13, and promoted the catabolism of aggrecan and Coll II in human chondrocytes exposed for 16 days. Differences with the results of this study may be due to the different model used (zebrafish larvae), the short treatment (6 days) and the lower concentration levels (900 µg L−1). The exposure to the highest concentrations of MON increased fish mortality, therefore, it was not possible to evaluate the effects. Future studies might evaluate gene expression on fish cell line to get insights into the effects of MON.
It is likely that some of the reported effects of MON in zebrafish similarly afflict other teleost fish species. However, several factors might influence the effect of mycotoxins in aquatic animals, the toxin being a factor itself [9]. Such factors include but are not limited to: method of MON administration, environment factors/interactions (i.e., presence of other challenges in rearing systems like other mycotoxins or pathogens, stress factors, etc.), nutritional and health status of animals as well as biological characteristic of specimens (age, sex, trophic position, etc.). In the present study a purified form of MON was used and it is known that the natural form of mycotoxin present in contaminated feed may be more toxic to animals than artificially contaminated feed [28], especially due to co-occurrence with other metabolites. Co-occurrence of mycotoxins in naturally mycotoxin-contaminated feed is generally very high [10], increasing the possibility of synergistic or additive effects. In fact it is important to evaluate the effects of MON co-occurring with other regulated mycotoxins as DON, which is frequently found in same samples as MON [6]. The motivation to study the effect of MON on bone malformation, survival and growth using zebrafish as a model, was mainly due to collaborations between BIOMIN and some clients, in which it was hypothesized that high incidence of bone malformation in certain fish batches could be associated to the presence of MON in diets. Despite some indications of negative effects of MON in growth parameters in zebrafish, it is not clear, at least for the dosages, administration route and exposure duration tested, if MON has the potential to cause severe bone malformations. However, the scientific approach taken to explore effects of MON in zebrafish was quite simplistic, taking into account that MON rarely occur alone in the diets. In the case of the diets causing severe malformation to this unnamed client, which motivated the study, other Fusarium metabolites were found together with other mycotoxins and metabolites at low levels (data not shown). Synergistic effects between these mycotoxins, even in low levels, can significantly increase the negative effects of these compounds and cannot be ignored.
It is fundamental to understand the mechanism that caused the decrease of survival and growth in zebrafish in farmed species, however also focusing on co-occurrence of MON with other Fusarium metabolites and other mycotoxins from Aspergilli or Penicillia.

5. Conclusions

In conclusion, MON did not decrease bone mineralization, both by in vivo and in vitro assays. Minimal in vitro cytotoxicity concentration has been reported at 1000 µg L−1 MON. Incidence of deformities was also not altered by MON at the concentration tested (450 µg L−1) although larval growth was affected, as shown by the decrease in standard length of exposed specimens after 20 dpf. Moniliformin concentrations higher than 900 μg L−1 significantly decreased larvae survival when compared to control. Gene expression analysis also showed no effect on bone and cartilage development, confirming the in vivo and in vitro results.

Acknowledgments

The authors would like to thank Domingos Prata for help in cell culture experiments and Ryan Hines for revising the manuscript. This work was partly funded by the Fundação para a Ciência e a Tecnologia (FCT) and the European Commission (ERDF-COMPETE) through PEst-C/MAR/LA0015/2011 project and by the FCT through UID/Multi/04326/2013 project.

Author Contributions

R.A.G., D.S., M.T. and P.G. were responsible for designing the study. M.T. and P.G. carried out the setup of the experiment, were responsible for the maintenance of the animals, for data collection and analysis. R.A.G. and M.T. drafted the manuscript and interpreted the results. All authors were involved in revising the manuscript and approved the final manuscript.

Conflicts of Interest

This experiment was performed under a research agreement between BIOSKEL group of the Centre of Marine Sciences (CCMAR, Faro, Portugal) with P.G. as the principal investigator and Biomin Holding GmbH (Getzersdorf, Austria) with R.A.G. as the principal investigator. Biomin Holding GmbH as funding source had no involvement in the collection of the data. The authors declare no conflict of interests.

References

  1. Miraglia, M.; Marvin, H.J.P.; Kleter, G.A.; Battilani, P.; Brera, C.; Coni, E.; Cubadda, F.; Croci, L.; De Santis, B.; Dekkers, S.; et al. Climate change and food safety: An emerging issue with special focus on Europe. Food Chem. Toxicol. 2009, 47, 1009–1021. [Google Scholar] [CrossRef] [PubMed]
  2. Paterson, R.R.M.; Lima, N. How will climate change affect mycotoxins in food? Food Res. Int. 2010, 43, 1902–1914. [Google Scholar] [CrossRef] [Green Version]
  3. Paterson, R.R.M.; Lima, N. Further mycotoxin effects from climate change. Food Res. Int. 2011, 44, 2555–2566. [Google Scholar] [CrossRef] [Green Version]
  4. Ali, N.; Sardjono; Yamashita, A.; Yoshizawa, T. Natural co-occurrence of aflatoxins and Fusarium mycotoxins (fumonisins, deoxynivalenol, nivalenol and zearalenone) in corn from Indonesia. Food Addit. Contam. Part A 1998, 15, 377–384. [Google Scholar] [CrossRef] [PubMed]
  5. Binder, E.M.; Tan, L.M.; Chin, L.J.; Handl, J.; Richard, J. Worldwide occurrence of mycotoxins in commodities, feeds and feed ingredients. Anim. Feed Sci. Technol. 2007, 137, 265–282. [Google Scholar] [CrossRef]
  6. Kovalsky, P.; Kos, G.; Nährer, K.; Schwab, C.; Jenkins, T.; Schatzmayr, G.; Sulyok, M.; Krska, R. Co-occurrence of regulated, masked and emerging mycotoxins and secondary metabolites in finished feed and maize—An extensive survey. Toxins 2016, 8, 363. [Google Scholar] [CrossRef] [PubMed]
  7. Krska, R. How does climate change impact on the occurrence and the determination of natural toxins. In Proceedings of the 7th International Symposium on Recent Advances in Food Analysis, Prague, Czech Republic, 3–6 November 2015. [Google Scholar]
  8. Anater, A.; Manyes, L.; Meca, G.; Ferrer, E.; Luciano, F.B.; Pimpão, C.T.; Font, G. Mycotoxins and their consequences in aquaculture: A review. Aquaculture 2016, 451, 1–10. [Google Scholar] [CrossRef]
  9. Gonçalves, R.A.; Naehrer, K.; Santos, G.A. Occurrence of mycotoxins in commercial aquafeeds in Asia and Europe: A real risk to aquaculture? Rev. Aquac. 2016. [Google Scholar] [CrossRef]
  10. Gonçalves, R.A.; Schatzmayr, D.; Hofstetter, U.; Santos, G.A. Occurrence of mycotoxins in aquaculture: Preliminary overview of Asian and European plant ingredients and finished feeds. World Mycotoxin J. 2017, 10, 183–194. [Google Scholar] [CrossRef]
  11. Jestoi, M. Emerging Fusarium-mycotoxins fusaproliferin, beauvericin, enniatins, and moniliformin—A review. Crit. Rev. Food Sci. Nutr. 2008, 48, 21–49. [Google Scholar] [CrossRef] [PubMed]
  12. Goertz, A.; Zuehlke, S.; Spiteller, M.; Steiner, U.; Dehne, H.W.; Waalwijk, C.; de Vries, I.; Oerke, E.C. Fusarium species and mycotoxin profiles on commercial maize hybrids in Germany. Eur. J. Plant Pathol. 2010, 128, 101–111. [Google Scholar] [CrossRef]
  13. Allen, N.K.; Burmeister, H.R.; Weaver, G.A.; Mirocha, C.J. Toxicity of dietary and intravenously administered moniliformin to broiler chickens. Poult. Sci. 1981, 60, 1415–1417. [Google Scholar] [CrossRef] [PubMed]
  14. Abbas, H.K.; Mirocha, C.J.; Vesonder, R.F.; Gunther, R. Acute toxic effects of an isolate of moniliformin-producing Fusarium oxysporum and purified moniliformin on rats. Arch. Environ. Contam. Toxicol. 1990, 19, 433–436. [Google Scholar] [CrossRef] [PubMed]
  15. Engelhardt, J.A.; Carlton, W.W.; Tuite, J.F. Toxicity of Fusarium moniliforme var. subglutinans for chicks, ducklings and Turkey poults. Avian Dis. 1989, 33, 357–360. [Google Scholar] [PubMed]
  16. Yildirim, M.; Manning, R.; Lovell, J.; Grizzle, R. Toxicity of moniliformin and fumonisin B1 fed singly and in combination in diets for channel catfish Ictalurus punctatus. J. World Aquac. Soc. 2000, 31, 599–608. [Google Scholar] [CrossRef]
  17. Tuan, N.A.; Manning, B.B.; Lovell, R.T.; Rottinghaus, G.E. Responses of nile tilapia (Oreochromis niloticus) fed diets containing different concentrations of moniliformin or fumonisin B1. Aquaculture 2003, 217, 515–528. [Google Scholar] [CrossRef]
  18. Zhang, A.; Cao, J.-L.; Yang, B.; Chen, J.-H.; Zhang, Z.-T.; Li, S.-Y.; Fu, Q.; Hugnes, C.E.; Caterson, B. Effects of moniliformin and selenium on human articular cartilage metabolism and their potential relationships to the pathogenesis of Kashin-Beck disease. J. Zhejiang Univ. Sci. B 2010, 11, 200–208. [Google Scholar] [CrossRef] [PubMed]
  19. Cao, J.; Li, S.; Shi, Z.; Yue, Y.; Sun, J.; Chen, J.; Fu, Q.; Hughes, C.E.; Caterson, B. Articular cartilage metabolism in patients with Kashin-Beck Disease: An endemic osteoarthropathy in China. Osteoarthr. Cartil. 2015, 16, 680–688. [Google Scholar] [CrossRef] [PubMed]
  20. Boglione, C.; Gisbert, E.; Gavaia, P.; Witten, P.E.; Moren, M.; Fontagné, S.; Koumoundouros, G. Skeletal anomalies in reared European fish larvae and juveniles. Part 2: Main typologies, occurrences and causative factors. Rev. Aquac. 2013, 5, S121–S167. [Google Scholar] [CrossRef]
  21. Subasinghe, R.P.; Arthur, J.R.; Shariff, M. Health Management in Asian Aquaculture: Proceedings of the Regional Expert Consultation on Aquaculture Health Management in Asia and the Pacific, Serdang, Malaysia, 22–24 May 1995; FAO Fisheries Technical Paper. No. 360; FAO: Rome, Italy, 1996; 142p, ISBN 92-5-103917-8. [Google Scholar]
  22. Tarasco, M.; Laizé, V.; Cardeira, J.; Cancela, M.L.; Gavaia, P.J. The zebrafish operculum: A powerful system to assess osteogenic bioactivities of molecules with pharmacological and toxicological relevance. Comp. Biochem. Physiol. Part C Toxicol. Pharmacol. 2017, 197, 45–52. [Google Scholar] [CrossRef] [PubMed]
  23. Gavaia, P.J.; Sarasquete, C.; Cancela, M.L. Detection of mineralized structures in early stages of development of marine teleostei using a modified alcian blue-alizarin red double staining technique for bone and cartilage. Biotech. Histochem. 2000, 75, 79–84. [Google Scholar] [CrossRef] [PubMed]
  24. Dionísio, G.; Campos, C.; Valente, L.M.P.; Conceição, L.E.C.; Cancela, M.L.; Gavaia, P.J. Effect of egg incubation temperature on the occurrence of skeletal deformities in solea senegalensis. J. Appl. Ichthyol. 2012, 28, 471–476. [Google Scholar] [CrossRef]
  25. Pombinho, A.R.; Laizé, V.; Molha, D.M.; Marques, S.M.P.; Cancela, M.L. Development of two bone-derived cell lines from the marine teleost Sparus aurata; evidence for extracellular matrix mineralization and cell-type-specific expression of matrix Gla protein and osteocalcin. Cell Tissue Res. 2004, 315, 393–406. [Google Scholar] [CrossRef] [PubMed]
  26. Pfaffl, M.W. A new mathematical model for relative quantification in real-time RT-PCR. Nucleic Acids Res. 2001, 29, e45. [Google Scholar] [CrossRef] [PubMed]
  27. Pineda-Valdes, G.; Bullerman, L.B. Thermal stability of moniliformin at varying temperature, pH, and time in an aqueous environment. J. Food Prot. 2000, 63, 1598–1601. [Google Scholar] [CrossRef] [PubMed]
  28. Hilgenfeld, R.; Saenger, W. Structural chemistry of natural and synthetic ionophores and their complexes with cations. In Topics in Current Chemistry; Boschke, F.L., Ed.; Springer: Berlin, Germany, 1982; Volume 101, pp. 1–82. [Google Scholar]
Figure 1. (A) Zebrafish larvae survival throughout three days of exposure to different concentrations of moniliformin (MON) starting at three days post-fertilization (dpf); Black line with circles includes the values for controls (H2O, EtOH and calcitriol) and for MON at 18, 90 and 450 ug L−1; (B) Osteogenic effect of different concentrations of MON assessed in developing zebrafish larvae through alizarin red S staining of the operculum. Changes in operculum area are expressed as percentages over the respective control i.e., H2O for MON and EtOH (0.1%) for calcitriol (10 pg mL−1). Corrected operculum area was determined by normalization with the area of the head according to Tarasco et al. [21]. Asterisks indicate values statistically different according to Student’s t test (**** p < 0.0001). Data presented as average ± standard deviation (SD) of average.
Fishes 03 00004 g001
Figure 2. Parameters collected at 20 dpf, after exposure to 450 µg L−1 of MON from three dpf in triplicates of 30 larvae. (A) Fish survival monitored throughout the treatment; (B) Averaged number of centra by condition; (C) Averaged incidence of deformities recorded by condition; (D) Averaged standard length by condition; (E) Counting of Pte (pterygiophores) and Lep (lepidotrichia) from anal, dorsal and caudal fins. Data presented as average ± SD of average.
Fishes 03 00004 g002aFishes 03 00004 g002b
Figure 3. (A) Cytotoxicity and (B) proliferative effect of different concentrations of MON assessed in confluent or sub-confluent VSa13 cell cultures, respectively, through the XTT cell survival assay. Value of the vehicle was set at 100%; (C) Mineralogenic effect of MON (highest non-toxic concentrations) assessed in mineralizing VSa13 cell cultures through alizarin red S staining. Changes in extracellular matrix (ECM) mineralization are shown as an x-fold change over the control. Asterisks indicate values statistically different from the vehicle (one-way ANOVA followed by Dunnett’s multiple comparison test (* p ≤ 0.05; **** p ≤ 0.0001). Data presented as average ± SD of average. No MIN: Medium without mineralization cocktail.
Fishes 03 00004 g003
Figure 4. Effects of MON on mRNA expression of selected genes. Zebrafish larvae were treated from 3 to 9 dpf with MON (900 µg L−1). The averaged expression of eef1a1l1, actb1 and rps18 mRNAs was used as a reference to normalize the expression levels of the studied genes. Data presented as average ± SD of average.
Fishes 03 00004 g004
Table 1. PCR primers used in this study to assess gene expression.
GenesSequence (5′-3′) NCBI Accession #
runx2bFw:TCAGGAATGCCTCAGGGGTTATGNM_212862
Rev:CTTGCGGTGGGTTTGTGAATACT
sp7Fw:GCTAAGTCCAGGGCAGGCTCAGNM_212863
Rev:CAATGGCGTGAAATCAGGAGTGTAAC
bglapFw:TTTATAGGCGGCGATGATTCCNM_001083857
Rev:GAAGCGAACATGAAGAGTCTGACAGTCC
bglaplFw:CCAACTCCGCATCAGACTCCGCATCANM_001291889
Rev:AGCAACACTCCGCTTCAGCAGCACAT
col1a1aFw:GCTTCATTGCCCAGCCACAGGANM_199214
Rev:GCAGGGTTCTTCTTGGTGCCGTCT
col10a1aFw:CAGGAAGAGTTTGGCGGCTGTNM_131292
Rev:GACACGGCACGGTTCTGGTT
col10a1aFw:ATACCCAGTTCTTGTCAAAAGTCCANM_001083827
Rev:GATCATAATGCTGCTCTGCGTT
mmp13Fw:TGTCAGTGGCAGAGGTGGATGACTCNM_001290479
Rev:CGCCACCAGGAACAGATTGTAATATTGAG
bmp2bFw:GAGGAACTTAGGAGACGACGGGAACGCNM_131360
Rev:TCTCGGGAATGAGTCCAACGGCAC
eef1a1l1Fw:TTGAGAAGAAAATCGGTGGTGCTGNM_131263
Rev:GGAACGGTGTGATTGAGGGAAATTC
actb1Fw:GATGCGGAAACTGGCAAAGGNM_131031
Rev:GAGGAGGGCAAAGTGGTAAACG
rps18Fw:AACACGAACATTGATGGAAGACGNM_173234
Rev:ATTAGCAAGGACCTGGCTGTATTT
Fw, Forward; Rev, Reverse.

