Article

Characterization of the Flavor Profile of Bigeye Tuna Slices Treated by Cold Plasma Using E-Nose and GC-IMS

1
Zhejiang Provincial Key Laboratory of Health Risk Factors for Seafood, Collaborative Innovation Center of Seafood Deep Processing, College of Food and Pharmacy, Zhejiang Ocean University, Zhoushan 316022, China
2
International Center of Excellence in Seafood Science and Innovation, Faculty of Agro-Industry, Prince of Songkla University, Hat Yai 90110, Thailand
3
Department of Agriculture, Food and Environment (DAFE), Pisa University, Via del Borghetto, 80, 56124 Pisa, Italy
4
Zhejiang Fishery Boss Agricultural Technology Co., Ltd., Quzhou 324000, China
5
Academy of Contemporary Agricultural Engineering Innovations, Zhongkai University of Agriculture and Engineering, Guangzhou 510225, China
6
Guangdong Provincial Key Laboratory of Lingnan Specialty Food Science and Technology, College of Light Industry and Food, Zhongkai University of Agriculture and Engineering, Guangzhou 510225, China
*
Authors to whom correspondence should be addressed.
Fishes 2022, 7(1), 13; https://doi.org/10.3390/fishes7010013
Submission received: 27 November 2021 / Revised: 20 December 2021 / Accepted: 5 January 2022 / Published: 8 January 2022

Abstract

:
To avoid heat, treatment induces numerous physicochemical changes under severe conditions in the tuna, cold plasma (CP), as a non-thermal technology, possess objective potential on tuna processing. The effect of cold plasma on the volatile flavor compounds of bigeye tuna (Thunnus obesus) sashimi has been evaluated using electronic nose (E-nose) and gas chromatography-ion mobility spectrometry (GC-IMS). GC–IMS results revealed a total of 33 volatile compounds in tuna slices. The effect of CP treatment on tuna flavor was not significant, furthermore CP could protect volatile freshness compounds such as 1-hexanol. Principal component analysis (PCA) of the E-nose and GC–IMS results could effectively differentiate the effect of storage to tuna sashimi. There was a high correlation between the E-nose and GC–IMS results, providing a theoretical basis for establishing the flavor fingerprint of tuna sashimi.

1. Introduction

Tuna, as one of the three major types of fish recommended by the International Union of Nutritional Sciences, owns extremely high nutritional value [1,2]. Tuna is also one of the most popular fishery products traded worldwide [3,4,5,6]. Bigeye tuna (Thunnus obesus) has a desirable and unique taste as well as positive effects on health, derived from its essential amino acids, vitamins, and unsaturated fatty acid etc., making it the main source of tuna sashimi [7]. Bigeye tuna is an important edible fish with significant commercial value [8]. However, the high nutritional value causes its sensitivity to oxidization and contamination by spoilage microorganisms, leading to external manifestations of corruption such as abnormal smell and browning surface [9]. Therefore, it is quite paramount to take effective measures to ensure tuna edibility and improve its storage quality. The food industry is increasingly seeking new processing technologies capable of inactivating microorganisms while protecting its own nutrition [10]. A particular focus has been put on non-thermal processing technologies, which are designed to eliminate the adverse effects of heat on food products. It is generally believed that applications of novel non-thermal technologies lead to a considerable impact on food structure by altering protein structures via free radicals or larger or smaller molecules [11]. Cold plasma (CP) has the characteristics of high efficiency of sterilization and strong environmental compatibility. In addition, it can be carried out at room temperature and atmospheric pressure, making it secure and energy saving. CP treatment can induce a wide array of active components including ozone and free radicals, depending on the different gases used in ionization [12,13,14]. Cold plasma generates reactive oxygen species (ROS) in air mixtures and production of ozone, which have a highly antimicrobial effect. The strong oxidative effect of species in cold plasma causes strong oxidative stress on cell membrane and lipid oxidation, enzyme inactivation, and DNA degradation. Ziuzina [15] found that 20 s of direct and 45 s of indirect plasma treatment resulted in complete bacterial inactivation, proving that the inactivation efficacy of dielectric barrier discharge atmospheric cold plasma (DBD-ACP) was significant. Nyaisaba [16] evaluated the effect of cold plasma on protein of squid in terms of protease inhibition and gel properties and confirmed that CP treatment will significantly reduce protease activity, however, increase texture profile and color properties. Pérez-Andrés [9] investigated the effects of cold plasma on mackerel and showed that no significant changes were found in the fatty acid composition after CP. Koddy [10] evaluated impacts of CP on the hairtail fish and found that CP could decrease the activity of crude enzyme extracts and improve the texture profile of muscle protein. To avoid numerous physicochemical changes that can generate a negative impact on the organoleptic properties induced by heat treatment, CP treatment seems to be necessary for tuna sashimi.
Color, texture, and flavor are important indicators of food quality. Among them, flavor is the first step for consumers to judge the quality of foods, which is significantly determined by volatile aroma [17]. Currently, the mainstream of instrumental analytical techniques for analyzing aroma compounds include electronic nose (E-nose) and gas chromatography-mass spectrometry (GC-MS). The E-nose pertains to an inexpensive and real-time method without pretreatment. GC-MS is one of the most commonly used volatile compound analysis techniques. In general, for different food matrix, GC-MS analysis requires complicated pre-treatment and long detection time [18]. However, gas chromatography-ion mobility spectrometry (GC-IMS) offers a novel, fast and non-destructive testing method which combines high separation capacity of gas chromatography and fast response of ion mobility spectrometry. This technique has been wildly applied in drug detection and disease surveillance, especially for food flavor analysis. GC plays an important role in separating complex compounds into individual components and reducing competitive ionization. In addition, GC-IMS is operated under atmospheric pressure, making the miniaturization of its equipment possible [19,20,21]. Wang [22] used GC-IMS to analyze volatile components from Jingyuan lambs of different ages and established flavor fingerprints. Guo [23] investigated the dynamic change during the yellowing process and the results clearly showed that fresh-cut yams were well distinguished by volatile compounds. Natalia [24] detected the volatile compound profile of Iberian ham with GC-IMS to distinguish possible frauds in labelling.
At present, the antibacterial mechanism of CP has been studied a lot. However, the research of CP on flavor is still not in-depth, so this article innovatively uses GC-IMS to analyze volatile flavor compounds to avoid the influence of complex pre-processing of GC-MS to tuna sashimi. The E-nose analyzes the similarity of odors from a macro level. GC-IMS explains the impact of CP treatment from the perspective of specific components. It provides a theoretical reference and basis for the preservation and treatment of tuna by CP in the future.

2. Materials and Methods

2.1. Materials and Apparatus

Bigeye tuna (Thunnus obesus) samples were purchased from Guangdong Shunxin Ocean Fishery Group Co., Ltd. (Yangjiang, China), which caught fish from the Indian and Pacific Ocean. The samples were preserved in a −80 °C ultra-low temperature refrigerator immediately after arriving at the lab. The instruments used in the experiment were a −80 °C refrigerator from Thermo Scientific (Suzhou, China) Instrument Co., Ltd., Phenix BK130/3 low-temperature plasma processor from Phenix Technologies Co., Ltd. (Accident, MD, USA), PEN3 electronic nose from AIRSENSE analytics and FlavourSpec® flavor analyzer from G.A.S in Germany.

2.2. Cold Plasma Treatment

Dielectric Barrier Discharge (DBD) was the main principle which the plasma generating machine used, which was described as Pankaj [25]. In the plasma generating instrument, two parallel circular aluminum electrodes which had 155 mm outer diameter formed the plasma source. Between the sample and electrodes, there were 2 mm thickness dielectric barriers made of polystyrene over each electrode. And the distance between two electrodes was 75 mm. For treatments, tuna was cut into slices (10 g, 2.5 cm × 5 cm each), then individually packaged into transparent polyethene bags. All tuna slices were randomly divided into three groups. One and a half minutes of treatment was performed at a discharge voltage of 40 kV Root Mean Square (RMS). According to the method of Ziuzina [25], all samples were kept at 4 °C and held for 7 days to allow the radical species formed to interact fully with slices. All the treatments were carried out in triplicate. We set group A1 as tuna samples without treatment for 0 days, group A2 as tuna samples without treatment for 7 days and group A3 as tuna samples with CP treatment for 7 days.

2.3. Sensory Ananlysis

Sensory properties of tuna sashimi were evaluated by 20 semi-trained panelists from the Food Science and Technology Department who were trained about the importance of impartial assessment of sensory attributes and the procedure for scoring. Panelists were required to rinse their mouth with normal drinking water before tasting each sample. The score was expanded from the following four dimensions: odor, appearance, texture, and overall acceptability on a nine-point hedonic scale (1 = dislike extremely, 2 = dislike very much, 3 = dislike moderately, 4 = dislike slightly, 5 = neither like nor dislike, 6 = like slightly, 7 = like moderately, 8 = like very much, 9 = like extremely). Samples were placed in covered glass cups and labelled with 3-digital code before served. Scores lower than 5 were considered as unacceptable.

2.4. Electronic Nose Analysis

The flavor characteristics of tuna slices were analyzed using an E-nose system of PEN3 according to the method of Wen [26] with some modifications. E-nose is quite sensitive to volatile flavor compounds within a detectable range, slight changes will cause differences in response. The E-nose equips with 10 different metal oxide semiconductor (MOS) sensors. Specific performances of each sensor are listed in Table 1. Briefly, mined tuna samples (5.00 g) were placed in a 25.00 mL beaker sealed with polytetrafluoroethylene film, then equilibrated the flavor in the beaker by incubation at 20 °C for 30 min. Each analysis was carried out in three biological replicates. Headspace gas in the beaker was extracted using a pump of electronic nose at a flow rate of 150 mL/min. The measurement was held for 3 min. Data were collected using the pattern recognition software Win-Muster (Version 1.6.2.22, Airsense Analytics GmbH, Schwerin, Germany).

2.5. Volatile Components Analysis by GC-IMS

Analyses of samples were performed using GC-IMS instruments as described by Zhang [27] with a few slight modifications. The volatile component analysis of tuna samples was completed on a combined device of an Agilent 490 gas chromatograph (Agilent Technologies, Palo Alto, CA, USA) and IMS instrument (FlavourSpec®, Gesellschaft für Analytische Sensorsystem mbH, Dortmund, Germany), equipped with an autosampler unit (CTC Analytics AG, Zwingen, Switzerland) that can be used to directly sample from the headspace by using a 1 mL air-tight heated syringe.
For the processing, tuna slices were minced and transferred 3.00 g to a 20.00 mL headspace vial closed with a magnetic cap. Samples were incubated at 40 °C for 20 min. Incubation rotating speed was 500 rpm. After incubation, a constant headspace (500.00 μL) was injected into the injector automatically by a heated syringe (85 °C). In the IMS unit, the samples were transferred into an MXT-5 (15 m 0.53 mm, film thickness 1 μm) capillary column by nitrogen gas (99.99%) at a programmed flow as follows: 2 mL per min for the first 2 min and then remain 2.00 mL per min for 8 min, then increased up to 10 mL per min for 10 min and increased to 100.00 mL per min for 10 min. Finally increased to 150.00 mL per min for the remaining 5 min. The total run time was 35 min. The ions of analytes ionized were directed to the drift tube with a constant temperature of 45 °C and the drift gas (N2, 99.99% purity) was set at 150 mL per min. The final results were the averages of three replicates. Experimental conditions of GC-IMS are listed in Table 2. The name of manufacture is American RESTEK technology company. The identification of the substance will be determined from two-dimensional of the retention index of gas chromatography and the relative migration time of the migration spectrum. In quantification, the relative content of the substance in different samples is calculated by the peak volume.

2.6. Data Processing

The results are presented as mean ± standard error (SE). T-tests were analyzed using SPSS 24.0 software (Chicago, IL, USA). Prior to ANOVA, the data were analyzed for normality using the Shapiro-Wilk’s test and for homogeneity using the Levene’s test. Analysis of variance (ANOVA) with Turkey’s multiple comparisons was used to assess the significance of the treatment effects (p < 0.05). Three independent groups of tuna slices were prepared, and the experimental measurements were performed in triplicate for each group. To evaluate the potential of E-nose and GC-IMS to distinguish the flavor profile in different tuna samples, principal component analysis (PCA) was performed using the response values of E-nose sensors and the peak signal intensities detected by GC-IMS, respectively. The data were normalized to make the variables comparable.

3. Results and Discussion

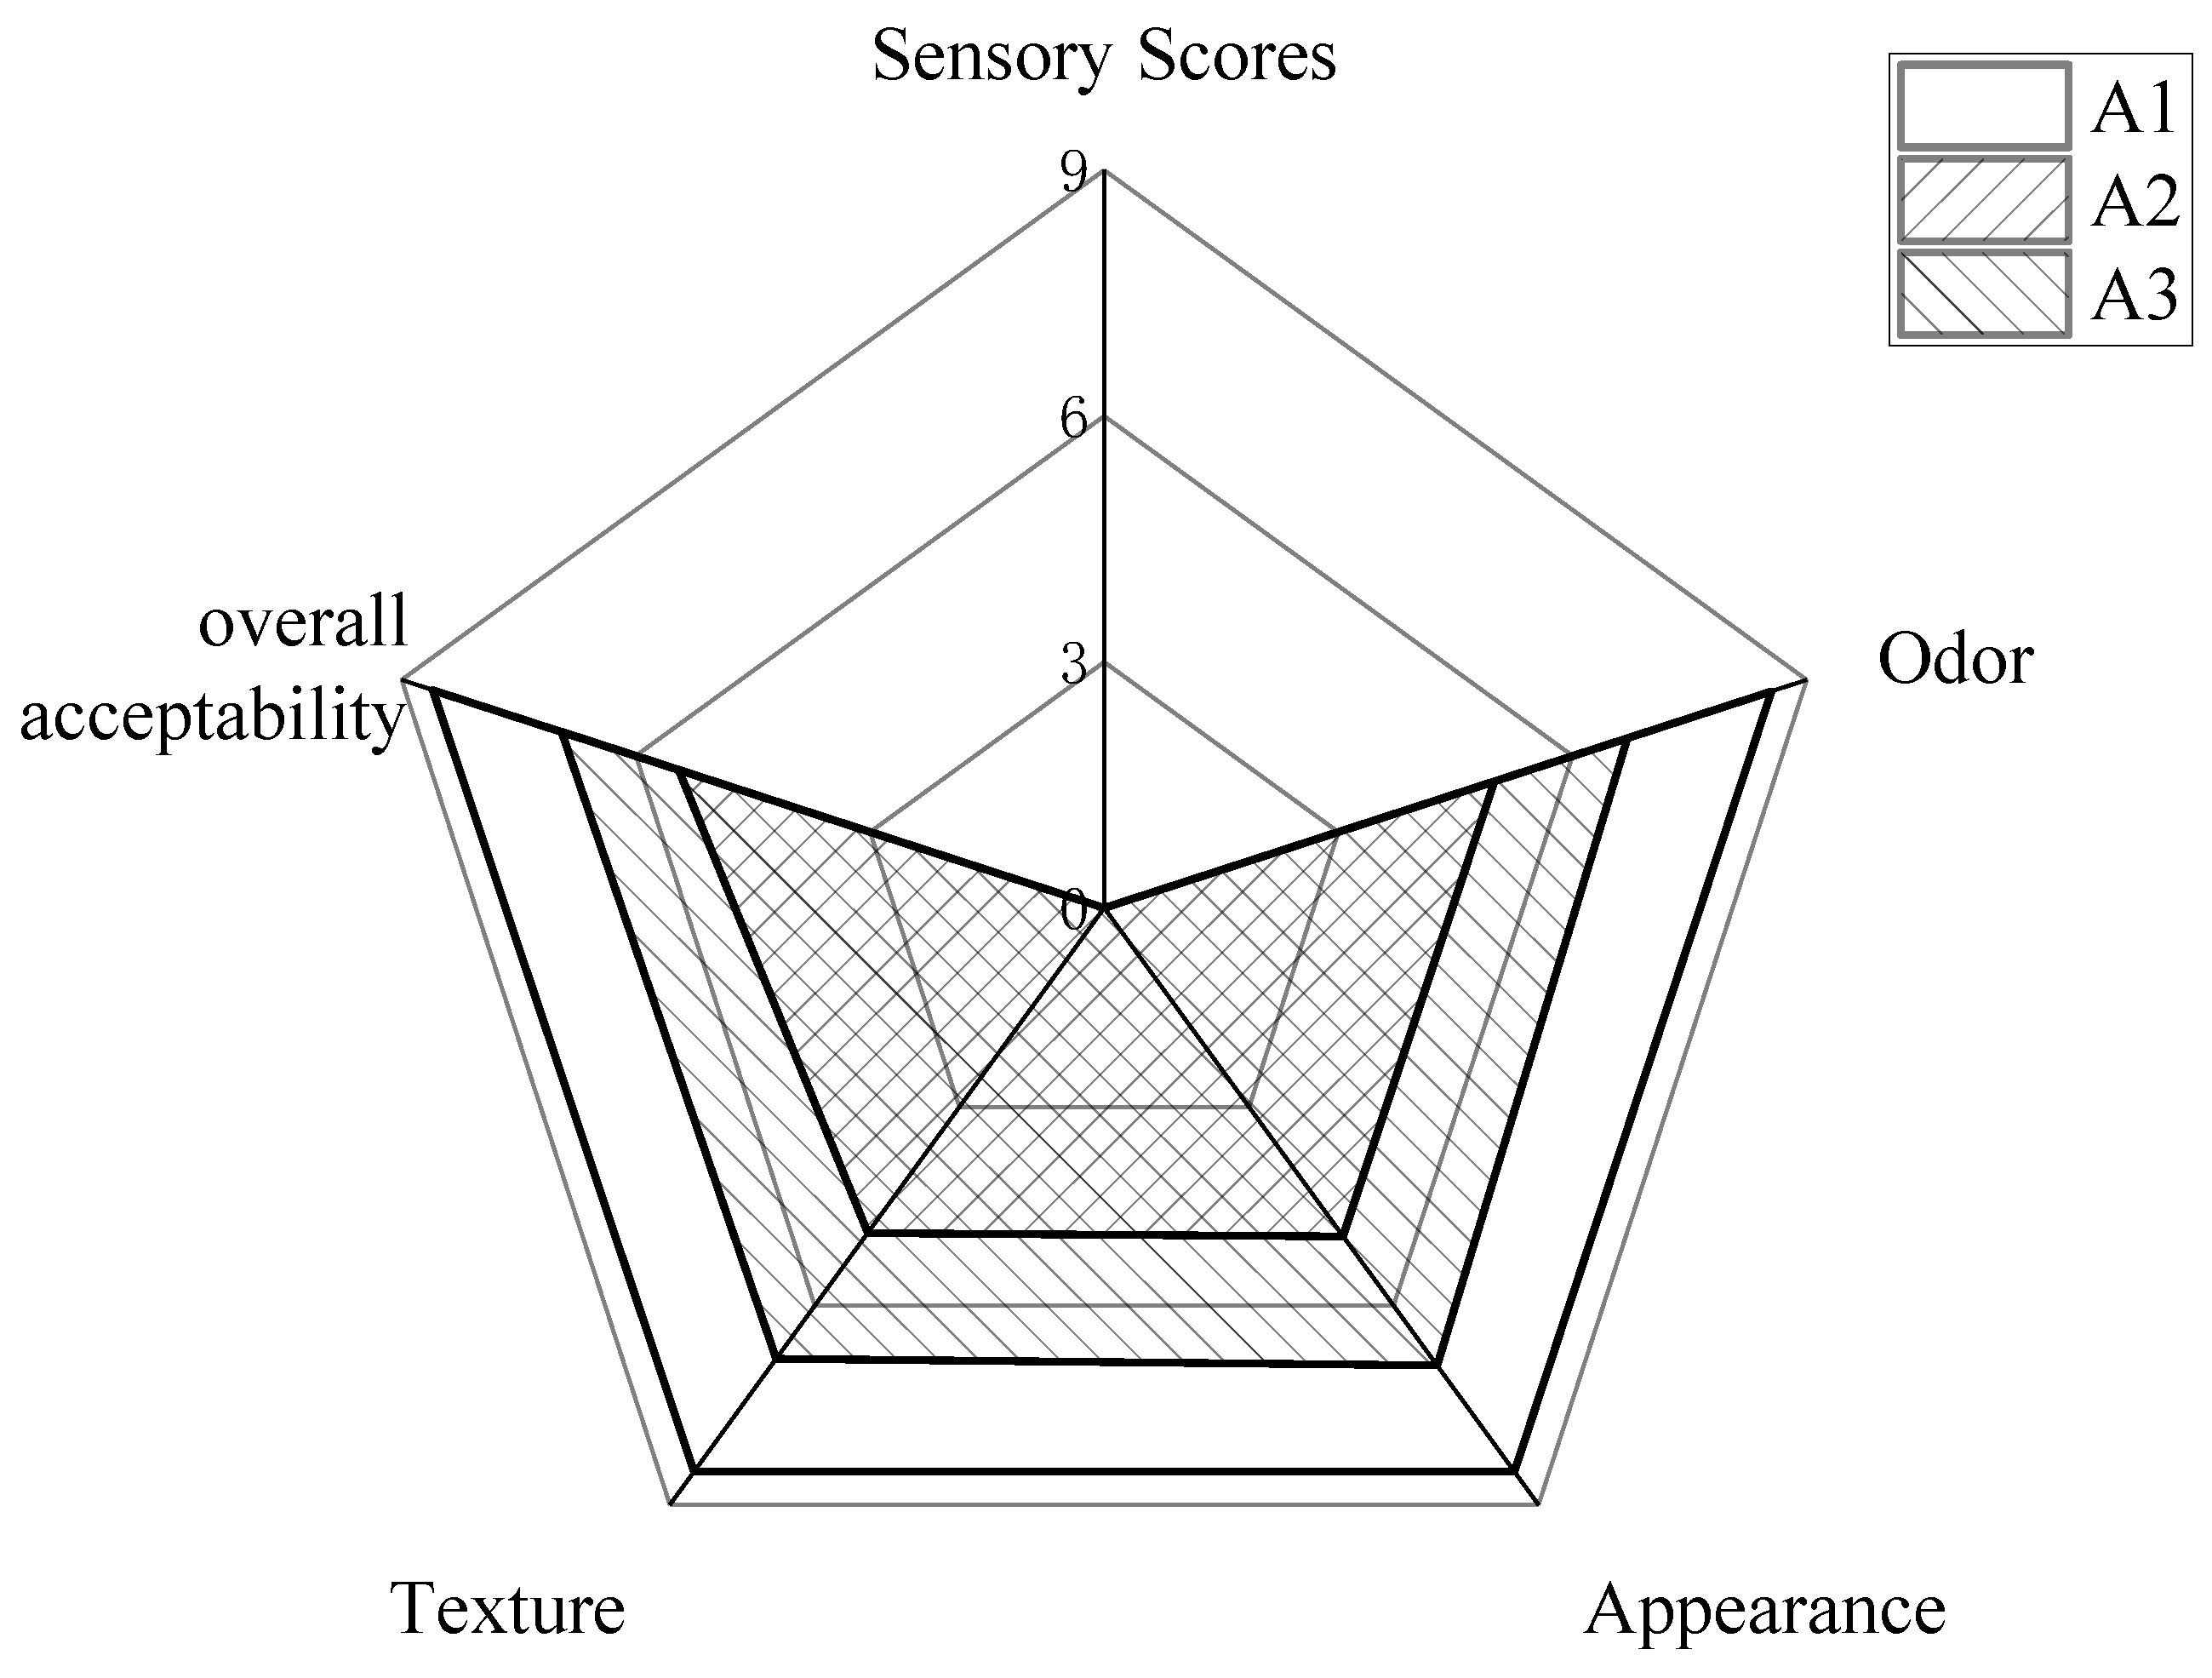
3.1. Sensory Evaluation

Descriptive sensory evaluation is an intuitive method to identify different food properties. The results of sensory evaluation of different groups are presented in Figure 1. In terms of odor, appearance, texture, and overall acceptability of three groups, sensory scores of A1 varied between 8 and 9, suitable for human consumption. Sensory scores of A2 were worse than A2, indicating that CP treatment could keep the texture and suppress bad flavor. Chen [28] found that ACP-treated chub mackerel maintained ‘like slightly’ to ‘like moderately’ quality and extended 8 days compared to the untreated group for overall acceptability. Chutia [29] investigated that cold plasma treated tender coconut water with 1% orange juice had acceptable sensory properties.

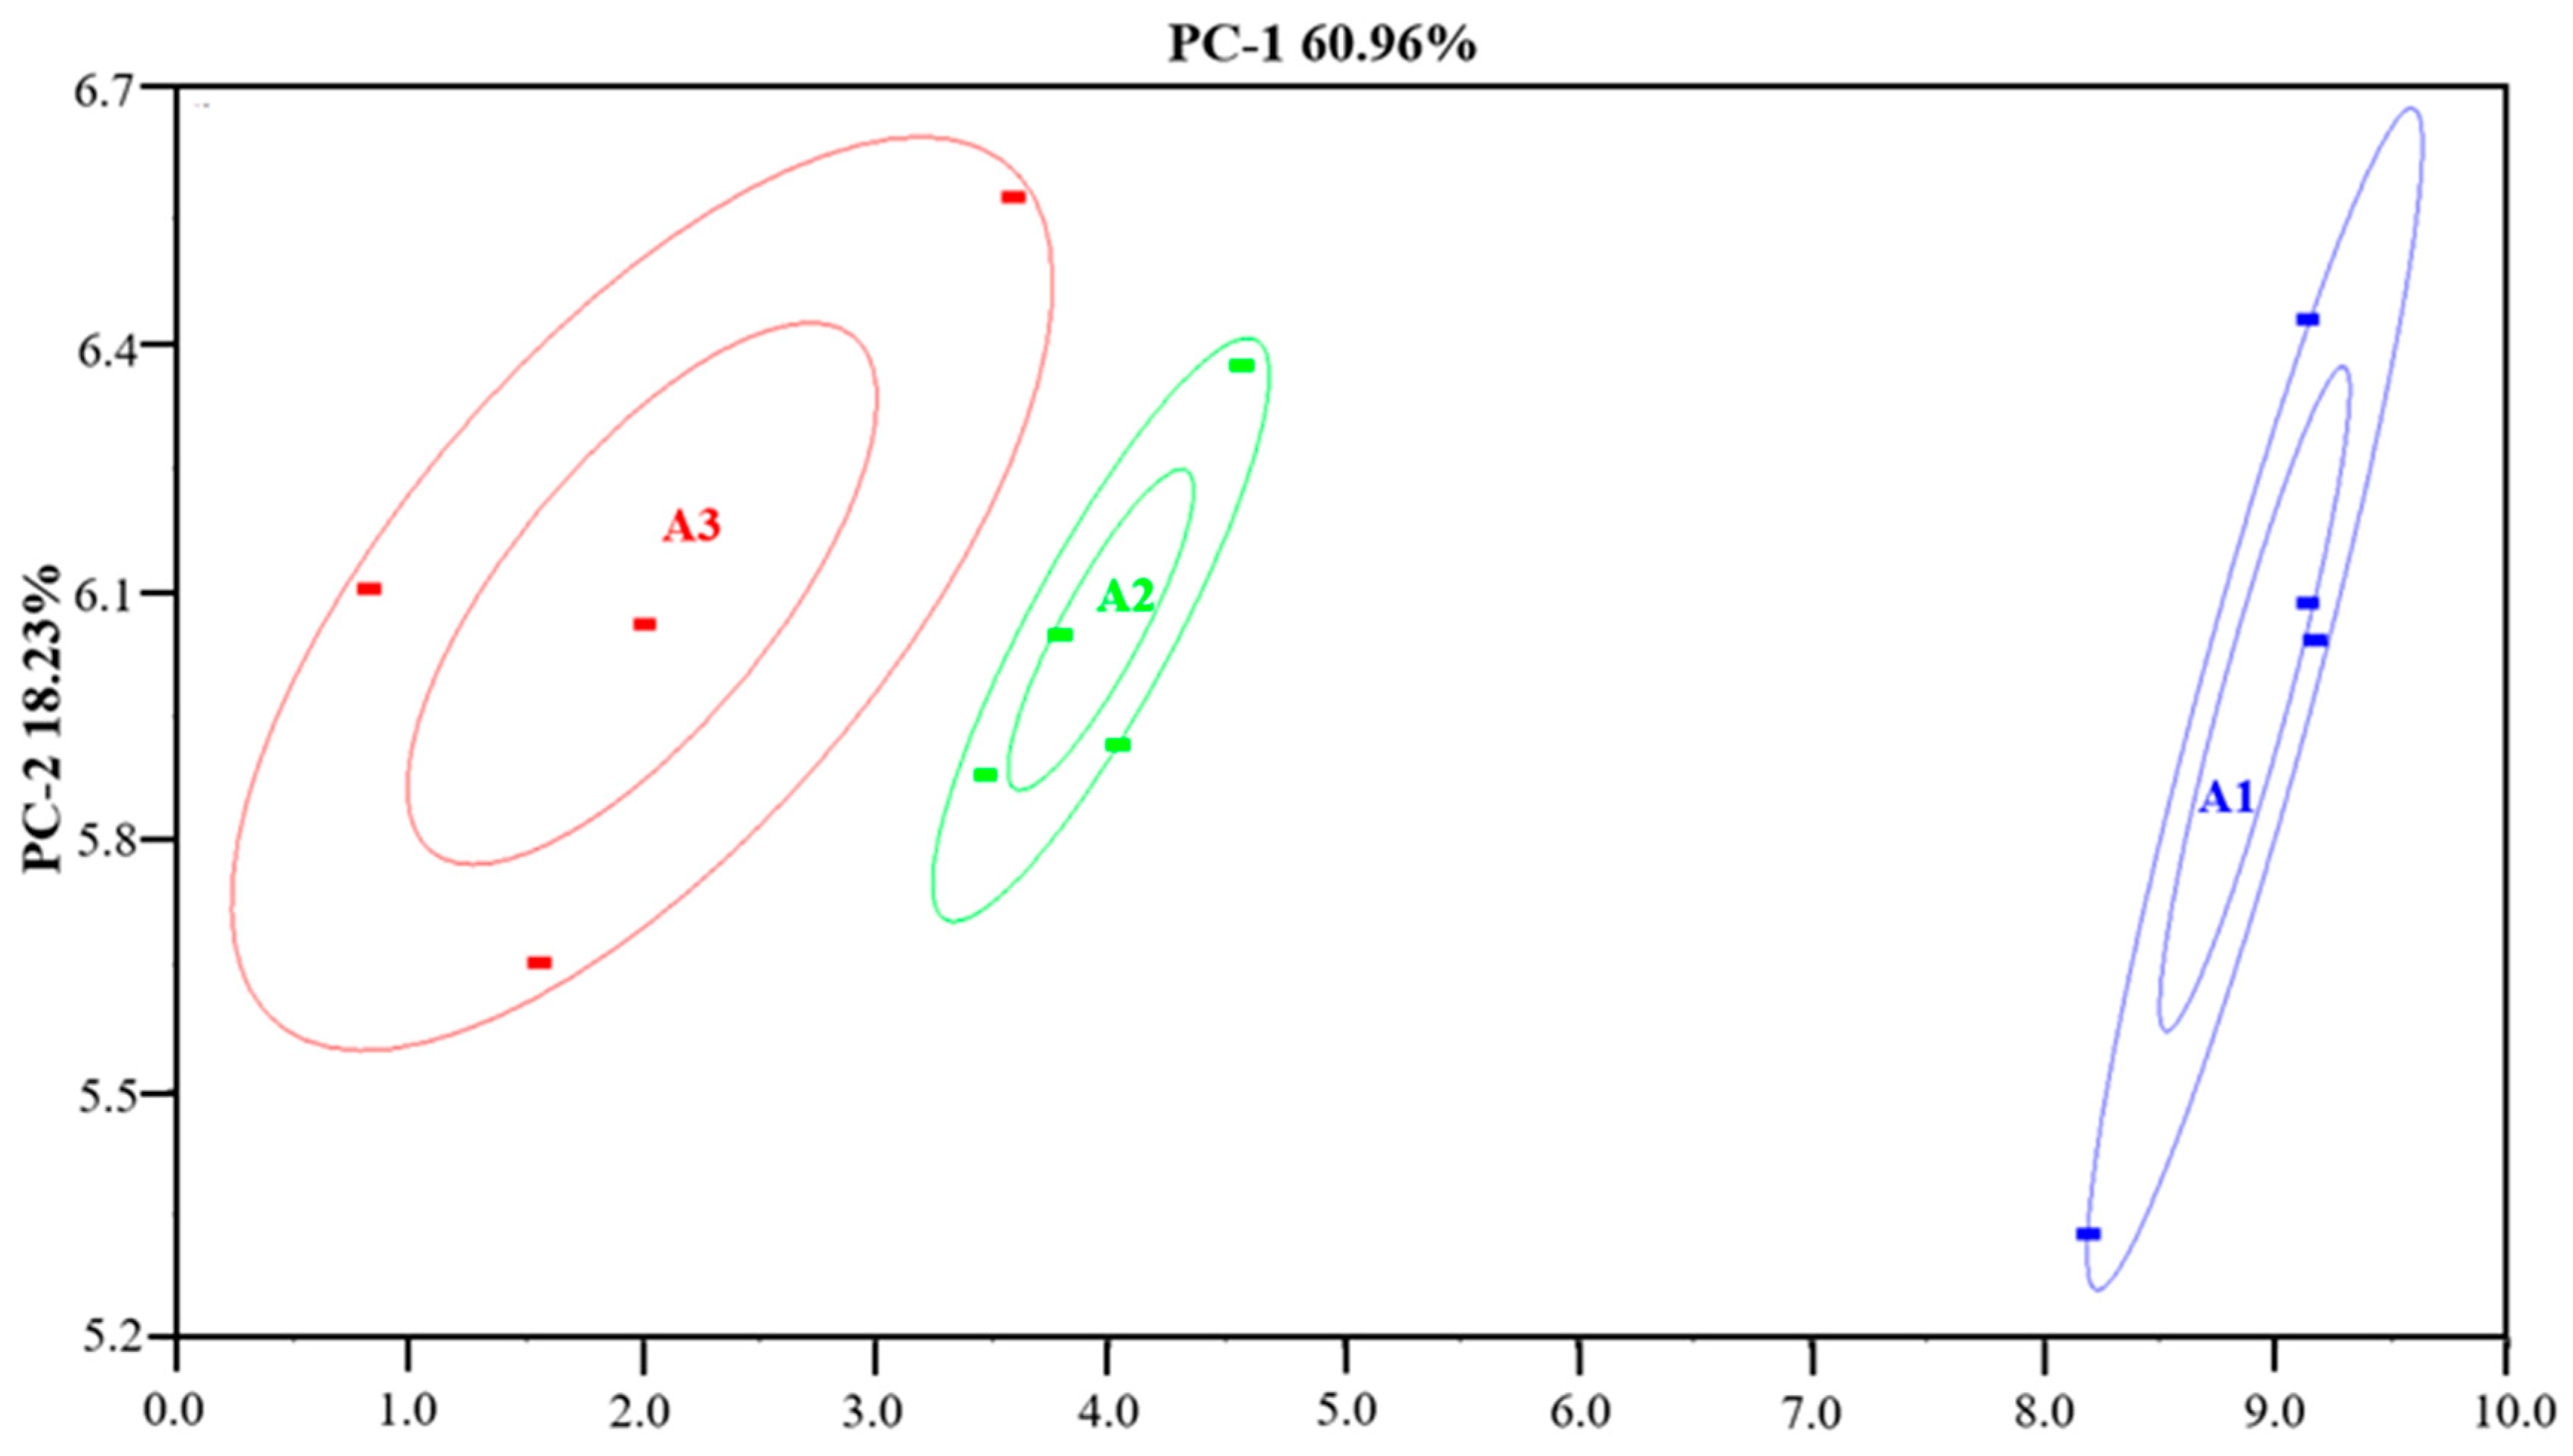
3.2. PCA Analysis of E-Nose

Principal component analysis (PCA) belongs to a method of eliminating the correlation between sensor response values of different sample s to generate principal component variables [28]. The results of PCA spatial for volatile components of different groups is presented in Figure 2. The variance contribution rates of PC1 and PC2 are 60.96% and 18.23%, respectively, and the total variance is nearly 80% indicating that it represents the main characteristic information. The value of PC1 decreased in the order of A3 < A2 < A1, while the value of PC2 decreased following the order of A1 < A2 < A3. There is no overlap in space of three sets. The spatial regions of samples showed that A2 and A3 samples were close to each other, while A1 separated clearly, which means that A2 and A3 had similar flavor compounds and there were significant differences between storage. Relatively speaking, CP has little effect on flavor. Although the E-nose can distinguish the differences between different groups overall, it cannot qualitatively analyze the specific components between groups [29].

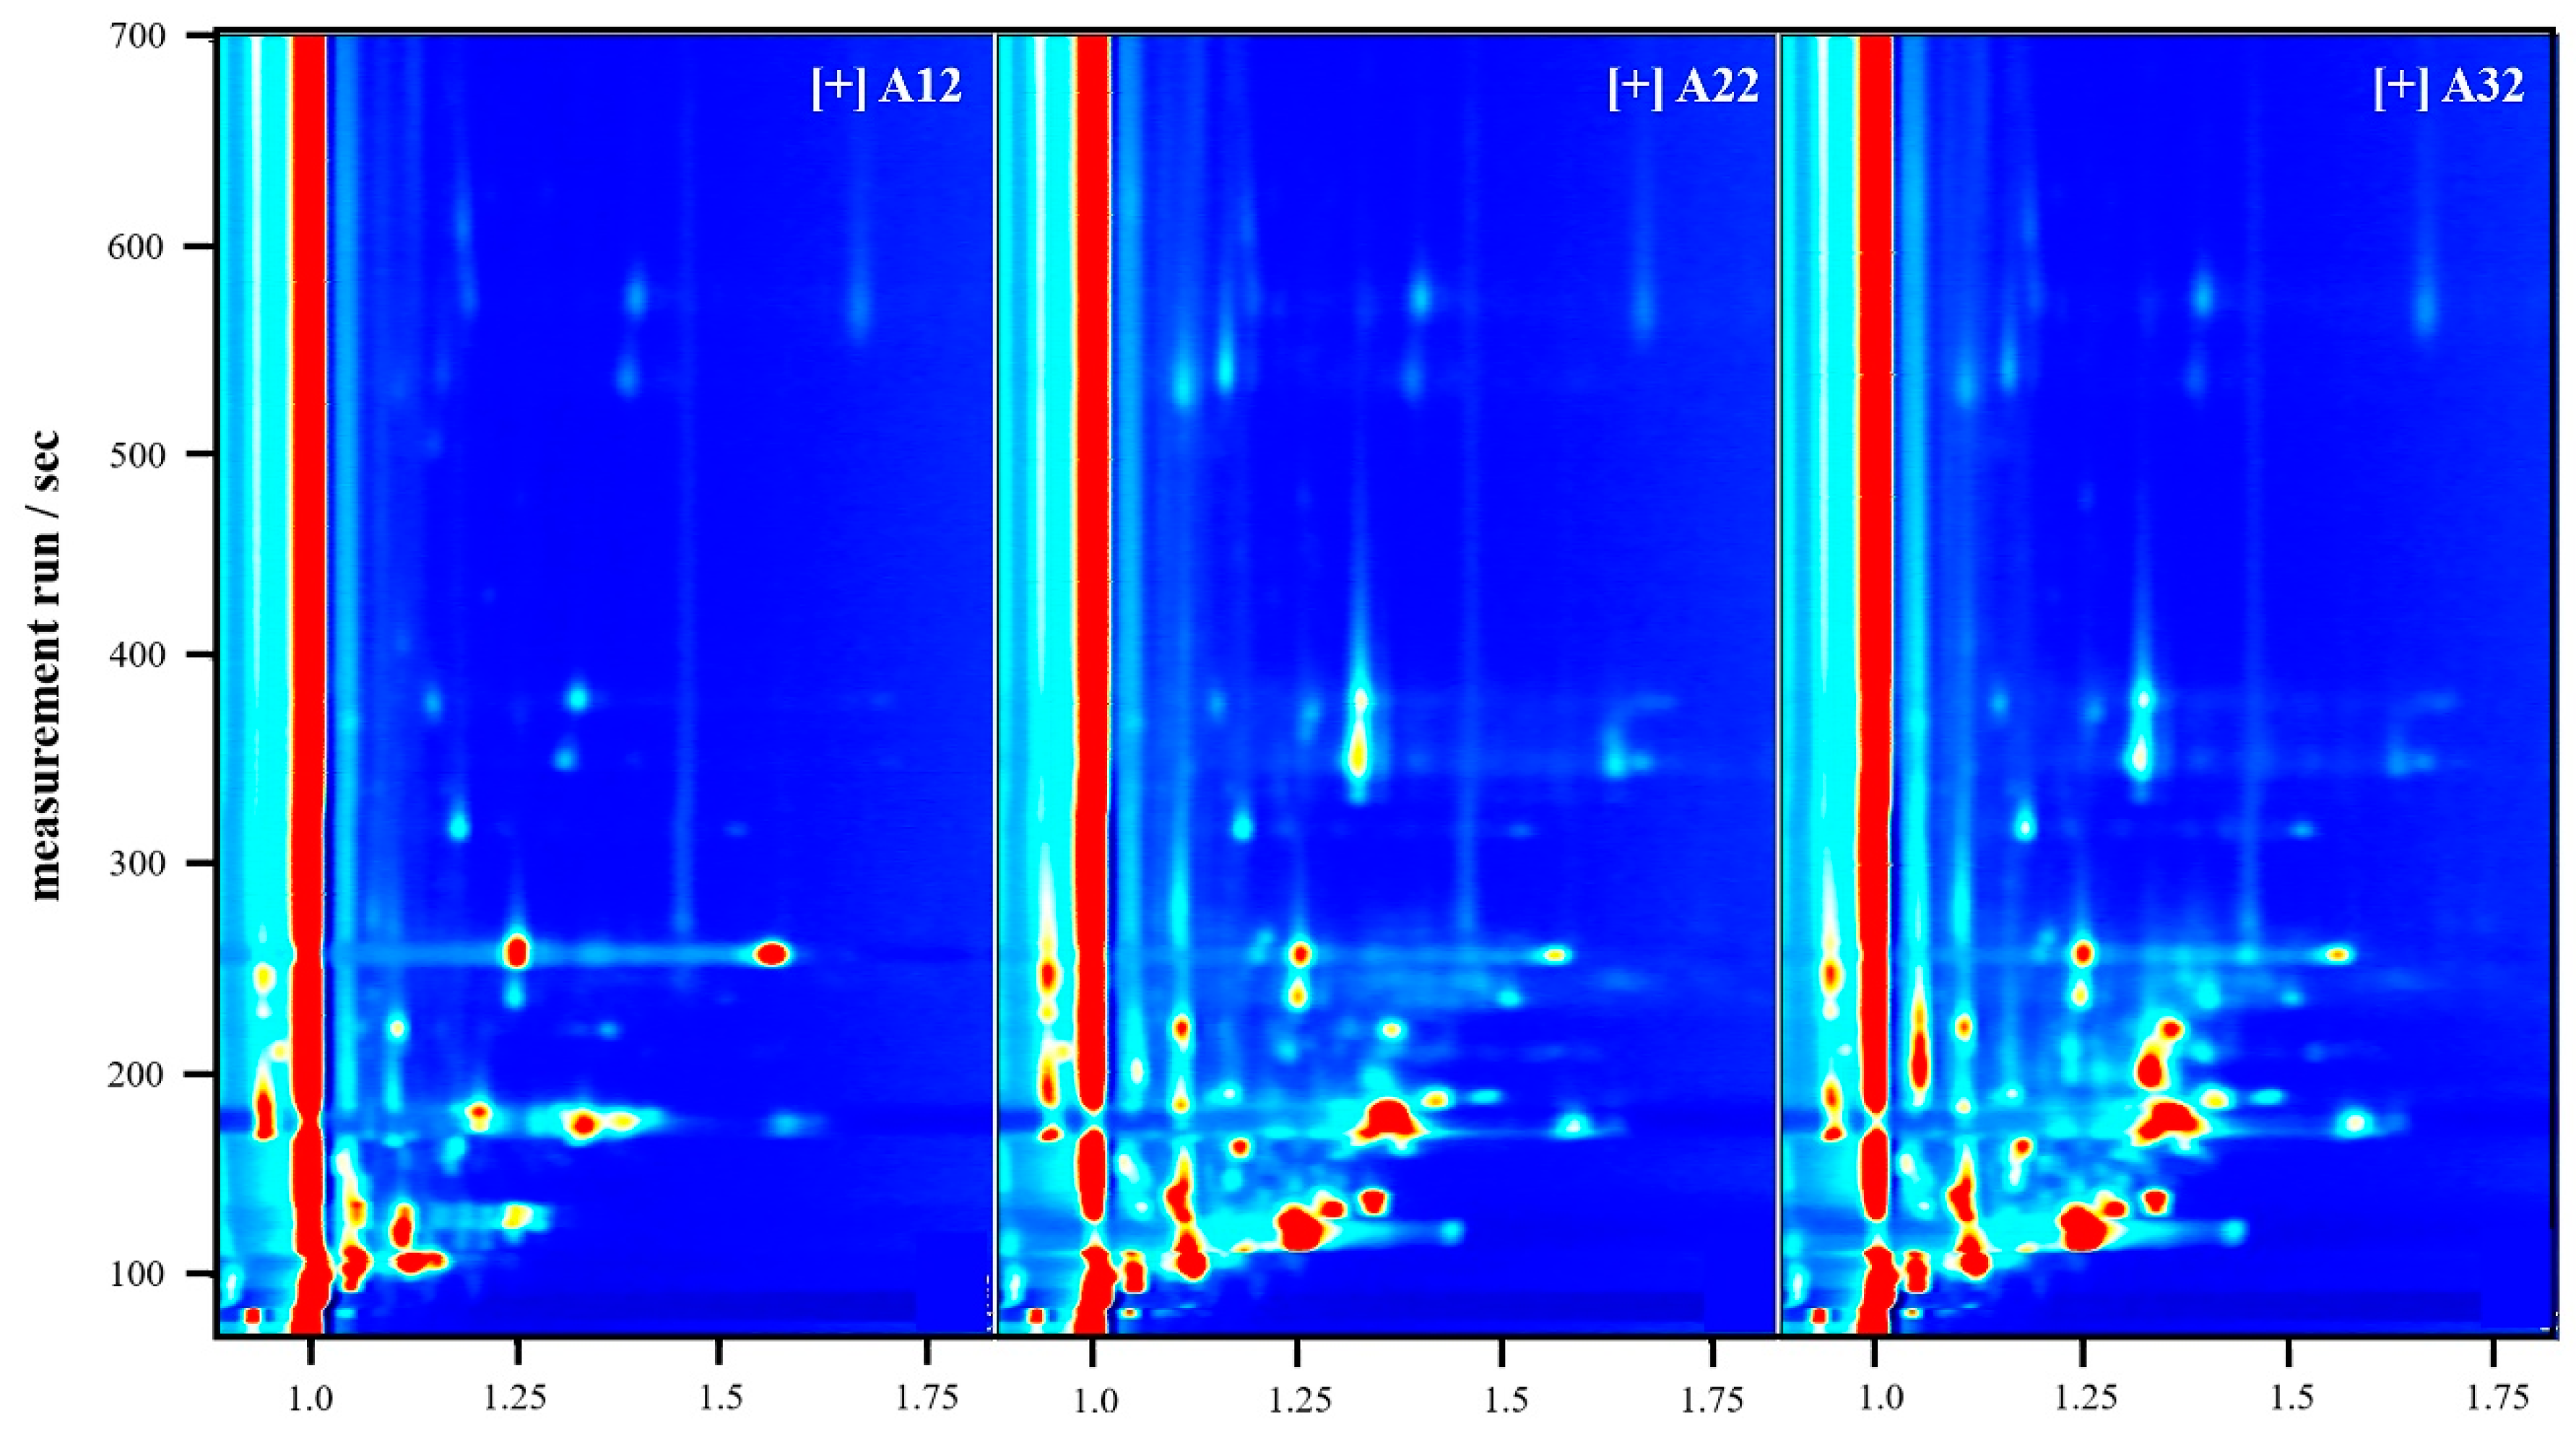
3.3. Data Analysis of GC-IMS

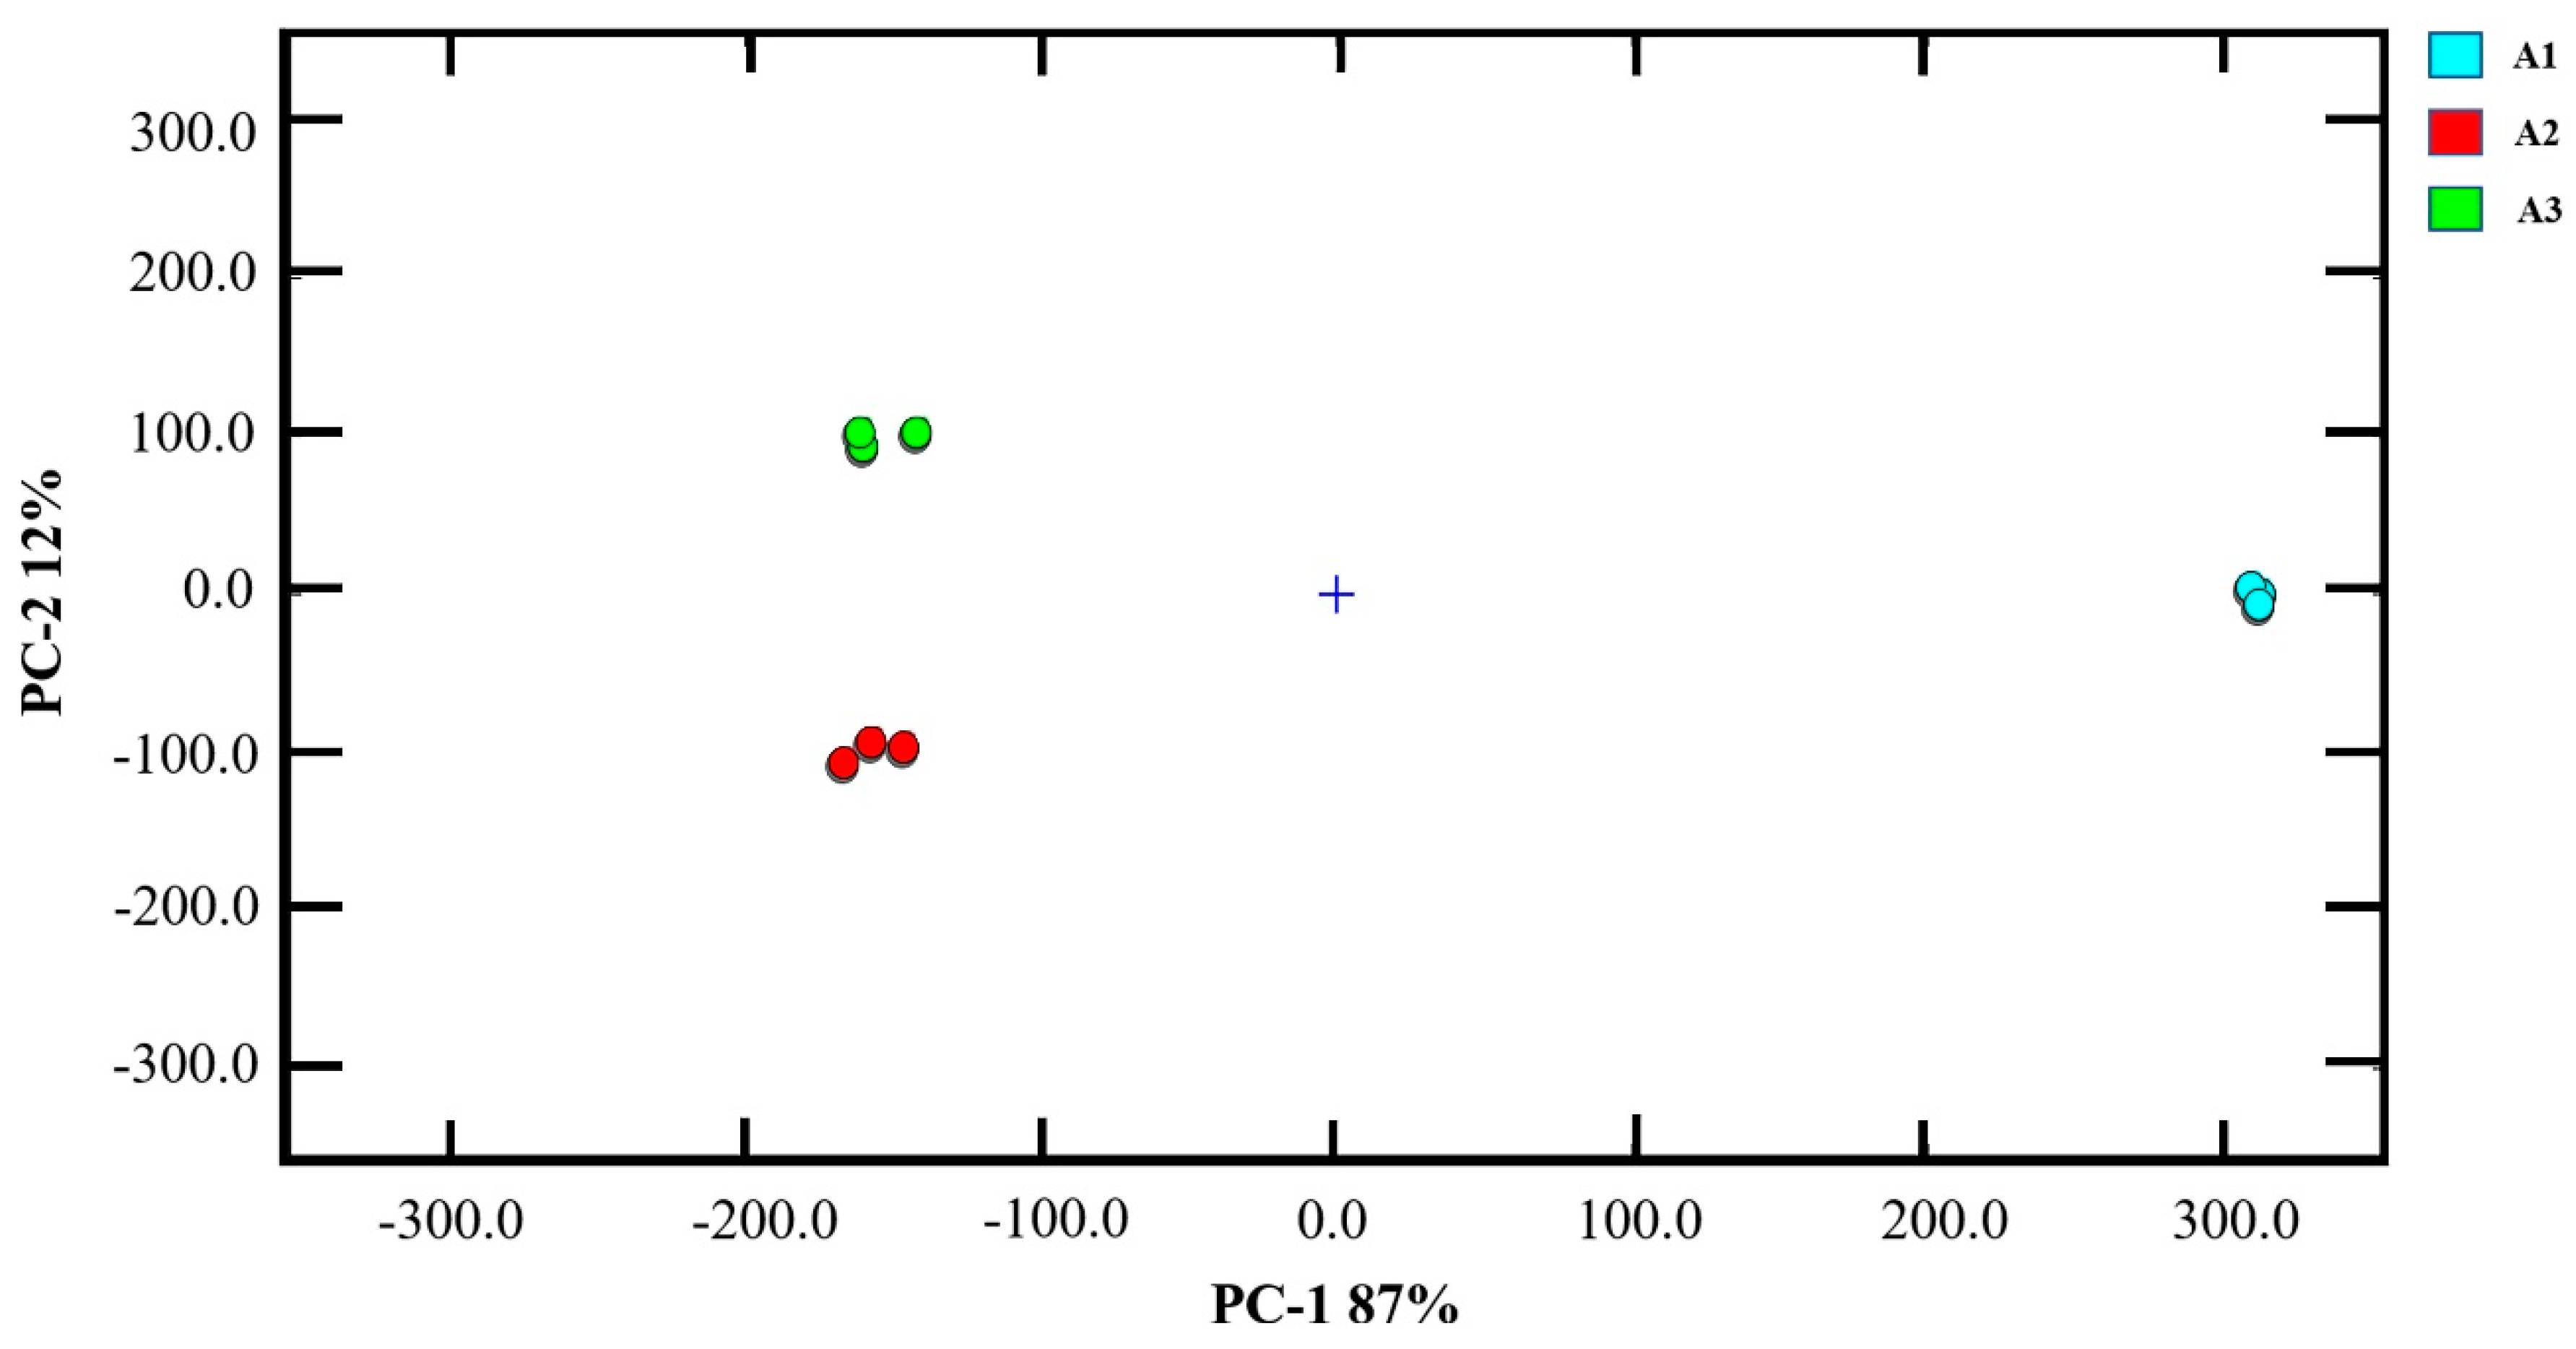
3.3.1. PCA Analysis of GC-IMS

PCA can evaluate the regularity and difference among samples by the contribution rate of PC factors [22]. The PCA results of volatile compounds in tuna slices from different treatment is presented in Figure 3. Generally, the PCA model is selected as the separation model while the contribution rate reaches 60% [30]. The total contribution rate of the first two principal components reaches 99%, indicating that the data can explain most of the odor information. There is a clear separation trend of tuna with different treatment in the axis of PC2, while finding a large distance between fresh samples and others, indicating that storage has a huge effect on the flavor, however the effect of the flavor changes after CP treatment is not significant compared to storage. The similarity within the triplicate was quite close. The trends of the PCA chart by the E-nose and GC-IMS are very similar, can be able to mutually prove the reliability of the results. A2 and A3 had similar flavor compounds, relative to A1. We could find that A2 and A3 had large differences compared to A1, which means that volatile compounds changed after storage from overall view. Therefore, we focused on A2 and A3 in the subsequent section.

3.3.2. Volatile Compound Identification in Tuna Sashimi of Different Treatment

Figure 4 shows the 2D topographical visualization of the volatile components by GC-IMS. Blue was determined as the background color of the whole figure, while the red vertical line at the X-axis 1.0 was the reactive ion peak (RIP). The Y-axis represented the retention time of the gas chromatography while the X-axis represented the ion migration time for identification after normalization. The whole spectrum represented the total volatile compounds of the samples. Every point on either side of the RIP peak represents one kind of volatile component extracted. The color represented the intensity of the compound while white represented lower intensity and red represented higher intensity. The intensity of the signal increased as the color was darker. We could clearly find that most of the signals appeared in the retention times of 100–400 s and the drift time of 1.0–1.5. It could be seen intuitively from the figure that the flavor of A1 was not only less in quantity but also lighter indicating that a mass of volatile compounds was formed during storage. After 7 days, the signal intensities at the drift time of 1.25–1.5 increased obviously, indicating that these volatile compounds were produced and accumulated during storage. For markers 21, 24, 25 and 26, groups A2 and A3 were significantly more than A1, belonged to alcohols and ketones compounds. They were the bad flavor produced by storage. For markers 17 and 30, A3 was significantly higher, possibly pertained to characteristic flavor compounds produced by CP treatment, and it was reasonable to infer that these components may have an antibacterial effect.

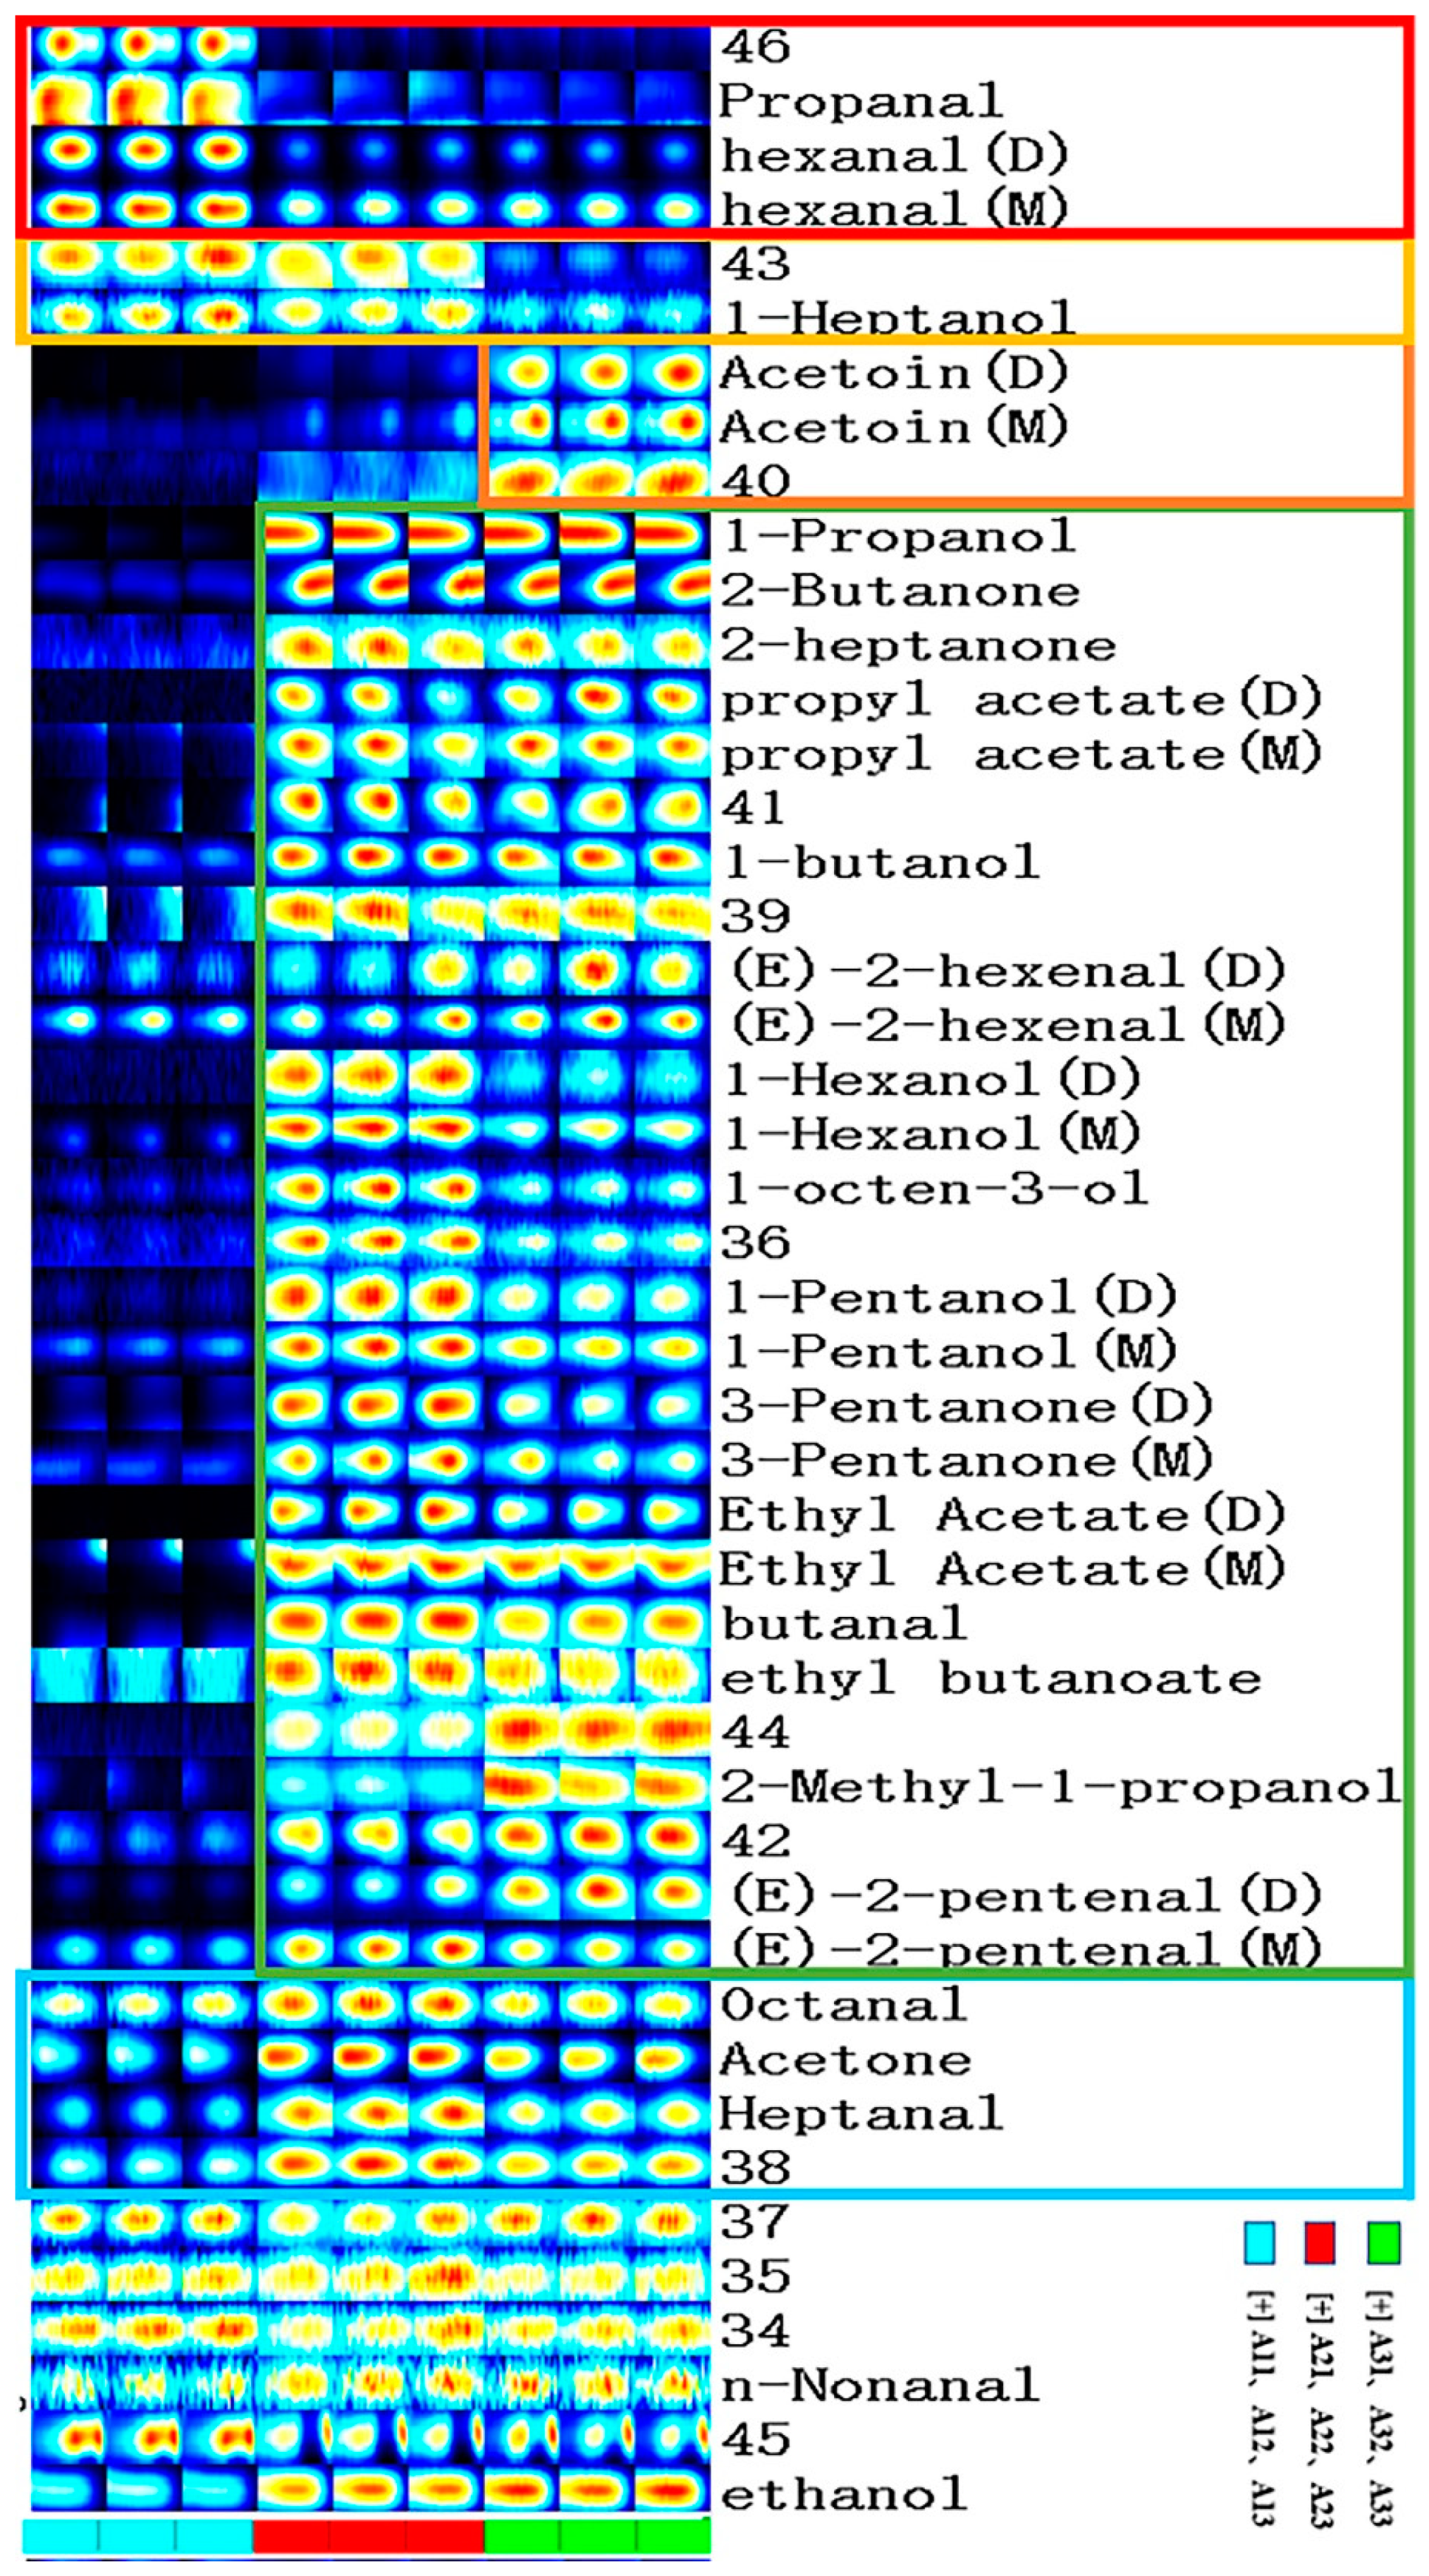
3.3.3. Comparison of Fingerprints of Volatile Compounds

GC-IMS was applied to qualitatively characterize all flavor information of tuna samples using fingerprint analysis. Gallery Plot could choose the appreciated visual plots and list them together for intuitive comparison [31]. According to the differences of volatile compounds in different groups of tuna samples, we established the characteristic fingerprints. The Gallery plot of volatile compounds in tuna slices from different treatment is presented in Figure 5. Each row represented a sample while a column represented a signal peak. The intensity of the signal was reflected by the degree of color, while blue represented lower intensity and red represented higher intensity. M and D in parentheses after the substance represented an aggregation state of monomer and dimer, respectively. The repeatability within groups was quite high and the differences between treatment groups were clear.
The volatile components in A2 and A3 were far more complex than those in A1, indicating that volatile flavor increased with storage time. In the red box, the intensity of components in A1 was much stronger, including propanal and hexanal, indicating that they were unique volatile components of fresh tuna samples, which conformed with the study of Zhang [32]. In the yellow box, the intensity of signal in A1 and A2 were much higher than that of A1, including 1-heptanol, indicating that CP treatment would destroy part of the volatile component that originally existed in the tuna. In the orange box, the intensity of A3 was much higher than the others, including acetoin, indicating that acetoin was the characteristic volatile component produced by CP. In the deep green box, the intensity of A2 and A3 was much stronger than A1, indicating that these components were gradually produced due to spoilage, including ethanol, propyl acetate, 1-butanol, and E-2-hexenal, etc. E-2-hexenal had a green grassy and fruity fragrance. It was a volatile substance with antibacterial effects which quickly released by most plants after injury [33]. However, there are few related reports detected in animals. Intensity of some substances in A2 was higher than A1, including ethyl acetate, butyraldehyde and ethyl butyrate, etc. While some substances in A3 were higher, including isobutanol and E-2-pentenal, indicating that these substances changed due to CP treatment indicating that CP may be able to protect some benign flavor compounds, which proved the value of the CP treatment. In the blue box, there were responses of signal for three groups, while the intensity in A2 was slightly higher, including octyl aldehyde, acetone, and heptaldehyde, etc., indicating that these substances may be related to the corruption of flavor. The concentration would increase with the storage time. CP treatment might reduce generation of flavor corruption. In summary, GC-IMS could clearly distinguish the differences between different groups, which proves the feasibility of this analysis method.

3.3.4. Qualitative Analysis of Volatile Compounds

Some single compounds might produce multiple signals due to different concentrations. This property might be attributed to compounds with a high proton affinity or signal that allowed ions to form dimers as they moved in the drift trough [21]. The high proton affinity of the analyte might relate to the formation of dimer. The protons in the reactants were transferred to the compounds with high proton affinity. Any compound with proton affinity higher than that of water was ionized, and a dimer or polymer was formed [34,35]. From the results of Table 3, the library of GC-IMS detected 33 kinds of volatile flavoring components and 4 categories in total, including 9 aldehydes, 12 alcohols, 7 ketones, and 5 esters. The compounds octanal, n-nonanal, heptanal, (E)-2-hexenal, hexanal, butanal, acetone, 1-octen-3-ol, 1-heptanol, 1-hexanol, 1-pentanol, (E)-2-pentenal, 1-butanol, 1-propanol, 2-methyl-1-propanol, ethanol, 2-heptanone, 3-pentanone, propanal, ethyl acetate, 2-butanone, ethyl butanoate, propyl acetate, acetoin.
Aldehydes usually play an important role in the flavor of aquatic products due to their low odor threshold. Hexanal and caprylic aldehyde were mainly described as fishy. Aldehydes were mainly derived from the degradation of fats. Alcohols had a higher threshold than aldehydes, such as linear saturated alcohols which had little contribution to flavor. Alcohols were mainly derived from oxidative decomposition of lipids or reduction synthesis of carbonyl groups. The 1-octen-3-ol compound had a scent of mushroom, which was commonly found in volatile components of fish, belonged to the hydroperoxide degradation product of linoleic acid. The threshold of ketones was much higher than aldehydes; therefore, they contribute little to the flavor. Ketones might derive from the thermal oxidation of unsaturated fatty acids or the degradation of amino acids. Ethyl acetate had a slightly fruity aroma and was considered to be a substance that contributed to the volatile components of fish [36,37]. Trimethylamine, as a main smell of decomposing fish, did not occur in this experiment. We considered two possible reasons. First, since the tuna samples we used were fresh muscles, the content of Trimethylamine was extremely low. Then the storage period of 7 days at 4 °C was relatively short. As a result, the level of trimethylamine was still relatively low, below the detection limit of the device. Therefore, we could not identify trimethylamine.

4. Conclusions

At present, there is little information on the effect of CP treatment on the flavor of tuna sashimi. This study innovatively uses the combination of E-nose and GC-IMS to explain the volatile flavor compounds from both macro and micro levels. In this study, the effect of CP treatment and storage for 7 days on the tuna has been investigated. We could conclude from the results that PCA of the E-nose and GC-IMS revealed that the CP treatment had little effect on the flavor. Combining with Gallery Plot, we can further conclude that CP treatment could even protect some of the volatile flavor compounds related to freshness, such as 1-hexanol. A total of 33 identified volatile components were listed from tuna of different treatments. The differences of volatile compounds in fresh and stored samples were obviously observed. Furthermore, there was a high correlation between the E-nose and GC-IMS results. The results confirm the potential applications of E-nose and GC-IMS in studying the influence of CP on tuna sashimi. Follow-up studies are still needed to explore changes in protein and micro structure in the process of cold plasma treatment.

Author Contributions

W.P.: Investigation, Methodology, Formal analysis, Data curation, Writing—original draft. S.B., C.S. and A.G.: Validation, Writing—review & editing. X.Y. and L.M.: Conceptualization, Project administration, Supervision, Writing—review & editing. X.W. and J.Y.: Supervision, Validation. S.D.: Validation, Writing—review & editing. All authors have read and agreed to the published version of the manuscript.

Funding

This work was financed by the National Natural Science Foundation of China (Project No. 32072291).

Institutional Review Board Statement

All fish and aquatic gave their informed consent for inclusion before they participated in the study. The study was conducted in accordance with the Declaration of Helsinki, and the protocol was approved by the Ethics Committee of the animal production license No. of Zhejiang animal ethics committee: SYXK (Zhejiang) 2021-0025, Meat quality certificate of Food Co., Ltd.: 30000490535 approved for use.

Data Availability Statement

The data that support the findings of this study are available from the corresponding author upon reasonable request.

Acknowledgments

We would like to thank the Key Laboratory of Seafood Health Risk Factors of Zhejiang Ocean University for providing the scientific research platform.

Conflicts of Interest

There is no conflict of interest in this work by any of the authors.

References

  1. Yao, L.; Lu, J.P.; Qu, M.; Jiang, Y.H.; Li, F.L.; Guo, Y.Y.; Wang, L.Z.; Zhai, Y.X. Methodology and application of PCR-RFLP for species identification in tuna sashimi. Food Sci. Nutr. 2020, 8, 3138–3146. [Google Scholar] [CrossRef] [PubMed]
  2. Wang, X.Y.; Xie, J. Evaluation of water dynamics and protein changes in bigeye tuna (Thunnus obesus) during cold storage. LWT-Food Sci. Technol. 2019, 108, 289–296. [Google Scholar] [CrossRef]
  3. Edirisinghe, R.K.B.; Graham, A.J.; Taylor, S.J. Characterisation of the volatiles of yellowfin tuna (Thunnus albacares) during storage by solid phase microextraction and GC-MS and their relationship to fish quality parameters. Int. J. Food Sci. Technol. 2007, 42, 1139–1147. [Google Scholar] [CrossRef]
  4. Singh, A.; Benjakul, S.; Zhou, P.; Zhang, B.; Deng, S.G. Effect of squid pen chitooligosaccharide and epigallocatechin gallate on discoloration and shelf-life of yellowfin tuna slices during refrigerated storage. Food Chem. 2021, 351, 129296. [Google Scholar] [CrossRef] [PubMed]
  5. Mentana, A.; Conte, A.; Del Nobile, M.A.; Quinto, M.; Centonze, D. Investigating the effects of mild preservation technology on perishable foods by volatolomics: The case study of ready-to-cook tuna-burgers. LWT-Food Sci. Technol. 2019, 115, 108425. [Google Scholar] [CrossRef]
  6. Jiang, W.; Hu, S.W.; Li, S.J.; Liu, Y. Evaluation of the preservation effect of gelatin-water soluble chitosan film incorporated with maillard peptides on bluefin tuna (Thunnus thynnus) slices packaging. LWT-Food Sci. Technol. 2019, 113, 108294. [Google Scholar] [CrossRef]
  7. Wang, X.Y.; Xie, J.; Chen, X.J. Differences in lipid composition of Bigeye tuna (Thunnus obesus) during storage at 0 °C and 4 °C. Food Res. Int. 2021, 143, 110233. [Google Scholar] [CrossRef] [PubMed]
  8. Echeverria, I.; Lopez-Caballero, M.E.; Gomez-Guillen, M.C.; Mauri, A.N.; Montero, M.P. Active nanocomposite films based on soy proteins-montmorillonite- clove essential oil for the preservation of refrigerated bluefin tuna (Thunnus thynnus) fillets. Int. J. Food Microbiol. 2018, 266, 142–149. [Google Scholar] [CrossRef] [PubMed]
  9. Perez-Andres, J.M.; de Alba, M.; Harrison, S.M.; Brunton, N.P.; Cullen, P.J.; Tiwari, B.K. Effects of cold atmospheric plasma on mackerel lipid and protein oxidation during storage. LWT-Food Sci. Technol. 2020, 118, 108697. [Google Scholar] [CrossRef]
  10. Koddy, J.K.; Miao, W.H.; Hatab, S.; Tang, L.L.; Xu, H.Q.; Nyaisaba, B.M.; Chen, M.L.; Deng, S.G. Understanding the role of atmospheric cold plasma (ACP) in maintaining the quality of hairtail (Trichiurus lepturus). Food Chem. 2021, 343, 128418. [Google Scholar] [CrossRef]
  11. Barbhuiya, R.I.; Singha, P.; Singh, S.K. A comprehensive review on impact of non-thermal processing on the structural changes of food components. Food Res. Int. 2021, 149, 110647. [Google Scholar] [CrossRef] [PubMed]
  12. Liao, X.Y.; Su, Y.; Liu, D.H.; Chen, S.G.; Hu, Y.Q.; Ye, X.Q.; Wang, J.; Ding, T. Application of atmospheric cold plasma-activated water (PAW) ice for preservation of shrimps (Metapenaeus ensis). Food Control 2018, 94, 307–314. [Google Scholar] [CrossRef]
  13. Sruthi, N.U.; Josna, K.; Pandiselvam, R.; Kothakota, A.; Gavahian, M.; Khaneghah, A.M. Impacts of cold plasma treatment on physicochemical, functional, bioactive, textural, and sensory attributes of food: A comprehensive review. Food Chem. 2022, 368, 130809. [Google Scholar] [CrossRef] [PubMed]
  14. Zhang, Y.X.; Wei, J.P.; Yuan, Y.H.; Chen, H.; Dai, L.; Wang, X.; Yue, T.L. Bactericidal effect of cold plasma on microbiota of commercial fish balls. Innov. Food Sci. Emerg. 2019, 52, 394–405. [Google Scholar] [CrossRef]
  15. Ziuzina, D.; Patil, S.; Cullen, P.J.; Keener, K.M.; Bourke, P. Atmospheric cold plasma inactivation of Escherichia coli in liquid media inside a sealed package. J. Appl. Microbiol. 2013, 114, 778–787. [Google Scholar] [CrossRef]
  16. Nyaisaba, B.M.; Miao, W.H.; Hatab, S.; Siloam, A.; Chen, M.L.; Deng, S.G. Effects of cold atmospheric plasma on squid proteases and gel properties of protein concentrate from squid (Argentinus ilex) mantle. Food Chem. 2019, 291, 68–76. [Google Scholar] [CrossRef] [PubMed]
  17. Gu, S.; Chen, W.; Wang, Z.H.; Wang, J.; Huo, Y.J. Rapid detection of Aspergillus spp. infection levels on milled rice by headspace-gas chromatography ion-mobility spectrometry (HS-GC-IMS) and E-nose. LWT-Food Sci. Technol. 2020, 132, 109758. [Google Scholar] [CrossRef]
  18. Wang, S.Q.; Chen, H.T.; Sun, B.G. Recent progress in food flavor analysis using gas chromatography-ion mobility spectrometry (GC-IMS). Food Chem. 2020, 315, 126158. [Google Scholar] [CrossRef]
  19. Li, M.Q.; Du, H.T.; Lin, S.Y. Flavor Changes of Tricholoma matsutake Singer under Different Processing Conditions by Using HS-GC-IMS. Foods 2021, 10, 531. [Google Scholar] [CrossRef]
  20. Lv, W.S.; Lin, T.; Ren, Z.Y.; Jiang, Y.Q.; Zhang, J.; Bi, F.J.; Gu, L.H.; Hou, H.C.; He, J.N. Rapid discrimination of Citrus reticulata ‘Chachi’ by headspace-gas chromatography-ion mobility spectrometry fingerprints combined with principal component analysis. Food Res. Int. 2020, 131, 108985. [Google Scholar] [CrossRef]
  21. Liu, D.Y.; Bai, L.; Feng, X.; Chen, Y.P.; Zhang, D.N.; Yao, W.S.; Zhang, H.; Chen, G.L.; Liu, Y. Characterization of Jinhua ham aroma profiles in specific to aging time by gas chromatography-ion mobility spectrometry (GC-IMS). Meat Sci. 2020, 168, 108178. [Google Scholar] [CrossRef] [PubMed]
  22. Wang, F.; Gao, Y.Q.; Wang, H.B.; Xi, B.; He, X.N.; Yang, X.L.; Li, W.H. Analysis of volatile compounds and flavor fingerprint in Jingyuan lamb of different ages using gas chromatography-ion mobility spectrometry (GC-IMS). Meat Sci. 2021, 175, 108449. [Google Scholar] [CrossRef]
  23. Guo, S.; Zhao, X.Y.; Ma, Y.; Wang, Y.B.; Wang, D. Fingerprints and changes analysis of volatile compounds in fresh-cut yam during yellowing process by using HS-GC-IMS. Food Chem. 2022, 369, 130939. [Google Scholar] [CrossRef] [PubMed]
  24. Arroyo-Manzanares, N.; Martin-Gomez, A.; Jurado-Campos, N.; Garrido-Delgado, R.; Arce, C.; Arce, L. Target vs spectral fingerprint data analysis of Iberian ham samples for avoiding labelling fraud using headspace—Gas chromatography-ion mobility spectrometry. Food Chem. 2018, 246, 65–73. [Google Scholar] [CrossRef] [PubMed]
  25. Pankaj, S.K.; Misra, N.N.; Cullen, P.J. Kinetics of tomato peroxidase inactivation by atmospheric pressure cold plasma based on dielectric barrier discharge. Innov. Food Sci. Emerg. 2013, 19, 153–157. [Google Scholar] [CrossRef] [Green Version]
  26. Wen, R.X.; Kong, B.H.; Yin, X.Y.; Zhang, H.; Chen, Q. Characterisation of flavour profile of beef jerky inoculated with different autochthonous lactic acid bacteria using electronic nose and gas chromatography-ion mobility spectrometry. Meat Sci. 2022, 183, 108658. [Google Scholar] [CrossRef]
  27. Zhang, Q.; Ding, Y.C.; Gu, S.Q.; Zhu, S.C.; Zhou, X.X.; Ding, Y.T. Identification of changes in volatile compounds in dry-cured fish during storage using HS-GC-IMS. Food Res. Int. 2020, 137, 109339. [Google Scholar] [CrossRef]
  28. Chen, J.; Wang, S.Z.; Chen, J.Y.; Chen, D.Z.; Deng, S.G.; Xu, B. Effect of cold plasma on maintaining the quality of chub mackerel (Scomber japonicus): Biochemical and sensory attributes. J. Sci. Food Agric. 2019, 99, 39–46. [Google Scholar] [CrossRef] [PubMed] [Green Version]
  29. Chutia, H.; Mahanta, C.L.; Ojah, N.; Choudhury, A.J. Fuzzy logic approach for optimization of blended beverage of cold plasma treated TCW and orange juice. J. Food Meas. Charact. 2020, 14, 1926–1938. [Google Scholar] [CrossRef]
  30. Chen, X.A.; Chen, H.Q.; Xiao, J.; Liu, J.Y.; Tang, N.; Zhou, A.M. Variations of volatile flavour compounds in finger citron (Citrus medico L. var. sarcodactylis) pickling process revealed by E-nose, HS-SPME-GC-MS and HS-GC-IMS. Food Res. Int. 2020, 138, 109717. [Google Scholar] [CrossRef] [PubMed]
  31. Guney, S.; Atasoy, A. Study of fish species discrimination via electronic nose. Comput. Electron. Agric. 2015, 119, 83–91. [Google Scholar] [CrossRef]
  32. Wu, Z.B.; Chen, L.Z.; Wu, L.M.; Xue, X.F.; Zhao, J.; Li, Y.; Ye, Z.H.; Lin, G.H. Classification of Chinese Honeys According to Their Floral Origins Using Elemental and Stable Isotopic Compositions. J. Agric. Food Chem. 2015, 63, 5388–5394. [Google Scholar] [CrossRef]
  33. Li, M.Q.; Yang, R.W.; Zhang, H.; Wang, S.L.; Chen, D.; Lin, S.Y. Development of a flavor fingerprint by HS-GC-IMS with PCA for volatile compounds of Tricholoma matsutake Singer. Food Chem. 2019, 290, 32–39. [Google Scholar] [CrossRef] [PubMed]
  34. Zhang, Y.Q.; Ma, X.T.; Dai, Z.Y. Comparison of nonvolatile and volatile compounds in raw, cooked, and canned yellowfin tuna (Thunnus albacores). J. Food Process. Preserv. 2019, 43, 14111. [Google Scholar] [CrossRef]
  35. Lantsuzskaya, E.V.; Krisilov, A.V.; Levina, A.M. Structure of the cluster ions of ketones in the gas phase according to ion mobility spectrometry and ab initio calculations. Russ. J. Phys. Chem. A 2015, 89, 1838–1842. [Google Scholar] [CrossRef]
  36. Ma, W.B.; Zhao, L.L.; Zhao, W.H.; Xie, Y.L. (E)-2-Hexenal, as a Potential Natural Antifungal Compound, Inhibits Aspergillus flavus Spore Germination by Disrupting Mitochondria! Energy Metabolism. J. Agric. Food Chem. 2019, 67, 1138–1145. [Google Scholar] [CrossRef]
  37. Mansur, M.A.; Bhadra, A.; Takamura, H.; Matoba, T. Volatile flavor compounds of some sea fish and prawn species. Fish. Sci. 2003, 69, 864–866. [Google Scholar] [CrossRef] [Green Version]
Figure 1. Radar chart of sensory scores for the quality attributes of tuna samples.
Fishes 07 00013 g001
Figure 2. PCA analysis of E-nose.
Fishes 07 00013 g002
Figure 3. PCA analysis of GC-IMS.
Fishes 07 00013 g003
Figure 4. 2D topographic plots of volatile compounds in tuna samples.
Fishes 07 00013 g004
Figure 5. Gallery plot of tuna samples with different treatments.
Fishes 07 00013 g005
Table 1. Performance description of electronic nose sensors.
SensorsPerformance Description
W1CSensitive to aromatic compounds
W3CSensitive to ammonia and aromatic compounds
W5CSensitive to short chain alkanes and aromatic compounds
W1WSensitive to sulfides, pyrazine and many terpenes
W2WSensitive to organic sulfides and aromatic compounds
W5SSensitive to nitrogen oxides
W6SSensitive to hydrides
W1SSensitive to methyl
W2SSensitive to alcohols, aldehydes, and ketones
W3SSensitive to long chain alkanes
Table 2. Experimental conditions for tuna analysis by GC-IMS.
Gas Phase-Ion Mobility Spectrometry Unit
Analysis time30 min
Column typeMXT-5, 15 m ID: 0.53 mm
Column temperature60 °C
Carrier gas/drift gasN2
IMS temperature45 °C
Automatic headspace sampling unit
Injection volume500 µL
Incubation time20 min
Incubation temperature40 °C
Syringe temperature85 °C
Incubation speed500 rpm
Table 3. Volatile compounds in tuna samples with different treatments by GC-IMS.
VolatilesNO.CompoundsMolecule FormulaMWRIRTDTA1A2A3
Aldehydes1OctanalC8H16O128.21008.5574.91.40242.30 ± 9.37 a292.57 ± 9.66 b262.32 ± 9.99 a
2n-NonanalC9H18O142.21105.9769.11.4798.43 ± 6.63 a92.84 ± 15.21 a115.20 ± 13.69 a
3HeptanalC7H14O114.2898.6379.31.33381.89 ± 9.34 a853.53 ± 17.90 c668.30 ± 33.38 b
4(E)-2-Hexenal (M)C6H10O98.1848.1319.61.18478.76 ± 10.22 a526.12 ± 54.10 ab612.68 ± 28.24 b
5(E)-2-Hexenal (D)C6H10O98.1846.1317.41.5244.69 ± 1.90 a62.09 ± 11.52 ab82.38 ± 9.54 b
6Hexanal (M)C6H12O100.2790.7256.51.262185.48 ± 10.93 b1341.92 ± 30.33 a1366.16 ± 33.54 a
7Hexanal (D)C6H12O100.2791.2257.01.572418.50 ± 38.18 b710.15 ± 52.44 a770.79 ± 37.70 a
8ButanalC4H8O72.1593.9133.21.29173.40 ± 2.08 a1090.53 ± 2.44 c1021.82 ± 36.86 b
9AcetoneC3H6O58.1526.8104.41.122109.28 ± 7.14 a3469.11 ± 24.91 c2940.57 ± 97.37 b
Alcohols11-Octen-3-OlC8H16O128.2989.1538.01.17175.64 ± 2.38 a588.33 ± 19.68 c373.22 ± 13.03 b
21-HeptanolC7H16O116.2987.9535.91.39229.51 ± 9.39 b213.90 ± 20.29 b161.50 ± 9.10 a
31-Hexanol (M)C6H14O102.2878.3352.81.32341.37 ± 10.93 a1950.79 ± 2.79 c1377.23 ± 83.74 b
41-Hexanol (D)C6H14O102.2875.4349.61.6455.05 ± 5.04 a363.08 ± 3.30 c205.43 ± 19.24 b
51-Pentanol (M)C5H12O88.1769.1237.41.25376.08 ± 9.65 a950.04 ± 8.02 c741.16 ± 12.24 b
61-Pentanol (D)C5H12O88.1767.1235.91.5238.37 ± 0.57 a226.75 ± 4.15 c173.86 ± 7.76 b
7(E)-2-Pentenal (M)C5H8O84.1748.7221.21.11625.63 ± 24.94 a1092.38 ± 55.14 c922.54 ± 38.29 b
8(E)-2-Pentenal (D)C5H8O84.1747.3220.21.37153.78 ± 17.48 a643.34 ± 102.61 b1175.35 ± 30.79 c
91-ButanolC4H10O74.1663.2162.91.18392.71 ± 3.27 a746.14 ± 16.35 b872.89 ± 12.33 c
101-PropanolC3H8O60.1559.0118.21.25202.33 ± 3.99 a4201.47 ± 68.91 b4323.25 ± 88.08 b
112-Methyl-1-PropanolC4H10O74.1630.0148.61.1758.16 ± 7.29 a146.24 ± 12.57 b321.42 ± 21.65 c
12EthanolC2H6O46.1503.894.61.05654.27 ± 31.83 a1059.45 ± 33.20 b1080.72 ± 23.32 b
Ketones12-HeptanoneC7H14O114.2896.1374.91.2795.28 ± 5.16 a192.99 ± 7.40 b197.72 ± 3.29 b
23-Pentanone (M)C5H10O86.1698.1181.21.11301.77 ± 7.06 a718.66 ± 33.71 c567.94 ± 62.88 b
33-Pentanone (D)C5H10O86.1700.4183.11.361387.22 ± 11.34 a6597.84 ± 198.96 c4507.08 ± 91.28 b
4PropanalC3H6O58.1534.2107.61.15695.84 ± 24.76 b236.59 ± 14.24 a222.34 ± 2.95 a
5Ethyl Acetate (M)C4H8O288.1609.4139.81.11343.31 ± 21.21 a1669.06 ± 10.68 b1680.67 ± 17.23 b
6Ethyl Acetate (D)C4H8O288.1604.1137.51.3565.06 ± 9.10 a2034.90 ± 86.56 c1571.02 ± 77.22 b
72-ButanoneC4H8O72.1582.8128.41.251150.52 ± 14.91 a3720.99 ± 44.79 b3876.60 ± 34.83 c
Esters1Ethyl ButanoateC6H12O2116.2791.9257.81.2069.93 ± 4.93 a96.76 ± 1.55 c86.19 ± 4.67 b
2Propyl Acetate (M)C5H10O2102.1707.0188.31.1694.74 ± 2.61 a345.18 ± 32.58 b341.80 ± 18.35 b
3Propyl Acetate (D)C5H10O2102.1706.7188.11.4845.87 ± 4.33 a280.11 ± 41.26 b339.25 ± 19.17 b
4Acetoin (M)C4H8O288.1721.5199.71.05690.26 ± 11.80 a1133.95 ± 191.34 b3322.60 ± 74.83 c
5Acetoin (D)C4H8O288.1723.8201.61.3391.65 ± 3.73 a511.60 ± 153.36 b2553.62 ± 100.37 c
M: monomer, D: dimer; MW: Represents the molecular weight of the volatile compounds. RI: Represents the retention indexes of the volatile compounds in the GC column. RT: Represents the retention time in the capillary GC column. DT: Represents the drift time in the drift tube. A different letter represents that there is a significant difference between data.
Publisher’s Note: MDPI stays neutral with regard to jurisdictional claims in published maps and institutional affiliations.

