
The Fishery Value Chain Analysis in Taiwan


1
Center for Marine Affairs Studies, National Kaohsiung University of Science and Technology, Kaohsiung 811213, Taiwan
2
Department of Applied Economics, National Chiayi University, Chiayi 600355, Taiwan
3
Institute of Marine Affairs and Business Management, National Kaohsiung University of Science and Technology, Kaohsiung 811213, Taiwan
*
Author to whom correspondence should be addressed.
Fishes 2022, 7(3), 114; https://doi.org/10.3390/fishes7030114
Submission received: 14 April 2022
/
Revised: 11 May 2022
/
Accepted: 13 May 2022
/
Published: 16 May 2022
(This article belongs to the Special Issue Synergistic Effects of Hydroclimate and Fisheries)
Abstract
:Although the GDP of the fishery sector accounts for less than 0.3% of Taiwan’s GDP, there are many secondary and tertiary industries related to fisheries that add great value to the country’s economy. Therefore, when analyzing and calculating the output value and value added of the fishery sector, the relevance of these upstream and downstream industries should be considered jointly, and the value chain of the fishery industry should be studied and analyzed in order to truly present the value added created by fishery. This study aims to do this by first analyzing not only the primary fishery industry, but the value chain of the fishery industry at different stages such as fishery production, marine fishing, aquaculture, fishery processing, retail and services, and supportive systems. Then the value added of the whole fishery value chain to Taiwan’s GDP is estimated by using the Leontief input–output model, from the perspective of industry linkages and covering the period from 2011 to 2018. The empirical results suggest that the value added created by fishery and related industries accounted for 2.96% of the GDP in 2011, which rose to 3.11% in 2014, fell to 2.87% in 2015, rose to 2.93% in 2017, and fell to 2.84% in 2018. From 2011 to 2018, the amount of value added created by fisheries and related industries rose from NT$ 422.8 billion to NT$ 520.9 billion. The primary fishery sector has the largest contribution, followed by the fishery input sector, and transportation and sale service sector, and the fishery product processing sector has the lowest contribution rate. The empirical results provide important implications and references to the policy makers.
1. Introduction
In the past 10 years, Taiwan’s fishery GDP accounted for 14% to 21% of all agriculture, forestry, fishery, and animal husbandry, which is higher than both animal husbandry and forestry. It is one of the country’s most important domestic agricultural industries. Even though both the shares of agriculture and fishery sector have been declining along with the structural transformation of Taiwan’s economy, the non-economic function of fishery is increasingly important in terms of food security and ecological balance. It cannot be replaced by other sectors such that the importance of fishery sector cannot be measured only by its production value [1,2,3,4,5].
The idea of “sixth industrialization” proposed by Imamura in 1998 [6] states that jointly utilizing agriculture, food processing, and retail to create new products and services would increase their consumptions and value added, where the primary agricultural production is the basis of the “sixth level”. That is, the additional value will not be realized if the economy only meets the needs of industrialization to the exclusion of the primary agricultural production. The same idea is also applicable to the fishery sector and its related industries.
For the development of Taiwan’s fishery sector, the conventional perspective on the evaluation of the primary fishery sector may need to extend to the notion of the value chain system. Porter (1985) [7] believes that any industrial value chain is composed of a series of value activities, and the industrial value chain is a huge value system. The industrial value chain includes upstream suppliers as well as the marketing channels and final consumers that complete the value chain activities downstream. There are many related secondary and tertiary industries, ranging from upstream feed, agricultural and fishing machinery, fishing boats, etc., to downstream food processing, freezing, transportation, warehousing, sales, insurance, catering, and even marine leisure and yacht industries. Therefore, when calculating the output value and value added of the fishery sector, the relevance of these upstream and downstream industries should be considered jointly, so that the value chain of the fishery industry can be accurately analyzed and the value added created by the fishery can be truly presented.
Based on the viewpoint mentioned above, the techniques of I-O analyses have been also widely applied to various fields, such as agriculture (e.g., [8,9]) and many other industries (e.g., [10,11,12]), emphasizing the linkages between related industries and positions of sectors in the overall economic development. Current studies utilizing I-O techniques to fisheries mainly focus on either the national-level contribution of fish production (e.g., [13,14,15]) or inter-regional (country) linkages between different regions (e.g., [16,17]). To the best of our knowledge, rare studies conduct Taiwan’s fishery value chain analyses along with the national-level contribution of fishery production. This study adopts the demand-driven input–output model to Taiwan’s fishery data and contributes Taiwan’s case to the literature of the national-level analyses.
Although the share of primary fishery sector in the overall economy has fallen over the years in Taiwan, the interdependence between other sectors might not be as trivial as most people recognize [18,19]. Thus, the research content of this study is as follows. The first objective is to analyze the value chain of the fishery industry in different stages of fishery production, marine fishing, aquaculture, fish processing, retail and services, and supportive activities. Second, the research calculates the contribution of fishery and related industries to Taiwan GDP. Through the value chain and input–output analysis, this study aims to illustrate the extending influence of primary fishery sector in Taiwan’s GDP from a broader perspective.
In addition to the introduction, conclusions, and remarks, this study is divided into four sections. The second is the analysis of the value chain of Taiwan’s fishery industry; the third is the specification of methodology; the fourth is the specification of data processing; the fifth is demonstration of the empirical results for the linkage effects and the estimations of the contributions of the final demands to GDP.
2. The Value Chain of Taiwan’s Fishery Industry
The value chain was proposed by Michael Porter (1985) in his book “The value chain and competitive advantage” [7]. In this book, Porter pointed out that if a company wants to develop its unique competitive advantages, or create higher value added for shareholders, the strategy is to examine the business model of an enterprise and decompose the model into a series of value creation processes. The connection of this process is what is called the value chain (Figure 1).
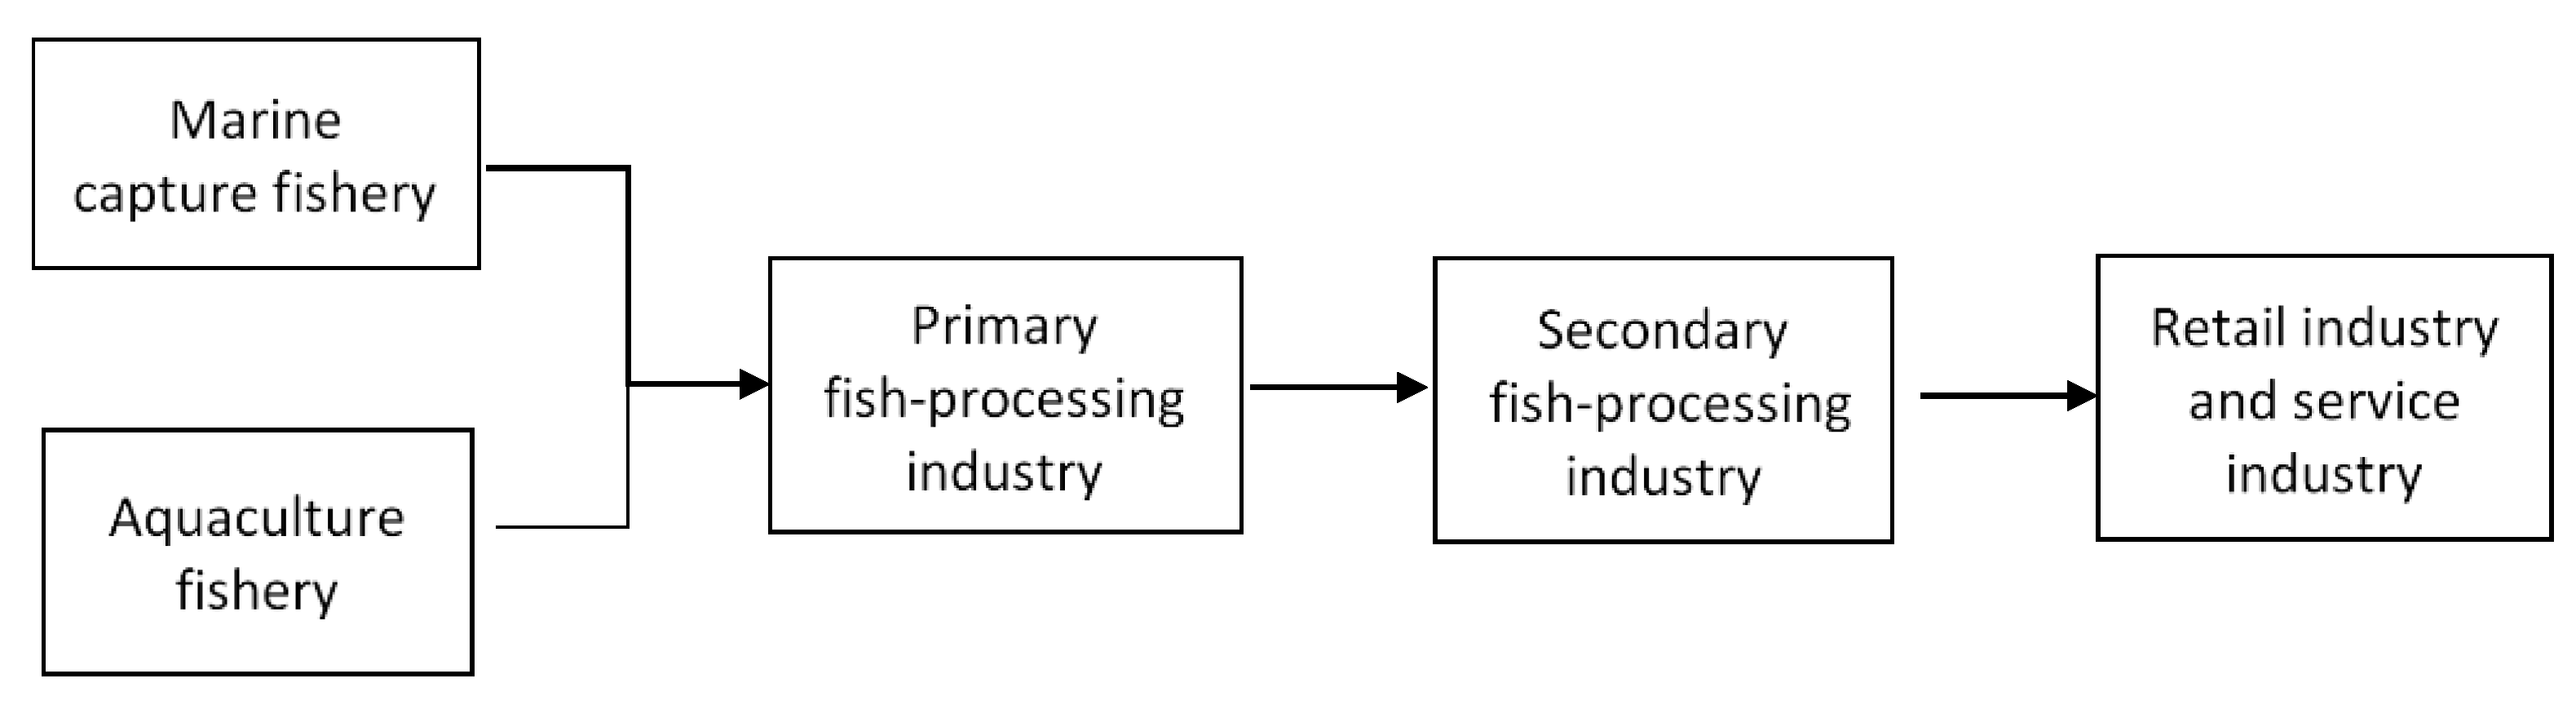
The common value chain of enterprises is typically divided into primary activities and supporting activities. The former is the company’s main production and sales procedures, including: inbound logistics, manufacturing operations, outbound logistics, marketing, and after-sales services, etc. The support activities can be regarded as other business operation links of a company supporting main business activities, or so-called joint operation links, including enterprise infrastructure, human resource management, technological development and procurement, etc. The value chain described above is considered from the perspective of individual companies. However, the industrial loops in which different companies are connected, such as the supplier value chain, firm value chain, channel value chains, and buyer value chains (Figure 1), become the value system or industry chain. Within the fishery industry, the value chain system mainly includes primary production of marine capture fishery, aquaculture fishery, primary aquatic product processing, secondary aquatic product processing, and tertiary industrial retail and service industries (Figure 2). See the figures below:
2.1. Marine Capture Fisheries
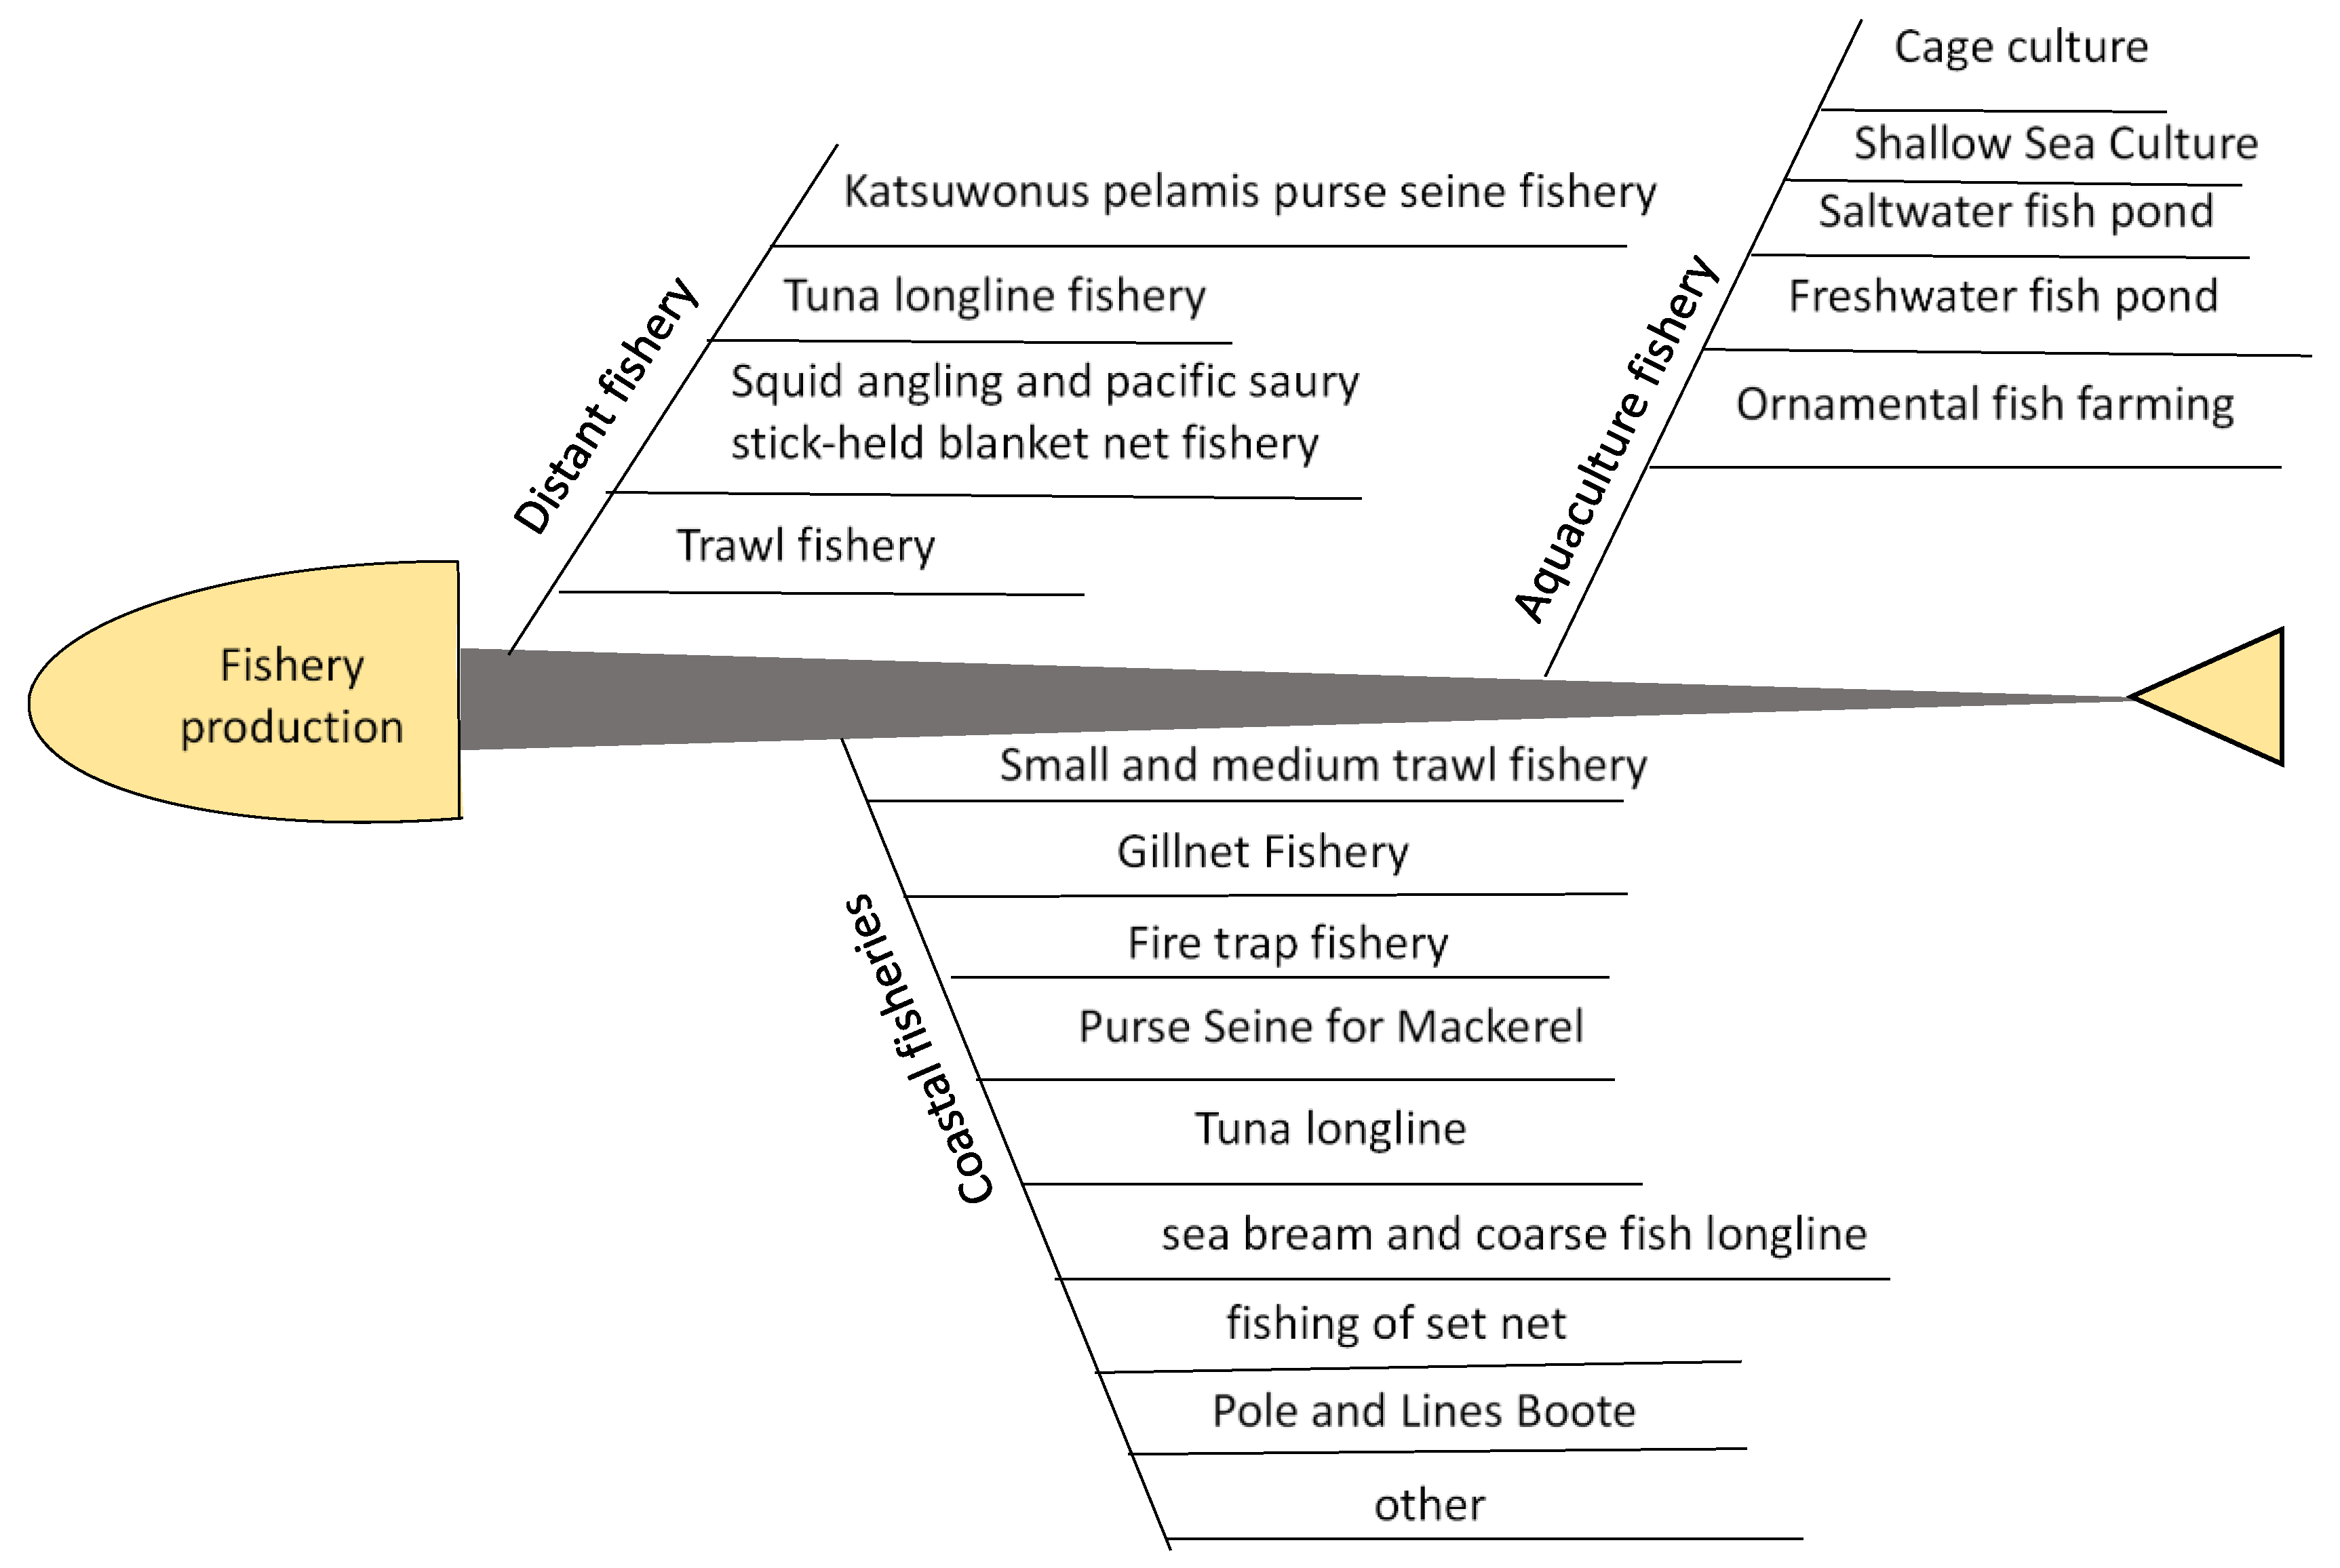
Marine capture fisheries can be roughly divided into pelagic (or, distant) fisheries and coastal fisheries. The pelagic fisheries equipment mainly consists of bonito and tuna seine, tuna longline, squid and saury stick nets, and trawl nets. Coastal fisheries include fire traps, small and medium trawls, tuna purses, gill nets, mackerel seines, longline fishing for sea bream and trash fish, fixed nets, one fishing, etc. (Figure 3).
2.2. Aquatic Products Processing Industry
Aquatic products processing can be divided into primary processing and secondary processing. Primary processing is mainly the processing of aquatic food products, and secondary processing includes the processing of aquatic food products, aquatic industrial products, aquatic agricultural products, and aquatic medicinal products (Figure 4). This section mainly discusses the distribution and operating status of Taiwan’s aquatic product processing plants based on the statistical data of the Fisheries Annual Report. The data analyze the current status of certification and implementation of the aquatic product processing industry, as well as the import and export status of aquatic product trade. The so-called “aquatic product processing industry” in this study includes fish, shrimp, crab, crustaceans, and other aquatic food processing and processing industries, including canning, freezing, processing, etc.
2.3. Retail Industry and Service Industry
The retail and service industries mainly include storage and transportation, marketing, after-sales service, and recreational fisheries (Figure 5). At present, due to the lack of domestic information on storage and transportation, after-sales service, and some marketing, only aquatic product trade and recreational fisheries are described as follows:
2.4. Support Activities
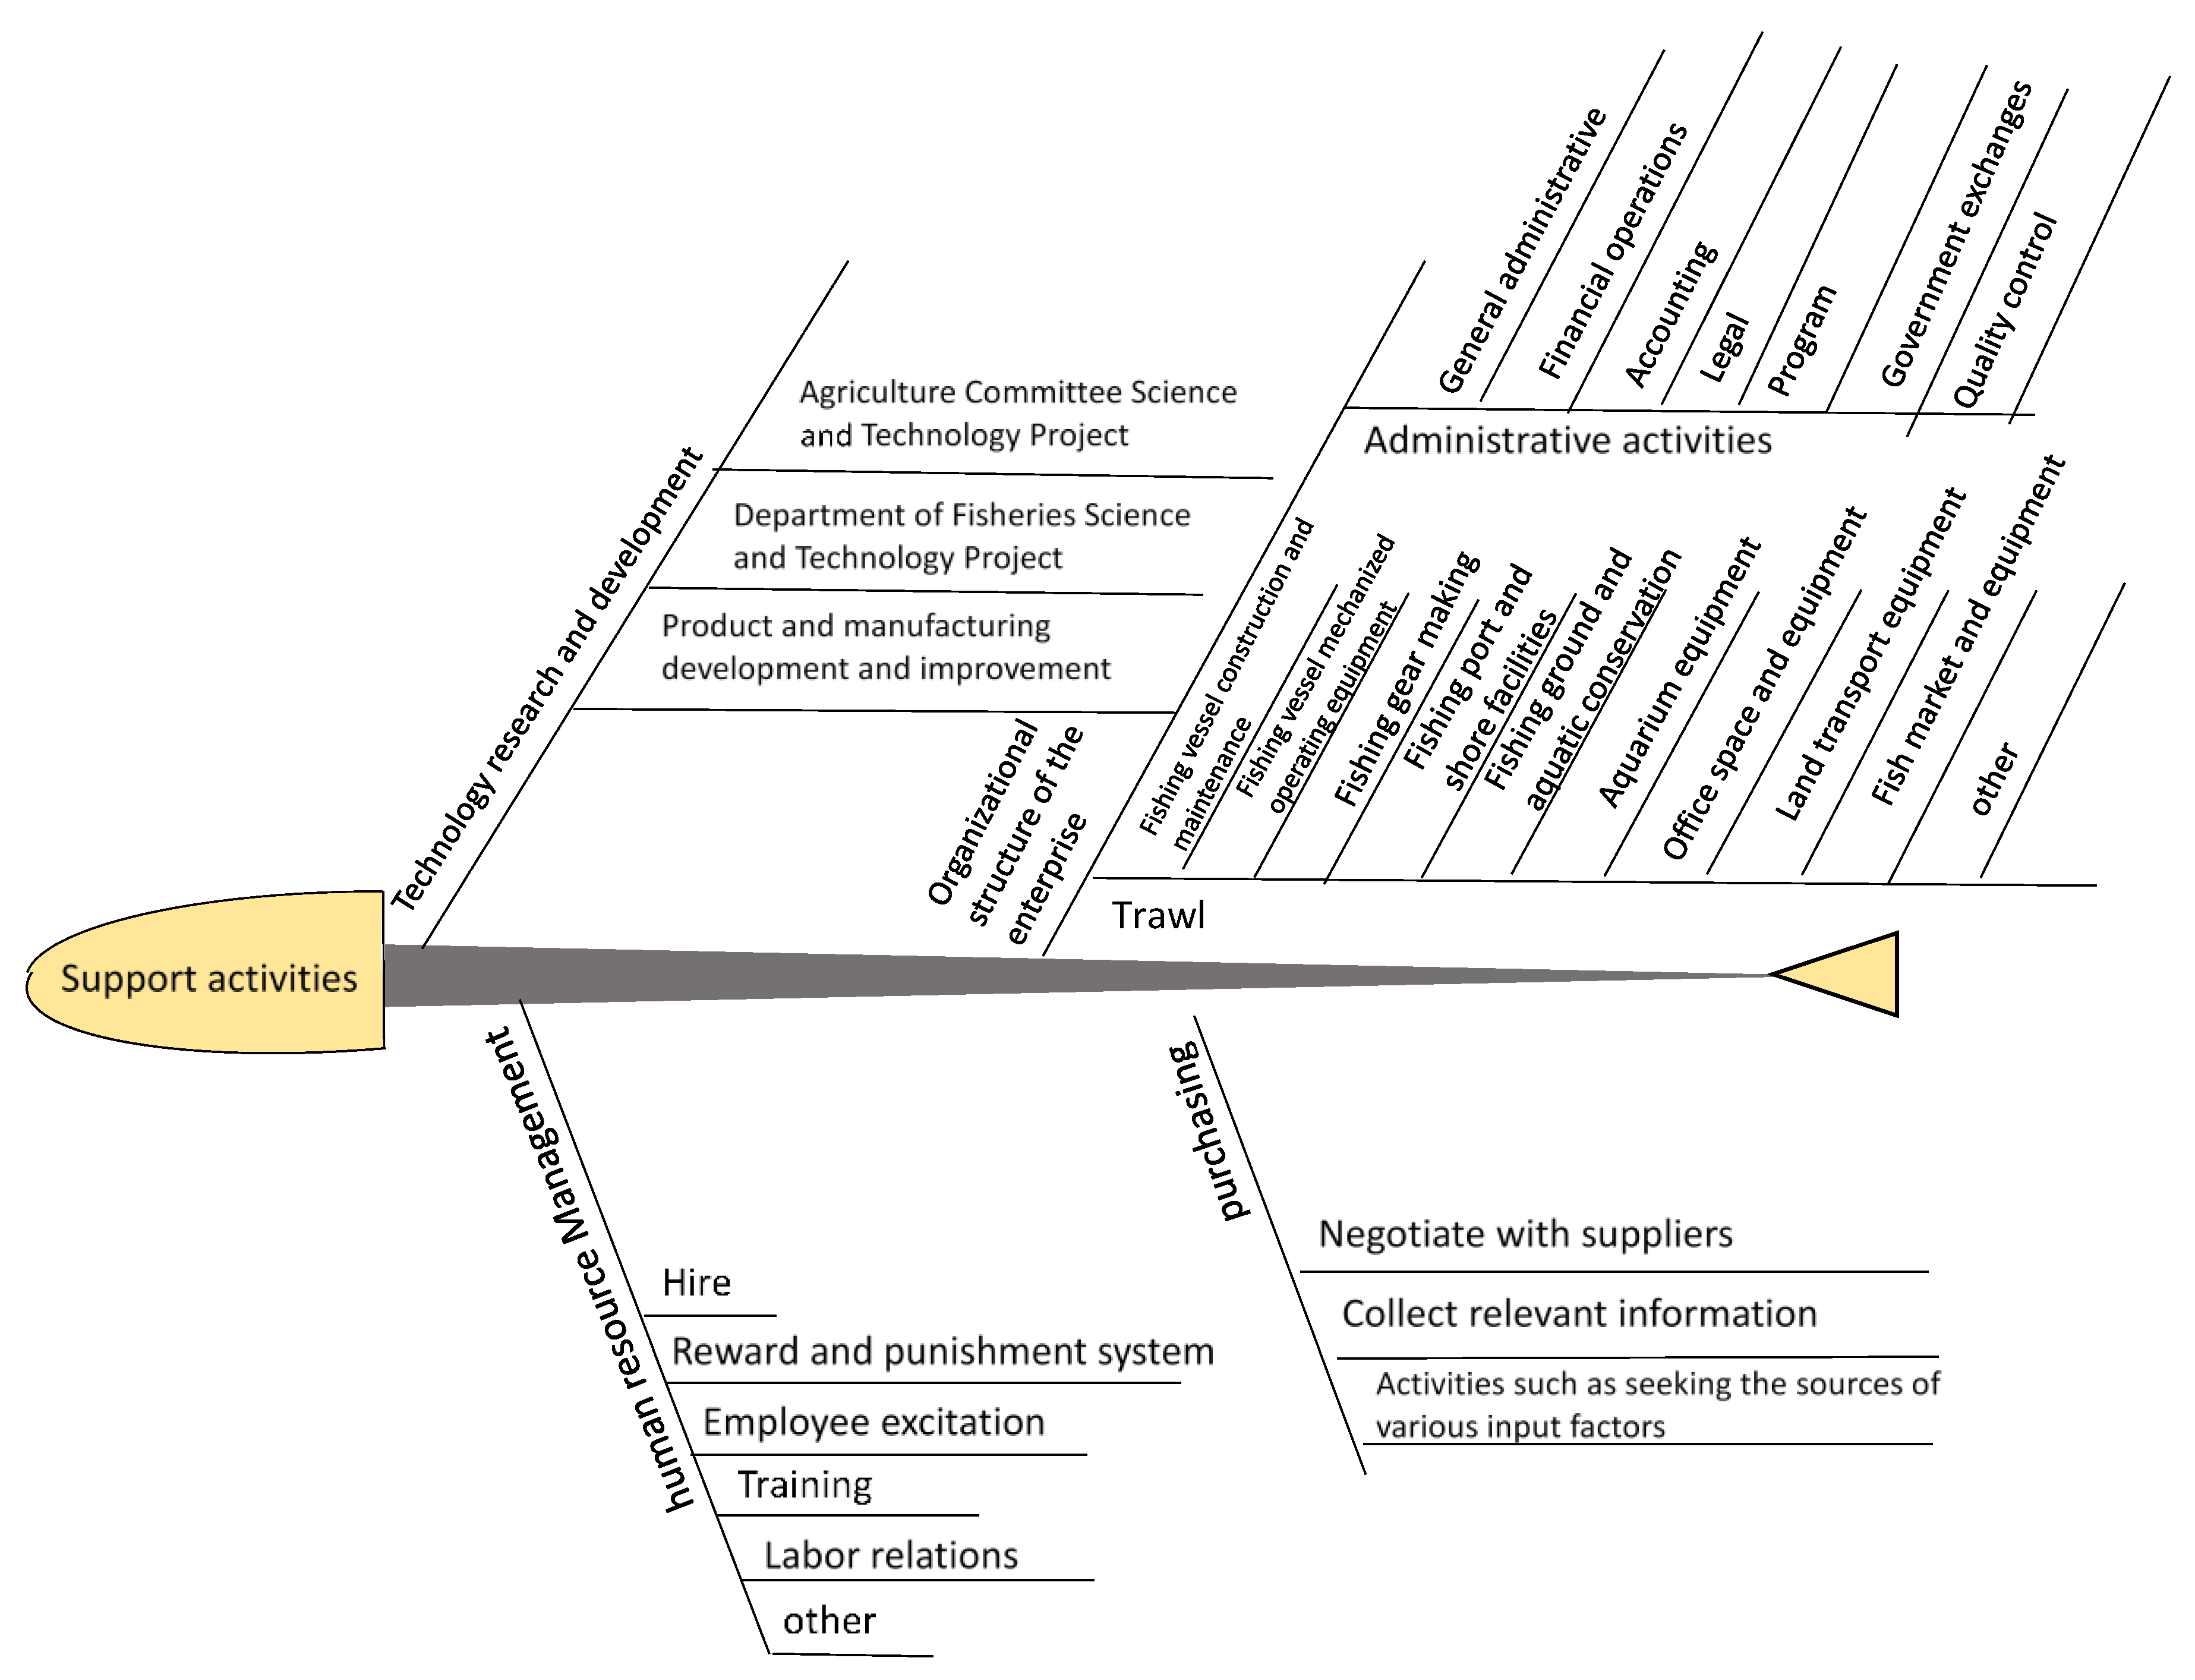
Support activities can be regarded as the operating environment of other enterprises which support the main operating activities of an enterprise, or what is known as the joint operation link. Support activities include procurement (activities to obtain various input factors, including negotiating with suppliers, collecting relevant information, and seeking sources of various input factors), technology research and development (products and process development and improvement activities), human resource management (personnel recruitment, hiring, training, development and welfare allowances, and other management activities), the basic facilities of the enterprise (office software and hardware, fishing boats, fishing gear, fishing ports, and related facilities), and administrative categories (including general administrative affairs, planning operations, financial operations, accounting operations, legal activities, quality management, and government exchanges and official affairs, etc.) (Figure 6).
2.5. Analysis of Fishery Value Chain
2.5.1. Marine Capture Fisheries
Fishers along the coastal waters have five sales channels after catching: (1) independent sales, that is, they are also fishmongers; (2) selling to retailers; (3) fisheries agencies for either: auction, or to be purchased and sold in fisheries agencies’ exhibition and sales centers or supermarkets; (4) purchased by large-scale merchants, and then processed or resold to mid-market merchants, retailers, processors or exporters; and (5) enter the dry goods market (Figure 7).
Most fishers sell their catch to large-scale merchants, and only a few choose to process independently, or enter the dry goods market. After the being sold to the large-scale business, the product will be resold to a mid-tier business, a processing industry, a retailer, or an exporter. The large market players may play multiple roles across the board. For example, Fong Chun Formosa Fishery Company, Ltd. (FCF) owns fishing boats for operations, while also soliciting business with other coastal fishers, and exporting product to Japan and other countries. The company also has its own processing plants for canned tuna manufacturing, and contracts with other processing plants as well. In addition, FCF also provides other coastal fisher’s supply services. The company’s business model is extensive, which is also the strategy of the current aquatic product trading company to diversify its operations in response to the impact of globalization.
2.5.2. Aquaculture
The aquaculture industry mainly includes three basic sectors: soft and hard equipment, aquatic products, and bait organisms and feed (Figure 7). The sectors are described as follows:
- Software and hardware equipment: Hardware equipment includes external machinery, equipment, peripheral facilities, etc., and software equipment includes internal consumables, fish disease medications, etc.;
- Aquatic products: Aquatic products include seed fish, fry, juvenile fish, etc. Aquatic products are not limited to the fish species, but also include shellfish, brackish water species, as well as imported ornamental and edible species;
- Bait organisms and feed: Bait organisms refer to the types of food that can be provided by living organisms which breed, while feed refers specifically to food processed and prepared by humans.
The above three items are necessary for operating aquaculture establishments. The aquatic products raised through farming sites can be sold through the following channels. Consumers may be either the domestic or foreign consumer markets:
- Direct sales to consumers: For example, (1) shallow aquaculture farmers raise oysters, which can be directly provided to customers for personal consumption by operating an offshore site, (2) farmed aquatic products can be directly sold to consumers through online platforms;
- Consignment in traditional markets: Farms can also sell their product in the fish market in person to reduce the low-price acquisition losses of small and medium-sized market players;
- Sales to professional fishmongers: Through the acquisition of small and medium-sized market players, the operation time is reduced, and the risk of hoarding is reduced. Generally, there are edible fish and ornamental fish. Ornamental fish are sold mainly in live fish markets, including the trading of fertilized eggs. Fish intended for consumption, are sold either in live fish markets, or sold in general markets after processing;
- Production cooperatives: At present, production cooperatives have been established by the fisher’s associations in various districts. Larger catches such as Wu Guo fish, eels, groupers, etc., can be sold through this channel. The sales channel even includes live eels for export to Japan;
- Edible fish market: Some reservoir farms provide on-site fishing and sale, and may include cooking, such as the famous Shimen live fish. Some farms in the south, when the fish are harvested, will sell their products at a location directly next to the fish farm to provide freshly harvested young fresh fish products to consumers.
The marine fishing and aquaculture fishery production of the primary industry have statistical data in the Fisheries Annual Reports. The aquatic products processing industry of the secondary industry lacks marine health food data in aquatic food products, and the aquatic products of leather products and fish glue, alginic acid, shell powder for aquatic agricultural products, insulin for aquatic medicinal products, and other biotech products have no clear statistical data sources. In the retail and service industries of the tertiary industry, the operation and storage of transportation and storage can be determined through the input-output tables estimates, and there is no information on the warehousing and after-sales service, and supermarkets, stores, vendors, fish direct sales centers, fish traders, fish wholesalers, export networks, and online shopping are all available through the industry. It can be estimated based on the correlation tables. The sightseeing fish market, fish direct sales center, and recreational fishery categories of whale watching, sea fishing, fishing port visits and recreation, fishing history, and folk customs celebrations can be estimated by the statistics of the Fishery Leisure Tourism Program of the Fisheries Department. In support activities, science and technology research and development types of agricultural committee science and technology plans, fisheries department science and technology plans, and human resources management types of administrative activities can be estimated by the relevant government investment amount, and the development of products and processes in the science and technology research and development category. Improvement projects and administrative activities of the corporate organization structure category can be estimated by the government’s relevant investment amount. There is some source of relevant information for the basic facilities of the enterprise include fishing vessel mechanized operation equipment, fishing gear manufacturing, fish farms and aquatic product conservation, land transportation equipment, fish market and its equipment, and others. There is some funding. However, there is no source of relevant information for the procurement and human resource management categories.
3. Methodology
This study adopts the demand-driven input–output model to Taiwan’s fishery data and aims to illustrate the linkages between related industries and positions of sectors in the overall economic development. Based on the demand-driven input–output model proposed by Miller and Blair [21], the input–output model can be expressed as follows:
where X is the total output vector; Z is the inter-industry transaction matrix (also known as the intermediate input or intermediate demand matrix); F is the final demand vector, including household consumption, private investment, government expenditure and net exports. Among them, the intermediate demands and final demands (excluding the imported part) can be further subdivided into the demand for domestic products (, ), and imported products (, ), so the Formula (1) can be rewritten as:
Among them, that is, the final demand imports of the intermediate demand imports are equal to the total imports, so the Formula (2) can be rewritten as:
Under the assumption of fixed coefficients in the input–output model, the technical relationship between input and output is fixed, that is:
Among them, is the domestic direct input coefficient, which represents the unit value of the production of the tertiary industry, and the domestic product of the tertiary industry must be used as the input ratio. From Equation (4), the following relations can be obtained:
where AD is the input coefficient matrix of domestic products, and its elements are . Substituting (5) into (3), we can get:
Derived as:
when it is a nonsingular matrix, it can be solved as follows:
where (I − AD)−1 is the domestic input–output interdependence coefficients matrix or Leontief’s inverse matrix.
Since the purpose of this study is to calculate the economic effects of the output value of the fishery industry and the related industries on the overall economy through the final demands and interdependence coefficients matrix of the fishery and related sectors, this article uses (I − AD)−1 to calculate the output and value added induced by the final demand of the domestic fishery and its related products in Taiwan. The basic formula for the calculation is:
GDP is the value added vector, representing the value added created by various direct and indirect final demands for the domestic fishery and related products. ‘’ is a diagonal matrix, and the elements of the diagonal are the ratios of value added embedded in unit output value (1 dollar) in the base year, for each sector in the input-output table. ‘’ represents the proportion of domestic products in the final demand of each sector in the input-output table in 2016 [22]. ‘m’ represents the difference in transportation and sales in the final demand of each sector in the input–output table in 2016. ‘’ is the matrix composed of the expenditures of each sector in the input–output table as a percentage of the total expenditures; is the expenditures of final demand for various types of domestic fishery and its related products.
In order to assess the economic benefits of Taiwan’s fishery and related industries, first, this study calculates the gross production expenditures (i.e., consumption, investment, export) of the domestic fishery-related industries. Secondly, the authors use the related output value calculated above and treat it as a direct impact, through the input–output model to evaluate the impacts of fishery-related expenditures on the direct and indirect output effects of the domestic upstream and downstream industries. Then this study uses the value added rate of each industrial sector to calculate the total GDP (gross domestic production) economic benefits.
4. Data Processing
This study refers to Lin and Zhang [23] using the industry correlation model to calculate the contribution of fishery and its related products to GDP. The final demand includes five major items: private consumption, government consumption, fixed capital formation, inventory changes, and output. Therefore, we must first define the scope of expenditure on Taiwan’s fishery-related peripheral products.
4.1. Private Consumption
Private consumption includes consumer usage of fresh or refrigerated fishery products, canned aquatic products, non-food supplies, feed, fish and shellfish, fishery leisure tourism, ornamental fish, etc. The private consumption is based on the extrapolation of production value, plus import value, and minus export value (see Table 1, Table 2, Table 3, Table 4, Table 5, Table 6 and Table 7).
4.2. Government Consumption
The government’s investment in fisheries is calculated based on the current accounts of the fisheries agency and its affiliated agencies from 2006 to 2018. Among them, the oil subsidy for fishing boats in 2006 has been moved from the capital account to the current account (see Table 8).
4.3. Fixed Capital Formation
In light of the fact that there are some doubts about the official statistics of fishery fixed capital formation in the past, the Planning Division of Fisheries Agency in 2013 specifically reviewed and clarified the problems in the official statistics of fishery fixed capital formation in 2012. The current status of official statistics on the formation of fixed capital in fisheries is constructed under the formation of agricultural fixed capital. The professional practice is planned and promoted by the Statistics Office of the Council of Agriculture, and the reporting data are handled by the related divisions. The Fisheries Agency’s reports include: fish farms expansion and aquatic product conservation, construction of fishing ports and equipment, fishing vessel construction and maintenance, fishing vessels’ mechanized operation equipment, additional fishing gear, land vehicles, other machinery and equipment, experimental research equipment, fish markets and necessary equipment, and intangible fixed assets. Most of the ten items listed above have been applied to the report as fixed assets. The statistical problem is whether the report is inaccurate due to the possibility of inapplicable items reported, or necessary items that have not been reported. Fisheries are subsidized by county and city governments, foundations, fishers’ associations, private fisheries associations, etc. each year, so it must be determined whether the part related to fixed capital formation is actually reported (and with great repetition), whether the subsidy funds are consistent with the reported funds, whether the private investment part is actually reported and how to control, and how to distinguish the subsidy funds into non-fixed capital formation funds and fixed capital formation funds. In addition, how is the fixed capital formation part of private investment calculated and reported, and what is the scope? Generally, farmers and fishers do not take the initiative to report to the Agriculture and Food Agency. As for the private investment of farmers, the number of farmers is uncertain, and there is no notification mechanism for the expansion of fish farms (investment) by farmers, nor do they actively notify.
The scope and calculation content of fishery fixed capital formation are as follows. The calculation of capital formation is based on the planned funds or the settlement amount of the subcontract, the funds are reported based on actual expenditures, not the budgetary funds or subcontract funds, and the private investment is controlled by the fishers’ associations and other associations controlled by the Department of Fisheries. Investment is the mainstay, other fish farms and fishing boats are not yet available, private investment in new fishing boats (calculated in the current year below), aquaculture investment, and private investment loaned by policy agricultural projects. The projects that belong to the formation of fixed capital in fisheries include: network maintenance funds, dredging projects, fishing port engineering and other design costs, related equipment maintenance fees, VDR communication fees, self-organized project plans (not included in the Jiacheng Information System), fishing port projects, commissioned labor costs for projects, direct sales centers, artificial reefs, etc. At present, the contents of the reported items are still insufficient. It is suggested that the newly added items of fishery fixed capital formation in the future also include: VDR, yacht industry, ornamental fish peripheral industry, and sailing industry.
The fishery fixed capital formation currently used in this study includes the expansion of fish farms and the conservation of aquatic products, the construction of fishing ports and onshore equipment, the construction and maintenance of fishing vessels, the mechanized operation equipment of fishing vessels, the means of land transportation, the fixed assets for fishery experiments and research, the fish markets and related equipment, intangible fixed assets, etc. (see Table 9). In addition, the domestic fixed capital formation of fishing gear is calculated based on the production value of fishing gear minus the export value in the industrial production statistics of the Ministry of Economic Affairs (see Table 10). According to the observation of the changes in the formation of fixed capital in fisheries over the years, the changes between 2009 and 2013 are relatively large, of which mainly occur from changes in fishing vessel construction and maintenance projects, especially during 2010 and 2012 when the investment was peak.
4.4. Changes in Inventory
The inventory changes of the fishery are mainly aquatic product inventory changes (see Table 11), which are calculated by subtracting the inventory value at the end of the previous year from the inventory value at the end of each year.
4.5. Customs Export
Regarding the export value of fishery customs, this study adopts the HS code of the ROC customs import and export trade statistics. The total value of each year is shown in Table 12. In addition, because the customs export data are calculated based on free on board (FOB) price, which includes the transportation and sales price, the difference must be adjusted. How the adjustment is made is introduced in the following context on the adjustment of the transportation and sales margins.
4.6. Non-Customs Export
Regarding the non-customs export value of fishery, the non-commercial part of this study adopts the statistics of smuggled fishery products seized by the Coast Guard Administration. Since only the weight data of confiscated smuggled fishery products is provided and the statistics of unit prices are lacking, the values are calculated by multiplying the weights by the average unit price of fishery. The average unit price of fishery is calculated by dividing the value of fishery production in the annual fishery statistics report by the fishery production volume. The total value for each year is shown in Table 13.
4.7. Adjustment of the Transportation and Sales Margins
In order to deduct the transportation and sales margins induced through the estimation of final demands, this study deducts the transportation and sales costs, which is approximated by those costs in the 2016 input–output tables, from the final demand in the buyer’s price and converts it to the final demand in producer’s price.
The relevant customs import and export data need to deduct the transportation and sales costs. The main reason is that the final demand is calculated at the buyer’s price. The pricing basis includes the transportation and sales costs. In order to convert into the final demand calculated at the producer’s price, the final demand of the product must be converted. The embedded transportation and sales costs are deducted.
Therefore, this study uses the tables of trade and transport margins and the transactions tables at purchasers’ prices of the 2016 input–output tables to calculate the trade and transport margin rate for each product of final demand in 2016 (that is, the trade and transport margin/transaction value at purchaser’s price), and assuming that the trade and transport margins’ rates remain unchanged from 2011 to 2018, multiply the rates by customs import and export data to obtain the trade and transport margin for each product of final demand from 2011 to 2018. These calculated trade and transport margins are then removed into the final demands of wholesale, retail, trade, and other commercial departments, as well as railway, land, sea, air, and other transportation departments. After deducting these trade and transport margins, it is the final demand calculated at the producer’s price.
4.8. The Economic Benefits of Yacht Activities to Taiwan’s Fishing Ports
In order to calculate the value added of fishery and related industries in a more thorough calculation, this study imposes the economic benefits of yacht activities in Taiwan’s fishing ports and piers. The additional value added is imposed to the industrial linkage effects in a conservative calculation method, which is based on the estimation by Ye [26] (see Table 14).
5. Empirical Results
Because there is still part of the consumption of imported goods that must be excluded, this study uses the proportion of domestic production in the final demand of each sector in the 2016 I-O tables to estimate and adjust the final demand matrix calculated at producers’ prices for domestic production only (see Appendix A).
Table 15 shows the values added created by fishery and related industries and their proportions in GDP from 2011 to 2018. The value added created by fishery and related industries accounted for 2.96% of GDP in 2011, and by 2014, after rising to 3.11%, it fell to 2.87% in 2015, rose to 2.93% in 2017, and fell to 2.84% in 2018. In addition, from 2011 to 2018, the value added created by fishery and related industries rose from NT$ 422.8 billion to NT$ 520.9 billion.
Table 15 also further divides the values added created by fisheries and related industries into four major categories of primary (unprocessed) fishery, fishery inputs, fishery product processing, and transportation and sale service sector, according to the relationship between upstream and downstream. In the latest two years (2017 ~ 2018), the primary fishery sector has the largest contribution (contributing between 1.83% and 1.70% to total GDP), followed by the fishery input sector (contribution rate of 0.62% to 0.64%). The transportation and sale service sector (contribution rate is 0.39% ~ 0.40%), and fishery product processing have the lowest contribution rates (contribution rate is only 0.10%). Generally speaking, the ranking of these four categories is still quite stable.
These values in Table 15 can also refer to the distribution of values added of each consumer dollar among the industrial sectors. For example, these four categories account for 1.7%, 0.64%, 0.1%, 0.4% of total GDP in 2018 and that refers to approximately 60% (i.e., 1.7/(1.7 + 0.64 + 0.1 + 0.4)) of each consumer dollar would go to fishers (primary fishery sector), and another 23% (i.e., 0.64/(1.7 + 0.64 + 0.1 + 0.4)) goes into the downstream fishery input sector as a bulk, while fishery product processing accounts for 4% (i.e., 0.1/(1.7 + 0.64 + 0.1 + 0.4)), and transportation and sale service providers account for 14% (i.e., 0.4/(1.7 + 0.64 + 0.1 + 0.4)). These values demonstrate the internal structure of fishery value chain and its changes.
It is worth mentioning that the contribution of the fishery input sector is about 0.31 to 0.46 times that of the primary fishery, mostly from the business advertising service. The contributions of business advertising service sector are around 0.4% of GDP during the period of this study. This indicates that the contribution of fishery, in addition to the production of primary fishery, can also derive the value added of business advertising service about 0.4% of GDP, which is almost the same size as that of transportation and sale service sector, and it is larger than that of conventional evaluation on value added. Therefore, we should evaluate the contribution of fishery sector from the perspective of the whole fishery value chain, instead of the primary fishery sector only.
6. Conclusions and Remarks
Based on the calculation of current statistical system, fishery’s GDP accounted for less than 0.3% of Taiwan’s total in 2011. While we consider the inter-industrial linkage effects between fisheries and related industries, the whole fishery value chain’s value added accounted for 2.96% of the country’s total GDP. After 3.11% in 2014, it dropped to 2.87% in 2015, rose to 2.93% in 2017, and dropped to 2.84% in 2018. Secondly, from 2011 to 2018, the value added created by fishery and related industries rose from NT$ 422.8 billion to NT$ 520.9 billion. As to the internal structure in the latest two years (2017–2018), the primary fishery sector has contributed the most, followed by fishery input sector and transportation and sale service sector, with fishery product processing sector having the lowest contribution rate. Generally speaking, the contribution ranking of these four major categories of fishery sectors is still quite stable.
In the fishery value chain of Taiwan, fishery productions are calculated in the annual fishery statistics report. However, there are many aspects of the fishery value chain that are not accurately represented due to a lack of data. Examples include the following: aquatic food processing has specific statistical data for edible and non-edible products collected by the Fisheries Agency, but there is no statistical data on marine health food. Most statistical data of the retail and service industries need to be investigated by specific programs, such as fishery and leisure tourism programs, or calculated from industry-related tables. In supporting activities, most of the data on administrative activities such as scientific research and development categories and corporate organizational structures are derived from agricultural statistics or fishery statistics and fishery-related investments, while only some of the basic facilities of related industries have industrial statistics, such as fishing gear for example. There is also a lack of information on procurement and human resource management. That is to say, the actual value of the fishery value chain is even underestimated, not to mention those that cannot be guided by market functions or displayed, and cannot be included in GDP.
The linkage effects and non-economic functions of the primary productions of agriculture and fisheries are usually underestimated. This study leads to a similar conclusion to that of previous studies. For example, Huang et al. [1] found that there was a sevenfold increase in Taiwan’s agricultural value chain, compared to contribution based on mere agriculture production value. Chen et al. [27] found that even though oyster farming showed a relatively low industrial linkage effect, adopting the aggregate multiplier of the fisheries sector to assess unemployment related to a decrease in Taiwan’s oyster farming output would seriously underestimate its impact. Further, Seung [16] also found that there was considerable heterogeneity in the direction and the magnitude of the change across countries in global value chain income and employment for world fisheries.
In sum, policy implications induced by this study’s empirical results suggest that first, complementary policies in the related industries should be jointly considered when the policymakers intend to formulate fishery policies. For example, since our empirical results suggest that business advertising service and wholesale and retail are the sectors which contribute the main value added of the value chain, thoughtful regulations of e-commerce sales channels, cold chain logistics, and food hygiene for fishery products should also be considered as parts of fishery policies.
Secondly, to replenish the lack of data, detailed investigations and calculations should be conducted on the industrial value chain of fisheries and related industries with high unit price and high value added to optimize the industrial structure of fisheries, to promote and strengthen the value added of the industries, and to develop its unique competitive advantage.
Thirdly, ones should pay more attention to the sustainable development of fisheries in the future and emphasize its intangible value and possible future values, such as the value of ecology, the development and application of fishery by-products, the value of recreation, education, culture, and food security.
Author Contributions
Conceptualization, T.-Y.Y. and W.-H.L.; methodology, H.-C.L.; validation, T.-Y.Y. and W.-H.L.; formal analysis, H.-C.L.; investigation, T.-Y.Y.; resources, W.-H.L.; data curation, T.-Y.Y.; writing—H.-C.L.; writing—review and editing, T.-Y.Y.; supervision, W.-H.L. All authors have read and agreed to the published version of the manuscript.
Funding
This research was supported by Fisheries Agency, Council of Agriculture, Executive Yuan, Taiwan (Project #102 Public Construction-15.2-enterprise-01).
Data Availability Statement
The sources of data supporting this study are illustrated in the context near the reports.
Acknowledgments
We thank all for their comments to refine this study.
Conflicts of Interest
The authors declare no conflict of interest.
Appendix A. Estimated Final Demand for Taiwan’s Fishery and Peripheral Products from 2011 to 2018

Table A1.
Private consumption. Unit: billion NT$.
| I-O Table Sector Classification | Product Values at Buyers’ Prices (Including Imported Goods) | Domestic Products | |||||||||||||||
|---|---|---|---|---|---|---|---|---|---|---|---|---|---|---|---|---|---|
| 2011 | 2012 | 2013 | 2014 | 2015 | 2016 | 2017 | 2018 | 2011 | 2012 | 2013 | 2014 | 2015 | 2016 | 2017 | 2018 | ||
| 011 | Fishery | 11,746 | 10,585 | 9465 | 10,902 | 12,359 | 10,367 | 15,249 | 13,354 | 6178 | 5568 | 4979 | 5734 | 6501 | 5454 | 8021 | 7024 |
| 022 | Feed | 12,516 | 13,648 | 13,110 | 14,044 | 14,529 | 13,160 | 12,797 | 12,588 | 54 | 59 | 56 | 60 | 62 | 56 | 55 | 54 |
| 026 | Other food | 866 | 769 | 576 | 672 | 837 | 545 | 541 | 468 | 242 | 215 | 162 | 188 | 235 | 152 | 151 | 131 |
| 106 | Fish tank | 64.5 | 160 | 306 | 306 | 306 | 306 | 306 | 306 | ||||||||
| 022 | Feed | 139 | 300 | 325 | 325 | 325 | 325 | 325 | 325 | ||||||||
| 097 | Air pump | 72 | 77.5 | 62 | 62 | 62 | 62 | 62 | 62 | 18 | 19 | 15 | 15 | 15 | 15 | 15 | 15 |
| 089 | Motor | 63 | 71.5 | 56.5 | 56.5 | 56.5 | 56.5 | 56.5 | 56.5 | ||||||||
| 106 | Filter | 73.5 | 121 | 89 | 89 | 89 | 89 | 89 | 89 | ||||||||
| 092 | Lamps | 57 | 74 | 94 | 94 | 94 | 94 | 94 | 94 | 7 | 7 | 9 | 9 | 9 | 9 | 9 | 9 |
| 059 | Water quality treatment agent | 49.5 | 89 | 89 | 89 | 89 | 89 | 89 | 89 | 5 | 11 | 11 | 11 | 11 | 11 | 11 | 11 |
| 106 | Fish tank | 55.5 | 69.5 | 69.5 | 69.5 | 69.5 | 69.5 | 69.5 | 69.5 | 36 | 65 | 85 | 86 | 86 | 86 | 86 | 86 |
| 087 | Water quality detector | 270 | 38 | 38 | 38 | 38 | 38 | 38 | 38 | 6 | 9 | 9 | 9 | 9 | 9 | 9 | 9 |
| 093 | Temperature control system | 78 | 69.5 | 78 | 78 | 78 | 78 | 78 | 78 | 27 | 24 | 27 | 27 | 27 | 27 | 27 | 27 |
| 133 | Culture Media | 33 | 41 | 36 | 36 | 36 | 36 | 36 | 36 | 0 | 0 | 0 | 0 | 0 | 0 | 0 | 0 |
| 133 | Other | 46.5 | 56.5 | 61.5 | 61.5 | 61.5 | 61.5 | 61.5 | 61.5 | ||||||||
| 151 | Travel service | 2280 | 2420 | 3080 | 3080 | 3080 | 3080 | 3080 | 3080 | 2084 | 2212 | 2816 | 3483 | 3419 | 2103 | 2057 | 1746 |
| trade margins | - | - | - | - | - | - | - | - | 12,799 | 13,065 | 12,252 | 13,428 | 14,377 | 12,618 | 14,301 | 13,396 | |
| Domestic freight | - | - | - | - | - | - | - | - | 357 | 367 | 343 | 377 | 401 | 351 | 392 | 370 | |
| Total | 28,410 | 28,590 | 27,536 | 30,003 | 32,110 | 28,457 | 32,972 | 30,795 | 21,813 | 21,621 | 20,764 | 23,427 | 25,152 | 20,891 | 25,134 | 22,878 | |
Table A2.
Government consumption. Unit: billion NT$.
| I-O Table Sector Classification | Product Values at Buyers’ Prices (Including Imported Goods) | Domestic Products | |||||||||||||||
|---|---|---|---|---|---|---|---|---|---|---|---|---|---|---|---|---|---|
| 2011 | 2012 | 2013 | 2014 | 2015 | 2016 | 2017 | 2018 | 2011 | 2012 | 2013 | 2014 | 2015 | 2016 | 2017 | 2018 | ||
| 011 | Fishery | 3081 | 3405 | 3500 | 3874 | 3684 | 3611 | 2731 | 2808 | 0 | 0 | 0 | 0 | 0 | 0 | 0 | 0 |
| Trade margins | - | - | - | - | - | - | - | - | 0 | 0 | 0 | 0 | 0 | 0 | 0 | 0 | |
| Domestic freight | - | - | - | - | - | - | - | - | 1 | 1 | 1 | 1 | 1 | 1 | 1 | 1 | |
| Total | 3081 | 3405 | 3500 | 3874 | 3684 | 3611 | 2731 | 2808 | 1 | 1 | 1 | 1 | 1 | 1 | 1 | 1 | |
Table A3.
Fixed capital formation. Unit: billion NT$.
| I-O Table Sector Classification | Product Values at Buyers’ Prices (Including Imported Goods) | Domestic Products | |||||||||||||||
|---|---|---|---|---|---|---|---|---|---|---|---|---|---|---|---|---|---|
| 2011 | 2012 | 2013 | 2014 | 2015 | 2016 | 2017 | 2018 | 2011 | 2012 | 2013 | 2014 | 2015 | 2016 | 2017 | 2018 | ||
| 087 | Precision equipment | 193 | 3 | 966 | 57 | 406 | 71 | 57 | 131 | 9 | 0 | 48 | 3 | 20 | 4 | 3 | 6 |
| 096 | Other special machinery and equipment | 344 | 383 | 581 | 768 | 643 | 604 | 493 | 536 | 49 | 55 | 83 | 110 | 92 | 87 | 71 | 77 |
| 097 | General Machinery | 76 | 124 | 148 | 84 | 165 | 127 | 94 | 261 | 35 | 57 | 68 | 39 | 75 | 58 | 43 | 119 |
| 098 | Vehicles | 188 | 356 | 384 | 470 | 393 | 279 | 775 | 732 | 120 | 227 | 245 | 300 | 250 | 178 | 494 | 466 |
| 099 | Ships | 1163 | 8049 | 6304 | 4821 | 4934 | 2922 | 3266 | 4446 | 1023 | 7081 | 5547 | 4241 | 4341 | 2571 | 2874 | 3912 |
| 105 | Yule Supplies | 247 | 392 | 541 | 599 | 506 | 460 | 661 | 726 | 117 | 187 | 258 | 285 | 241 | 219 | 315 | 346 |
| 117 | Public construction | 1481 | 1410 | 745 | 674 | 966 | 965 | 1361 | 1947 | 1481 | 1410 | 745 | 674 | 966 | 965 | 1361 | 1947 |
| 118 | Other construction projects | 463 | 1116 | 499 | 3893 | 733 | 855 | 535 | 1048 | 463 | 1116 | 499 | 3893 | 733 | 855 | 535 | 1048 |
| 135 | Computer System Design Service | 1 | 0 | 0 | 0 | 0 | 0 | 0 | 0 | 0 | 0 | 0 | 0 | 0 | 0 | 0 | 0 |
| Trade margins | - | - | - | - | - | - | - | - | 137 | 269 | 398 | 295 | 317 | 218 | 291 | 350 | |
| Domestic freight | - | - | - | - | - | - | - | - | 11 | 53 | 47 | 37 | 39 | 24 | 29 | 38 | |
| Total | 4156 | 11,833 | 10,168 | 11,366 | 8746 | 6283 | 7242 | 9827 | 3455 | 10,455 | 7938 | 9877 | 7074 | 5179 | 6016 | 8309 | |
Table A4.
Inventory changes. Unit: billion NT$.
| I-O Table Sector Classification | Product Values at Buyers’ Prices (Including Imported Goods) | Domestic Products | |||||||||||||||
|---|---|---|---|---|---|---|---|---|---|---|---|---|---|---|---|---|---|
| 2011 | 2012 | 2013 | 2014 | 2015 | 2016 | 2017 | 2018 | 2011 | 2012 | 2013 | 2014 | 2015 | 2016 | 2017 | 2018 | ||
| 026 | Canned food | 21 | −23 | 20 | 124 | −175 | 31 | −9 | 79 | 12 | −105 | −47 | 200 | −203 | −29 | 38 | 70 |
| 026 | frozen food | 5 | −212 | −125 | 321 | −278 | −96 | 93 | 78 | ||||||||
| Trade margins | - | - | - | - | - | - | - | - | 5 | −48 | −22 | 92 | −94 | −13 | 17 | 33 | |
| Domestic freight | - | - | - | - | - | - | - | - | 2 | −4 | −1 | 11 | −10 | −1 | 3 | 5 | |
| Total | 26 | −235 | −105 | 445 | −453 | −65 | 84 | 157 | 19 | −157 | −70 | 303 | −307 | −43 | 58 | 108 | |
Table A5.
Customs export (commodity export). Unit: billion NT$.
| I-O Table Sector Classification | Product Values at Buyers’ Prices (Including Imported Goods) | Domestic Products | |||||||||||||||
|---|---|---|---|---|---|---|---|---|---|---|---|---|---|---|---|---|---|
| 2011 | 2012 | 2013 | 2014 | 2015 | 2016 | 2017 | 2018 | 2011 | 2012 | 2013 | 2014 | 2015 | 2016 | 2017 | 2018 | ||
| 11 | Fishery | 49,861 | 56,234 | 50,351 | 56,791 | 52,792 | 51,840 | 54,894 | 59,301 | 24,883 | 28,065 | 25,128 | 28,342 | 26,346 | 25,871 | 27,395 | 29,593 |
| 14 | Slaughtering raw meat and by-products | 0 | 0 | 0 | 0 | 0 | 0 | 0 | 0 | 0 | 0 | 0 | 0 | 0 | 0 | 0 | 0 |
| 18 | Edible fats and by-products | 18 | 17 | 25 | 22 | 17 | 12 | 11 | 12 | 16 | 15 | 22 | 20 | 15 | 11 | 10 | 11 |
| 22 | feed | 746 | 882 | 883 | 776 | 612 | 528 | 446 | 472 | 824 | 1117 | 1163 | 1073 | 933 | 861 | 790 | 813 |
| 26 | Canned food | 417 | 429 | 519 | 497 | 544 | 476 | 362 | 437 | 26,034 | 31,631 | 28,273 | 31,073 | 28,253 | 27,455 | 30,758 | 32,426 |
| 26 | frozen food | 34,548 | 42,037 | 37,424 | 40,924 | 37,371 | 36,369 | 40,950 | 43,109 | ||||||||
| 26 | Other food | 12 | 30 | 43 | 53 | 44 | 42 | 12 | 19 | ||||||||
| 59 | Other chemicals | 0 | 0 | 0 | 0 | 0 | 0 | 0 | 0 | 23 | 96 | 91 | 91 | 91 | 91 | 91 | 91 |
| 60 | Medical drugs | 0 | 0 | 0 | 0 | 0 | 0 | 0 | 0 | ||||||||
| 106 | Other products | 1 | 2 | 2 | 2 | 2 | 2 | 2 | 2 | ||||||||
| 106 | Fish tank | 36 | 189 | 252 | 252 | 252 | 252 | 252 | 252 | ||||||||
| 22 | feed | 219 | 426 | 481 | 481 | 481 | 481 | 481 | 481 | ||||||||
| 97 | air pump | 62 | 165 | 165 | 165 | 165 | 165 | 165 | 165 | 56 | 149 | 149 | 149 | 149 | 149 | 149 | 149 |
| 89 | motor | 60 | 171 | 171 | 171 | 171 | 171 | 171 | 171 | 58 | 162 | 162 | 163 | 163 | 163 | 163 | 163 |
| 106 | filter | 60 | 192 | 187 | 187 | 187 | 187 | 187 | 187 | ||||||||
| 92 | Lamps | 47 | 182 | 182 | 182 | 182 | 182 | 182 | 182 | 40 | 157 | 157 | 158 | 158 | 158 | 158 | 158 |
| 59 | Water quality treatment agent | 27 | 110 | 105 | 105 | 105 | 105 | 105 | 105 | ||||||||
| 106 | Filter material | 33 | 142 | 142 | 142 | 142 | 142 | 142 | 142 | 99 | 401 | 446 | 446 | 446 | 446 | 446 | 446 |
| 87 | Water quality detector | 24 | 44 | 44 | 44 | 44 | 44 | 44 | 44 | 20 | 36 | 36 | 36 | 36 | 36 | 36 | 36 |
| 93 | Temperature control system | 51 | 42 | 37 | 37 | 37 | 37 | 37 | 37 | 42 | 35 | 30 | 0 | 0 | 0 | 0 | 0 |
| 105 | Yule Supplies | 686 | 773 | 736 | 664 | 695 | 694 | 655 | 690 | 558 | 630 | 599 | 540 | 565 | 565 | 532 | 561 |
| Trade margins | 0 | 0 | 0 | 0 | 0 | 0 | 0 | 0 | 32,728 | 37,670 | 33,756 | 37,765 | 34,941 | 34,225 | 36,711 | 39,406 | |
| Domestic freight | 0 | 0 | 0 | 0 | 0 | 0 | 0 | 0 | 793 | 962 | 865 | 949 | 864 | 841 | 929 | 982 | |
| Total | 86,907 | 102,067 | 91,749 | 101,495 | 93,843 | 91,729 | 99,098 | 105,808 | 86,174 | 101,126 | 90,877 | 100,805 | 92,960 | 90,872 | 98,168 | 104,835 | |
Table A6.
Non-customs export (part of non-tradable commodities). Unit: billion NT$.
| I-O Table Sector Classification | Product Values at Buyers’ Prices (Including Imported Goods) | Domestic Products | |||||||||||||||
|---|---|---|---|---|---|---|---|---|---|---|---|---|---|---|---|---|---|
| 2011 | 2012 | 2013 | 2014 | 2015 | 2016 | 2017 | 2018 | 2011 | 2012 | 2013 | 2014 | 2015 | 2016 | 2017 | 2018 | ||
| 011 | Fishery | 1 | 4 | 4 | 2 | 2 | 1 | 1 | 1 | 1 | 4 | 4 | 2 | 2 | 1 | 1 | 1 |
| Trade margins | - | - | - | - | - | - | - | - | 0 | 0 | 0 | 0 | 0 | 0 | 0 | 0 | |
| Domestic freight | - | - | - | - | - | - | - | - | 1 | 1 | 1 | 1 | 1 | 1 | 1 | 1 | |
| Total | 1 | 4 | 4 | 2 | 2 | 1 | 1 | 1 | 2 | 5 | 5 | 3 | 3 | 2 | 2 | 2 | |
Table A7.
Summary from Appendix A1 to Appendix A6 (product values at buyers’ prices, including imported goods). Unit: billion NT$.
Table A7.
Summary from Appendix A1 to Appendix A6 (product values at buyers’ prices, including imported goods). Unit: billion NT$.
| 2011 | 2012 | 2013 | 2014 | 2015 | 2016 | 2017 | 2018 | |
|---|---|---|---|---|---|---|---|---|
| Private consumption | 28,410 | 28,590 | 27,536 | 30,003 | 32,110 | 28,457 | 32,972 | 30,795 |
| Government consumption | 3081 | 3405 | 3500 | 3874 | 3684 | 3611 | 2731 | 2808 |
| Fixed Capital Formation | 4156 | 11,833 | 10,168 | 11,366 | 8746 | 6283 | 7242 | 9827 |
| Inventory changes | 26 | −235 | −105 | 445 | −453 | −65 | 84 | 157 |
| Customs Export (Commodity Export) | 86,907 | 102,067 | 91,749 | 101,495 | 93,843 | 91,729 | 99,098 | 105,808 |
| Non-customs export | 1 | 4 | 4 | 2 | 2 | 1 | 1 | 1 |
| Total | 122,581 | 145,664 | 132,852 | 147,185 | 137,932 | 130,016 | 142,128 | 149,396 |
| Proportion in GDP | 0.86 | 0.99 | 0.87 | 0.91 | 0.81 | 0.74 | 0.79 | 0.81 |
Note: The calculated proportions of output effects (values added) in GDP via 2016 I-O tables is based on the GDP during 2011 and 2018, which were announced on 29 November 2019.
References
- Huang, W.-H.; Hsu, S.M.; Lin, H.-C.; Dy, K.B.; Chang, C.-C.; Hsu, S.-H. The value-added and linkage effect analysis of Taiwan’s agricultural sector. Mod. Econ. 2022, 13, 79–97. [Google Scholar] [CrossRef]
- Barbier, E.B. Sustainable use of wetlands valuing tropical wetland benefits: Economic methodologies and applications. Geogr. J. 1993, 159, 22–32. [Google Scholar] [CrossRef]
- Batie, S.S.; Wilson, J.R. Economic values attributable to Virginia’s coastal wetlands as inputs in oyster production. South. J. Agric. Econ. 1978, 10, 111–118. [Google Scholar] [CrossRef] [Green Version]
- Bergstrom, J.C.; Stoll, J.R.; Titre, J.P.; Wright, V.L. Economic value of wetlands-based recreation. Ecol. Econ. 1990, 2, 129–147. [Google Scholar] [CrossRef]
- Constanza, R.; D’arge, R.; de Groot, R.; Farber, S.; Grasso, M.; Hannon, B.; Limburg, K.; Naeem, S.; O’Neill, R.V.; Paruelo, J.; et al. The value of the worlds ecosystem services and natural capital. Nature 1997, 387, 253–260. [Google Scholar] [CrossRef]
- Imamura, N. Sixth industrialization for aquaculture to create additional values. In The Sixth Industrialization of Agriculture That Creates Vitality in the Region-Power-Up Agriculture and Rural Areas; 21 Seiki Murazukurijyuku (21st Century Village-Building School): Tokyo, Japan, 1998; pp. 1–28. (In Japanese) [Google Scholar]
- Porter, M. The value chain and competitive advantage. In Competitive Advantage: Creating and Sustaining Superior Performance; Chapter 2; Free Press: New York, NY, USA, 1985; pp. 33–61. [Google Scholar]
- Zhang, Y.; Diao, X. The changing role of agriculture with economic structural change—The case of China. China Econ. Rev. 2020, 62, 101504. [Google Scholar] [CrossRef]
- Guo, S.; Jiang, L.; Shen, G.O.P. Embodied pasture land use change in China 2000–2015: From the perspective of globalization. Land Use Policy 2019, 82, 476–485. [Google Scholar] [CrossRef]
- Wang, T.F. Analysis of the economic effects of transportation and communication construction in Taiwan. Taipei Econ. Inquiry 1990, 30, 79–125. [Google Scholar]
- Lin, Y.C. The inter-industrial linkage of the transport sector in Taiwan’s national economy: An input-output approach. Unpublished Master’s Thesis, Kainan University, Taoyuan City, Taiwan, 2008. [Google Scholar]
- Gupta, S. Automobile Clusters in India: A Comparative Analysis of Structure and Linkages (1982–2007). Unpublished Ph.D. Thesis, Jawaharlal Nehru University, New Delhi, India, 2014. [Google Scholar]
- Kim, D.-H.; Seung, C.K. Economic contributions of wild fisheries and aquaculture: A social accounting matrix (SAM) analysis for Gyeong-Nam Province, Korea. Ocean. Coast. Manag. 2020, 188, 105072. [Google Scholar] [CrossRef]
- Garza-Gil, M.; Surís-Regueiro, J.; Varela-Lafuente, M. Using input–output methods to assess the effects of fishing and aquaculture on a regional economy: The case of Galicia, Spain. Mar. Policy 2017, 85, 48–53. [Google Scholar] [CrossRef]
- Cai, J.; Huang, H.; Leung, P. Understanding and Measuring the Contribution of Aquaculture and Fisheries to Gross Domestic Product (GDP); FAO Fisheries and Aquaculture Technical Paper No. 606; FAO: Rome, Italy, 2019; 80p. [Google Scholar]
- Seung, C.K. Decomposing global value chain (GVC) income for world fisheries. Mar. Policy 2022, 137, 104950. [Google Scholar] [CrossRef]
- Seung, C.K.; Kim, D.-H.; Yi, J.-H.; Song, S.-H. Accounting for price responses in economic evaluation of climate impacts for a fishery. Ecol. Econ. 2021, 181, 106913. [Google Scholar] [CrossRef]
- Shabman, L.; Bertelson, M.K. The use of development value estimates for coastal wetland permit decisions. Land Econ. 1979, 55, 213–222. [Google Scholar] [CrossRef]
- Thibodeau, F.R.; Ostro, B.D. An economic analysis of wetland protection. J. Environ. Manag. 1981, 12, 19–30. [Google Scholar]
- Arunatilake, N.; Gunawardena, A.; Marawila, D.; Samaratunga, P.; Senaratne, A.; Thibbotuwawa, M. Analysis of the Fisheries Sector in Sri Lanka; The United States Agency for International Development: Washington, DC, USA, 2008. [Google Scholar]
- Miller, R.E.; Blair, P.D. Input-Output Analysis: Foundations and Extensions, 2nd ed.; Cambridge University Press: London, UK, 2009. [Google Scholar]
- Directorate-General of Budget, Accounting and Statistics. 2016 Annual I-O Tables-164 Sectors; Executive Yuan: Taipei, Taiwan, 2018. [Google Scholar]
- Lin, H.-C.; Chang, C.-C. Agricultural Value Added and Input-Output Analysis in Taiwan. Taiwan Agric. Econ. Ser. 2004, 10, 1–24. [Google Scholar]
- Fisheries Agency, Council of Agriculture. Fisheries Annual Reports; Executive Yuan: Taipei, Taiwan, 2019.
- Council of Agriculture. 2006–2018. Annual Report of Agricultural Statistics; Executive Yuan: Taipei, Taiwan, 2019. [Google Scholar]
- Ye, Y.-J. Economic Benefits Analysis and Forecasting of Yachting Activity to Yacht Wharves within Fishing Ports in Taiwan; A Research Project Commissioned by Fisheries Agency; Council of Agriculture, Executive Yuan: Taipei, Taiwan, 2013.
- Chen, T.-A.P.; Chang, T.-C.; Chiau, W.-Y.; Shih, Y.-C. Social economic assessment of coastal area industrial development: An application of input-output model to oyster farming in Taiwan. Ocean Coast. Manag. 2013, 73, 151–159. [Google Scholar]
Figure 1.
The value chain—a series of process in which a company develops its unique competitive advantages. Source: [7].
Figure 1.
The value chain—a series of process in which a company develops its unique competitive advantages. Source: [7].

Figure 2.
The fishery value chain. Source: summarization of this study’s points.

Figure 3.
Fishbone diagram of fishery production (including 3 major sectors: distant, coastal, and aquaculture fishery, and many sub-sectors under each major sector.). Source: summarization of this study’s points.
Figure 3.
Fishbone diagram of fishery production (including 3 major sectors: distant, coastal, and aquaculture fishery, and many sub-sectors under each major sector.). Source: summarization of this study’s points.

Figure 4.
Fishbone diagram of Taiwan’s aquatic product processing industry (including primary and secondary processing). Source: summarization of this study’s points.
Figure 4.
Fishbone diagram of Taiwan’s aquatic product processing industry (including primary and secondary processing). Source: summarization of this study’s points.

Figure 5.
Fishbone diagram of retail and service industry. Source: summarization of this study’s points.
Figure 5.
Fishbone diagram of retail and service industry. Source: summarization of this study’s points.

Figure 6.
Fishbone diagram for supporting activities. Source: summarization of this study’s points.

Figure 7.
Fishery industry value chain—the practices may be slightly different between marine capture fisheries and aquaculture. Source: [20].
Figure 7.
Fishery industry value chain—the practices may be slightly different between marine capture fisheries and aquaculture. Source: [20].

Table 1.
Private consumption of fresh or refrigerated fishery products (Unit: thousand NT$).
| Year | Production Value | Import Value | Export Value | Private Consumption |
|---|---|---|---|---|
| (1) | (2) | (3) | (4) = (1) + (2) − (3) | |
| 2006 | 8,625,594 | 2,997,244 | 477,457 | 11,145,380 |
| 2007 | 13,913,880 | 3,190,863 | 533,650 | 16,571,093 |
| 2008 | 11,165,062 | 2,975,079 | 3,540,809 | 10,599,332 |
| 2009 | 9,737,625 | 3,440,335 | 3,593,715 | 9,584,245 |
| 2010 | 12,636,571 | 3,727,048 | 6,431,300 | 9,932,319 |
| 2011 | 14,523,750 | 4,033,268 | 6,810,957 | 11,746,061 |
| 2012 | 13,562,409 | 4,093,158 | 7,070,254 | 10,585,314 |
| 2013 | 11,998,261 | 4,438,350 | 6,971,658 | 9,464,953 |
| 2014 | 11,638,173 | 5,194,781 | 5,930,506 | 10,902,448 |
| 2015 | 11,158,982 | 5,840,556 | 4,640,202 | 12,359,336 |
| 2016 | 9,657,160 | 5,864,069 | 5,154,139 | 10,367,090 |
| 2017 | 12,927,721 | 6,438,488 | 4,116,905 | 15,249,304 |
| 2018 | 10,242,730 | 6,737,996 | 3,704,514 | 13,276,213 |
Source: 1. 2006–2018 Fisheries Annual Reports [24], by Fisheries Agency. 2. Global Information Network of Central Bank, the central bank’s closing exchange rate data of new Taiwan dollar to U.S. dollar interbank transactions, taken from Foreign Exchange Information (http://www.cbc.gov.tw/content.asp?CuItem=27029, accessed on 15 December 2021). Note: Fresh or refrigerated fishery products include: refrigerated products, prepared frozen products, smoked products, dried and salted products, seasoned dried products, shark fins, fish eggs, fish paste products, cod liver oil, fish and shrimp oil, seaweed bi-products.
Table 2.
Private consumption of canned aquatic products.
| Year | Production Value | Import Value | Export Value | Private Consumption |
|---|---|---|---|---|
| (1) | (2) | (3) | (4) = (1) + (2) − (3) | |
| 2006 | 553,522 | 1,254,200 | 100,163 | 1,707,559 |
| 2007 | 657,822 | 918,000 | 184,736 | 1,391,085 |
| 2008 | 564,568 | 991,147 | 231,020 | 1,324,695 |
| 2009 | 591,666 | 808,676 | 260,624 | 1,139,718 |
| 2010 | 580,007 | 957,329 | 319,046 | 1,218,289 |
| 2011 | 507,815 | 775,492 | 417,122 | 866,186 |
| 2012 | 440,882 | 757,467 | 428,959 | 769,390 |
| 2013 | 368,292 | 727,430 | 519,367 | 576,354 |
| 2014 | 407,560 | 739,947 | 475,897 | 671,610 |
| 2015 | 424,720 | 937,546 | 524,786 | 837,480 |
| 2016 | 257,432 | 763,352 | 476,270 | 544,514 |
| 2017 | 153,418 | 756,714 | 369,012 | 541,120 |
| 2018 | 172,181 | 717,049 | 428,909 | 460,321 |
Table 3.
Private consumption of non-food items (Unit: thousand NT$).
| Year | Production Value | Import Value | Export Value | Private Consumption |
|---|---|---|---|---|
| (1) | (2) | (3) | (4) = (1) + (2) − (3) | |
| 2006 | 78,614 | 6,673,637 | 1,917,833 | 4,834,418 |
| 2007 | 88,415 | 5,750,339 | 1,733,532 | 4,105,221 |
| 2008 | 519,277 | 5,330,848 | 1,507,584 | 4,342,542 |
| 2009 | 226,086 | 6,937,745 | 1,477,687 | 5,686,144 |
| 2010 | 177,263 | 7,632,240 | 1,697,973 | 6,111,530 |
| 2011 | 283,468 | 8,344,765 | 1,460,501 | 7,167,731 |
| 2012 | 425,183 | 9,099,316 | 1,584,882 | 7,939,617 |
| 2013 | 504,949 | 8,034,298 | 1,533,602 | 7,005,645 |
| 2014 | 494,772 | 9,422,279 | 1,491,129 | 8,425,922 |
| 2015 | 341,698 | 10,086,882 | 1,312,954 | 9,115,626 |
| 2016 | 368,921 | 8,894,883 | 1,219,939 | 8,043,865 |
| 2017 | 1,155,208 | 7,349,862 | 1,164,383 | 7,340,687 |
| 2018 | 1,219,466 | 7,562,099 | 1,193,725 | 7,587,840 |
Table 4.
Private consumption of fishery products for feed (Unit: thousand NT$).
| Year | Production Value | Import Value | Export Value | Private Consumption |
|---|---|---|---|---|
| (1) | (2) | (3) | (4) = (1) + (2) − (3) | |
| 2006 | 12,483,317 | 72,707 | 934,258 | 11,621,766 |
| 2007 | 12,850,332 | 67,852 | 997,214 | 11,921,196 |
| 2008 | 13,759,442 | 62,593 | 901,670 | 12,921,964 |
| 2009 | 13,355,263 | 98,552 | 979,605 | 12,472,900 |
| 2010 | 13,537,349 | 99,071 | 917,681 | 12,721,791 |
| 2011 | 13,051,938 | 70,537 | 745,793 | 12,376,682 |
| 2012 | 14,136,974 | 93,106 | 882,379 | 13,347,701 |
| 2013 | 13,570,682 | 96,574 | 882,591 | 12,784,665 |
| 2014 | 14,357,235 | 104,041 | 742,771 | 13,718,505 |
| 2015 | 14,451,021 | 343,796 | 590,782 | 14,204,035 |
| 2016 | 12,983,479 | 380,447 | 528,723 | 12,835,204 |
| 2017 | 12,556,567 | 370,199 | 454,820 | 12,471,947 |
| 2018 | 12,265,763 | 471,637 | 474,884 | 12,262,516 |
Source: 2018 Annual Report of Agricultural Statistics [25], by Council of Agriculture. Note: 1. Same as Table 1. 2. The production value is calculated by using the total supply of aquatic product compound feed and the price of domestic fish meal feed in the annual agricultural statistics report. 3. The feed price from 2012 to 2018 is calculated at 29.8 NT$ per kilogram in 2011.
Table 5.
Private consumption of fish, shellfish, and fry (Unit: thousand NT$).
| Year | Production Value | Import Value | Export Value | Private Consumption |
|---|---|---|---|---|
| (1) | (2) | (3) | (4) = (1) + (2) − (3) | |
| 2006 | 1,297,037 | 43,722 | 212,915 | 1,127,843 |
| 2007 | 1,406,854 | 49,559 | 89,921 | 1,366,491 |
| 2008 | 1,047,089 | 45,101 | 28,050 | 1,064,140 |
| 2009 | 819,752 | 64,776 | 22,209 | 862,319 |
| 2010 | 1,454,343 | 47,590 | 130,713 | 1,371,219 |
| 2011 | 1,590,290 | 79,936 | 119,742 | 1,550,484 |
| 2012 | 2,493,053 | 60,235 | 149,788 | 2,403,500 |
| 2013 | 4,750,237 | 46,501 | 144,533 | 4,652,205 |
| 2014 | 2,668,399 | 109,810 | 211,544 | 2,566,666 |
| 2015 | 2,153,898 | 81,468 | 70,527 | 2,164,839 |
| 2016 | 2,927,810 | 69,581 | 52,646 | 2,944,745 |
| 2017 | 2,485,568 | 94,787 | 90,069 | 2,490,286 |
| 2018 | 3,344,316 | 67,791 | 195,170 | 3,216,937 |
Table 6.
Number of coastal fishery tourists and output value (Unit: per 10,000 people, 100 million NT$).
Table 6.
Number of coastal fishery tourists and output value (Unit: per 10,000 people, 100 million NT$).
| Year | Number of Sea-Bound Recreational Fishing Boats | Visitors | Coastal Fishery Tourism Output Value |
|---|---|---|---|
| 2006 | 120.0 | 680 | 18.1 |
| 2007 | 120.0 | 680 | 18.1 |
| 2008 | 120.0 | 680 | 18.1 |
| 2009 | 94.8 | 650 | 16.0 |
| 2010 | 82.8 | 762 | 21.5 |
| 2011 | 95.5 | 800 | 22.8 |
| 2012 | 82.5 | 822 | 24.2 |
| 2013 | 118.8 | 907 | 30.8 |
| 2014 | 146.9 | 1121 | 38.1 |
| 2015 | 144.4 | 958 | 37.4 |
| 2016 | 144.0 | 814 | 23.0 |
| 2017 | 140.0 | 795 | 22.5 |
| 2018 | 119.2 | 884 | 19.1 |
Source: 1. Provided by the Fisheries Regulation Division, Fisheries Agency, Council of Agriculture. 2. 2006–2018 Fisheries Annual Reports [25], by Fisheries Agency. Note: 1. The number of tourists includes the number of recreational fisheries. 2. The estimation method of the number of coastal fishery tourists and output value in 2012 is explained as follows: (1) Approximately 825,000 people ride on recreational fishing boats, and the average consumption is NT$ 1600 per person, thus the output value is approximately NT$ 1.32 billion. (2) Tourists in 43 fishery-related festivals, fish direct sales centers (including sightseeing fish markets), and leisure fishing ports total 7.395 million tourists. Based on the average consumption of 145 NT$ per person, the output value approximately infers 1.1 billion NT$. 3. The data for 2006 and 2007 are replaced by the data for 2008.
Table 7.
Domestic private consumption of ornamental fish and surrounding industries (Unit: million NT$).
Table 7.
Domestic private consumption of ornamental fish and surrounding industries (Unit: million NT$).
| Item | Production Value | Import Value | Export Value | Private Consumption |
|---|---|---|---|---|
| (1) | (2) | (3) | (4) = (1) + (2) − (3) | |
| 2011 | ||||
| Fish tanks | 8.1 | 19.5 | 36 | 64.5 |
| Feed | 338.5 | 19.5 | 219 | 139.0 |
| Pumps | 117.0 | 16.5 | 61.5 | 72.0 |
| Motor | 106.5 | 16.5 | 60.0 | 63.0 |
| Filters | 112.5 | 21.0 | 60.0 | 73.5 |
| Lamps | 90.0 | 13.5 | 46.5 | 57.0 |
| Water treatment agents | 54.0 | 22.5 | 27.0 | 49.5 |
| Filter material | 72.0 | 16.5 | 33.0 | 55.5 |
| Water quality detector | 36.0 | 15.0 | 24.0 | 27.0 |
| Temperature control system | 114.0 | 15.0 | 51.0 | 78.0 |
| Culture media | 42.0 | 9.0 | 18.0 | 33.0 |
| Other | 81.0 | 12.0 | 46.5 | 46.5 |
| Total | 1244.5 | 196.5 | 682.5 | 758.5 |
| 2012 | ||||
| Fish tanks | 310.5 | 38.0 | 188.5 | 160.0 |
| Feed | 671.0 | 55.0 | 426.0 | 300.0 |
| Pump | 222.5 | 20.0 | 165.0 | 77.5 |
| Motor | 222.0 | 20.0 | 170.5 | 71.5 |
| Filters | 268.0 | 45.0 | 192.0 | 121.0 |
| Lamps | 240.0 | 15.5 | 181.5 | 74.0 |
| Water treatment agents | 149.0 | 50.0 | 110.0 | 89.0 |
| Filter material | 166.0 | 45.0 | 141.5 | 22569.5 |
| Water quality detector | 66.5 | 15.5 | 44.0 | 38.0 |
| Temperature control system | 96.0 | 15.0 | 41.5 | 69.5 |
| Culture media | 60.0 | 10.0 | 29.0 | 41.0 |
| Other | 96.5 | 40.0 | 80.0 | 56.5 |
| Total | 2568.0 | 369.0 | 1769.5 | 1167.5 |
| 2013–2018 | ||||
| Fish tanks | 475.5 | 82.0 | 251.5 | 306.0 |
| Feed | 751.0 | 55.0 | 481.0 | 325.0 |
| Pump | 207.0 | 20.0 | 165.0 | 62.0 |
| Motor | 207.0 | 20.0 | 170.5 | 56.5 |
| Filters | 231.0 | 45.0 | 187.0 | 89.0 |
| Lamps | 245.0 | 30.5 | 181.5 | 94.0 |
| Water treatment agents | 144.0 | 50.0 | 105.0 | 89.0 |
| Filter material | 181.0 | 30.0 | 141.5 | 69.5 |
| Water quality detector | 66.5 | 15.5 | 44.0 | 38.0 |
| Temperature control system | 99.5 | 15.0 | 36.5 | 78.0 |
| Culture media | 50.0 | 15.0 | 29.0 | 36.0 |
| Other | 101.5 | 35.0 | 75.0 | 61.5 |
| Total | 2759.0 | 413.0 | 1867.5 | 1304.5 |
Source: Provided by Fisheries Regulation Division, Fisheries Agency, Council of Agriculture. Note: 1. The data from 2006 to 2010 is replaced by the data of 2011. 2. The data from 2014 to 2018 is replaced by 2013 data.
Table 8.
The current accounts of the fisheries agency and its affiliated agencies (Unit: NT$).
| Year | Number of Current Accounts in Final Account |
|---|---|
| 2006 | 4,127,928,992 |
| 2007 | 4,612,118,132 |
| 2008 | 4,435,157,496 |
| 2009 | 2,916,968,492 |
| 2010 | 2,824,424,453 |
| 2011 | 3,081,019,100 |
| 2012 | 3,405,292,599 |
| 2013 | 3,499,529,813 |
| 2014 | 3,874,196,345 |
| 2015 | 3,684,114,515 |
| 2016 | 3,610,644,695 |
| 2017 | 2,730,617,110 |
| 2018 | 2,979,016,000 |
Source: Provided by the Chief Accounting Office, Fisheries Agency, Council of Agriculture. Note: The oil subsidy for fishing vessels in 2006 has been moved from the capital account back to the current account.
Table 9.
Fixed capital formation in fisheries. (Unit: NT$).
| 2016 Annual I-O Tables 164 Sectors | 2011 | 2012 | 2013 | 2014 | 2015 | 2016 | 2017 | 2018 | |||
|---|---|---|---|---|---|---|---|---|---|---|---|
| Income from the sale of fixed assets in fisheries: refers to the income from the sale of second-hand and waste fishery and related fixed assets. The assets sold are classified into the following categories according to their nature. | Total | 3,910,279 | 11,440,139 | 9,627,500 | 10,766,393 | 8,239,436 | 5,821,842 | 6,580,661 | 9,100,963 | ||
| 1. Fishery: refers to the fixed assets related to the fishing and aquaculture of aquatic products | (1) Expansion of fish farms and aquatic product conservation: refers to the construction and improvement of fish farms and related facilities, the construction of artificial reefs and the release of artificial incubations, and other aquatic conservation measures. | 118 Other Engineering | 463,277 | 1,115,691 | 498,928 | 3,892,993 | 732,591 | 854,808 | 534,575 | 1,047,895 | |
| (2) Construction of fishing ports and shore equipment: refers to the expansion or maintenance of fishing ports, towing roads, and related shore facilities. | 117 Public construction | 1,480,932 | 1,410,075 | 745,273 | 673,944 | 965,975 | 964,973 | 1,361,415 | 1,946,840 | ||
| (3) Fishing vessel construction and maintenance: refers to the construction of fishing vessels, sampans, fishing rafts, and the modification or maintenance of fishing vessel hulls and basic equipment. | 099 Ships | 1,162,980 | 8,048,630 | 6,304,284 | 4,820,658 | 4,933,648 | 2,921,609 | 3,266,136 | 4,446,251 | ||
| (4) Fishing boat mechanized operation equipment: refers to various equipment related to the mechanized operation of fishing boats and fishery machinery and equipment, etc. | 096 Other special machinery and equipment | - | 445 | - | - | - | - | 1340 | 252 | ||
| (5) Additional fishing gear: refers to the purchase of various fishing and aquaculture equipment with a service life of more than 2 years. | 096 Other special machinery and equipment | 3600 | - | 12,280 | - | - | 694 | 1256 | 119,626 | ||
| (6) Land transportation vehicles: refers to various land transportation vehicles that are needed for fishery production and management, and have been purchased and used, such as automobiles, locomotives, bicycles, trolleys, trailers, etc. | 098 Vehicles | 720 | 57,072 | 2220 | - | 3236 | 1480 | - | 800 | ||
| (7) Others: In addition to items (3) to (6) of this category, machinery and equipment related to fishing and aquaculture. | 096 Other special machinery and equipment | 28,061 | 8888 | 2420 | 866 | 6236 | 54 | 846 | 981 | ||
| 2. Experimental research: refers to the fixed assets related to the experimental research of agriculture, forestry, fishery, and animal husbandry. | Fishery: Refers to the fixed assets used for fishery experimental research. | 087 Precision equipment | 193,162 | 2660 | 965,773 | 57,138 | 406,362 | 71,088 | 56,807 | 130,993 | |
| 3. Aquatic product transportation and marketing: refers to fixed assets related to the transportation and marketing of aquatic products and invested by the agricultural sector. | (1) Fish market and its equipment: refers to the fish market and its related equipment. | 097 General machinery | 76,261 | 123,687 | 148,082 | 84,392 | 165,109 | 126,641 | 94,245 | 260,514 | |
| (2) Transportation tools: refers to the various transportation and marketing tools that are needed for the transportation and marketing of aquatic products, and have been purchased and used, such as automobiles, locomotives, trailers, etc. | 098 Vehicles | 187,447 | 299,319 | 381,894 | 469,671 | 389,379 | 277,342 | 774,869 | 731,386 | ||
| (3) Others: refer to the machinery and equipment related to the transportation and marketing of aquatic products in addition to the fish market and its equipment and means of transportation. | 096 Other special machinery and equipment | 312,489 | 373,672 | 566,346 | 766,731 | 636,900 | 603,153 | 489,172 | 415,425 | ||
| 4. Intangible fixed assets: refers to the purchase of computer software, systems, application software, and database that are expected to be used for more than 2 years, including outsourcing and self-developed software. | 135 Computer System Design Service | 1350 | - | - | - | - | - | - | - | ||
Table 10.
Fixed capital formation of fishing gear. (Unit: NT$).
| Year | Production Value | Export Value | Domestic Private Investment |
|---|---|---|---|
| (1) | (2) | (3) = (1) − (2) | |
| 2006 | 1,003,850 | 896,853 | 106,997 |
| 2007 | 937,932 | 791,258 | 146,674 |
| 2008 | 937,334 | 697,735 | 239,599 |
| 2009 | 762,087 | 588,372 | 173,715 |
| 2010 | 916,846 | 646,501 | 270,345 |
| 2011 | 932,970 | 686,436 | 246,534 |
| 2012 | 1,165,028 | 773,410 | 391,618 |
| 2013 | 1,277,477 | 736,327 | 541,150 |
| 2014 | 1,262,427 | 663,633 | 598,794 |
| 2015 | 1,200,584 | 694,657 | 505,927 |
| 2016 | 1,154,607 | 694,416 | 460,191 |
| 2017 | 1,316,732 | 655,311 | 661,421 |
| 2018 | 1,415,339 | 689,746 | 725,593 |
Source: Industrial production, shipment, and inventory activity survey by the Department of Statistics, the Ministry of Economic Affairs (https://dmz26.moea.gov.tw/GMWeb/investigate/InvestigateDA.aspx, accessed on 15 December 2021).
Table 11.
Changes in aquatic product inventory (Unit: NT$).
| Year | Frozen Aquatic Food | Canned Aquatic Products |
|---|---|---|
| 2006 | −14,345 | −12,778 |
| 2007 | 10,508 | 13,544 |
| 2008 | 231,414 | 9705 |
| 2009 | −53,748 | −10,611 |
| 2010 | 61,392 | 31,901 |
| 2011 | 4862 | 20,976 |
| 2012 | −211,536 | −22,511 |
| 2013 | −125,038 | 20,116 |
| 2014 | 321,281 | 123,951 |
| 2015 | −278,294 | −175,119 |
| 2016 | −96,367 | 31,446 |
| 2017 | 93,076 | −9200 |
| 2018 | 78,106 | 79,025 |
Source: 1. Ministry of Economic Affairs website, Industrial Production Statistics Monthly Report (2006–2018). 2. Industrial production, shipment and inventory activity survey by the Department of Statistics, the Ministry of Economic Affairs (https://dmz26.moea.gov.tw/GMWeb/investigate/InvestigateDA.aspx, accessed on 15 December 2021).
Table 12.
Fishery customs export. (Unit: million NT$).
| Year | Amount |
|---|---|
| 2006 | 39,227 |
| 2007 | 39,470 |
| 2008 | 46,955 |
| 2009 | 38,380 |
| 2010 | 46,672 |
| 2011 | 53,372 |
| 2012 | 59,379 |
| 2013 | 53,506 |
| 2014 | 51,925 |
| 2015 | 46,301 |
| 2016 | 46,573 |
| 2017 | 53,331 |
| 2018 | 55,956 |
Source: Import and export trade statistics by customs of the Republic of China (Taiwan).
Table 13.
Statistics on confiscated smuggled fishery products (non-tradable part).
| Weight (Kg.) | Fishery Production (metric ton) | Fishery Production Value (thousand NT$) | Average Unit Price (thousand NT$/metric ton) | Total Value (million NT$) | |
|---|---|---|---|---|---|
| 2006 | 290,716 | 1,262,265 | 84,854,941 | 67.2 | 20 |
| 2007 | 5,498,925 | 1,503,701 | 95,795,157 | 63.7 | 350 |
| 2008 | 6,173,473 | 1,341,636 | 92,144,819 | 68.7 | 424 |
| 2009 | 83,499 | 1,090,218 | 85,588,818 | 78.5 | 7 |
| 2010 | 64,532 | 1,169,824 | 92,576,485 | 79.1 | 5 |
| 2011 | 9076 | 1,222,655 | 106,321,684 | 87.0 | 1 |
| 2012 | 51,984 | 1,256,082 | 105,842,685 | 84.3 | 4 |
| 2013 | 47,915 | 1,274,282 | 101,649,634 | 79.8 | 4 |
| 2014 | 31,477 | 1,407,622 | 104,279,897 | 74.1 | 2 |
| 2015 | 282,366 | 1,299,261 | 92,393,328 | 71.1 | 20 |
| 2016 | 131,197 | 1,005,279 | 86,709,902 | 86.3 | 11 |
| 2017 | 117,066 | 1,029,723 | 90,617,129 | 88.0 | 10 |
| 2018 | 122,994 | 1,089,382 | 89,338,279 | 82.0 | 10 |
Source: 1. Coast guard annual statistical report, by Coast Guard Administration. 2. Fishery statistics annual report [24], by Fisheries Agency. Note: 1. Average unit price of fishery = fishery production value/fishery production in the annual fishery statistics report. 2. The total value is calculated based on the average unit price of the fishery weight
Table 14.
Economic benefits of yacht activities to Taiwan’s fishing ports.
| 2016 Annual Input-Output Tables Sector Classification | Income or Output Value Item | Value (Million NT$) | ||
|---|---|---|---|---|
| 141 | Real estate management and related services | Estimation of income from berths at Wushi Fishing Port Yacht Wharf (original pricing method) | 50.70 | |
| 141 | Real estate management and related services | Estimated income from berths at Bisha Yacht Wharf in Badouzi Fishing Port (original pricing method) | 124.37 | |
| 141 | Real estate management and related services | Estimated income from berths at Anping Fishing Port Yacht Wharf (original pricing method) | 90.83 | |
| 141 | Real estate management and related services | Estimated income from berths at Wushi Fishing Port Yacht Wharf (recommended pricing method) | 477.69 | |
| 141 | Real estate management and related services | Estimated income from berths at Bisha Yacht Wharf in Badouzi Fishing Port (Recommended Valuation Method) | 1166.96 | |
| 141 | Real estate management and related services | Estimated income from berths at Anping Fishing Port Yacht Wharf (recommended pricing method) | 855.04 | |
| 099 | Ships and floating facilities | Estimated output value of yacht periodic inspection costs | 122.62 | |
| 155 | Public administration and national defense; compulsory social security | Estimated output value of power boat driver’s license cost | 37.69 | |
| 099 | Ships and floating facilities | Yacht manufacturing service industry output value estimation | 236.53 | |
| 099 | Ships and floating facilities | Yacht service management company’s output value | Conservative | Optimistic |
| 382.62 | 760.95 | |||
| 159 | Arts, entertainment, and leisure services | Estimation of Economic Benefits of Keelung Regatta in 102 | 4.93 | |
| 159 | Arts, entertainment, and leisure services | Estimated output value of yacht activities and sightseeing consumption | 7.84 | |
| 156 | Education | Yachting activities, related education, and training output value estimation | Conservative | Optimistic |
| 43.59 | 46.85 | |||
| Conservative total | 3601.41 | |||
| Optimistic total | 3983.00 | |||
Source: [26].
Table 15.
The values added created by fisheries and related industries and their proportions in GDP —Using (I-AD)-1 matrix calculation, from 2011 to 2018. (Units: in million NT$ for the first segment; in % for the second segment).
Table 15.
The values added created by fisheries and related industries and their proportions in GDP —Using (I-AD)-1 matrix calculation, from 2011 to 2018. (Units: in million NT$ for the first segment; in % for the second segment).
| 2011 | 2012 | 2013 | 2014 | 2015 | 2016 | 2017 | 2018 | |
|---|---|---|---|---|---|---|---|---|
| Primary fishery sector (1–11) | 247,587 | 247,313 | 264,418 | 302,781 | 298,855 | 327,502 | 328,835 | 312,562 |
| Fishery input sector | 98,278 | 112,728 | 101,544 | 115,660 | 107,642 | 102,022 | 111,130 | 117,336 |
| Mining (12–13) | 2145 | 2386 | 1980 | 2366 | 2156 | 2082 | 2335 | 2622 |
| Material manufacturing (30–106) | 2145 | 2386 | 1980 | 2366 | 2156 | 2082 | 2335 | 2622 |
| Hydropower construction (106–118) | 16,158 | 19,972 | 17,517 | 20,409 | 18,264 | 17,186 | 18,867 | 20,455 |
| Financial services (137–141) | 8219 | 9529 | 8350 | 10,275 | 8926 | 8591 | 9344 | 10,073 |
| Business advertising service (131–136, 142–164) | 8805 | 9893 | 8975 | 10,028 | 9539 | 9092 | 9911 | 10,340 |
| Fishery product processing sector | 15,016 | 17,956 | 16,115 | 17,840 | 16,159 | 15,702 | 17,539 | 18,459 |
| Food (14–26, 28) | 14,852 | 17,771 | 15,948 | 17,653 | 15,982 | 15,533 | 17,354 | 18,266 |
| Tobacco and alcohol (27, 29) | 163 | 185 | 167 | 187 | 176 | 169 | 184 | 193 |
| Transportation and sale service sector | 61,913 | 69,437 | 63,054 | 70,303 | 67,088 | 63,883 | 69,666 | 72,523 |
| Transport warehousing (122–128) | 19,855 | 22,493 | 20,343 | 22,742 | 21,443 | 20,568 | 22,376 | 23,519 |
| Wholesale and retail (119–121) | 40,140 | 44,776 | 40,749 | 45,368 | 43,576 | 41,328 | 45,133 | 46,736 |
| Catering services (130) | 807 | 912 | 825 | 922 | 871 | 836 | 908 | 954 |
| Hotel service (129) | 1111 | 1257 | 1137 | 1271 | 1198 | 1152 | 1250 | 1315 |
| Total | 422,793 | 447,434 | 445,131 | 506,584 | 489,744 | 509,109 | 527,169 | 520,881 |
| Primary fishery sector (1–11) | 1.74 | 1.68 | 1.73 | 1.86 | 1.75 | 1.87 | 1.83 | 1.70 |
| Fishery input sector | 0.69 | 0.77 | 0.66 | 0.71 | 0.63 | 0.58 | 0.62 | 0.64 |
| Mining (12–13) | 0.02 | 0.02 | 0.01 | 0.01 | 0.01 | 0.01 | 0.01 | 0.01 |
| Material Manufacturing (30–106) | 0.11 | 0.14 | 0.11 | 0.13 | 0.11 | 0.10 | 0.10 | 0.11 |
| Hydropower construction (106–118) | 0.06 | 0.06 | 0.05 | 0.06 | 0.05 | 0.05 | 0.05 | 0.05 |
| Financial services (137–141) | 0.06 | 0.07 | 0.06 | 0.06 | 0.06 | 0.05 | 0.06 | 0.06 |
| Business advertising service (131–136, 142–164) | 0.44 | 0.48 | 0.42 | 0.45 | 0.40 | 0.37 | 0.39 | 0.40 |
| Fishery product processing sector | 0.10 | 0.12 | 0.11 | 0.11 | 0.09 | 0.09 | 0.10 | 0.10 |
| Transportation and sale service sector | 0.43 | 0.47 | 0.41 | 0.43 | 0.39 | 0.36 | 0.39 | 0.40 |
| Transport warehousing (122–128) | 0.14 | 0.15 | 0.13 | 0.14 | 0.13 | 0.12 | 0.12 | 0.13 |
| Wholesale and retail (119–121) | 0.28 | 0.31 | 0.27 | 0.28 | 0.26 | 0.24 | 0.25 | 0.25 |
| Catering services (130) | 0.01 | 0.01 | 0.01 | 0.01 | 0.01 | 0.00 | 0.01 | 0.01 |
| Hotel service (129) | 0.01 | 0.01 | 0.01 | 0.01 | 0.01 | 0.01 | 0.01 | 0.01 |
| Total | 2.96 | 3.05 | 2.91 | 3.11 | 2.87 | 2.90 | 2.93 | 2.84 |
Source: Computed in this study. Note: 1. GDP from 2011 to 2018 is calculated based on the newly revised GDP from 2011 to 2018 by the Directorate-General of Budget, Accounting and Statistics, Executive Yuan on November 29, 2019. 2. The primary fishery sector (1–11) in the table includes agriculture, forestry, fishery, and animal husbandry in the primary industries, and the fishery input sector includes mining, material manufacturing, hydropower construction in the secondary industry, and financial services and business advertising service in the tertiary industry. Fishery product processing industry includes food manufacturing in the secondary industry. Transportation and sale service sector includes transportation and storage, wholesale and retail, catering services, and hotel services in the tertiary industry.
Publisher’s Note: MDPI stays neutral with regard to jurisdictional claims in published maps and institutional affiliations. |
© 2022 by the authors. Licensee MDPI, Basel, Switzerland. This article is an open access article distributed under the terms and conditions of the Creative Commons Attribution (CC BY) license (https://creativecommons.org/licenses/by/4.0/).
Share and Cite
MDPI and ACS Style
Yang, T.-Y.; Lin, H.-C.; Liu, W.-H. The Fishery Value Chain Analysis in Taiwan. Fishes 2022, 7, 114. https://doi.org/10.3390/fishes7030114
AMA Style
Yang T-Y, Lin H-C, Liu W-H. The Fishery Value Chain Analysis in Taiwan. Fishes. 2022; 7(3):114. https://doi.org/10.3390/fishes7030114
Chicago/Turabian StyleYang, Tsung-Yu, Hsing-Chun Lin, and Wen-Hong Liu. 2022. "The Fishery Value Chain Analysis in Taiwan" Fishes 7, no. 3: 114. https://doi.org/10.3390/fishes7030114