Article

Functional Characterization and Molecular Marker Development of the Proenkephalin as Biomarker of Food Addiction in Food Habit Domestication of Mandarin Fish (Siniperca chuatsi)

1
Chinese Perch Research Center, College of Fisheries, Huazhong Agricultural University, Wuhan 430070, China
2
Engineering Research Center of Green Development for Conventional Aquatic Biological Industry in the Yangtze River Economic Belt, Ministry of Education, Wuhan 430070, China
*
Author to whom correspondence should be addressed.
Fishes 2022, 7(3), 118; https://doi.org/10.3390/fishes7030118
Submission received: 24 April 2022 / Revised: 21 May 2022 / Accepted: 24 May 2022 / Published: 27 May 2022
(This article belongs to the Special Issue Advances in Nutrition and Feeding of Fish)

Abstract

:
Proenkephalin (PENK), as the precursor of endogenous opioid enkephalin (ENK), is widely present in the nervous system and plays an important role in animal food addiction and rewarding behavior. In our study, we intend to study the functional characterization and molecular marker development of the penk gene related to food habit domestication of mandarin fish. We found that the penk gene of mandarin fish had three types of endogenous opioid peptide sequences. Compared with other tissues, penk mRNA was highly expressed in the whole brain. Intracerebroventricular (ICV) injection of lysine or methionine significantly increased the expression of penk mRNA. The expression of penk mRNA in the brain of mandarin fish that could be easily domesticated from eating live prey fish to artificial diets was significantly higher than those that could not. After feeding with high-carbohydrate artificial diets, the expression of penk mRNA showed no significant difference between mandarin fish with hypophagia and those that still ate normally. A total of four single nucleotide polymorphisms (SNP) loci related to easy domestication toward eating artificial diets were screened from the mandarin fish population. Additionally, the TT genotype at one of the loci was significantly correlated with the food habit domestication of mandarin fish.

1. Introduction

As the precursor of enkephalin (ENK), proenkephalin (PENK) is processed into the endogenous pentapeptides Leu-enkephalin (LEK) and Met-enkephalin (MEK), the heptapeptide Met-enkephalin-arg6-phe7 [1], the octapeptide Met-enkephalin-arg6-gly7-leu8 [2], and the E peptide [3] by enzymatic cleavage. The MEK, LEK, and E peptide found in zebrafish and African lungfish are all highly conserved with humans [4]. PENK is widely present in various tissues through tissue-specific processing [5,6] as a neurotransmitter and neuromodulator. It acts with opioid receptors to induce physiological effects, such as food intake, rewarding behavior, learning, memory, and thermoregulation [7,8].
It is well known that food addiction (FA) is caused by inhibiting negative reward circuits and by activating positive reward circuits, and that addiction is closely related to the mesolimbic dopamine system [9,10]. Reward dysfunction and emotional dysregulation are fundamental mechanisms that trigger food addiction in animals [11]. Many genes are identified that affect food addiction, such as FTO, ADH1B, CHRNA, ALDH2, POMC, PENK, etc. [12,13]. Opioids activate μ-opioid receptors, inhibit GABAergic neurons, and release VTA dopaminergic neurons, thereby increasing dopamine release [14]. PENK-derived ENKs act as endogenous ligands for δ- and μ-opioid receptors, which may be involved in emotion regulation activities, such as euphoria, and rewarding behavior [15,16]. Studies have shown that the PENK gene is involved in addiction and rewarding behavior [17,18]. Although the positive neurons of Mek and Lek have been significantly detected in the nervous system of African lungfish [19], Penk has not been extensively characterized in mandarin fish.
Mandarin fish is an important freshwater fish in China and has a very peculiar food preference. In the wild or in reared conditions, they only eat live fry fish and reject dead fish or artificial feed [20], which seriously restricts the sustainable development of the mandarin fish aquaculture. The feeding preference of mandarin fish is similar to FA, and we speculate that the penk gene might be related to the food habit domestication of mandarin fish from live prey fish to dead prey fish. There were individual differences in the food habit domestication of mandarin fish [21]. Among the mandarin fish populations with different abilities of domestication to artificial diets, there were significant differences in gene expression in multiple pathways such as appetite control, learning, and memory [22].
Research on addiction by analyzing the single nucleotide polymorphism of the protein-encoding PENK gene has been increasing in recent years [23]. Identifying the SNP loci of the penk gene related to the feeding habit domestication of mandarin fish has important theoretical and practical significance for mandarin fish aquaculture with artificial diets. Therefore, this project intends to study the molecular characteristics of the penk gene, its gene expression level, and SNP loci related to food habit domestication.

2. Materials and Methods

2.1. PENK Gene Structure and Synteny Analysis

By comparing and analyzing the DNA and cDNA sequences of PENK gene, the exon and intron segments were distinguished. In order to determine the homology relationship of PENK genes between mandarin fish and other species, we searched for the PENK gene of mandarin fish, human, mouse, zebrafish, and European seabass in the mandarin fish database (http://genomes.igb-berlin.de/cgi-bin/hgGateway?db=sinChu7 (accessed on 23 April 2021)), the Ensembl database (http://asia.ensembl.org/index.html(accessed on 26 April 2021)), the NCBI website (http://www.ncbi.nlm.nih.gov/mapview/(accessed on 27 April 2021)), and the European seabass database (http://genomes.igb-berlin.de/cgi-bin/hgGateway?db=dicLab1(accessed on 28 April 2021)). A synlinear analysis was carried out together with mandarin fish at the same time. Amino acid sequence alignments were analyzed with Jalview software. Table 1 lists the amino acid sequences of the PENK gene in different species. All amino acid sequences were used for a phylogenetic analysis of the PENK gene.

2.2. Experimental Fish and Experimental Approach

2.2.1. The Origin of Experimental Fish

The experimental mandarin fish were provided by the Mandarin Fish Research Center of Huazhong Agricultural University, which were transferred to the circulating aquaculture system for 2 weeks to adapt to the culture environment used in the experiment in advance. The fish were raised under constant temperature conditions (25 ± 0.5 °C) in the aquarium. During the culture process, the dissolved oxygen was 7.26–7.86 mg/L and the pH was 7.11–7.59. In order to analyze the distribution of the penk gene in various tissues of mandarin fish, the tissues of brain, intestine, liver, spleen, muscle and head kidney of six fish were randomly taken out, frozen with liquid nitrogen, and stored at −80 °C.

2.2.2. The Experimental Approach of Intracerebroventricular Injection of Amino Acid

The fish samples used in the experiments were derived from previous studies [24,25]. After the mandarin fish has adapted to the culture environment, 96 mandarin fish (40 ± 4 g) were selected and randomly divided into eight groups (n = 12/group), and each tank (40 cm × 50 cm × 40 cm) only held one mandarin fish. Fish injected with 2 µL of phosphate-buffered saline (PBS) were used as the control group, and the experimental group was injected with 20 µg of histidine, lysine, tryptophan, methionine, phenylalanine, threonine, and arginine (all dissolved in 2 µL PBS). The fish were anesthetized with MS-222 (200 mg/L, dissolved in water) (Redmond, WA, USA) until loss of equilibrium and then carried out for injection at 9:00 a.m. The ICV injection was performed in accordance with the methods described previously [26] using a 25 µL Hamilton microsyringe (Hamilton, Reno, NV, USA). After the injection, the mandarin fish were put into the aerated water, and then immediately returned into the test tank and fed with 20 Cirrhinus mrigala juvenile fish (body weight 0.35 ± 0.05 g) for each tank. The average weight of 20 prey fish was recorded in each experimental group. The food intake at 1, 4, 8, 12, and 24 h after injection was accurately determined by accurately counting the number of prey fish consumed, and then, the number of prey fish was converted into the total weight of food intake. The ratio of the quantity of the bait fish to the quantity of the mandarin fish represented the food intake of the single-tailed mandarin fish (g/g). Through the previous results [25], there were significant differences in the food intake of mandarin fish in each group at 12 h after amino acid injection, and we detected the expression of penk mRNA after ICV injection for 12 h.

2.2.3. The Experimental Approach of Food Habit Domestication

The fish samples used in this experiment were all from previous experiments [27]. The mandarin fish (69.9 ± 10.2 g) were domesticated and fed with artificial diets (Supplementary File S1) for 18 days. All the fish were fed in the morning and evening every day, and the amount of artificial diets was 4% of the total weight of the mandarin fish. The specific domestication steps were as follows [27]: (1) All of the mandarin fish were fed with live fish prey for three days, starved for two days, and fed with artificial diets for one day. According to whether the mandarin fish ate artificial diets, mandarin fish were divided into two groups [28]: fish that did not eat artificial diets and fish that could be easily domesticated to eat artificial diets. (2) The fish which did not eat artificial diets were fed with live fish prey for three days, starved for two days, and fed with artificial diets for one day. The fish which ate artificial diets were fed with live fish prey for one day and fed with artificial diets for three days. (3) We further screened out the fish that eat artificial feed and repeated the second domestication process one more time. In the end, we obtained two groups of fish: those that did not eat artificial diets and those that could be easily domesticated toward eating artificial diets after the three domestication processes, named the W (n = 56) and the X (n = 25) groups, respectively. The brains of six fish were randomly selected from the two groups for real-time quantitative PCR detection. At the same time, the caudal fins of some fish were selected from group W (n = 30) and group X (n = 25) for molecular marker development.

2.2.4. The Experimental Approach of High-Carbohydrate Artificial Diet Feeding

The fish samples used in this experiment were all from previous experiments [29], and 135 mandarin fish (50 ± 5 g) were domesticated to feed on the high-starch (8%) artificial diets with a quantity of 4% of the total fish weight following the domestication methods [27]. After 61 days of continuous feeding, the mandarin fish that still ingested normally during the whole feeding period were named the normal group (n = 17), and that for which food intake was reduced to 1/2 or even no diet for 5 consecutive days were named the hypophagic group (n = 8). The entire experiment lasted two months. To eliminate the effect of starvation on mRNA and protein expression levels, each group of mandarin fish was fed live prey fish before sampling. After that, the brains of six fish were randomly selected from each of the two groups for RT-PCR detection.

2.2.5. The Preservation of Sample of Each Experimental Treatment

After all experimental processing was completed, the experimental fish were anesthetized with MS-222 (200 mg/L, dissolved in water) (Redmond, WA, USA). The tissues of the brain were immediately removed and individually frozen in liquid nitrogen upon surgical resection and stored at −80 °C until use. We then cut 0.5 mg of the caudal fin ray tissue of groups W (n = 30) and X (n = 25), respectively, immersed them in 95% alcohol, and stored them at −20 °C for molecular marker development. The animal protocol was approved by the Institutional Animal Care and Use Ethics Committee of Huazhong Agricultural University (Wuhan, China) (HZAUFI-2022-0006).

2.3. RNA Isolation and Reverse Transcription

Total RNA was isolated from each tissue with using the Trizol® Reagent (TaKaRa, Tokyo, Japan) and subjected to concentration determination by a multiple detection microplate reader (BioTek, Winooski, VT, USA). Then, we added 30–50 µL of RNase-free water to dissolve the RNA completely. The Revert AidTM Reverse Transcriptase (TaKaRa, Tokyo, Japan) was used for the synthesis of the complementary DNA (cDNA), and 1 µg of RNA was used to prepare the cDNA each time. The protocols were performed in strict accordance with the manufacturer’s instructions. After the reaction, the cDNA was stored at −20 °C or the next reaction was performed.

2.4. Real-Time Quantitative PCR

According to the literature [30], the potential housekeeping genes beta-actin, b2m, rpl13a, and hmbs of mandarin fish were examined in five tissue samples. We determined the expression stability of control genes based on non-normalized expression levels. M was the average pairwise variation of a specific gene with all other control genes. The gene with the lowest M value was the most stable. Therefore, the rpl13 gene was more stable and selected as the internal reference gene. Table 2 lists the primer sequences of the penk gene and the rpl13 gene. The primer synthesis work was completed by Shanghai Sangon Biotechnology Co., Ltd. (Shanghai, China). The primer efficiency for each assay was all above 95%. Real-time quantitative PCR was performed with a MyiQTM 2 Two-Color Real-Time PCR Detection System (Bio-Rad, Hercules, CA, USA) following the methods described by Liang et al. [31], and 1 µL of mandarin fish brain tissue cDNA was used as a template each time. The whole process had a total of 39 cycles. After each cycle, the fluorescence intensity signal was collected once. Finally, the target gene expression relative to rpl13a expression was calculated using the optimized comparative Ct (2−△△Ct) value method [32], and each sample was repeated three times. The data from six biological replicates are presented as mean ± S.E.M.

2.5. Statistical Analysis

The quantitative data of this experiment were statistically analyzed by SPSS19.0 software. The normality and homogeneity of variances were analyzed using the Shapiro–Wilk test and Levene’s test, respectively. Significant differences were found by one-way analysis of variance (ANOVA), followed by Duncan’s multiple range test and Tukey’s B test. The difference with p < 0.05 was considered statistically significant.

2.6. Association Analysis of penk Gene and Domestication Traits in Mandarin Fish

2.6.1. Genomic DNA Extraction and Primer Design

The genomic DNA of the sampled fish caudal fins (group W: n = 30, group X: n = 25) was extracted according to the DNA extraction kit (Tiangen, Beijing, China) and subjected to concentration determination by a multiple detection microplate reader (BioTek, Winooski, VT, USA). The DNA purity was detected by 1.5% agarose gel. The DNA concentration was adjusted to 100 ng/µL and stored at −20 °C.
The whole genomic sequence of mandarin fish penk gene had a total of 3057 bp and was divided into three parts in turn during PCR amplification. The Primer Premier 5.0 was used to design three pairs of specific primers for the flanking sequence regions of the penk gene sequence (Table 2), named penk-1, penk-2, and penk-3, respectively. The primer synthesis work was completed by Shanghai Sangon Biotechnology Co., Ltd. (Shanghai, China).

2.6.2. Screening and Typing of SNP Loci

First, we randomly selected the DNA of 12 mandarin fish from group W and group X each for PCR amplification. Gene sequencing was performed after mixing each of the three PCR products. When the potential SNPs were different among the 12 randomly selected mandarin fish, the remaining 18 mandarin fish were also subjected to PCR amplification, and the individual SNP genotypes were analyzed by sequencing. The sequence information obtained was analyzed by SeqMan software for peak reading. Clustal W software was used for sequence multiple alignment analysis. The genotypes of the loci of each individual were recorded and analyzed using DNAStar software.

2.6.3. Association Analysis of penk Gene and Domestication Trait in Mandarin Fish

The effective allele numbers (Ne), observed heterozygosity (Ho), expected heterozygosity (He), and Hardy–Weinberg equilibrium (HWE) were calculated by using PopGene software. The polymorphism information content (PIC) of the site was calculated according to the method of Bostein et al. [33]. Among them, PIC >0.5 represents high polymorphism, 0.25 < PIC < 0.5 represents moderate polymorphism, and PIC < 0.25 represents low polymorphism. SPSS 19.0 software was used for data processing, and a Chi-square test was used to analyze the correlation between SNP genotypes and individual differences in mandarin fish domestication. When the total sample size (n) ≥ 40 and the total theoretical number (T) ≥ 5, we used the ordinary chi-square test; when n ≥ 40 but with 1 ≤ T < 5, we used the Yates continuity-corrected chi-square test; and when T < 1 or n < 40, we used Fisher’s exact probability method to directly calculate the probability. The Pearson chi-square value (Pearson χ2) was greater than 2.706/3.841/6.635/10.828, and there was a 90%/95%/99%/99.9% possibility to prove that the two were related. The test result p < 0.05 indicated that there was a significant correlation between them. The strength of the correlation was correlated with the absolute value of the correlation coefficient (r). The interim values of the correlation coefficient were interpreted by convention, so values > 0.70 was regarded as a “strong” correlation, values between 0.50 and 0.70 were interpreted as a “good” correlation, values between 0.30 and 0.50 were treated as a “moderate” correlation, and any value < 0.30 was considered a poor correlation [34]. Additionally, the transcription factor prediction in the intronic region of the mandarin fish penk gene were the analyzed with JASPER website (https://jaspar.genereg.net/ (accessed on 8 December 2021)), and the relative profile score threshold was 95%.

3. Results

3.1. Bioinformatics Analysis of the PENK Gene

The PENK genes structure analysis of the different species showed that, except for the zebrafish, the PENK genes of the other species we studied were single-copy (Figure 1A). penk of mandarin fish was encoded by 246 amino acids, with two exons and one intron, which was consistent with the gene structure of the mouse. The Penk of mandarin fish was 37–87% similar to fish and 2–31% to mammals. The multiple alignments of the amino acid sequence illustrated that there were seven opioid core motifs in PENK of human, mouse, and zebrafish, which appeared in the form of four MEK repeat sequences, an octapeptide, a heptapeptide, and a LEK (Figure 1B). However, there were only three Mek repeats, a Met-enkephalin-Ser (YGGFMS), and a Met-enkephalin-Asp (YGGFMD) in the PENK of mandarin fish and other species. As prohormone convertases, basic dipeptide repeats were also presented in the sequenced species [35]. The most abundant cleavage sites in the sequence were 35 of the 70 cleavage sites (50%), as determined by the Lys-Arg (KR) motif. Lys-Lys (KK) and Arg-Arg (RR) dinucleotide repeats were also frequent, with 14 and 21 of the 70 sites (20% and 30%), respectively. Except for the first MEK site, which was KK, the cleavage sites at the n-terminus of almost all ENKs units in PENK were KR. According to the phylogenetic tree of PENK obtained in this study, mandarin fish was closely related to European seabass and the green spotted puffer (Figure 1C). In the synteny analysis, they all had the SDR16C5 gene upstream in all of the species we detected (Figure 1D). Additionally, the SLC44A5 gene was all found upstream of the penk gene in mandarin fish, European seabass, and zebrafish.

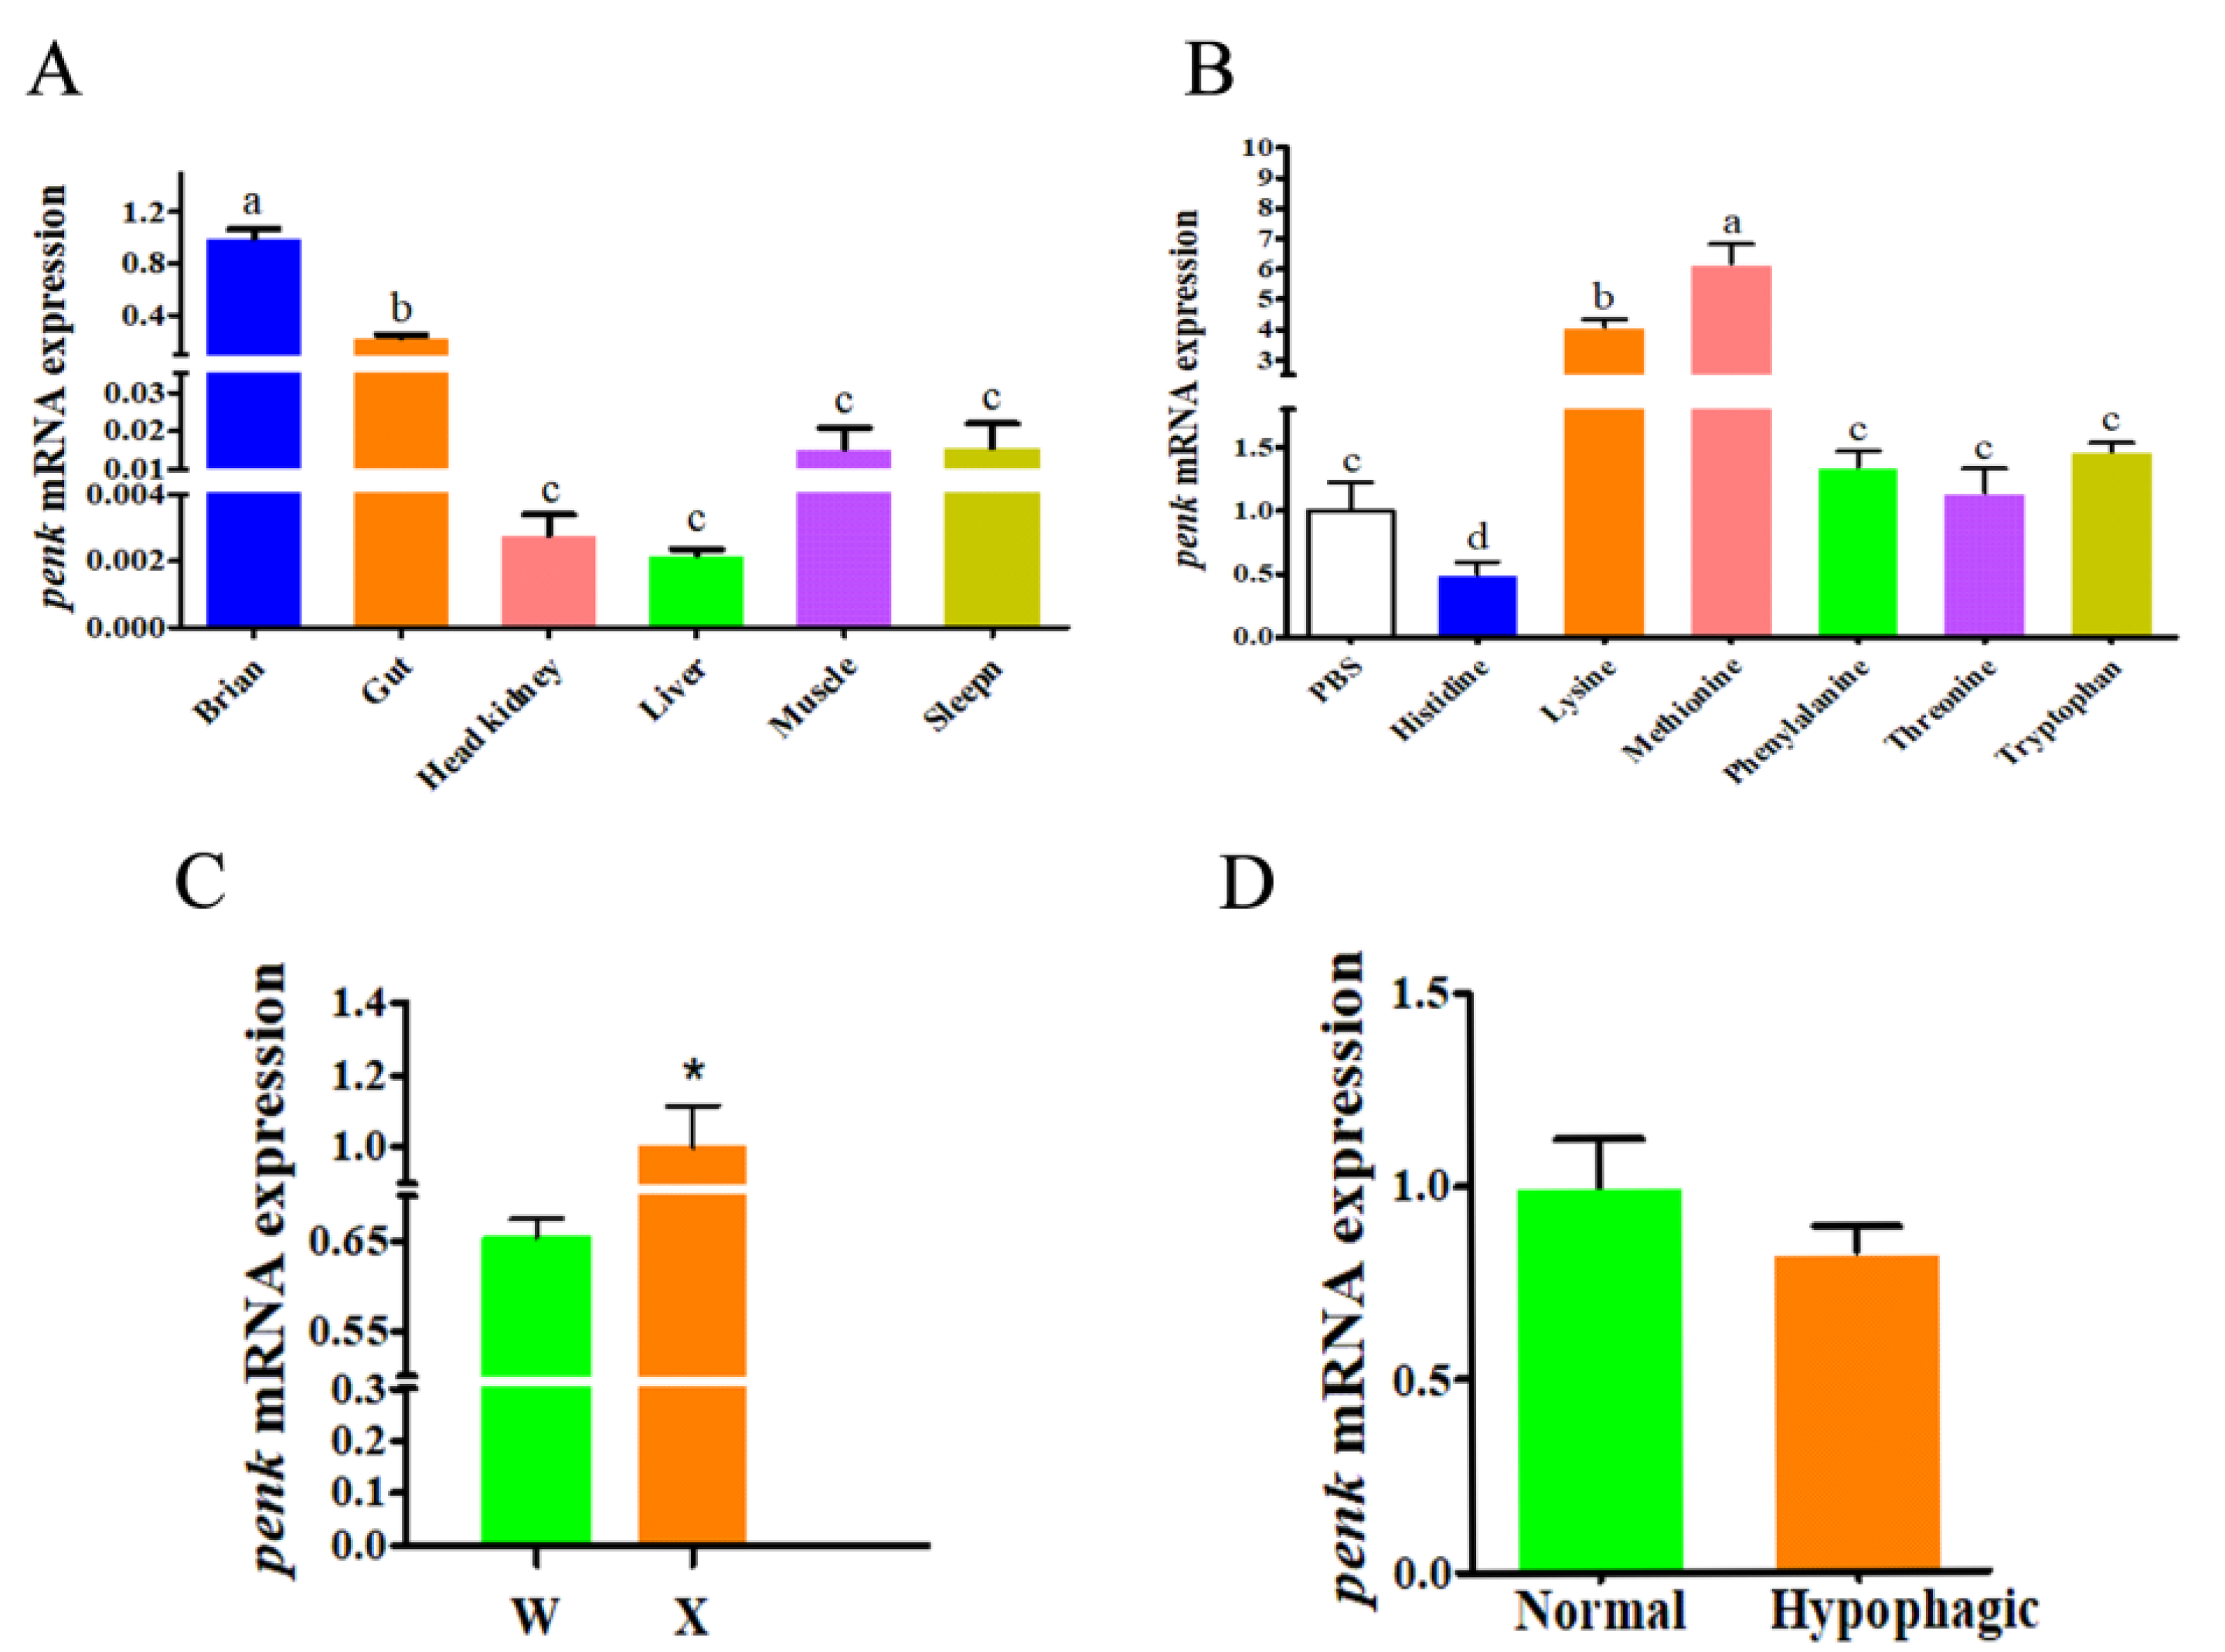
3.2. RT-PCR Analysis of the penk Gene in Mandarin Fish

The RT-PCR experiments revealed that the PENK gene was expressed in every tissue of all the examined mandarin fish, including in the brain, the intestine, muscles, the head kidney, the spleen, and the liver (Figure 2A). The strongest signal was seen for the brain, which was significantly higher than in the other tissues (p < 0.05). When studying the relationship between the penk gene and food intake of mandarin fish, the expression of penk mRNA in the brain was significantly increased after an ICV injection of Lys or Met (p < 0.05) and was significantly decreased after a His injection (p < 0.05) (Figure 2B). By interrogating the relationship and difference of the penk gene expression in mandarin fish with different domestication abilities (Figure 2C), we found that the penk mRNA expression in the brain of group X, was significantly higher than the group W (p < 0.05). In order to study the role of the penk gene in the hypophagic induced by high-carbohydrate artificial diets feeding in fish, we detected the expression of penk mRNA in the brain of the hypophagic group and the normal group (Figure 2D), and a decrease was seen in the hypophagic group, but it showed no significant difference (p > 0.05).

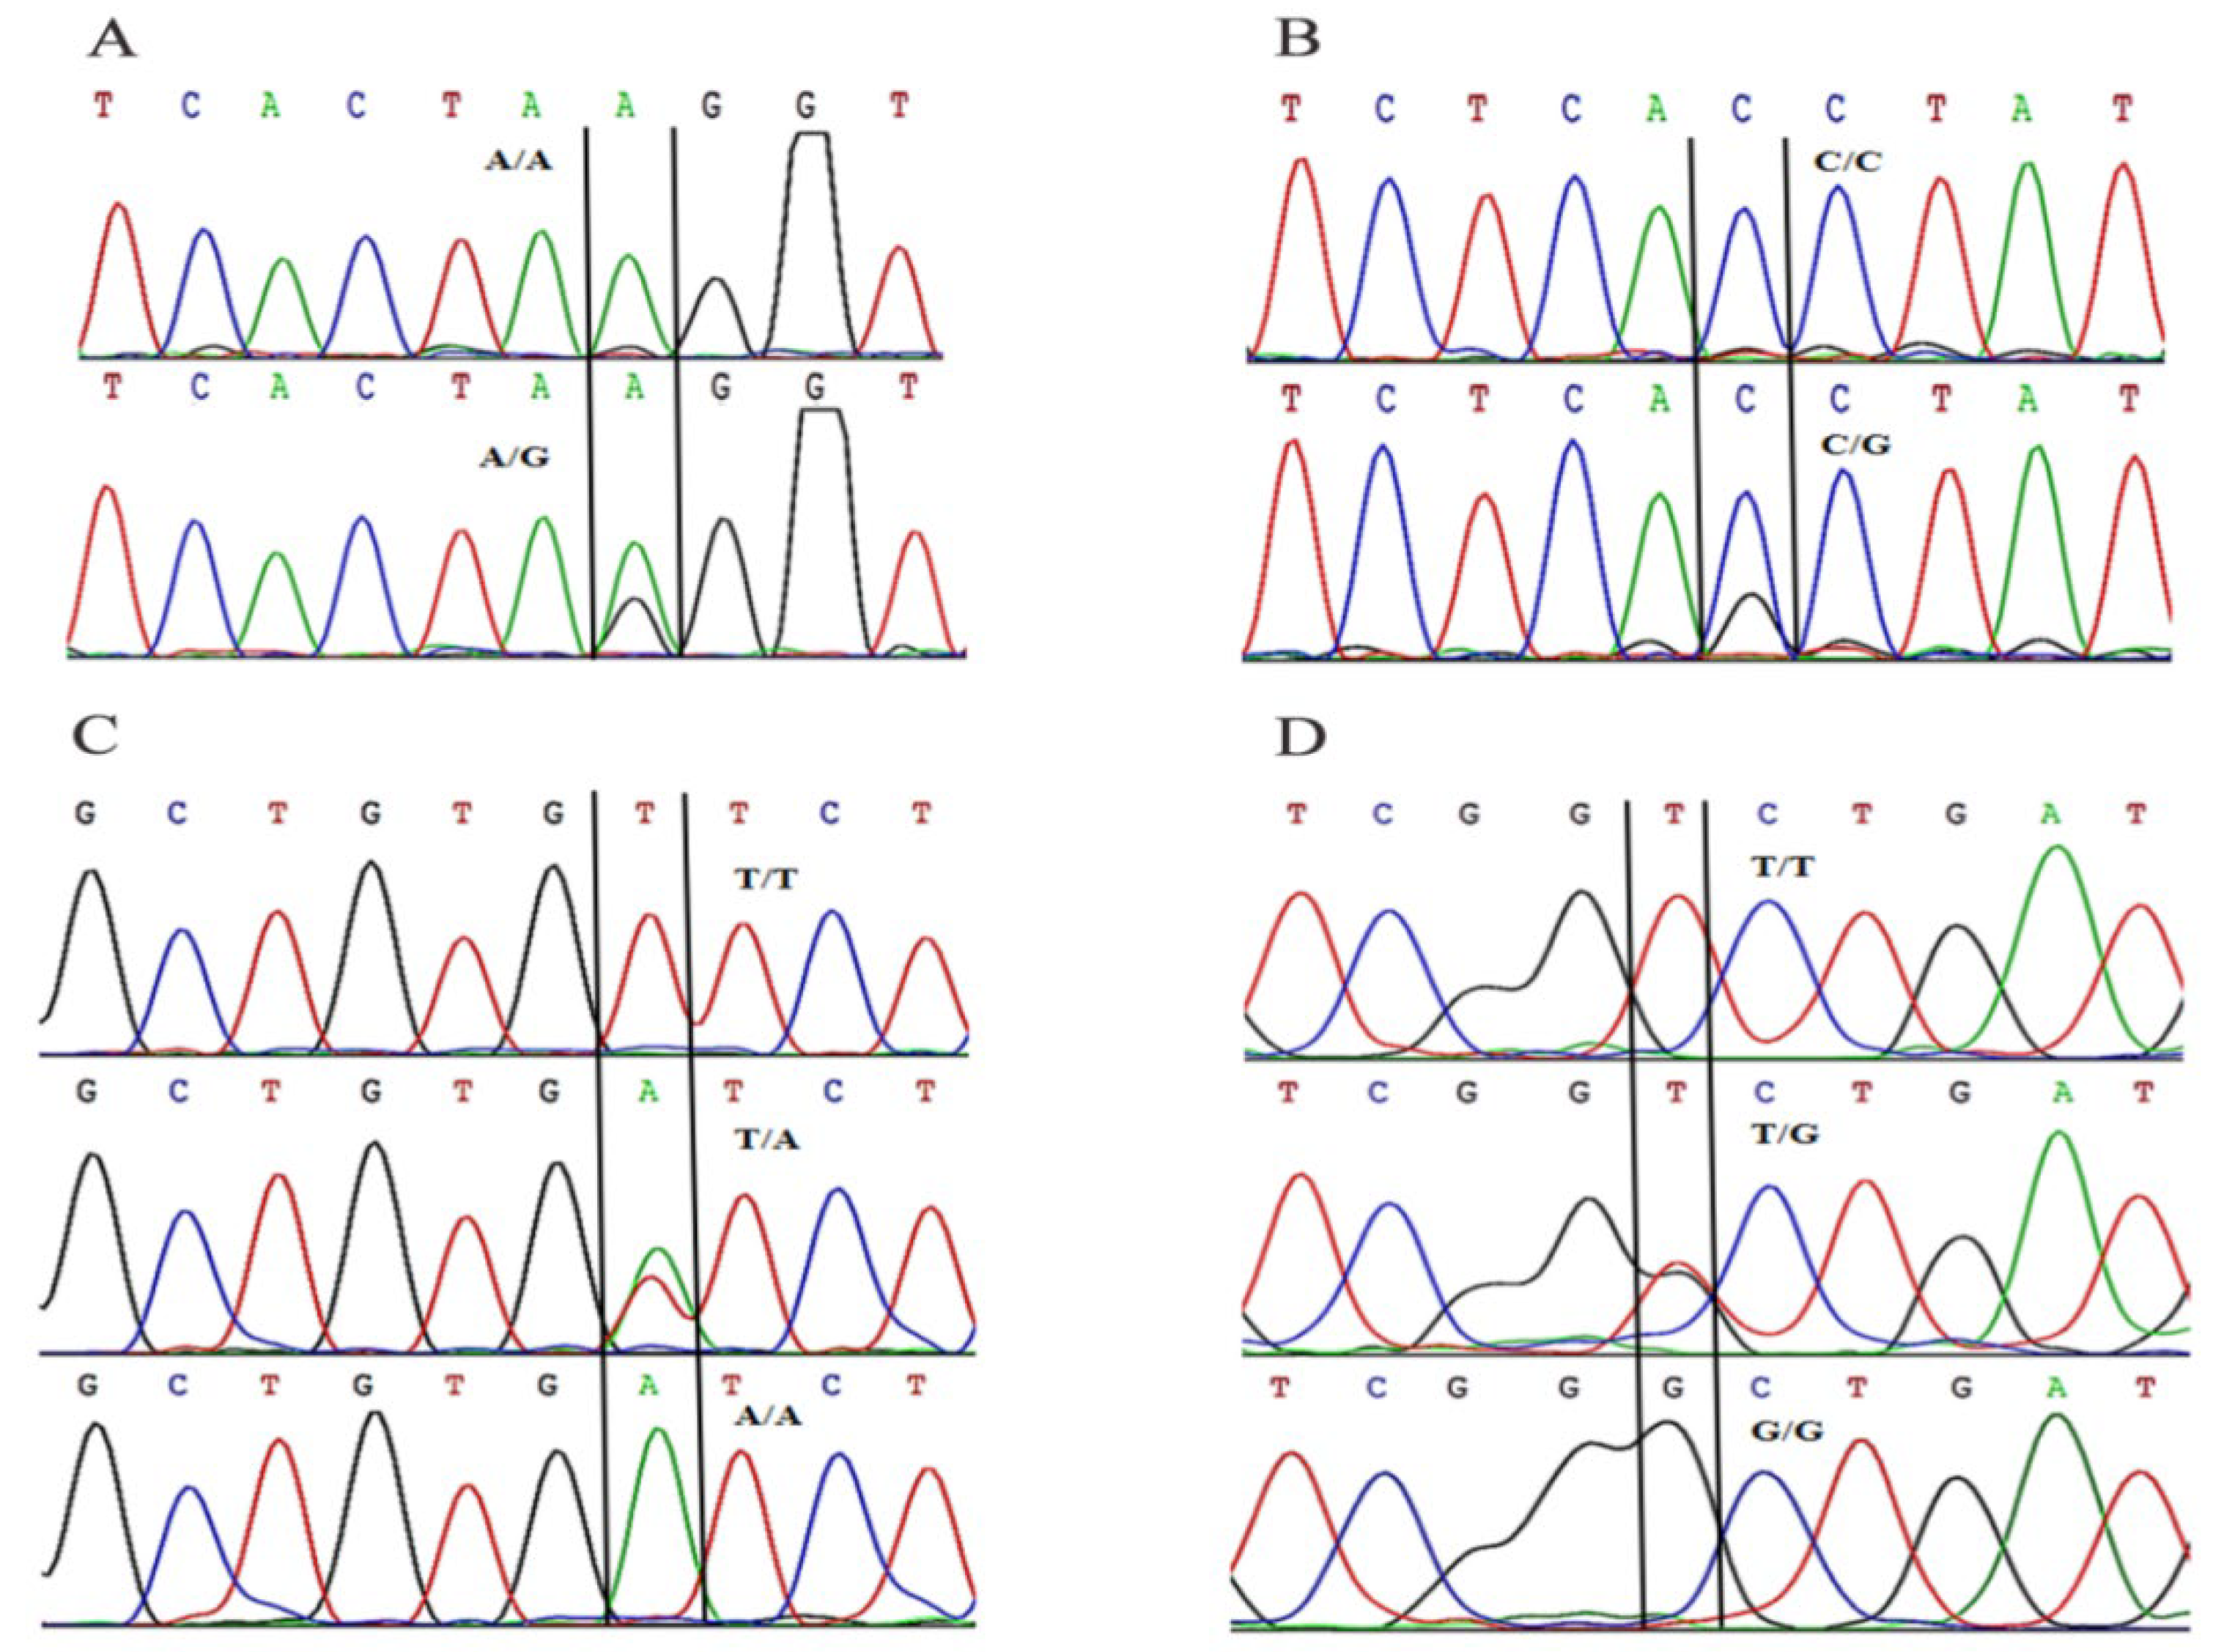
3.3. Association Analysis of Mandarin Fish SNP Loci and Domestication Traits

A total of four SNP loci related to easy domestication towards eating artificial diets were screened from the mandarin fish population. The following are the details: the penk-A site was located in intron 1, and two genotypes were detected, AA and AG (Figure 3A); the penk-B site was located in intron 1, and two genotypes were detected, CC and CG (Figure 3B); the penk-C site was located in intron 1, and three genotypes were detected, TT, TA, and AA (Figure 3C); and the penk-D site was located in exon 2, and three genotypes were detected, TT, TG, and GG (Figure 3D), encoding arginine. These were all was synonymous mutations.
For these four SNP polymorphic sites, the effective allele (Ne) was 0.1128–0.5000. The observed heterozygosity (Ho) and expected heterozygosity (He) were distributed in 0.1200–1.0000 and 0.1151–0.5101, respectively. The polymorphic information content (PIC) was 0.2894, and all sites belonged to moderate polymorphism sites (Table 3). In the trait association analysis, according to the gene frequency results, it could be seen that the dominant alleles for the SNP loci penk-A A/G, penk-B C/G, penk-C T/A, and penk-D T/G were A, C, T, and T, respectively. The SNP loci penk-A and penk-B had only two genotypes in mandarin fish populations, and all other loci had three different genotypes. Table 4 lists the associations between the genotype frequencies of different gene haplotypes at each SNP loci and the domestication traits of mandarin fish. The penk-A and penk-B loci showed poor negative correlations with the domestication traits. The penk-C locus was moderately positively correlated with the domestication traits. The penk-D locus had a low positive correlation with the domestication traits. Pearson’s correlation test results showed that the TT genotype in the SNP locus penk-C T/C was significantly correlated with mandarin fish domestication traits (p < 0.05). Nearly 90 percent of the penk-C genotypes in mandarin fish that were easily domesticated on artificial diets were of the TT genotype. Through transcription factor prediction, a total of eight potential transcription factor sites (score >13.00) were found around 50 bp before and after the penk-C site (Table 5), which means that the base mutation at this site might affect the expression of the penk gene.

4. Discussion

As the original opioid propeptide [36], most mammalian PENKs show the same peptide sequence, but many variations have been reported in lower vertebrates [37,38,39]. In this study, we explored the homology and gene structure of the PENK gene among various species through a bioinformatics analysis (Figure 1). In several species participating in the multiple sequence alignment of this experiment, we found that there were seven opioid core motifs in the PENK units of human, mouse, and zebrafish, which appeared in the form of four MEK repeat sequences, a heptapeptide, an octapeptide, and a LEK. However, there were three MEK repeats and a YGGFMS, and a YGGFMD in the Penk of mandarin fish and other fishes. Although both peptides are opioid agonists [40], they possibly have different behavioral effects due to their presence in different neurotransmitters [41]. Studies have shown that the hexapeptides YGGFMS and YGGFMD were equivalent in MEK-stimulated G-protein experiments, while the peptide YGGFMS exhibited the highest affinity at the DOP receptor [42]. The penk gene of mandarin fish exhibited significant structural changes compared with mammals when opium approached the core sequence motif. This phenomenon is to be expected as studies have suggested that opioidergic peptides were highly conserved in vertebrates [43]. Penk in many fish has developed structural diversity during long-term adaptation to the environment due to their long evolutionary history [44]. This might lead to large differences in the structure of the penk gene between mandarin fish and other species, but it was generally still relatively conserved in fish.
Previous studies have shown that opioid peptides were widely distributed throughout the brain, with the highest levels in the striatum, anterior hypothalamus, central midbrain gray matter, and amygdala [45,46]. The results of RT-PCR showed that the expression in the mandarin fish brain was significantly higher than that in other tissues (p < 0.05) (Figure 2A). The findings of the penk genes presented in all tissues examined revealed that it was widely expressed in mandarin fish, such as in the intestine, the liver, the spleen, the head kidney, and muscles. This implies that the penk gene might have a widespread role in the control of peripheral autonomic activity [40], such as in retinal photosensitivity and stomach peristalsis. The peptides secreted by the neurons of teleost fish could regulate various functions such as vision, smell, learning, and memory, which might affect fish feeding behavior [47,48,49]. Therefore, we suggest that penk may also play a similar regulatory role in mandarin fish.
Amino acids could regulate animal feeding by affecting the expression of appetite genes [27,50,51]. In our laboratory’s previous study on amino acid injections altering mandarin fish food intake, we found that, 12 h after ICV injection of Lys or Met, the food intake of mandarin fish was significantly increased (p < 0.05), while His and Try inhibited the food intake of mandarin fish [25]. To further determine the effect of the penk gene on food preference, we measured the expression of penk mRNA in the brains of mandarin fish 12 h after ICV injection of amino acids (Figure 2B). A clear result was that the expression of penk mRNA was significantly increased after an ICV injection of Lys or Met. In contrast, after the injection of His, the expression was significantly decreased (p < 0.05). Combined with our previous experiments, we could boldly draw a conclusion that the penk gene might be a related gene involved in regulating the food preference of mandarin fish. However, the specific mechanism of action remains to be further studied.
Food addiction (FA) is characterized by the consumption of palatable foods and the behavioral symptoms of addiction. Animal eating habits are influenced by many physiological, nutritional, and environmental factors [52] and could be developed and learned with experience [53,54]. Similar to food addiction, we believe that the food preference of mandarin fish for live fry fish is also controlled by endogenous opioids. In the quantitative comparison of penk mRNA expression in the brain of mandarin fish with different domestication abilities (Figure 2C), we found that, compared with normal mandarin fish, the expression of penk mRNA in the brain of mandarin fish, which was easy to domesticate towards eating artificial diets, was significantly increased (p < 0.05). To a certain extent, it could be speculated that the increase in penk mRNA expression is conducive to improving the domestication abilities of mandarin fish. Carbohydrates, as a nutrient, could easily affect animals’ food cravings if they are ingested at high levels for a long time [55]. High-carbohydrate intake is a reasonable trigger for food addiction [56]. However, carnivorous fish are inherently sugar intolerant, and the food intake will decrease when they are fed a high-carbohydrate diet [57,58]. However, there was no significant difference in the expression of penk mRNA in the brain of the mandarin fish that ingested the high-sugar artificial diet normally and the fish with hypophagy (Figure 2D). This was inconsistent with findings suggesting that the acute expression of endogenous opioids leads to higher food intake [59]. We can reasonably suspect that the amount of penk mRNA expression change might be related to the degree of hypophagia. The relationship should be further determined in the future by comparing the reduction in penk expression in the brain with different degrees of hypophagia.
Different individuals and groups of mandarin fish have great differences in taming traits. There are more SNP loci in the mandarin fish that are easily domesticated toward eating artificial diets, which has a higher value in the association analysis of food habits [24]. In the association analysis between the penk gene and domestication traits, a total of four SNP loci related to easy domestication toward eating artificial diets were screened. (Figure 3). They were all at moderate polymorphism levels (average PIC = 0.2894) and with better breeding potential. The HWE test indicated that four SNP loci were under less selective pressure in the population that was easily domesticated toward eating artificial diets (Table S1). Among the four loci found, more mutations were located in introns than exons. The penk gene of mandarin fish consisted of two exons and one intron. The initiation codon encoding Penk was located in exon 2, so the intron was located in the transcriptional regulatory region of the penk gene. Compared with other intron sequences, the DNA sequence of the first intron tends to be the longest and most conserved [60,61]. When the intron region is large, regulatory elements are likely to be embedded in it to regulate the expression of subsequent structural gene [62,63]. Introns at different positions differ significantly in their ability to increase gene expression [64,65,66]. The effect of intron-mediated expression stimulation is closely related to its orientation and location [67,68], so intron mutations might affect the “coordination” of gene exons. Synonymous mutations in exon 2 have no amino acid changes after translation, but it may lead to changes in the higher-order protein structure; in the efficiency of protein modification; and in transport and signaling, changing its spatial conformation, which in turn affects its function [69]. According to the Pearson correlation analysis, the penk-C locus was moderately positively correlated with the domestication traits of mandarin fish. Additionally, the Chi-square test showed that the Pearson chi-square value of TT in SNP penk-C T/C was 5.390 (Table 4), which indicated that there was a 95% probability that the TT genotype was significantly associated with these domestication traits. Therefore, we further predicted the transcription factors near this site. A total of eight transcription factors were predicted before and after 50 bp of the penk-C loci (Table 5), which includes factors that could regulate the development of midbrain dopaminergic neurons. This means that the mutation of the penk-C loci might be involved in the regulation of the penk gene expression. During the association analysis of the SNP loci in the penk gene, due to the insufficient number of samples, the intermediate frequency of individual genotypes in the mandarin fish group was less than five. Therefore, the number of mandarin fish samples should be expanded in future experiments to make the results of the chi-square test more accurate.

5. Conclusions

In conclusion, this study investigated the functional characterization and molecular marker development of the food addiction gene penk related to food habit domestication of mandarin fish for the first time. The PENK gene exhibited significant structural changes in core sequence motifs in different species, this was inseparable from the adaptive changes of species in the process of evolution. A series of RT-PCR results showed that the penk gene was associated with the food preference and food intake of mandarin fish. In the analysis of the penk gene and the domestication traits of mandarin fish, the TT genotype at penk-C had a 95% possibility that it was significantly associated with the domestication traits of mandarin fish. All of these may mean that Penk, as an opioid, plays an important role in the domestication of mandarin fish. The specific mechanism of its food domestication regulation needs to be further explored, but the screening and research of the penk gene as a domestication-related gene is conducive to the rapid molecular-assisted breeding of new varieties of mandarin fish that are easy to be domesticated to eat artificial diets.

Supplementary Materials

The following are available online at https://www.mdpi.com/article/10.3390/fishes7030118/s1, Table S1: Feed formula of artificial diets.

Author Contributions

Y.L. and S.H. designed the research; Y.L. performed the experiment, analyzed the data, and wrote the manuscript; S.H. revised the manuscript; Y.M. provided much help and important suggestions during the experiment; and X.L. provided advanced suggestions. All authors have read and agreed to the published version of the manuscript.

Funding

This work was financially supported by the National Natural Science Foundation of China (NO. 32172951), the Fundamental Research Funds for the Central Universities (Program NO. BC2021105), and Anhui Province Key Laboratory of Aquaculture & Stock Enhancement (AHSC202002).

Institutional Review Board Statement

In the present study, all procedures were performed in accordance with the “Guidelines for Experimental Animals” of the Ministry of Science and Technology (Beijing, China) and were approved by the Institutional Animal Care and Use Committees of Huazhong Agricultural University (HZAUFI-2022-0006).

Data Availability Statement

Not applicable.

Conflicts of Interest

The authors declare no conflict of interest. This work has not been published previously.

References

  1. Stern, A.S.; Lewis, R.V.; Kimura, S.; Rossier, J.; Gerber, L.D.; Brink, L.; Stein, S.; Udenfriend, S. Isolation of the opioid heptapeptide Met-enkephalin [Arg6,Phe7] from bovine adrenal medullary granules and striatum. Proc. Natl. Acad. Sci. USA 1979, 6, 6680–6683. [Google Scholar] [CrossRef] [Green Version]
  2. Kilpatrick, D.L.; Jones, B.N.; Kojima, K.; Udenfriend, S. Identification of the octapeptide [Met] enkephalin -Arg6-Gly7-Leu8 in extracts of bovine adrenal medulla. Biochem. Biophys. Res. Commun. 1981, 103, 698–705. [Google Scholar] [CrossRef]
  3. Kilpatrick, D.L.; Taniguchi, T.; Jones, B.N.; Stern, A.S.; Shively, J.E.; Hullihan, J.; Kimura, S.; Stein, S.; Udenfriend, S. A highly potent 3200-dalton adrenal opioid peptide that contains both a [Met] and [Leu] enkephalin sequence. Proc. Natl. Acad. Sci. USA 1981, 78, 3265–3268. [Google Scholar] [CrossRef] [Green Version]
  4. Nuñez, V.G.; Sarmiento, R.G.; Rodríguez, R.E. Characterization of zebrafish proenkephalin reveals novel opioid sequences. Brain Res. Mol. Brain Res. 2003, 114, 31–39. [Google Scholar] [CrossRef]
  5. Shao, Z.X.; Wu, H.Q. Research progress in enkephalin. Stroke Nerv. Disord 2013, 20, 58–60. [Google Scholar] [CrossRef]
  6. Eiden, L.E. The enkephalin-containing cell: Strategies for polypeptide synthesis and secretion throughout the neuroendocrine system. Cell Mol. Neurobiol. 1987, 4, 339–352. [Google Scholar] [CrossRef]
  7. Shan, Z.Z.; Dai, S.M.; Fang, F.; Su, D.F. Changes of central norepinephrine, beta-endorphin, LEU-enkehalin, peripheral arginine-vasopressin, and angiotensin II levels in acute and chronic phases sino-aortic denervati-on in rats. Cardiovas. Pharmacol. 2004, 43, 234–241. [Google Scholar] [CrossRef]
  8. Malendowicz, L.K.; Rebuffat, P.; Tortorella, C.; Nussdorfer, G.G.; Ziolkowska, A.; Hochol, A. Effects of met-enkephalin on cell proliferation in different models of adrenocortical-cell growth. Int. J. Mol. Med. 2005, 15, 841–845. [Google Scholar] [CrossRef]
  9. Haber, S.N.; Knutson, B. The reward circuit: Linking primate anatomy and human imaging. Neuropsychopharmacology 2010, 35, 4–26. [Google Scholar] [CrossRef] [Green Version]
  10. Juarez, B.; Han, M.H. Diversity of Dopaminergic Neural Circuits in Response to Drug Exposure. Neuropsychopharmacology 2016, 41, 2424–2446. [Google Scholar] [CrossRef] [Green Version]
  11. Vasiliu, O. Current Status of Evidence for a New Diagnosis: Food Addiction-A Literature Review. Front. Psychiatry 2022, 12, 824–936. [Google Scholar] [CrossRef]
  12. Vesnina, A.; Prosekov, A.; Kozlova, O.; Atuchin, V. Genes and Eating Preferences, Their Roles in Personalized Nutrition. Genes 2020, 11, 357. [Google Scholar] [CrossRef] [Green Version]
  13. Blasio, A.; Steardo, L.; Sabino, V.; Cottone, P. Opioid system in the medial prefrontal cortex mediates binge-like eating. Addict Biol. 2014, 19, 652–662. [Google Scholar] [CrossRef] [Green Version]
  14. Johnson, S.W.; North, R.A. Opioids excite dopamine neurons by hyperpolarization of local interneurons. J. Neurosci. 1992, 12, 483–488. [Google Scholar] [CrossRef] [Green Version]
  15. Comings, D.E.; Blake, H.; Dietz, G.; Gade-Andavolu, R.; Legro, R.S.; Saucier, G.; Johnson, P.; Verde, R.; MacMurray, J.P. The proenkephalin gene (PENK) and opioid dependence. Neuroreport 1999, 10, 1133–1135. [Google Scholar] [CrossRef]
  16. Heinsbroek, J.A.; Bobadilla, A.C.; Dereschewitz, E.; Assali, A.; Chalhoub, R.M.; Cowan, C.W.; Kalivas, P.W. Opposing Regulation of Cocaine Seeking by Glutamate and GABA Neurons in the Ventral Pallidum. Cell Rep. 2020, 30, 2018–2027. [Google Scholar] [CrossRef] [Green Version]
  17. Dores, R.M.; Sollars, C.; Lecaude, S.; Lee, J.; Danielson, P.; Alrubaian, J.; Lihrman, I.; Joss, J.M.; Vaudry, H. Cloning of prodynorphin cDNAs from the brain of Australian and African lungfish: Implications for the evolution of the prodynorphin gene. Neuroendocrinology 2004, 79, 185–196. [Google Scholar] [CrossRef]
  18. Li, C.Y.; Zhou, W.Z.; Zhang, P.W.; Johnson, C.; Wei, L.; Uhl, G.R. Meta-analysis and genome-wide interpretation of genetic susceptibility to drug addiction. BMC Genom. 2011, 12, 508. [Google Scholar] [CrossRef] [Green Version]
  19. Spanagel, R. Convergent functional genomics in addiction research-a translational approach to study candidate genes and gene networks. Silico Pharmacol. 2013, 1, 18. [Google Scholar] [CrossRef] [Green Version]
  20. Liang, X.F.; Liu, J.K.; Huang, B.Y. The role of sense organs in the feeding behaviour of Chinese perch. J. Fish Biol. 1998, 52, 1058–1067. [Google Scholar] [CrossRef]
  21. Chen, K.; Zhang, Z.; Li, J.; Xie, S.; Shi, L.J.; He, H.M.; Liang, X.F.; Zhu, Q.S.; He, S. Different regulation of branched-chain amino acid on food intake by TOR signaling in Chinese perch (Siniperca chuatsi). Aquaculture 2020, 530, 735–792. [Google Scholar] [CrossRef]
  22. De Pedro, N.; Pinillos, M.L.; Valenciano, A.I.; Alonso-Bedate, M.; Delgado, M.J. Inhibitory effect of serotonin on feeding behavior in goldfish: Involvement of CRF. Peptides 1998, 19, 505–511. [Google Scholar] [CrossRef]
  23. Moeller, S.J.; Beebe-Wang, N.; Schneider, K.E.; Konova, A.B.; Parvaz, M.A.; Alia-Klein, N.; Hurd, Y.L.; Goldstein, R.Z. Effects of an opioid (proenkephalin) polymorphism on neural response to errors in health and cocaine use disorder. Behav. Brain Res. 2015, 293, 18–26. [Google Scholar] [CrossRef] [Green Version]
  24. Liang, X.F.; Zheng, W.Y.; Wang, Y.L. Visual characteristics of mandarin fish (Siniperca chuatsi) in relation to its feeding habit: I Photo-sensitivity and spectral sensitivity of electroretinogram. Acta Hydrobiol. Sin. 1994, 18, 247–253. [Google Scholar] [CrossRef]
  25. Zhu, Q.S.; He, S.; Liang, X.F.; Xu, J.; Zhang, Y.P. Effect of six essential amino acids on the regulation of warped mouth mandarin feeding. Aquat. Sci. Technol. Intell. 2020, 47, 154–161. [Google Scholar] [CrossRef]
  26. He, S.; Liang, X.F.; Sun, J.; Li, L.; Yu, Y.; Huang, W.; Qu, C.M.; Cao, L.; Bai, X.L.; Tao, Y.X. Insights into food preference in hybrid F1 of Siniperca chuatsi (♀) × Siniperca scherzeri (♂) mandarin fish through transcriptome analysis. BMC Genom. 2013, 14, 601. [Google Scholar] [CrossRef] [Green Version]
  27. He, S.; You, J.J.; Liang, X.F.; Zhang, Z.L.; Zhang, Y.P. Transcriptome sequencing and metabolome analysis of food habits domestication from live prey fish to artificial diets in mandarin fish (Siniperca chuatsi). BMC Genom. 2021, 22, 129. [Google Scholar] [CrossRef]
  28. Liang, X.F.; Oku, H.; Ogata, H.Y.; Liu, J.; He, X. Weaning Chinese perch (Siniperca chuatsi) basilewsky onto artificial diets based upon its specific sensory modality in feeding. Aquac. Res. 2001, 32, 76–82. [Google Scholar] [CrossRef] [Green Version]
  29. You, J.J.; Ren, P.; He, S.; Liang, X.F.; Xiao, Q.Q.; Zhang, Y.P. Histone Methylation of H3K4 Involved in the Anorexia of Carnivorous Mandarin Fish (Siniperca chuatsi) After Feeding on a Carbohydrate-Rich Diet. Front. Endocrinol. 2020, 11, 323. [Google Scholar] [CrossRef]
  30. Vandesompele, J.; Preter, K.D.; Pattyn, F.; Poppe, B.; Roy, N.V.; Paepe, A.D. Accuratenormalization of real-time quantitative RT-PCR data by geometric averagingof multiple internal control genes. Genome Biol. 2018, 3, research0034.1. [Google Scholar] [CrossRef] [Green Version]
  31. Liang, H.; He, S.; Liang, X.F.; Lu, H.L.; Chen, K. Feeding habit transition induced bysocial learning through CAMKII signaling in chinese perch (Siniperca chuatsi). Aquaculture 2020, 533, 736211. [Google Scholar] [CrossRef]
  32. Livak, K.J.; Schmittgen, T.D. Analysis of relative gene expression data using real-time quantitative PCR and the 2−∆∆CT Method. Methods 2001, 25, 402–408. [Google Scholar] [CrossRef]
  33. Bostein, D.; White, R.L.; Skolnick, M.; DAVIS, R.W. Construction of a genetic linkage map in man using restriction fragment length polymorphisms. Am. J. Hum. Genet. 1980, 32, 314–331. [Google Scholar]
  34. Hazra, A.; Gogtay, N. Biostatistics Series Module 6: Correlation and Linear Regression. Indian J. Dermatol. 2016, 61, 593–601. [Google Scholar] [CrossRef]
  35. Hook, V.; Funkelstein, L.; Lu, D.; Bark, S.; Wegrzyn, J.; Hwang, S.R. Proteases for processing proneuropeptides into peptide neurotransmitters and hormones. Annu. Rev. Pharmacol. Toxicol. 2008, 48, 393–423. [Google Scholar] [CrossRef] [Green Version]
  36. Dores, R.M.; McDonald, L.K.; Goldsmith, A.; Deviche, P.; Rubin, D.A. The phylogeny of enkephalins: Speculations on the origins of opioid precursors. Cell. Physiol. Biochem. 1993, 3, 231–244. [Google Scholar] [CrossRef]
  37. Bojnik, E.; Magyar, A.; Tóth, G.; Bajusz, S.; Borsodi, A.; Benyhe, S. Binding studies of novel, non-mammalian enkephalins, structures predicted from frog and lungfish brain cDNA sequences. Neuroscience 2009, 158, 867–874. [Google Scholar] [CrossRef]
  38. Bojnik, E.; Babos, F.; Magyar, A.; Borsodi, A.; Benyhe, S. Bioinformatic and biochemical studies on the phylogenetic variability of proenkephalin-derived octapeptides. Neuroscience 2010, 165, 542–552. [Google Scholar] [CrossRef]
  39. Bojnik, E.; Boynik, E.; Corbani, M.; Babos, F.; Magyar, A.; Borsodi, A.; Benyhe, S. Phylogenetic diversity and functional efficacy of the C-terminally expressed heptapeptide unit in the opioid precursor polypeptide proenkephalin A. Neuroscience 2011, 178, 56–67. [Google Scholar] [CrossRef]
  40. Hughes, J.; Smith, T.W.; Kosterlitz, H.W.; Fothergill, L.A.; Morgan, B.A.; Morris, H.R. Identification of two related pentapeptides from the brain with potent opiate agonist activity. Nature 1975, 258, 577–580. [Google Scholar] [CrossRef]
  41. Hughes, J.; Kosterlitz, H.W.; Smith, T.W. The distribution of methionine-enkephalin and leucine-enkephalin in the brain and peripheral tissues. Br. J. Pharmacol. 1977, 120, 639–647. [Google Scholar] [CrossRef] [Green Version]
  42. Bojnik, E.; Kleczkowska, P.; de Velasco, E.M.F.; Corbani, M.; Babos, F.; Lipkowski, A.W.; Magyar, A.; Benyhe, S. Bioactivity studies on atypical natural opioid hexapeptides processed from proenkephalin (PENK) precursor polypeptides. Comp. Biochem. Physiol. B Biochem. Mol. Biol. 2014, 174, 29–35. [Google Scholar] [CrossRef]
  43. Bodnar, R.J. Endogenous opiates and behavior: 2016. Peptides 2018, 101, 167–212. [Google Scholar] [CrossRef] [PubMed]
  44. Kah, O.; Dufour, S. Conserved and divergent features of reproductive neu-roendocrinology in teleost fishes. In Hormones and Reproduction of Vertebrates; Norris, D.O., Lopez, K.H., Eds.; Academic Press: London, UK, 2011; Volume 1, pp. 15–42. [Google Scholar]
  45. Chalmers, J.; Arnolda, L.; Kapoor, V.; Llewellyn-Smith, I.; Minson, J.; Pilowsky, P. Amino acid neurotransmitters in the central control of blood pressure and in experimental hypertension. J. Hypertens. Suppl. 1992, 10, S27–S37. [Google Scholar] [CrossRef]
  46. Holaday, J.W. Cardiovascular effects of endogenous opiate systems. Annu. Rev. Pharmacol. Toxicol. 1983, 23, 541–594. [Google Scholar] [CrossRef]
  47. Helfman, G.; Collette, B.; Facey, D. The Diversity of Fishes. In Blackwell Science; Fricke, H., Ed.; Oxford Press: Malden, MA, USA, 1998; pp. 454–455. [Google Scholar] [CrossRef]
  48. Demski, L.S. In a Fish’s Mind’s eye: The visual pallium of Teleosts. In Sensory Processing in Aquatic Environments; Collin, S.P., Marshall, N.J., Eds.; Springer: New York, NY, USA, 2003; pp. 404–419. [Google Scholar]
  49. Salas, C.; Broglio, C.; Durán, E.; Gómez, A.; Ocaña, F.M.; Jiménez-Moya, F.; Rodríguez, F. Neuropsychology of learning and memory in teleost fish. Zebrafish 2006, 3, 157–171. [Google Scholar] [CrossRef]
  50. Heeley, N.; Blouet, C. Central amino acid sensing in the control of feeding behavior. Front. Endocrinol. 2016, 7, 148. [Google Scholar] [CrossRef] [Green Version]
  51. Laeger, T.; Reed, S.D.; Henagan, T.M.; Fernandez, D.H.; Taghavi, M.; Addington, A.; Münzberg, H.; Martin, R.J.; Hutson, S.M.; Morrison, C.D. Leucine acts in the brain to suppress food intake but does not function as a physiological signal of low dietary protein. Am. J. Physiol. Regul. Integr. Comp. Physiol. 2014, 307, R310–R320. [Google Scholar] [CrossRef] [Green Version]
  52. Garcia-Bailo, B.; Toguri, C.; Eny, K.M.; El-Sohemy, A. Genetic variation in taste and its influence on food selection. OMICS 2009, 1, 69–80. [Google Scholar] [CrossRef] [Green Version]
  53. Brown, J.A. The adaptive significance of behavioural ontogeny in some. Cent. Fishes 1985, 13, 25–34. [Google Scholar] [CrossRef]
  54. Warburton, K. Learning of foraging skills by fish. Fish Fishes 2003, 4, 203–215. [Google Scholar] [CrossRef]
  55. Gendall, K.A.; Joyce, P.R.; Abbott, R.M. The effects of meal composition on subsequent craving and binge eating. Addict. Behav. 1999, 24, 305–315. [Google Scholar] [CrossRef]
  56. Lennerz, B.; Lennerz, J.K. Food Addiction, High-Glycemic-Index Carbohydrates, and Obesity. Clin. Chem. 2018, 64, 64–71. [Google Scholar] [CrossRef] [PubMed]
  57. Hemre, G.I.; Mommsen, T.P.; Krogdahl, A. Carbohydrates in fish nutrition: Effects on growth, glucose metabolism and hepatic enzymes. Aquac. Nutr. 2002, 8, 175–194. [Google Scholar] [CrossRef]
  58. Polakof, S.; Míguez, J.M.; Soengas, J.L. Dietary carbohydrates induce changes in glucosensing capacity and food intake of rainbow trout. Am. J. Physiol. Regul. Integr. Comp. Physiol. 2008, 295, R478–R489. [Google Scholar] [CrossRef] [PubMed] [Green Version]
  59. Yeomans, M.R.; Gray, R.W. Opioid peptides and the control of human ingestive behaviour. Neurosci. Biobehav. Rev. 2002, 26, 713–728. [Google Scholar] [CrossRef]
  60. Park, S.G.; Hannenhalli, S.; Choi, S.S. Conservation in fifirst introns is positively associated with the number of exons within genes and the presence of regulatory epigenetic signals. BMC Genom. 2014, 15, 526. [Google Scholar] [CrossRef] [Green Version]
  61. Jo, S.S.; Choi, S.S.; Hurst, L. Analysis of the functional relevance of epigenetic chromatin marks in the first intron associated with specifific gene expression patterns. Genome Biol. Evol. 2019, 11, 786–797. [Google Scholar] [CrossRef]
  62. Chorev, M.; Bekker, A.J.; Goldberger, J.; Carmel, L. Identifification of introns harboring functional sequence elements through positional conservation. Sci. Rep. 2017, 7, 4201. [Google Scholar] [CrossRef] [Green Version]
  63. Hou, J.; Lu, D.; Mason, A.S.; Li, B.; Xiao, M.; An, S.; Fu, D. Non-coding RNAs and transposable elements in plant genomes: Emergence, regulatory mechanisms and roles in plant development and stress responses. Planta 2019, 250, 23–40. [Google Scholar] [CrossRef]
  64. Huang, M.T.F.; Gorman, C.M. Intervening sequences increase efficiency of RNA 3′ processing and accumulation of cytoplasmic RNA. Nucleic Acids Res. 1990, 18, 937–947. [Google Scholar] [CrossRef] [PubMed]
  65. CaUis, J.; Fromm, M.; Walbot, V. lntrons increase gene expression in cultured maize cells. Genes Dev. 1987, 1, 1183–1200. [Google Scholar] [CrossRef] [Green Version]
  66. McElroy, D.; Zhang, W.; Cao, J.; Wu, R. Isolation of an efficient actin promoter for use in rice transformation. Plant Cell 1990, 2, 163–171. [Google Scholar] [CrossRef] [PubMed]
  67. Maas, C.; Laufs, J.; Grant, S.; Korfhage, C.; Werr, W. The combination of a novel stimulatory element in the first exon of the maize Shrunken-I gene with the following intron 1 enhances reporter gene expression up to 1000- fold. Plant Mol. Biol. 1991, 16, 199–207. [Google Scholar] [CrossRef] [PubMed]
  68. Collis, P.; Antoniou, M.; Grosveld, F. Definition of the minimal requirements within the human /3-globin gene and the dominant control region for high level expression. EMBO J. 1990, 9, 233–240. [Google Scholar] [CrossRef]
  69. Kang, J.H.; Lee, S.J.; Park, S.R.; Ryu, H.Y. DNA polymorphism in the growth hormone gene and its association with weight in olive flounder Paralichthys olivaceus. Fish. Sci. 2002, 68, 494–498. [Google Scholar] [CrossRef]
Figure 1. Bioinformatics analysis of PENK genes. (A) The structures of the PENK genes in human (Homo sapiens), mouse (Mus musculus), zebrafish (Danio rerio), mandarin fish (Siniperca chuatsi), and European seabass (Dicentrarchus labrax). The black squares represent exons, and the gray lines represent introns. (B) Sequence alignment of PENK in human (Homo sapiens), mouse (Mus musculus), mandarin fish (Siniperca chuatsi), zebrafish (Danio rerio), European seabass (Dicentrarchus labrax), and the green spotted puffer (Tetraodon nigroviridis). The core segments of the opioid are indicated by bold boxes. Mutated amino acid positions are indicated in red compared with human PENK. Intracellular protein cleavage sites are indicated in blue. (C) The evolutionary tree of PENK between mandarin fish (Siniperca chuatsi) and various species. (D) Synteny analysis of PENK genes in human (Homo sapiens), mandarin fish (Siniperca chuatsi), mouse (Mus musculus), European seabass (Dicentrarchus labrax), and zebrafish (Danio rerio). Among the species tested, those with common genes upstream and downstream of PENK in human are marked in colored text.
Fishes 07 00118 g001
Figure 2. Real-time quantitative RT-PCR detection of various tissues of mandarin fish and brain tissue of mandarin treated by different experiments. (A) The expression of penk mRNA in the brain, the gut, the liver, muscles, the spleen, and the head kidney in mandarin fish (n = 6). The significant level is marked with different letters above the bars (p < 0.05) compared with the control group. (B) Effects of histidine (His), lysine (Lys), methionine (Met), threonine (Thr), tryptophan (Try), and phenylalanine (Phe) on the expression of penk mRNA in the brain (n = 6). Significance levels are marked with different letters above the bar graph (p < 0.05). (C) The expression of penk mRNA in the brain regions with different domestication abilities from group W and group X (n = 6). The significant level is marked with an asterisk. (D) The expression of penk mRNA in the brain regions from the normal group and the hypophagic group (n = 6). The significant level is marked with an asterisk.
Fishes 07 00118 g002
Figure 3. The sequencing peak chart of different genotypes of SNP loci in the penk gene of mandarin fish in group X (n = 25) and of fish in group W (n = 30). The sequencing peak of the homozygous SNP loci is a single peak with a higher peak, and that of the heterozygous SNP loci is a double peak with a lower peak. (A) penk-A, (B) penk-B, (C) penk-C, and (D) penk-D.
Fishes 07 00118 g003
Table 1. The accession numbers of PENK amino acid sequences of different species.
SpeciesEMBL/GenBank Databases
Mandarin fish (Siniperca chuatsi)PENK: SC_LG18_22463
Human (Homo sapiens)PENK: NP_001129162.1
Mouse (Mus musculus)PENK: NP_001335138.1
Zebrafish (Danio rerio)PENKA: NP_956377.2
Zebrafish (Danio rerio)PENKB: NP_878303.1
European seabass (Dicentrarchus labrax)PENK: DLA_LG10_000290
Chicken (Gallus gallus)PENK: XP_040520680.1
Japanese medaka (Oryzias latipes)PENK: XP_011484397.1
African clawed frog (Xenopus laevis)PENK: XP_018079238.1
Torafugu (Takifugu rubripes)PENK: XP_011614671.1
Spotted green pufferfish (Tetraodon nigroviridis)PENK: ALD51518.1
Blackstrip livebearer (Poeciliopsis prolifica)PENK: JAO05419.1
Nile tilapia (Oreochromis niloticus)PENK: XP_003456767.1
Grass carp (Ctenopharyngodon idellus)PENK: ROL48303.1
Japanese medaka (Oryzias latipes)PENK: XP_011484397.1
Table 2. The amplification primer sequence of the penk gene.
Gene NamePrimer(5′–3′) Primer SequenceTm/°C
penkFACAGCAGTCTGGTTTTCCCT58
RATGTTGCGTCCTCTTCGTCA
rpl13FTATCCCCCCACCCTATGACA58
RACGCCCAAGGAGAGCGAACT
penk-1FATGGCTGCCCCTGCACA61.2
RAGGGGACAACAAATACCAGATATGGAC
penk-2FCTTTCCATCTTTACACAATTATTACTTGTTGTATGCT59.5
RGTGAGGCCTCTCTCTCTCT
penk-3FAATTCATCACGGCACAAAATTAATATGAAC55.7
RCTAGTCCATGAACCCACCATACC
Table 3. Diversity parameters of SNP loci in the penk gene of mandarin fish.
LocusGroupNeHoHePICp-Value (HWE)
penk-AX = 250.50001.00000.51020.37500.0000 *
W = 300.49780.93330.50620.37400.0000 *
penk-BX = 250.49680.92000.50690.37300.0001 *
W = 300.48000.80000.48810.36500.0013 *
penk-CX = 250.11280.12000.11510.10600.9503
W = 300.35780.33330.36380.29800.9276
penk-DX = 250.18000.20000.18370.16400.3817
W = 300.29940.23330.30450.26000.4950
Mean 0.36560.56750.37230.28940.3445
Note: * indicates significantly deviate from the Hardy–Weinberg equilibrium (HWE) (p < 0.05).
Table 4. Association analysis between genotype frequency of SNP and food preference in mandarin fish.
LocusGenotypeGenotypic FrequencyPearson χ2Pearson Correlation Coefficient (r)
X (n = 25)W (n = 30)
penk-A A/GAA0.00 (0)0.07 (2)1.730−0.177
AG1.00 (25)0.93 (28)1.730
penk-B C/GCC0.08 (2)0.20 (6)1.580−0.169
CG0.92 (23)0.80 (24)1.580
penk-C T/ATT0.88 (22)0.60 (18)5.390 *0.323
TA0.12 (3)0.33 (10)3.438
AA0.00 (0)0.07 (2)1.730
penk-D T/GTT0.80 (20)0.70 (21)0.7190.157
TG0.20 (5)0.23 (7)0.089
GG0.00 (0)0.07 (2)1.730
Note: * denotes significant correlation (p < 0.05).
Table 5. Association analysis between genotype frequency of SNP and food preference in mandarin fish.
Transcription FactorScoreRelative Score Strand Start End Predicted Sequence
ZNF8518.630.9516461661AAAGAGATTACAACAG
NeuroD215.170.9616321646GTCAACAGATGGTTT
TAL1::TCF315.160.98+16321643AAACCATCTGTT
NeuroD113.940.9516321644CAACAGATGGTTT
Atoh113.920.9816331643AACAGATGGTT
NeuroG213.890.9716331645TCAACAGATGGTT
Ptf1a13.530.9616321644CAACAGATGGTTT
Atoh113.330.9916341641CAGATGGT
Note: The transcription factor prediction was performed on the gene segment of the first intron of the penk gene from the 5′-3′ sequences, where the first base of the intron was named 1.
Publisher’s Note: MDPI stays neutral with regard to jurisdictional claims in published maps and institutional affiliations.

