Article

eDNA and Acoustic Tag Monitoring Reveal Congruent Overwintering Distributions of Striped Bass in a Hydrologically Complex Estuarine Environment

Fisheries and Oceans Canada, Gulf Fisheries Centre, 343 Université Ave., Moncton, NB E1C 5K4, Canada
*
Author to whom correspondence should be addressed.
Fishes 2022, 7(4), 183; https://doi.org/10.3390/fishes7040183
Submission received: 17 June 2022 / Revised: 15 July 2022 / Accepted: 20 July 2022 / Published: 23 July 2022
(This article belongs to the Special Issue Application of Environmental DNA Technology in Fishery Resources)

Abstract

:
After collapsing in the late 1990s, the southern Gulf of St. Lawrence population of striped bass (Morone saxatilis) is recovering. Here, we evaluate the use of under-ice eDNA sampling to monitor the population and confirm overwintering locations. From 2018 to 2020, water samples were collected from transects spanning 35 km of the Miramichi River system, accounting for the effects of sampling site, month, sampling depth and tidal influence on eDNA concentration. We examined the distribution of eDNA in a complex tidal river system with a time series consisting of 12 h of continuous sampling throughout a tidal cycle, in conjunction with the use of artificial DNA tracers and acoustic Doppler current profiler flow measurements. The eDNA distribution correctly identified overwintering grounds based on acoustic tag data, including a perceptible upstream shift in 2020. Overall, there was no significant effect of year, sampling month (February or March), sampling depth or tidal phase on eDNA concentrations. The tidal time series revealed only weak patterns of eDNA recirculation. Monitoring eDNA concentration and distribution allows for a relative comparison of population size and location between years, and has the potential to be expanded to other river systems more easily than traditional acoustic fish tags and surveys.

1. Introduction

Striped bass (Morone saxatilis) is an anadromous perciform fish native to the Atlantic coast of North America that spawns in the upper river portion of estuaries and returns to marine environments to feed and mature [1]. The southern Gulf of St. Lawrence (sGSL) population of striped bass is considered a single biological unit—distinct from the St. Lawrence River, Bay of Fundy and American populations [2,3,4]—and occupies primarily near shore waters from the Gaspé Peninsula, QC, to Cape Breton, NS [5]. The sGSL striped bass are thought to be the only population where all individuals must seek thermal refuge in overwintering sites to avoid lethal marine conditions [1,6,7,8]. In addition to the Miramichi River system in New Brunswick, overwintering is known to occur in the Napan, Kouchibouguac, Saint Louis, Black and Richibucto Rivers, NB [6,7,8,9], and has been reported as far east as the East River, NS, and as far northwest as the Tabusintac and Nepisiguit Rivers, NB [8,10]. Though the relative importance of each estuary as an overwintering location is unknown [11], significant overwintering has been observed year after year in the Miramichi River system, particularly in the Northwest (NW) Miramichi River [7], with some individuals also overwintering in the Southwest (SW) Miramichi River and in deep holes within the Miramichi estuary [6]. Though fidelity to overwintering sites has been demonstrated in some populations [12], overwintering site selection by the sGSL population appears to be opportunistic, based on proximity at the time of decreasing sea temperatures [11,13]. Moreover, overwintering location is not necessarily indicative as to whether or not an individual will spawn the following spring in the NW Miramichi [13]—currently the sGSL population’s only confirmed annual spawning location [1,9,14]—though, it may be advantageous to overwinter close to the spawning grounds and migrate to the estuary with high energy reserves in the fall, as opposed to in the spring after several months of fasting [15]. A single spawning event lasts one to two weeks between mid-May and early-June, after which the adults exit the river and begin their summer coastal feeding migration [1,13,14].
The striped bass fishery has historically been culturally and economically important in Atlantic Canada. Commercial catches in the Gulf of St. Lawrence exceeded 47 tonnes annually in the early 1980s [1]. The sGSL population of striped bass declined to less than 5000 spawners in the late 1990s, leading to the closure of commercial fisheries in 1996, and recreational and aboriginal fisheries in 2000 [2]. The population was assessed by the Committee on the Status of Endangered Wildlife in Canada (COSEWIC) as Threatened in 2004, and reassessed as Special Concern in 2012 after a significant increase in population abundance [3,11,16,17]. Food, social and ceremonial fisheries, and recreational fisheries were reintroduced in 2012 and 2013 respectively, and a pilot Indigenous commercial fishery in the Miramichi River has been conducted annually since 2018 [2].
Since 1993, traditional mark-recapture methods have been employed to monitor the recovery of the population and estimate the spawning stock size [2,5,9,16,18,19,20,21,22]. A combination of commercial and Fisheries and Oceans Canada (DFO) operated trapnets deployed in the NW and SW Miramichi Rivers are used annually to tag striped bass and record biological characteristics (e.g., size, age and sex) from May to October. Population estimates are derived from a Bayesian hierarchical model of catch, recapture and effort data collected while females are present on the spawning grounds [23]. Since 2014, the model has been adjusted to account for the movement of approximately 70 fish carrying acoustic tags and their availability for capture. Median striped bass abundances were over 300,000 in each year of our study [2,24].
Mark-recapture surveys have been instrumental in assessing spawning population size and life-history characteristics, but operating and monitoring trapnets over many months is costly and time consuming. Environmental DNA (eDNA) can be complimentary to traditional field methods for biomonitoring, as both have advantages. If eDNA methods can be ground-truthed as a proxy for relative population estimates, they become a powerful tool to employ when other field methods cannot be conducted, or to increase the spatial or temporal range of sampling by means of cost-efficient and simple protocols [25]. Currently, targeting spawners in the spring means that only a subset of the population is available for capture, and mark-recapture estimates are not possible in years when spawning occurs before nets are deployed [16,18]. Monitoring with eDNA can be done in winter, when the entire population is thought to seek refuge in various upper estuaries throughout the sGSL, where they aggregate densely and restrict movement [6]. Once established in a system that is well characterized by traditional monitoring, eDNA surveys could be more easily expanded to other watersheds than mark-recapture methods.
Over the past decade, environmental DNA has become well established for monitoring species presence/absence [26,27,28], and correlation has been drawn between abundance or biomass and eDNA concentrations in both experimental tanks or ponds [29,30,31,32] and natural lakes, streams or rivers [33,34,35]. However, the relationship between fish biomass or abundance and eDNA concentration is highly variable and often unique within studies. The amount of DNA in the environment is a balance of input (e.g., shedding mucus, cells and feces; spawning) and output (e.g., degradation, settling, transport) [36]. The rates of these processes vary with biological and environmental factors including: temperature, flow, UV exposure, pH, species-specific shedding rates, stress or activity level, age and biomass of living and dead fish [30,37,38,39]. Therefore, inferring live fish counts from eDNA concentrations requires a model unique to the species and environment of interest, and is difficult to transfer between years or river systems [40].
Monitoring overwintering striped bass with eDNA is promising as behavior and environmental conditions are relatively consistent during winter months. The Miramichi River system is normally ice covered, water temperatures are stable just above freezing, tributary flow is minimal and consistent, and bass are thought to cluster together and reduce movement and feeding activity [6,7,41,42]. Under-ice overwintering behavior is inherently difficult to study, though eDNA-based methods have been previously successful in identifying the under-ice overwintering habitats of turtles and salmonids in lakes and streams [25,43,44].
Studying the Miramichi River system also involves the challenges of tidal effects and potential eDNA recirculation [45]. The region exhibits mainly semi-diurnal mixed tides, with tidal effects extending 70 km upstream into the NW and SW Miramichi Rivers in times of low runoff [42,46]. The salt wedge migrates with tidal oscillation and seasonal changes in freshwater discharge, though the exact extent of the salt wedge during winter is not known. Furthermore, the effect of tidal flow on eDNA transport and recirculation is poorly understood. A previous study in a river estuary observed strong tidal influence on eDNA composition near the mouth of the estuary, but little effect upstream [47]. Studies in nearshore coastal environments, examining both natural eDNA and DNA tracers, found little to no effect of tide height, phase or direction on species detection or community eDNA signature [45,48,49].
Here, we evaluated the use of eDNA for under-ice monitoring of overwintering striped bass and factors affecting eDNA distribution in the Miramichi River system. From 2018 to 2020, water samples were collected from transects spanning up to 35 km of the Miramichi River system to determine the distribution and concentration of striped bass eDNA. We evaluated the effects of sampling location, sampling depth, month and tidal phase on eDNA detection. We also assessed the effect of tidal movement on eDNA recirculation with a tidal time series, examining the concentrations of both natural striped bass eDNA and artificial DNA tracers released into the river. Inferences derived from eDNA detections, in conjunction with hydrographic measurements, were validated with acoustic tag data.

2. Materials and Methods

2.1. Study Area

The Miramichi River is located in the southern Gulf of St. Lawrence, on the northeastern coast of the province of New Brunswick, Canada (Figure 1). Two main branches, the NW Miramichi and SW Miramichi, join at Beaubears Island and together account for 84% of the 14,000 km2 total drainage area [42].
Winter sampling of an area spanning 35 km of the Miramichi River system was conducted annually from 2018 to 2020 (Figure 1). Six transects were positioned in the NW Miramichi River over known sGSL striped bass overwintering grounds based on years of acoustic tracking data from 12 static receivers. The locations of transect 1 and transect 6 were based on the farthest upstream and downstream acoustic detection of tagged striped bass using a mobile directional acoustic hydrophone prior to the first sampling event. The initial 6 transects were evenly distributed, roughly 2.5 km apart, and were kept at the same locations every year (with the exception of transect 6 in 2020, see below). Additional transects and sampling sites upstream and downstream of the known overwintering area were added to expand the range of subsequent sampling events. The transect widths ranged from 300 m to 950 m, with each transect containing five evenly spaced holes drilled through the ice, labeled A–E from south bank to north bank. The upstream (US) and downstream (DS) sites contained one hole in the center of the river.

2.2. Field Work

2.2.1. Water Collection

All sites were sampled during a falling tide, at least one hour after peak high tide as determined by Newcastle, NB tide charts with an estimated correction for upstream phase delay. Water samples were collected under the ice, within arm’s reach of the surface. A summary table of each year’s sampling design is available in Supplementary Materials Table S1.
Two sampling events took place in 2018, from February 7th to 8th and March 5th to 7th. Transects 1–6 and sites US1 and DS1 were initially sampled in February, then sites US2, DS2 and DS3 were added in March. Three replicate 1 L samples were collected from each hole. In March, holes C and D in transects 4 and 5 were also sampled at 3 m depth, or 50% of the water column, with a bilge pump.
In 2019, sampling was conducted from February 4th to 12th. US3 was added and the downstream sampling sites were replaced by transects 7–9; a transect was also added in the SW Miramichi River. The upstream sites and transects 2, 6 and 9 were resampled during a rising tide, in the last hour-and-a-half before peak high tide. Two replicate 1 L samples were collected from each hole. Holes C and D in transects 4 and 5 were also sampled with a bilge pump at 50% of the water column depth and 20% off the bottom.
In 2020, sampling was conducted from February 10th to 12th. Only US1 and transects 1–8 were sampled. Four new holes were added to transect 5 for additional sampling resolution and transect 6 was moved 100 m upstream to reduce the effect of turbulence from submerged bridge pilings on continuous flow measurements. Transect 6 was sampled hourly from high tide to the subsequent high tide, hereafter, the tidal time series. The tidal time series samples were tested for striped bass eDNA, as well as three unique, artificial DNA tracers (see tracer production below) to assess eDNA mixing and transport throughout a tidal cycle. Each tracer was released at the surface, just prior to high tide into either the north-most (hole E), center (hole C) or south-most (hole A) holes of transect 5. Two replicate 1 L samples were collected from all holes, except at transect 6 where a single 1 L sample was collected from each hole every hour during the tidal time series.

2.2.2. River Depth and Flow

A Deeper Smart Sonar Pro + (Deeper UAB, Vilnius, Lithuania) was used to measure depth at each hole. In 2019, a Global Water flow meter probe (YSI, Yellow Springs, OH, USA) measured surface flow speed at the time of sample collection for most of the falling and rising tide samples. In 2020, flow velocity at each hole was measured at the time of collection over the entire depth of the water column with a Sentinel-V20 (1000 kHz) acoustic Doppler current profiler (ADCP) (Teledyne RD Instruments, Poway, CA, USA). An ADCP was also deployed at the center hole of transect 6 to collect continuous water flow measurements throughout the tidal time series. Flow speed and direction were measured at 0.25 m depth intervals every 10 min. A relative discharge approximation (m3/s) for the area below the ADCP was calculated as flow speed (m/s) times depth interval (0.25 m) times 1 m transect, summed over all depth intervals (excluding the bottom 0.5 m). All discharge presented as negative values indicate upstream flow direction.

2.2.3. Acoustic Tag Detection

Data from 10 of 12 Vemco VR2s submerged static acoustic receivers (Innovasea, Boston, MA, USA) mounted in the Miramichi River system are presented herein, with the other receivers located outside of the study area and having no detections during the sampling periods (Figure 1c). Three of the receivers, Chatham, Nordine and Strawberry Marsh, were not recoverable in 2020. There were 96 striped bass tagged in 2018, 75 tagged in 2019 and 93 in 2020. Each receiver recorded the number of tagged fish detected on each day of the sampling periods. The daily proportion of detections was calculated for each receiver as the number of tagged fish detected by that receiver over the total number of detections of tagged fish by all receivers. The daily proportion was then averaged over all days in the sampling period and presented as the mean percentage of daily detections for each receiver.

2.3. Filtration and DNA Extraction

The water samples were transported on ice to the Fisheries and Oceans Canada Gulf Fisheries Centre, Moncton, New Brunswick, Canada or South Esk field station, Miramichi, New Brunswick, Canada, and refrigerated until filtration. Samples were filtered between 24 and 48 h after collection with 1.5 µm Whatman glass fiber filters (GE Healthcare, Chicago, IL, USA). Filters were preserved in 200 µL of 95% non-denatured ethanol and frozen at −20 °C until DNA extraction. Sampling bottles filled with 1 L of tap water were transported and stored with samples on every sampling trip as field blanks, and additional bottles were filtered every 20 samples as filtration blanks. DNA was extracted from half-filters with a modified MN NucleoSpin Tissue kit protocol (Macherey-Nagel, Allentown, PA, USA) (Supplementary Materials List S1). Extraction blanks were added after every 20 samples. The resulting DNA extracts were stored at −20 °C and the second half of the filter was kept as a back-up.

2.4. PCR and qPCR

2.4.1. Tracer Production and Release

Three unique, artificial DNA tracers were released separately into either the north-most, center or south-most holes of transect 5 about an hour to an hour-and-a-half before high tide. Samples collected from all holes of transect 6, 2 km downstream, every hour throughout the tidal time series were tested for each tracer. The tracers were named according to release location, in either the “north”-most, “center” or “south”-most hole of transect 5. The tracers were amplicons of three linearized pMA-T or pMK-RQ-Bb plasmid vectors (Thermo Fisher Scientific, Waltham, MA, USA) containing unique COI genes sequences with modified foreign primer and probe binding sites (Table 1). All three tracers were produced by PCR amplification of a long fragment (2032–2311 bp, depending on the vector and insert lengths) of the linearized plasmids containing the unique target sequences (149–170 pb). Each 25 µL PCR reaction contained 7.7 µL of sterile water, 320 nM of each primer (Table 1, Tracer Production), 0.04% BSA, 12.5 µL of 2× Amplitaq Gold 360 PCR Mix (Life Technologies, Burlington, ON, Canada) and 3 uL (0.3 ng) of linearized plasmid. The PCR was done using Bio-Rad T100 thermal cyclers (Bio-Rad, Hercules, CA, USA) with the following parameters: 10 min initial incubation at 95 °C, 40 cycles of 40 s denaturation at 95 °C, 40 s annealing at 58 °C and 180 s extension at 72 °C, and a final extension for 7 min at 72 °C. For each tracer, the products of 95 PCR wells were pooled then verified by gel electrophoresis and quantified with a Qubit 2.0 fluorometer and the Qubit dsDNA BR Assay kit (Life Technologies, Burlington, ON, Canada). The resulting DNA tracer lengths and quantities released are presented in Table 1. Tracer copy number was calculated as:
C o p i e s   p e r   µ L = C o n c e n t r a t i o n   ( ng µ L ) × 6.022 × 10 23 ( c o p i e s mol ) M o l e c u l a r   W e i g h t   ( g mol ) × 1 × 10 9   ( ng g )

2.4.2. qPCR Assays

Primers and probe targeting a 91 bp region of the striped bass mitochondrial cytochrome c oxidase subunit I (COI) gene were designed and assay specificity was confirmed with sequencing and failed amplification of nine local, related salmonid and moronid species. Primers and probes for the detection of tracer DNA were designed to target and amplify 149 to 170 bp of the unique inserts (Table 1). Specificity was verified with gel electrophoresis and failed amplification of non-target tracers and eDNA samples collected prior to tracer release. A subset of samples were tested for PCR inhibition by comparing cycle threshold (CT) values of a 1/10 dilution to the expected increase relative to the undiluted sample.
Quantitative PCR (qPCR) was done with the StepOnePlusTM platform (Thermo Fisher Scientific, Waltham, MA, USA). Each sample was tested in duplicate reactions for striped bass eDNA. All samples collected from the tidal time series were also tested in triplicate for each tracer. Each 25 µL reaction contained 6.8 µL of sterile water, 480 nM of each primer (Table 1), 200 nM of probe (Table 1), 0.04% BSA and 12.5 µL of 2× Master Mix. TaqMan Universal PCR Master Mix (ThermoFisher Scientific, Waltham, MA, USA) was used for the striped bass assay and TaqMan Gene Expression Master Mix (ThermoFisher Scientific, Waltham, MA, USA) was used in the tracer assays. The thermocycler regime was 2 min at 50 °C, 10 min initial incubation at 95 °C, 40 cycles (striped bass) or 50 cycles (tracers) of 30 s denaturation at 95 °C, 30 s annealing at 60 °C and 30 s extension at 72 °C.
Standard curves were used to relate qPCR cycle threshold value to striped bass eDNA concentration and tracer copy number (Table 2). Each standard curve was made from duplicate qPCR assays of three independent serial dilutions. Striped bass genomic DNA and linearized plasmid amplicons were used as the stock solutions for the serial dilutions. Stock solutions were quantified with a Qubit 2.0 fluorometer and the Qubit dsDNA BR and HS Assay kits (Life Technologies, Burlington, ON, Canada). Tracer copy number per reaction was calculated with Equation (1).

2.5. Statistical Analysis

The qPCR CT values for each technical replicate were converted into striped bass eDNA concentration (pg of genomic DNA per 1 L water sample) or tracer copy number per qPCR reaction using standard curve equations (Table 2). Negative results (i.e., no amplification curve) were set to 0 pg/L or 0 tracer DNA copies. There was no significant difference between qPCR technical replicate striped bass eDNA concentrations (paired t-test: t = −0.075, p = 0.940) or tracer DNA copy numbers (Friedman rank sum test: X2 = 1.158, p = 0.561), so technical replicates were pooled into sample means for statistical analysis.
The striped bass eDNA concentrations for each sample mean were ln-transformed. One was added to all sample mean concentrations to remove zeros for the ln-transformation. The US/DS site or transect means and standard deviations were then calculated from ln-transformed sample means. Linear models were fitted to the striped bass eDNA ln-transformed sample means, with applicable combinations of transect, hole, year, sampling depth, tidal phase and month as categorical effects. Where applicable, ANOVAs were run with type II or III Sum of Squares to accommodate unequal sample sizes with and without interaction, respectively. Post hoc comparisons were done with Tukey honest significant difference or with a Tukey–Kramer test to accommodate unequal sample sizes. The results are presented as back-transformed US/DS site or transect mean eDNA concentrations. The error is the back-transformed upper and lower limits of the standard deviation. Non-parametric Kruskal–Wallis rank sum test and Wilcox rank sum test were used to assess differences in tracer DNA copy numbers per qPCR reaction. All analyses were conducted in R version 4.0.4 with the stats (v4.04) [52], car (V3.0-10) [53] and lsmeans (V2.30-0) [54] packages. Figures were made with the ggplot2 (v3.3.3) [55] and gridExtra (v2.3) [56] packages. Maps were made in QGIS version 3.14.16 [57] with New Brunswick hydrographic network data from GeoNB [58]. The river area was roughly divided between sampling holes, and a linear color gradient was added between transects as a visual aid.

3. Results

3.1. qPCR Assay Validation

The standard curve equations, efficiencies, R-squared values, limit of detection (LOD) and limit of quantification (LOQ) for each qPCR assay were derived from the R script presented in Klymus et al., 2019 [50,51], modified to use type 5 quantiles and to accommodate DNA concentration (Table 2).
Sanger sequencing on randomly selected field samples with detected striped bass DNA confirmed that the striped bass assay correctly amplified the striped bass mitochondrial cytochrome c oxidase subunit I (COI) gene. Failed PCR and qPCR amplification of the following salmonid and moronid species confirmed assay specificity: Salmo trutta (brown trout), Salvelinus fontinalis (brook trout), Salvelinus namaycush (lake trout), Oncorhynchus mykiss (rainbow trout), Salvelinus alpinus (arctic char), Salmo salar (Atlantic salmon) and Morone americana (white perch). Each tracer assay amplified the expected fragment size from target tracer and failed to amplify non-target tracers and eDNA samples collected prior to tracer release.
No striped bass eDNA was detected in any of the field, filtration or extraction blanks or PCR negatives. A single PCR replicate of a field blank and a PCR negative on the same plate were positive for the north tracer, both with a CT > 40. There was no evidence of PCR inhibition.

3.2. Acoustic Tag Detection

The percentages of daily tag detections by each receiver were averaged over the durations of the sampling periods (Figure 2 and Figure 3). In February 2018, the mean percentage of daily detections, hereafter detection, at the Hacketts Beach (29.2% ± 0.9%) and Eel Ground (29.2% ± 3.8%) receivers were not different from each other, but were significantly higher than detections at all other receivers (all p < 0.001). In March 2018, detection at the Eel Ground (27.8% ± 10.7%) receiver was not different from Hacketts Beach or Strawberry Marsh, but was significantly higher than all others (all p < 0.040). From February to March 2018, detection decreased significantly at the Hacketts Beach receiver (p = 0.006) and increased significantly at Strawberry Marsh (p = 0.008); no other receivers experienced significant changes in detection. In 2019, detection was highest (all p < 0.001) at the Eel Ground (53.3% ± 6.7%) receiver. In 2020, detections at the Millstream (46.1% ± 8.5%) and Hacketts Beach (48.6% ± 7.7%) receivers did not differ, and were higher than at all other receivers (all p < 0.001).
Detection at the Eel Ground receiver increased significantly from 2018 to 2019 (p < 0.001), while detection at the Hacketts Beach receiver decreased (p = 0.004). Detection at the Eel Ground receiver then decreased from 2019 to 2020 (p < 0.001) while detections at Hacketts Beach and Millstream receivers increased (all p < 0.001).
No detections occurred as far upstream as the Cassilis receiver, or as far downstream as the Loggieville receiver during any of the sampling periods. A small proportion of acoustic tag detections occurred in the SW Miramichi River in 2018 and 2019, but not in 2020. No detections were registered at the Millerton receiver (10 km upstream of the SW Miramichi Transect, data not shown) during any of the sampling periods.

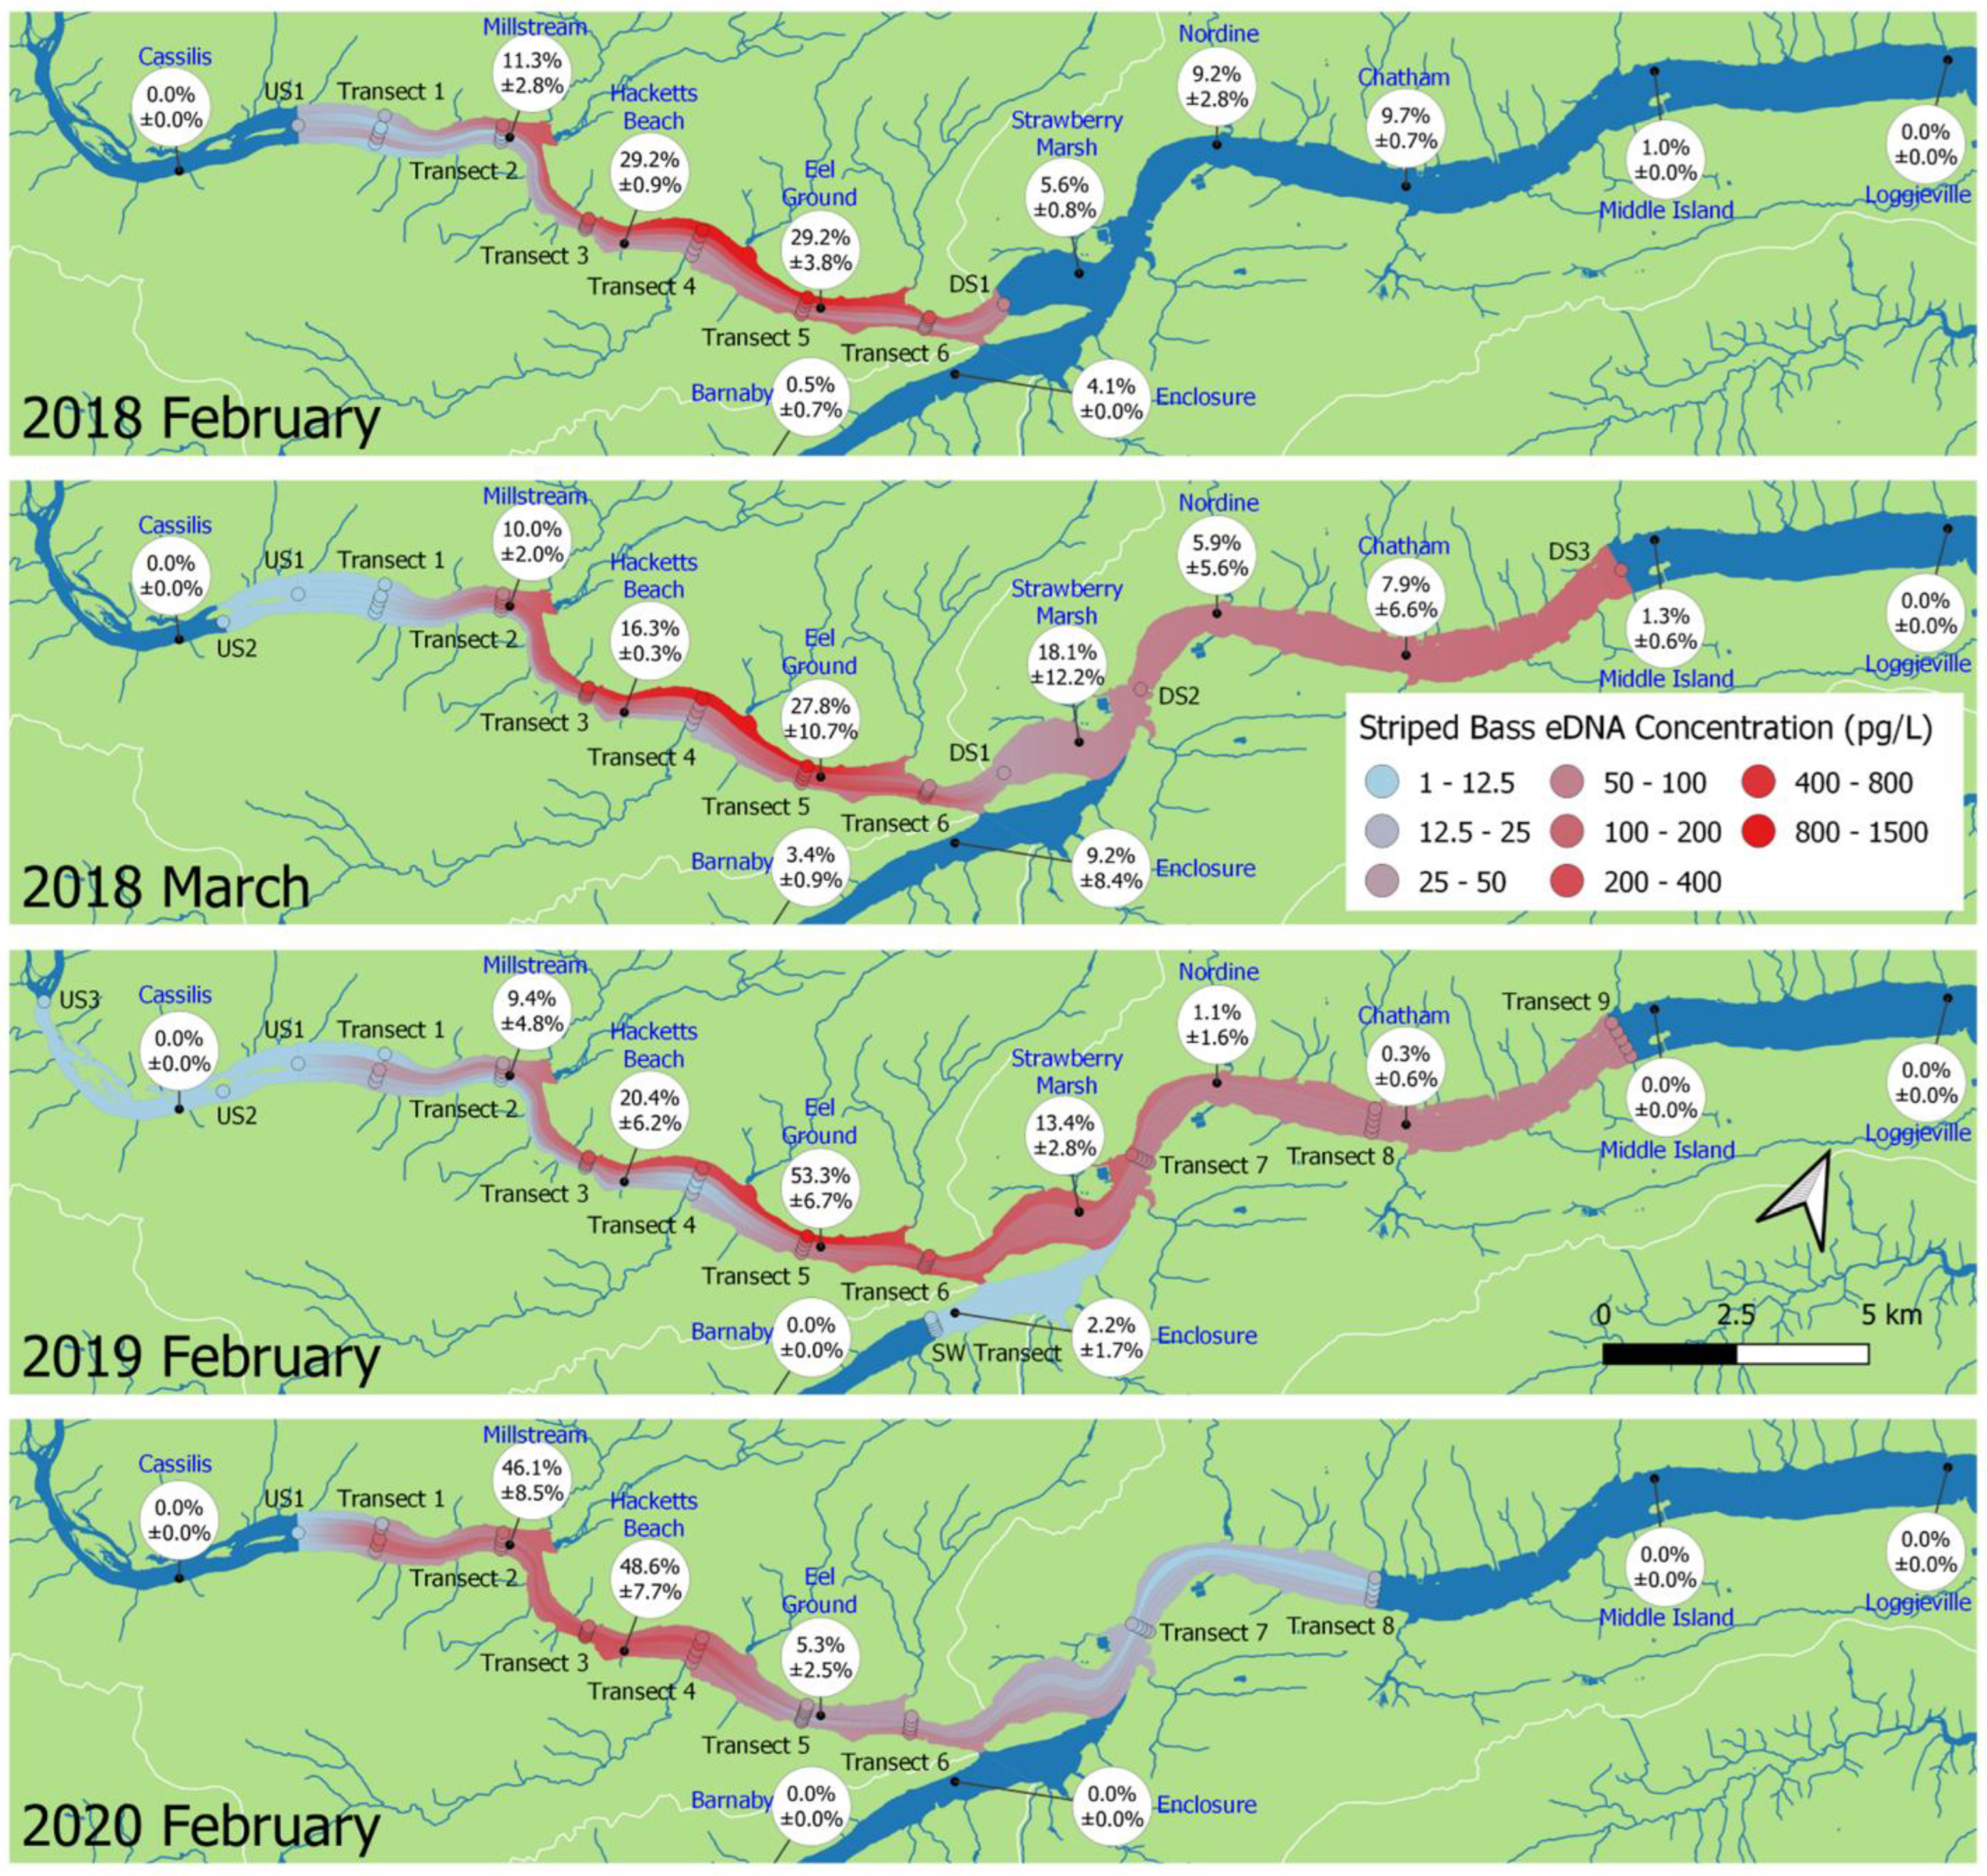
3.3. Interannual Comparisons of eDNA Distribution

Interannual variability in eDNA distribution between and across transects was analyzed from samples collected on a falling tide in February (Figure 2 February panels and Figure 3 red lines). Since samples were collected from transect 6 in 2020 on rising and falling tides, only the samples collected on a falling tide at 14:00 were included in this analysis. Sample mean striped bass eDNA concentrations (±SD) ranged from below the theoretical limit of detection to a maximum of 1455.8 pg/L (±47.4) in 2018, 956.3 pg/L (±45.9) in 2019 and 366.0 pg/L (±36.1) in 2020.
For each year, linear models were fitted with the effects of transect and hole. In all years, there were significant differences in eDNA concentration between transects (all F > 22.28, p < 0.001) (Figure 3). The lowest concentrations were in samples collected at upstream sites (US1–US3) and in the SW Miramichi River (Figure 2). Concentrations downstream of Beaubears Island (DS1–3 and transects 7–9) were relatively homogeneous across transects and stable over increasing downstream distance (Figure 2 and Figure 3). The highest eDNA concentrations were detected on the north side of transects 4 and 5 in 2018 and transect 5 in 2019. The 2018 and 2019 linear models indicate that hole position within a transect was a significant factor (all F > 7.07, p < 0.001), with eDNA concentration significantly higher on the north side of the river (Figure 2). In 2018, concentrations at the two north-most holes (D and E) were significantly different from all other holes and from each other (hole D: all t < −3.06, p < 0.024; hole E: all t < −3.16, p < 0.021), and in 2019, concentrations at the north-most hole E were significantly higher than concentrations at all other hole positions, except at the adjacent hole D (all t < −4.13, p < 0.001). None of the eDNA concentrations at the remaining hole positions were different from each other. In 2020, the extreme high concentrations on the north side were not observed, despite sampling nine holes at transect 5 for increased resolution, there was no significant effect of hole on eDNA concentration (F = 0.991, p = 0.451).
For interannual comparison of eDNA concentration and distribution, sites sampled in February of all three years (US1 and transects 1 to 6) were included in a linear model with year, transect and interaction effects. Overall, eDNA concentrations were not significantly different between years (F = 1.51, p = 0.223); however, the distribution of eDNA did vary between years at individual transects (Figure 3). Concentration of eDNA at transect 4 decreased from 2018 to 2019 (t = −4.65, p < 0.001). Concentrations at all transects except US1 changed between 2019 and 2020 (all |t| > 2.44, p < 0.041): transects 1 through 4 increased, while transects 5 and 6 decreased.

3.4. Effect of Sampling Month

In 2018, sampling was conducted in February and in March to identify changes in striped bass eDNA distribution during the overwintering season (Figure 3a). A linear model controlling for the effect of transect indicated no significant overall effect of sampling month (F = 1.71, p = 0.193), but the effect of month varied between transects (F = 3.40, p = 0.002). Concentrations of eDNA at US1 and transect 1 decreased (t = 2.04, p = 0.043 and t = 2.80, p = 0.006, respectively) while concentrations at transect 2 increased (t = −2.56, p = 0.011) between February and March.
As in February, eDNA concentrations in March were highest on the north side of the river (Figure 2). Concentrations at the south-most hole (A) were significantly lower than at any other position (all t < −3.11, p < 0.021), while concentrations at the north-most hole (E) were higher than at all other positions, except the adjacent hole D (all t < −2.84, p < 0.043).

3.5. Effect of Sampling Depth

In 2018, four sites were sampled at the surface and at 3 m depth, approximately 50% off the bottom. In 2019, the same sites were additionally sampled at approximately 20% off the bottom (Figure 4). Sampling depth did not have a significant effect on eDNA concentration when controlling for the effects of transect, hole and year (F = 0.093; p = 0.911).

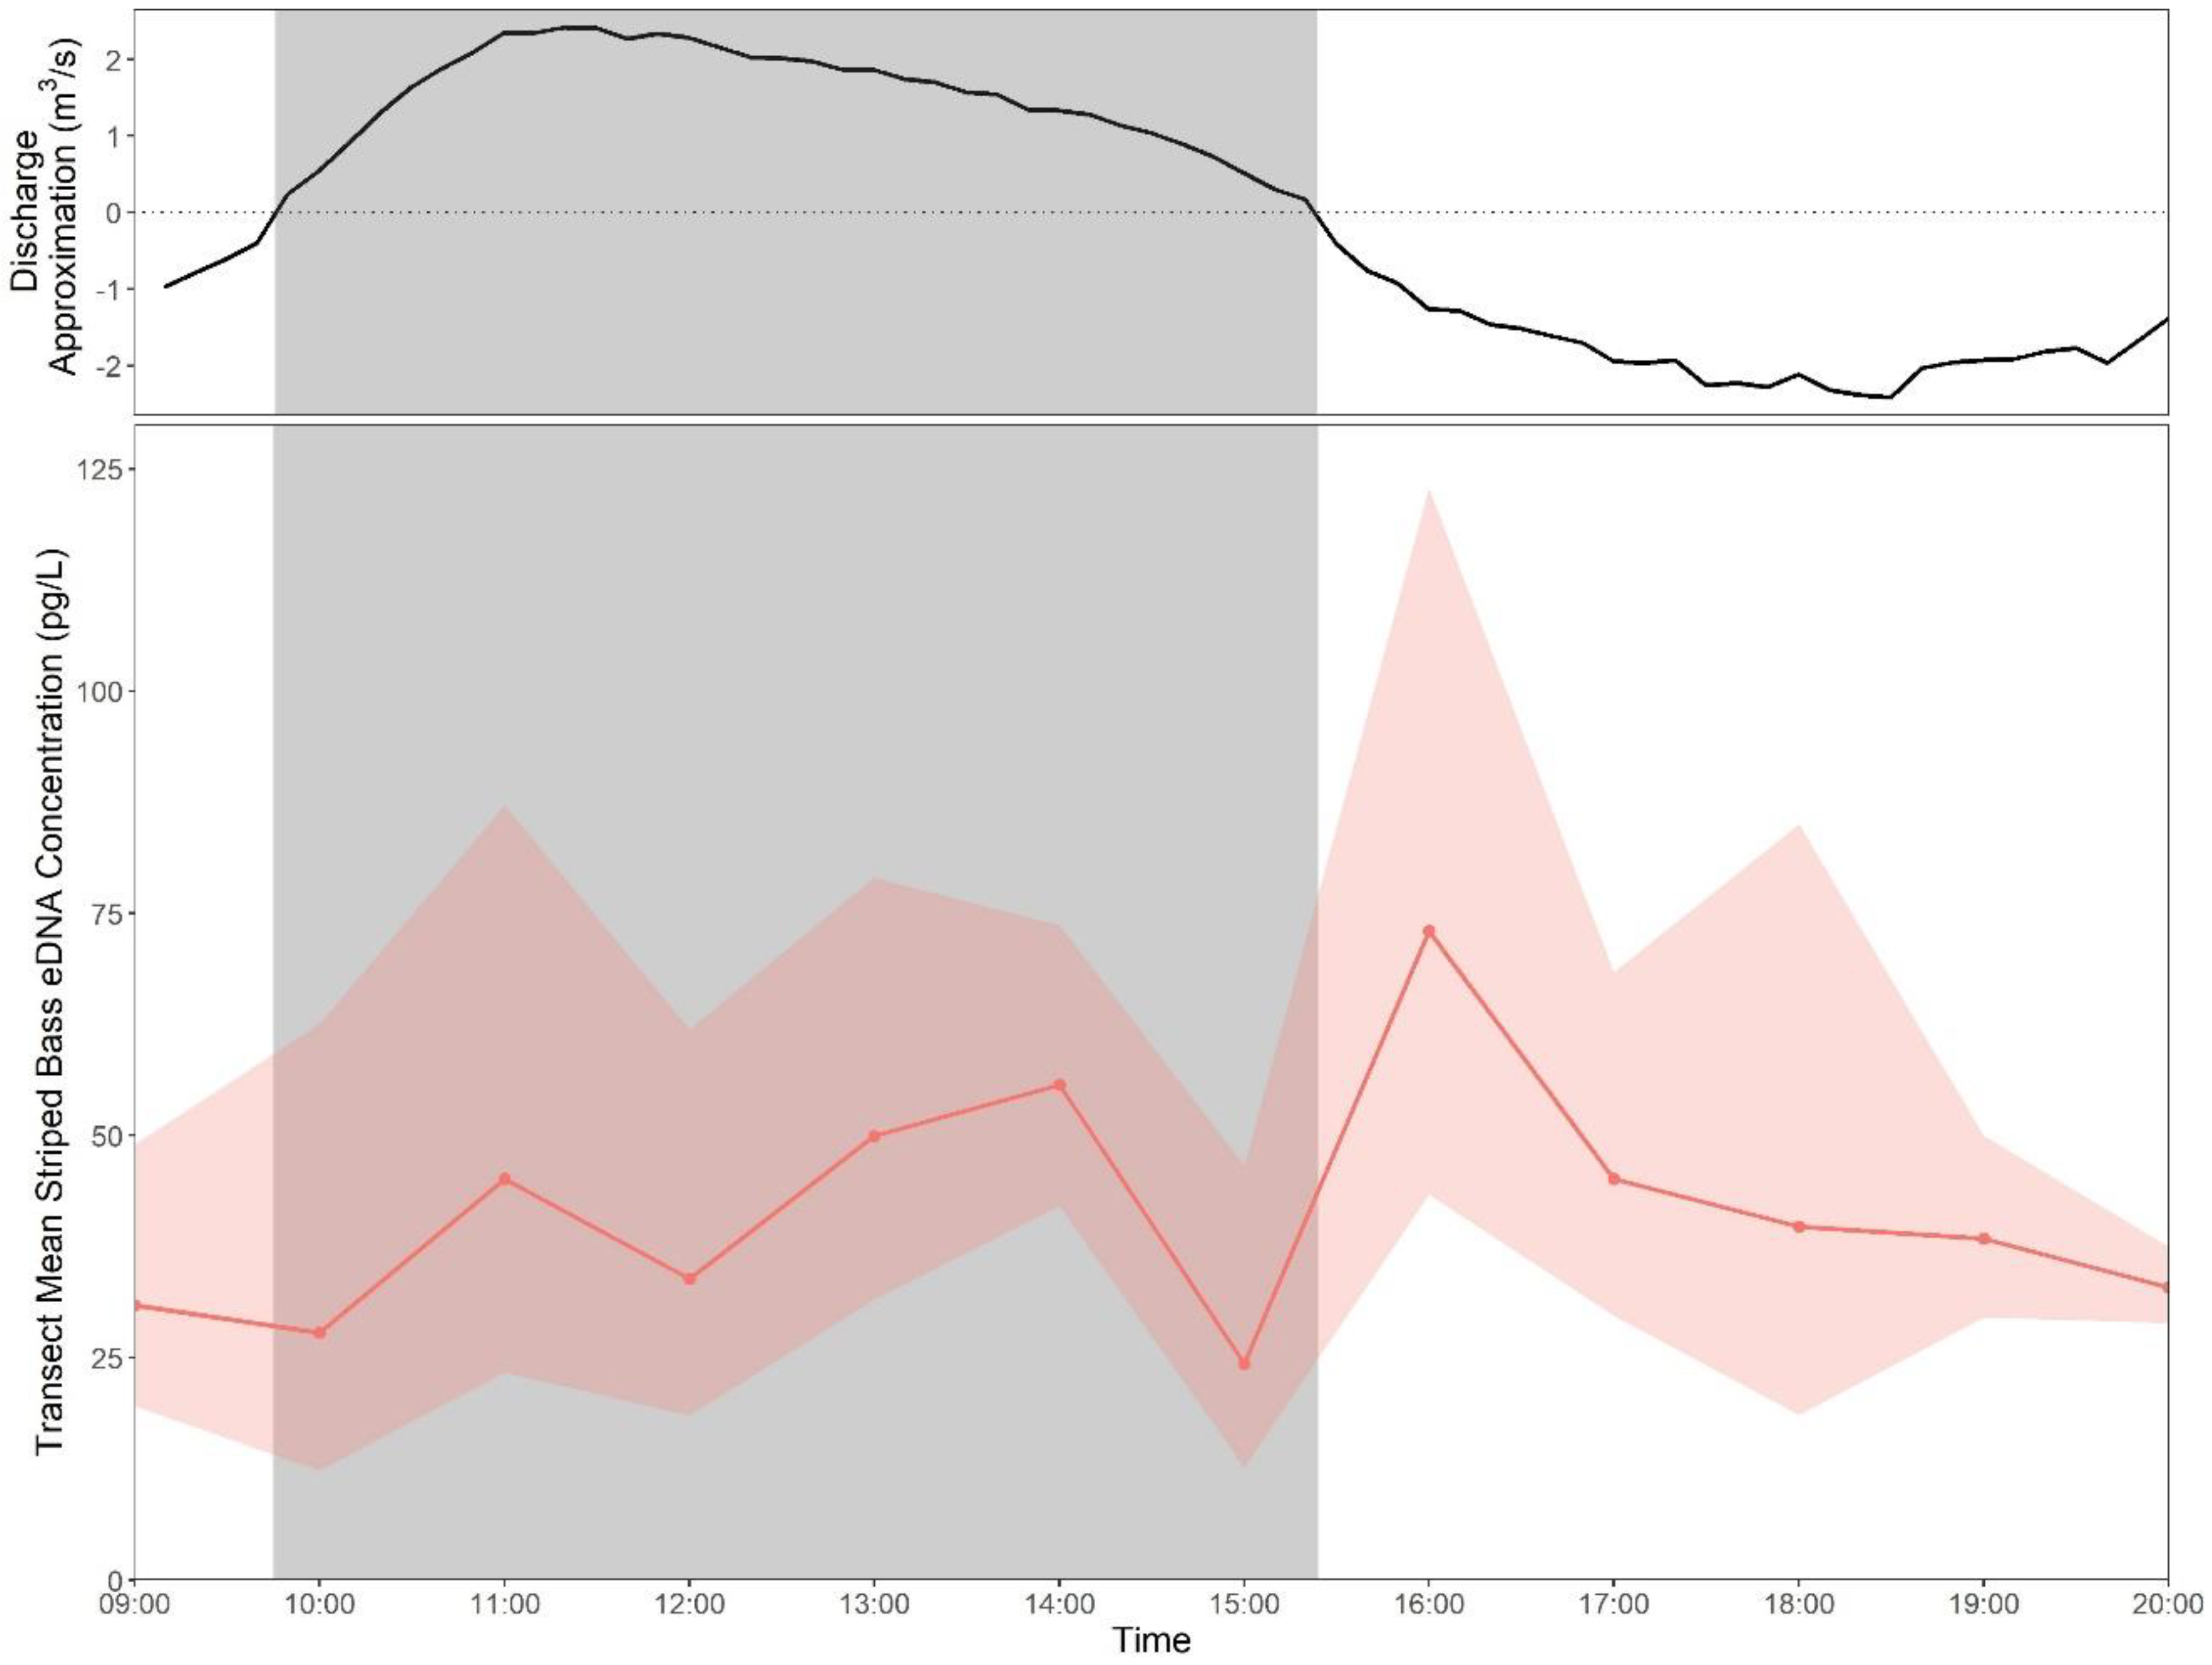
3.6. Effect of Tides

In 2019, upstream sites and transects 2, 6 and 9 were resampled on the rising tide, and eDNA concentrations were compared to those of the falling tide using a linear model (Figure 3b). All rising tide sampling was done on the larger of the mixed tides and was intended to occur at the end of the rising tide; however, later comparison against tide gauge data (not shown) indicated that the upstream sites and transect 2 were sampled at the beginning of the rising tide due to unpredictable phase delays near the upstream limit of the tidal influence. The effect of tide was not significant when controlling for the effect of transect (F = 0.008, p = 0.927). Furthermore, the effect of tide did not vary between transects (interaction F = 1.502, p = 0.203). Concentrations at the most upstream site (US3) remained below the limit of detection.

3.6.1. Tidal Time Series
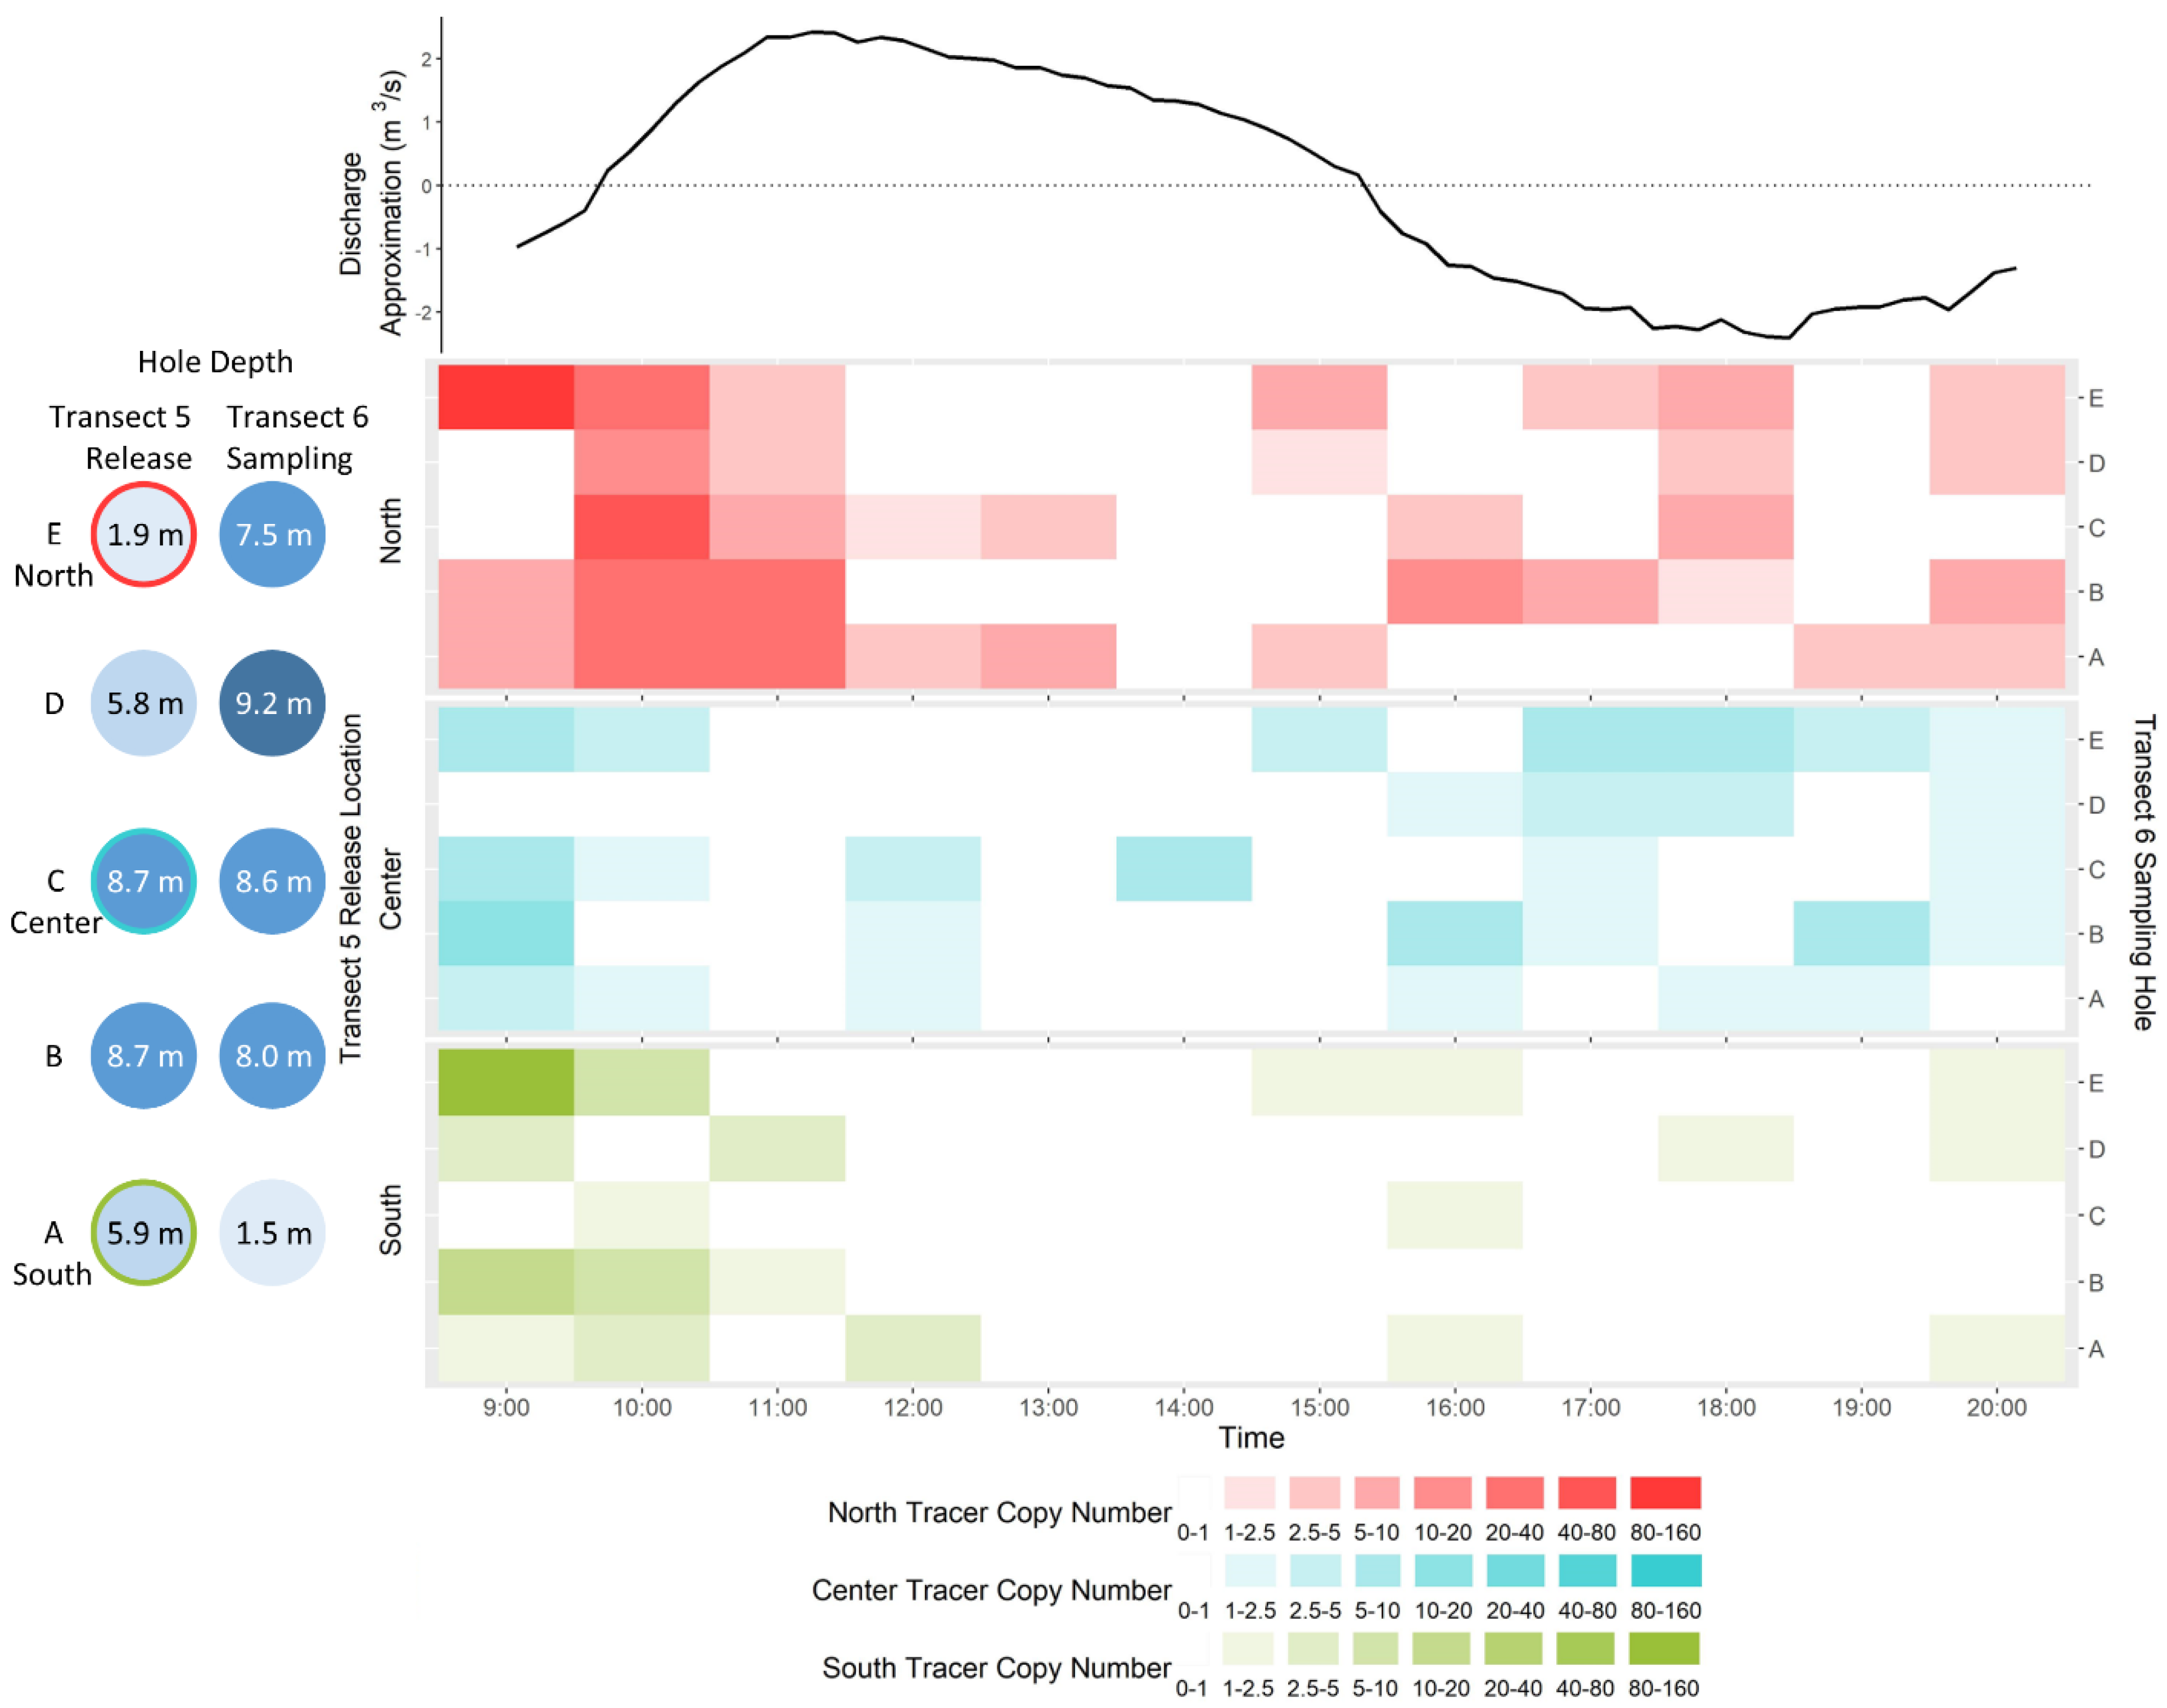
In 2020, transect 6 was sampled hourly between two consecutive high tides, from small tide to large tide. Overall, the effect of sampling time was not significant (F = 1.66, p = 0.112) and there were no significant differences between striped bass eDNA concentrations at any two time points (Figure 5).

3.6.2. DNA Tracers

The 9:00 time point was excluded from analysis due to possible contamination and ADCP data indicating that the tide was rising until 9:50 (Figure 6). Detection of the north tracer was significantly greater than that of the center tracer (W = 1860, p = 0.03) and detections of both the north and center tracers were greater than the south tracer (both W > 1203, p < 0.04), despite the fact that roughly 50% more copies of the south tracer were released relative to the center tracer (Table 1). Of the 55 samples collected, the north tracer was detected in 30 samples with up to 49.0 (±25.9) copies per sample, the center tracer was detected in 25 samples with up to 7.7 (±2.9) copies per sample and the south tracer was detected in 15 samples with up to 8.7 (±4.9) copies per sample.
When considering all tracers together, the highest copy number detection was at the beginning of the falling tide (10:00), an hour to an hour-and-a-half after tracer release (Figure 6). This was significantly greater than at any time afterwards (all W > 23, p < 0.032). The lowest total tracer detection was observed at 14:00, about an hour-and-a-half before low tide. Tracer copy number detection increased with the subsequent rising tide. Total tracer copy number detected in the middle of the rising tide (18:00) was higher than what had been detected at late falling tide (14:00) (W = 3, p = 0.057). The water across the transect appears to be well mixed in the 2 km between release and sampling sites. There was no significant effect of sampling hole for any of the tracers, on either falling (10:00–15:00) or rising (16:00–20:00) tides (all X2 < 5.3, p > 0.26).

4. Discussion

4.1. eDNA Distribution

Both eDNA and acoustic monitoring identified the expected overwintering grounds in the NW Miramichi River, located at the most upstream portion of the salt water influence near the spawning grounds, known to be in the vicinity of transects 1 to 6 with highest egg densities near transects 3 to 5 [11,14]. The highest eDNA concentrations observed in the NW Miramichi River between transects 1 and 6 were corroborated by acoustic receiver detections between Millstream and Strawberry Marsh. No detections occurred as far upstream as the Cassilis receiver, which supports the minimal eDNA concentrations detected at the upstream sites. Some striped bass overwintering in the SW Miramichi River is not unexpected [6], and acoustic tags were detected there in 2018, though none were detected upstream of the SW transect in 2019, where minimal eDNA concentrations were observed.
Environmental DNA concentrations were generally lower and more consistent downstream in the Miramichi River than in the Northwest branch. The decrease is best explained as dilution by mixing with SW Miramichi waters, as opposed to degradation, which is expected to be minimized by the cold water temperatures and ice cover from UV irradiation [38,59,60]. We suspect that a large proportion of the eDNA detected in the Miramichi River was transported downstream from the NW branch, based on the uniform distribution across downstream distance and previous studies, as well as the tracer results herein, demonstrating that eDNA can be transported several kilometers downstream in rivers [61,62,63]. However, we are unable to distinguish new eDNA input from downstream transport and roughly a quarter to a third of acoustic detections in 2018, and a sixth in 2019, occurred below the junction of the NW and SW branches of the Miramichi River, where some fish are expected to overwinter in deep pools or channels [6]. No acoustic tag detections were registered by the Loggieville receiver near the mouth of the river, indicating that no tagged fish were recorded leaving the estuary during the sampling periods. It is worth noting that only adult striped bass were tagged in this study, and while juvenile ecology is thought to be similar, their exact overwintering behavior and eDNA contribution is largely unknown [64].
The location of the overwintering habitat as determined by both eDNA and acoustic monitoring was relatively consistent between years, but an upstream shift in 2020 was observed with both methods. This demonstrates that eDNA-based monitoring has the sensitivity to resolve relatively fine scale (5 km) shifts in distribution. Similarly, striped bass overwintering sites in the Kouchibouguac River are thought to be spatially constricted and interannually consistent, which is based both on the locations of commercial winter fisheries, which occurred until 1996, and acoustic tag monitoring [7]. High site fidelity to limited, well defined overwintering habitats has also been demonstrated by striped bass in the Saint John River returning to the same locations annually [12]. The upstream shift could have been in response to a change in environmental conditions (e.g., temperature, salinity, dissolved oxygen, flow speed) in 2020 relative to previous years [12], though no obvious differences in temperature or precipitation were observed and discharge data was not available at the time of writing [41].
Generally, low variability in the daily acoustic tag detections indicates little movement between receivers during the sampling periods. The exception was during the March 2018 sampling event, where tagged fish appear to have moved upstream in the middle of the sampling period. The proportion of daily detections at the Chatham, Nordine and Strawberry Marsh receivers dropped by roughly the same amount as increases at the Enclosure (SW Miramichi) and Eel Ground receivers. Previous studies of tagged sGSL striped bass overwintering in the Kouchibouguac and St. Louis Rivers showed that distributions were both spatially restricted and persistent, with tagged individuals occupying the same 0.5–1 km stretches for the duration of the tracking experiments (mid-December and early February to mid-March, respectively) [7]. Nonetheless, movement within an overwintering season is possible; it has been suggested that sGSL bass may move downstream into coastal lagoons or even exit the estuary during extreme cold weather events [6], and bass overwintering in the Saint John River appeared to move downstream following large rainfall events, due to either displacement by increased river discharge or in response to altered temperatures and salinities [12]. However, no such extreme cold or precipitous weather events were observed during, or in the weeks prior to the March 2018 sampling event [65].
The bass are thought to reside near the bottom, sheltered in the low flow benthic boundary layer or in deep pockets where pools of dense saline water are relatively undisturbed below the salt wedge [6,66]. To account for this behavior, eDNA samples were collected at different depths in 2018 and 2019. Both of the holes (C and D) in both transects (4 and 5) selected for this additional sampling are located within the main channel, based on depth measurements. However, there was no difference in eDNA concentrations between samples collected at the surface and those collected from the middle and bottom of the water column. This could indicate that the waters are well mixed vertically in this portion of the NW Miramichi River, though ice cover is thought to increase stratification [42]; alternatively, bass may be more evenly dispersed throughout the water column than previously thought.

4.2. eDNA Recirculation

We hypothesized that tidal oscillations may result in recirculation and accumulation of eDNA in a water mass as it moves back and forth past the overwintering striped bass population, and that upstream and downstream flow may transport eDNA away from the source location, resulting in trace detections of eDNA at the US1 site. In 2019, the upstream sites (US1–3) and transect 2, all located upstream of the highest observed eDNA concentrations, were resampled on a rising tide to confirm this hypothesis. A tidal signal in water elevation was detected by a fixed tide gauge as far upstream as Cassilis (near US2), however, the semi-diurnal mixed pattern is distorted and unpredictable. The sampling times were set according to tide tables with a correction factor for the upstream delay in tidal phase [42], and later comparison against tide gauge measurements revealed that transect 2 and the upstream sites were sampled at the beginning of the rising tide, and not at the end as intended. As a result, eDNA concentrations were not different from those of the falling tide samples, and remained below the limit of detection at the upstream sites.
Transects 6 and 9 were also selected for resampling on a rising tide based on their locations downstream of the main overwintering grounds, and just upstream of the junction with the SW Miramichi River and the mouth of the estuary, respectively. We expected to see high eDNA concentration water flowing past the transects on a falling tide, and diluted, low eDNA concentration water flowing back upstream past the transects on a rising tide. Both transects were accurately resampled in the second half of the rising tide, according to fixed tide gauge measurements at Eel Ground and Loggieville, however, no change in eDNA concentrations was observed at either transect. This was further investigated with hourly sampling at transect 6 in 2020, and still there was no significant difference in eDNA concentration between any time points. In both 2019 and 2020, there was no significant difference between eDNA concentrations at transects 5, 6 or 7, so it is not surprising that concentrations did not change as water moved back and forth between these transects. In 2019, both eDNA and acoustic data indicated that the population was located near transect 6, including a portion slightly downstream, so eDNA may have been input on both falling and rising tides. Evidence of bass overwintering downstream of transect 6 is not available in 2020 as those acoustic receivers were not recoverable; however, the eDNA distribution indicates that bass were located upstream, near transect 3, and that mixing and dilution occurred upstream of transect 6, thereby muting the contrast between falling and rising tide concentrations.
Tidal recirculation patterns may be less pronounced when monitoring the continuous release of striped bass eDNA, input over a broad geographic range, compared to the single, point source release of tracers, which were more consistent with expected recirculation patterns. Tracer detection was highest at the beginning of the falling tide, as the tracers initially flowed downstream past transect 6, then decrease towards the end of the falling tide after they had passed through. Detection then increased with the rising tide as tracers were recirculated back past the transect. There was no difference in detection of any tracer between holes in transect 6, despite separate release locations, suggesting that river is laterally well mixed on both falling and rising tides.
The north tracers was the most strongly detected, both in terms of highest copy numbers and most positive samples. This corresponds generally to the number of copies initially released, roughly 80% greater than the center tracer, and 15% greater than the south tracer, though the increased detection, particularly at the beginning of the falling tide, may have been reinforced by hydrological features. The south and center tracers were released near the main channel into deeper and faster flowing waters than the north tracer, and may have been transported downstream past transect 6 between sampling time points, or before the first sampling began.
It is worth noting that almost all of the samples exhibited tracer copy numbers well below the assay limits of detection (i.e., the calculated copy number above which 95% of samples will test positive in at least one replicate). A 9:00 time point was sampled, but was removed from analysis as the ADCP data indicated an upstream flow direction until 9:50. Extremely high copy numbers of the north and south tracers were detected at 9:00 in hole E, despite the upstream flow. This may have been contamination as the north tracer was detected in a single PCR replicate from a field blank. However, among the strongest detections of all tracers were observed in all holes of transect 6 by the 10:00 sampling, suggesting either that the tracers traveled 2 km downstream prior to, or within the first 10 min of falling tide, or that the tides are not transporting water as we anticipated. It is possible that the salt wedge formed under the ice in a way that permitted continuous downstream flow of a freshwater surface layer, with upstream movement of the salt wedge below. The ADCP flow direction data indicated that water at all depths flowed upstream with the rising tide, however, we cannot account for a thin surface layer below the ice into which the tracers were released.
Our findings of weak or unobserved effects of tide on eDNA distribution are consistent with the literature. Previous studies of eDNA in nearshore coastal environments showed no effect of tide height or phase on species detection by eDNA [45,48], and a coastal study looking at both natural eDNA and DNA tracers found that tide direction accounted for less than 20% of the variation in the eDNA signature [49]. Research examining the effects of tide in a river estuary, not unlike the Miramichi, found strong tidal influence on community eDNA composition at stations near the mouth of the estuary, but little effect upriver [47]. They found that at low tide, community eDNA composition at the downstream and upstream stations were very similar, and that the profile at the downstream stations changed strongly with the rising tide, however, no such change was observed at upstream stations. In the context of similar findings in the literature, our seemingly inconclusive results from three experiments testing the effect of tides on eDNA distribution demonstrate how complex these tidal systems really are. Understanding flow patterns in these systems, and their impact on eDNA transport and recirculation may require more in-depth models including comprehensive bathymetry and flow parameters. In practice, sampling at the same relative time point in the tidal cycle will reduce the impact of this phenomenon, although our results indicate a negligible tidal effect in the areas sampled.

5. Conclusions

Our study demonstrates that eDNA is an effective tool for monitoring overwintering striped bass. The locations of acoustic tag detections corroborated the distribution of striped bass eDNA, and accurately identified areas of high and low occupancy with relatively high resolution. Winter eDNA sampling was predicted to offer consistency by way of stable eDNA output due to limited activity and feeding, low degradation rates due to cold temperatures and ice cover, and consistent and minimal river discharge. This study has further shown eDNA-based results to be robust against the effects of sampling depth, month and tidal influence. Just as this consistency has facilitated interannual comparisons, it may also enable the expansion of monitoring studies to other watersheds. Over time, relative amounts of eDNA can be used to infer population fluctuations. Efforts towards deriving a biomass estimate from eDNA measurements are currently underway, with the intention of developing a population monitoring tool that is complimentary to, and more cost effective than traditional methods for population estimates.

Supplementary Materials

The following supporting information can be downloaded at: https://www.mdpi.com/article/10.3390/fishes7040183/s1, Table S1: Summary of sampling design by year, and List S1: eDNA extraction protocol.

Author Contributions

Conceptualization, N.B., F.L., R.S., S.D., P.C. and N.G.; methodology, N.B., F.L., R.S., N.G. and M.H.; validation, M.H. and N.B.; formal analysis, M.H.; resources, P.C., T.G., S.D. and N.G.; data curation, M.H.; writing—original draft preparation, M.H.; writing—review and editing, F.L. and N.G.; visualization, M.H.; supervision and project administration, N.G., P.C. and S.D.; funding acquisition, P.C. and N.G. All authors have read and agreed to the published version of the manuscript.

Funding

This project was supported by Fisheries and Oceans Canada.

Institutional Review Board Statement

Not applicable.

Informed Consent Statement

Not applicable.

Data Availability Statement

Raw data were generated at DFO’s Gulf Fisheries Centre. Derived data supporting the findings of this study are available from the corresponding author on request.

Acknowledgments

We would like to thank Kari Underhill, Abby Daigle, Matthew Horsman, Joe Sheasgreen and John Hayward for their work collecting water samples out on the ice.

Conflicts of Interest

The authors declare no conflict of interest.

References

  1. Douglas, S.G.; Bradford, R.G.; Chaput, G. Assessment of Striped Bass (Morone saxatilis) in the Maritime Provinces in the Context of Species at Risk. In Canadian Science Advisory Secretariat; Canada Department of Fisheries and Oceans: Ottawa, ON, Canada, 2003. [Google Scholar]
  2. Fisheries and Oceans Canada (DFO). Update of Spawner Abundance and Biological Characteristics of Striped Bass (Morone saxatilis) in the Southern Gulf of St. Lawrence to 2018. In Canadian Science Advisory Secretariat; Canada Department of Fisheries and Oceans: Ottawa, ON, Canada, 2019; p. 9. [Google Scholar]
  3. COSEWIC. Assessment and Status Report on the Striped Bass Morone saxatilis in Canada; Committee on the Status of Endangered Wildlife in Canada: Ottawa, ON, Canada, 2004. [Google Scholar]
  4. Wirgin, I.; Ong, T.-L.; Maceda, L.; Waldman, J.R.; Moore, D.; Courtenay, S. Mitochondrial DNA Variation in Striped Bass (Morone saxatilis) from Canadian Rivers. Can. J. Fish. Aquat. Sci. 1993, 50, 80–87. [Google Scholar] [CrossRef]
  5. Fisheries and Oceans Canada (DFO). Spawner Abundance and Biological Characteristics of Striped Bass (Morone saxatilis) in the Southern Gulf of St. Lawrence in 2017. In Canadian Science Advisory Secretariat; Canada Department of Fisheries and Oceans: Ottawa, ON, Canada, 2018; p. 9. [Google Scholar]
  6. Andrews, S.N.; Buhariwalla, C.F.; Fleet-Pardy, B.; Dadswell, M.J.; Linnansaari, T.; Curry, R.A. Left out in the Cold: The Understudied Overwintering Ecology of Striped Bass in Canada. Environ. Biol. Fishes 2019, 102, 499–518. [Google Scholar] [CrossRef]
  7. Bradford, R.G.; Tremblay, E.; Chaput, G. Winter Distribution of Striped Bass (Morone saxatilis) and Associated Environmental Conditions in Kouchibouguac National Park during 1996–1997; Canadian Heritage, Parks Canada: Gatineau, QC, Canada, 1998; Volume 59. [Google Scholar]
  8. Rulifson, R.A.; Dadswell, M.J. Life History and Population Characteristics of Striped Bass in Atlantic Canada. Trans. Am. Fish. Soc. 1995, 124, 477–507. [Google Scholar] [CrossRef]
  9. Bradford, R.G.; Chaput, G. Status of Striped Bass (Morone saxatilis) in the Gulf of St. Lawrence in 1996 and Revised Estimates of Spawner Abundance for 1994 and 1995. In CSAS, Canadian Stock Assessment Secretariat; Canada Department of Fisheries and Oceans: Ottawa, ON, Canada, 1997; pp. 1–31. [Google Scholar]
  10. Buhariwalla, C.F.; Macmillan, J.L.; Gregoire, M.J.; Dadswell, M.J.; Stokesbury, M.J.W. Population Characteristics of Striped Bass Killed by Cold Shock during Winter Shutdown of a Power Plant in Nova Scotia. Northeast. Nat. 2016, 23, 163–173. [Google Scholar] [CrossRef]
  11. Douglas, S.G.; Chaput, G.; Caissie, D. Assessment of Status and Recovery Potential for Striped Bass (Morone saxatilis) in the Southern Gulf of St. Lawrence. In Science Advisory Secretariat Research Document; Canada Department of Fisheries and Oceans: Ottawa, ON, Canada, 2006; p. 103. [Google Scholar]
  12. Andrews, S.N.; Linnansaari, T.; Curry, R.A.; Leblanc, N.M.; Pavey, S.A. Winter Ecology of Striped Bass (Morone saxatilis) near Its Northern Limit of Distribution in the Saint John River, New Brunswick. Environ. Biol. Fishes 2020, 103, 1343–1358. [Google Scholar] [CrossRef]
  13. Bradford, R.G.; Chaput, G. The Status of Striped Bass (Morone saxatilis) in the Southern Gulf of St. Lawrence in 1995; Canada Department of Fisheries and Oceans: Ottawa, ON, Canada, 1996; Volume 1996.
  14. Robichaud-LeBlanc, K.A.; Courtenay, S.; Locke, A. Spawning and Early Life History of a Northern Population of Striped Bass (Morone saxatilis) in the Miramichi River Estuary, Gulf of St. Lawrence. Can. J. Zool. 1996, 74, 1645–1655. [Google Scholar] [CrossRef]
  15. Douglas, S.G.; Chaput, G.; Hayward, J.; Sheasgreen, J. Prespawning, Spawning, and Postspawning Behavior of Striped Bass in the Miramichi River. Trans. Am. Fish. Soc. 2009, 138, 121–134. [Google Scholar] [CrossRef]
  16. Fisheries and Oceans Canada (DFO). Update to 2012 on Spawner Abundance and Biological Characteristics for Striped Bass (Morone saxatilis) in the Southern Gulf of St. Lawrence. In Canadian Science Advisory Secretariat; Canada Department of Fisheries and Oceans: Ottawa, ON, Canada, 2013. [Google Scholar]
  17. COSEWIC. Assessment and Status Report on the Striped Bass Morone saxatilis in Canada; Committee on the Status of Endangered Wildlife in Canada: Ottawa, ON, Canada, 2012. [Google Scholar]
  18. Douglas, S.G.; Chaput, G. Assessment and Status of Striped Bass (Morone saxatilis) in the Southern Gulf of St. Lawrence, 2006 to 2010. In CSAS, Canadian Stock Assessment Secretariat; Canada Department of Fisheries and Oceans: Ottawa, ON, Canada, 2011. [Google Scholar]
  19. Fisheries and Oceans Canada (DFO). Recreation Fishery Catches, Spawner Abundance, and Biological Characteristics of Striped Bass (Morone saxatilis) in the Southern Gulf of St. Lawrence in 2014. In Canadian Science Advisory Secretariat; Canada Department of Fisheries and Oceans: Ottawa, ON, Canada, 2015. [Google Scholar]
  20. Fisheries and Oceans Canada (DFO). Spawner Abundance and Biological Characteristics of Striped Bass (Morone saxatilis) in the Southern Gulf of St. Lawrence in 2016. In Canadian Science Advisory Secretariat; Canada Department of Fisheries and Oceans: Ottawa, ON, Canada, 2017. [Google Scholar]
  21. Fisheries and Oceans Canada (DFO). Recreational Fishery Catches, Spawner Abundance, and Biological Characteristics of Striped Bass (Morone saxatilis) in the Southern Gulf of St. Lawrence in 2013. In Canadian Science Advisory Secretariat; Canada Department of Fisheries and Oceans: Ottawa, ON, Canada, 2014. [Google Scholar]
  22. Fisheries and Oceans Canada (DFO). Spawner Abundance and Biological Characteristics of Striped Bass (Morone saxatilis) in the Southern Gulf of St. Lawrence in 2015. In Canadian Science Advisory Secretariat; Canada Department of Fisheries and Oceans: Ottawa, ON, Canada, 2016. [Google Scholar]
  23. Chaput, G.; Douglas, S.G. Hierarchical Bayesian Model to Estimate the Spawning Stock of Striped Bass (Morone saxatilis) in the Northwest Miramichi River, 1994 to 2010. In Canadian Science Advisory Secretariat; Canada Department of Fisheries and Oceans: Ottawa, ON, Canada, 2011; Volume iv, 51p. [Google Scholar]
  24. Fisheries and Oceans Canada (DFO). Update of Spawner Abundance and Biological Characteristics of Striped Bass (Morone saxatilis) in the Southern Gulf of St. Lawrence to 2019. In Canadian Science Advisory Secretariat; Canada Department of Fisheries and Oceans: Ottawa, ON, Canada, 2020; pp. 1–9. [Google Scholar]
  25. Khalsa, N.S.; Smith, J.; Jochum, K.A.; Savory, G.; López, J.A. Identifying Under-Ice Overwintering Locations of Juvenile Chinook Salmon by Using Environmental DNA. N. Am. J. Fish. Manag. 2020, 40, 762–772. [Google Scholar] [CrossRef]
  26. Thomsen, P.F.; Willerslev, E. Environmental DNA—An Emerging Tool in Conservation for Monitoring Past and Present Biodiversity. Biol. Conserv. 2015, 183, 4–18. [Google Scholar] [CrossRef]
  27. Goldberg, C.S.; Strickler, K.M.; Pilliod, D.S. Moving Environmental DNA Methods from Concept to Practice for Monitoring Aquatic Macroorganisms. Biol. Conserv. 2015, 183, 1–3. [Google Scholar] [CrossRef] [Green Version]
  28. Rees, H.C.; Maddison, B.C.; Middleditch, D.J.; Patmore, J.R.M.; Gough, K.C. The Detection of Aquatic Animal Species Using Environmental DNA—A Review of eDNA as a Survey Tool in Ecology. J. Appl. Ecol. 2014, 51, 1450–1459. [Google Scholar] [CrossRef]
  29. Doi, H.; Uchii, K.; Takahara, T.; Matsuhashi, S.; Yamanaka, H.; Minamoto, T. Use of Droplet Digital PCR for Estimation of Fish Abundance and Biomass in Environmental DNA Surveys. PLoS ONE 2015, 10, e0122763. [Google Scholar] [CrossRef] [PubMed] [Green Version]
  30. Klymus, K.E.; Richter, C.A.; Chapman, D.C.; Paukert, C. Quantification of eDNA Shedding Rates from Invasive Bighead Carp Hypophthalmichthys nobilis and Silver Carp Hypophthalmichthys molitrix. Biol. Conserv. 2015, 183, 77–84. [Google Scholar] [CrossRef]
  31. Lacoursière-Roussel, A.; Rosabal, M.; Bernatchez, L. Estimating Fish Abundance and Biomass from eDNA Concentrations: Variability among Capture Methods and Environmental Conditions. Mol. Ecol. Resour. 2016, 16, 1401–1414. [Google Scholar] [CrossRef] [PubMed]
  32. Takahara, T.; Minamoto, T.; Yamanaka, H.; Doi, H.; Kawabata, Z. Estimation of Fish Biomass Using Environmental DNA. PLoS ONE 2012, 7, e35868. [Google Scholar] [CrossRef] [Green Version]
  33. Lacoursière-Roussel, A.; Côté, G.; Leclerc, V.; Bernatchez, L. Quantifying Relative Fish Abundance with eDNA: A Promising Tool for Fisheries Management. J. Appl. Ecol. 2016, 53, 1148–1157. [Google Scholar] [CrossRef]
  34. Wilcox, T.M.; McKelvey, K.S.; Young, M.K.; Sepulveda, A.J.; Shepard, B.B.; Jane, S.F.; Whiteley, A.R.; Lowe, W.H.; Schwartz, M.K. Understanding Environmental DNA Detection Probabilities: A Case Study Using a Stream-Dwelling Char Salvelinus fontinalis. Biol. Conserv. 2016, 194, 209–216. [Google Scholar] [CrossRef] [Green Version]
  35. Pilliod, D.S.; Goldberg, C.S.; Arkle, R.S.; Waits, L.P. Estimating Occupancy and Abundance of Stream Amphibians Using Environmental DNA from Filtered Water Samples. Can. J. Fish. Aquat. Sci. 2013, 70, 1123–1130. [Google Scholar] [CrossRef]
  36. Barnes, M.A.; Turner, C.R. The Ecology of Environmental DNA and Implications for Conservation Genetics. Conserv. Genet. 2016, 17, 1–17. [Google Scholar] [CrossRef] [Green Version]
  37. Pilliod, D.S.; Goldberg, C.S.; Arkle, R.S.; Waits, L.P. Factors Influencing Detection of eDNA from a Stream-Dwelling Amphibian. Mol. Ecol. Resour. 2014, 14, 109–116. [Google Scholar] [CrossRef]
  38. Strickler, K.M.; Fremier, A.K.; Goldberg, C.S. Quantifying Effects of UV-B, Temperature, and pH on eDNA Degradation in Aquatic Microcosms. Biol. Conserv. 2015, 183, 85–92. [Google Scholar] [CrossRef]
  39. Tillotson, M.D.; Kelly, R.P.; Duda, J.J.; Hoy, M.; Kralj, J.; Quinn, T.P. Concentrations of Environmental DNA (eDNA) Reflect Spawning Salmon Abundance at Fine Spatial and Temporal Scales. Biol. Conserv. 2018, 220, 1–11. [Google Scholar] [CrossRef]
  40. Yates, M.C.; Fraser, D.J.; Derry, A.M. Meta-analysis Supports Further Refinement of eDNA for Monitoring Aquatic Species-specific Abundance in Nature. Environ. DNA 2019, 1, 5–13. [Google Scholar] [CrossRef]
  41. Environment and Climate Change Canada (ECCC). Daily Discharge Graph for Northwest Miramichi River at Trout Brook (01BQ001) [NB]. Historical Hydrometric Data. 2022. Available online: https://wateroffice.ec.gc.ca/report/historical_e.html?stn=01BQ001 (accessed on 5 May 2022).
  42. Vilks, G.; Krauel, D.P. Environmental Geology of the Miramichi Estuary: Physical Oceanography; Geological Survey of Canada: Ottawa, ON, Canada, 1982; Volume 81, pp. 1–53.
  43. Feng, W.; Bulté, G.; Lougheed, S.C. Environmental DNA Surveys Help to Identify Winter Hibernacula of a Temperate Freshwater Turtle. Environ. DNA 2020, 2, 200–209. [Google Scholar] [CrossRef]
  44. Minamoto, T.; Hayami, K.; Sakata, M.K.; Imamura, A. Real-Time Polymerase Chain Reaction Assays for Environmental DNA Detection of Three Salmonid Fish in Hokkaido, Japan: Application to Winter Surveys. Ecol. Res. 2019, 34, 237–242. [Google Scholar] [CrossRef]
  45. Kelly, R.P.; Gallego, R.; Jacobs-Palme, E. The Effect of Tides on Nearshore Environmental DNA. PeerJ 2018, 6, e4521. [Google Scholar] [CrossRef] [Green Version]
  46. Lafleur, C.; Pettigrew, B.; Booth, D.A.; Chadwick, M. Chapter 4 Seasonal and Short-Term Variations in the Estuarine Structure of the Miramichi. Can. Spec. Publ. Fish. Aquat. Sci. 1995, 123, 45–72. [Google Scholar]
  47. Schwentner, M.; Zahiri, R.; Yamamoto, S.; Husemann, M.; Kullmann, B.; Thiel, R. eDNA as a Tool for Non-Invasive Monitoring of the Fauna of a Turbid, Well-Mixed System, the Elbe Estuary in Germany. PLoS ONE 2021, 16, e0250452. [Google Scholar] [CrossRef]
  48. Lafferty, K.D.; Garcia-Vedrenne, A.E.; McLaughlin, J.P.; Childress, J.N.; Morse, M.F.; Jerde, C.L. At Palmyra Atoll, the Fish-Community Environmental DNA Signal Changes across Habitats but Not with Tides. J. Fish Biol. 2021, 98, 415–425. [Google Scholar] [CrossRef]
  49. Ely, T.; Barber, P.H.; Man, L.; Gold, Z. Short-Lived Detection of an Introduced Vertebrate eDNA Signal in a Nearshore Rocky Reef Environment. PLoS ONE 2021, 16, e0245314. [Google Scholar] [CrossRef]
  50. Merkes, C.; Klymus, K.; Allison, M.; Goldberg, C.; Helbing, C.; Hunter, M.; Jackson, C.; Lance, R.; Mangan, A.; Monroe, E.; et al. Generic qPCR Limit of Detection (LOD)/Limit of Quantification (LOQ) Calculator. R Script 2019. [Google Scholar] [CrossRef]
  51. Klymus, K.E.; Merkes, C.M.; Allison, M.J.; Goldberg, C.S.; Helbing, C.C.; Hunter, M.E.; Jackson, C.A.; Lance, R.F.; Mangan, A.M.; Monroe, E.M.; et al. Reporting the Limits of Detection and Quantification for Environmental DNA Assays. Environ. DNA 2019, 2, 271–282. [Google Scholar] [CrossRef] [Green Version]
  52. R Core Team. R: A Language and Environment for Statistical Computing; R Foundation for Statistical Computing: Vienna, Austria, 2021; Available online: https://www.r-project.org/ (accessed on 14 May 2021).
  53. Fox, J.; Sanford, W. An {R} Companion to Applied Regression, 3rd ed.; Sage: Thousand Oaks, CA, USA, 2019. [Google Scholar]
  54. Length, R.V. Least-Squares Means: The R Package Lsmeans. J. Stat. Softw. 2016, 69, 1–33. [Google Scholar] [CrossRef] [Green Version]
  55. Wickham, H. Gplot2: Elegant Graphics for Data Analysis; Springer: New York, NY, USA, 2016. [Google Scholar]
  56. Auguie, B. GridExtra: Miscellaneous Functions for “Grid” Graphics. R Package Version 2.3. 2017. Available online: https://CRAN.R-project.org/package=gridExtra (accessed on 14 May 2021).
  57. QGIS Geographic Information System. QGIS Association, 2021. Available online: http://www.qgis.org (accessed on 13 December 2021).
  58. Service New Brunswick, New Brunswick Hydrographic Network (NBHN). GeoNB. Available online: http://www.snb.ca/geonb1/e/DC/NBHN.asp (accessed on 20 September 2018).
  59. Curtis, A.N.; Larson, E.R.; Davis, M.A. Field Storage of Water Samples Affects Measured Environmental DNA Concentration and Detection. Limnology 2021, 22, 1–4. [Google Scholar] [CrossRef]
  60. Eichmiller, J.J.; Best, S.E.; Sorensen, P.W. Effects of Temperature and Trophic State on Degradation of Environmental DNA in Lake Water. Environ. Sci. Technol. 2016, 50, 1859–1867. [Google Scholar] [CrossRef] [PubMed]
  61. Pont, D.; Rocle, M.; Valentini, A.; Civade, R.; Jean, P.; Maire, A.; Roset, N.; Schabuss, M.; Zornig, H.; Dejean, T. Environmental DNA Reveals Quantitative Patterns of Fish Biodiversity in Large Rivers despite Its Downstream Transportation. Sci. Rep. 2018, 8, 1–13. [Google Scholar] [CrossRef] [Green Version]
  62. Deiner, K.; Altermatt, F. Transport Distance of Invertebrate Environmental DNA in a Natural River. PLoS ONE 2014, 9, e88786. [Google Scholar] [CrossRef] [Green Version]
  63. Villacorta-Rath, C.; Hoskin, C.J.; Strugnell, J.M.; Burrows, D. Long Distance (>20 km) Downstream Detection of Endangered Stream Frogs Suggests an Important Role for eDNA in Surveying for Remnant Amphibian Populations. PeerJ 2021, 9, e12013. [Google Scholar] [CrossRef]
  64. Douglas, S. Personal Communication; DFO: Moncton, NB, Canada, 2022.
  65. Environment and Climate Change Canada (ECCC). Daily Data Report for Miramichi RCS New Brunswick. Historical Weather and Climate Data. 2022. Available online: https://climate.weather.gc.ca/climate_data/daily_data_e.html (accessed on 5 May 2022).
  66. Hurst, T.P.; Conover, D.O. Activity-Related Constraints on Overwintering Young-of-the-Year Striped Bass (Morone saxatilis). Can. J. Zool. 2001, 79, 129–136. [Google Scholar] [CrossRef]
Figure 1. Map of the study area and sampling sites: (a) map of Quebec (QC), New Brunswick (NB), Prince Edward Island (PE), Nova Scotia (NS) and Maine, USA (ME), with New Brunswick in dark green and the Miramichi watershed in light green, (b) fine-scale view of waterbodies in the Miramichi watershed with the study area framed, (c) fine-scale view of the sampling sites with transects, upstream (US) and downstream (DS) sites, and acoustic receivers (blue) indicated. The Loggieville and Barnaby receivers are located 5.5 km downstream of the Middle Island receiver and upstream of the SW transect, respectively.
Fishes 07 00183 g001
Figure 2. Interannual comparison of back-transformed site mean striped bass eDNA concentration (pg/L) and mean percent of daily detections ± standard deviation at each acoustic receiver in February 2018, March 2018, February 2019 and February 2020. Transect, upstream (US) site, downstream (DS) site and acoustic receiver (blue) names are indicated. All sites were sampled at the surface, on a falling tide. Dark blue waters were outside of the sampled area.
Fishes 07 00183 g002
Figure 3. Back-transformed transect mean striped bass eDNA concentrations (pg/L) ± standard deviation for surface samples collected (a) on a falling tide in February and March 2018, (b) in February 2019 on falling and rising tides and (c) in February 2020 on a falling tide. Transect 6 in 2020 is represented by the 14:00 samples from the tidal time series; 2020 transect 5 consists of nine sampling holes. Dashed lines and hollow points are mean percentage of daily detections ± standard deviation for each acoustic receiver during the sampling periods (right axis). Distances along the x axis is to scale.
Fishes 07 00183 g003
Figure 4. Back-transformed mean striped bass eDNA concentrations (pg/L) ± standard deviation for 2018 and 2019 samples collected at the surface, 3 m depth or 50% off the bottom (Middle), and 20% off the bottom (Bottom) from holes C and D in transect 4 and 5.
Fishes 07 00183 g004
Figure 5. Back-transformed time point mean striped bass eDNA concentrations (pg/L) ± standard deviation for tidal time series samples collected from transect 6 in 2020. A discharge approximation (m3/s) was calculated as the sum of flow speed (m/s) at each depth interval (0.25 m) for a 1 m transect under the ADCP. Shaded area represents falling tide as determined by ADCP measurements.
Fishes 07 00183 g005
Figure 6. Heat maps of mean DNA copy number per qPCR reaction for each tracer in samples collected from the 2020 tidal time series. Distinct tracers were released into either the north-most (red, top panel), center (blue, middle panel) or south-most (green, bottom panel) holes in transect 5 approximately 1 h before sampling began at transect 6. Samples collected from all transect 6 holes ((AE), right axis) at each timepoint (9:00–20:00) were tested for all three tracers. Falling tide, as determined by ADCP measurements, was from 9:50 to 15:30. A discharge approximation (m3/s) was calculated as the sum of flow speed (m/s) at each depth interval (0.25 m) for a 1 m transect under the ADCP. Negative values denote upstream flow. The depths of holes at transects 5 and 6 are presented on the left to indicate the location of the main channel.
Fishes 07 00183 g006
Table 1. PCR and qPCR assay information for striped bass eDNA detection, tracer production and tracer detection. The table contains the primers and probes used for each assay, and the length of the target sequence that they amplify. Tracers are named according to the location of release in transect 5; for each: tracer length and quantity released refer to the linearized plasmid PCR amplicons used as tracers, and target length refers to the sequence detected by qPCR from filtered water sample DNA extracts.
AmpliconTracer Length (bp)Quantity Released (Copies × 1012)Target Length (bp)Primers and Probes
Striped Bass COI F: 5′-TGCTTCCCCCATCCTTCCTC-3′
--91R: 5′-TGCTTGCAAGAGGGGGGTAA-3′
Probe: 5′ FAM- TCTAGCTTCTTCAGGTGTC-MGB
Tracer Production--See Tracer LengthsF: 5′-GAGCGGATACATATTTGAATGTATTTAGA-3′
R: 5′-TGATAATCTCATGACCAAAATCCCTT-3′
North Tracer Detection F: 5′-CCACTAGCCGGCAACCTAGC-3′
203296.78170R: 5′-GATCATACGAACAGAGGTGTTTGG-3′
Probe: 5′ FAM-CCTCAGTAGACCTAACTAT-MGB
Center Tracer Detection F: 5′-AGGTCTCGTAGGATCATCTCTTGGAT-3′
231153.82161R: 5′-ATGTAATGTTCGGCACGGGTAGTT-3′
Probe: 5′ FAM-CCGGAGTAATGATTGAT-MGB
South Tracer Detection F: 5′-GGATTCGGGACGACCCG-3′
219284.65149R: 5′-CAATCAATTTCCGAATCCTCCACT-3′
Probe: 5′ FAM-CGCCGGTAGCTCT-MGB
Table 2. Standard curve equations and associated adjusted R2, efficiency, LOD and LOQ for striped bass and artificial DNA tracer qPCR assays. LOD is the 95% limit of detection determined by probit modeling [50]. LOQ is the limit of quantification as determined by decay modeling, the lowest detectable concentration with coefficient of variance less than 35% [51]. LOD and LOQ units are pg of genomic DNA per L for the striped bass assay and DNA copies per qPCR reaction for the tracers.
AssayEquationAdjusted R2EfficiencyLODLOQ
Striped BasseDNA Conc. = 10(Ct − 32.39)/−3.990.993178.0%12.4 pg/L46.0 pg/L
North TracerDNA Copies = 10(Ct − 43.20)/−3.900.999080.3%28.1 Copies80.0 Copies
Center TracerDNA Copies = 10(Ct − 41.46)/−3.740.995685.2%52.5 Copies52.5 Copies
South TracerDNA Copies = 10(Ct − 38.58)/−3.630.998788.7%48.2 Copies232 Copies
Publisher’s Note: MDPI stays neutral with regard to jurisdictional claims in published maps and institutional affiliations.

