Article

Designing a Multi-Parameter Method to Assess the Adaptation Period of Crucian Carp under Stress Conditions of the Bionic Robot Fish

1
School of Agricultural Engineering, Jiangsu University, Zhenjiang 212013, China
2
College of Biosystems Engineering and Food Science, Zhejiang University, Hangzhou 310027, China
*
Author to whom correspondence should be addressed.
Fishes 2022, 7(4), 198; https://doi.org/10.3390/fishes7040198
Submission received: 14 July 2022 / Revised: 31 July 2022 / Accepted: 6 August 2022 / Published: 8 August 2022

Abstract

:
Changes in the physiological and behavioral states of fish are affected by foreign substances. Therefore, fish need a certain adaptation period to eliminate the stress response. Herein, in order to determine the adaptation period, the bionic robot fish was used to obtain behavioral information about crucian carp, which was tested at five time points (1st, 7th, 14th, 21st and 28th day) within 28 days. First, the fear response and exploratory behavior of crucian carp affected by three-color bionic robot fish were explored. Then, according to the measurement results of the behavior, morphology, and feeding, and the physiological and biochemical properties of the crucian carp, a multi-parameter evaluation method was proposed to determine the adaptation period of the crucian carp under this monitoring mode. The results showed that more than 4 areas were occupied by crucian carp from the 21st day. From the 16th day, the number of crucian carp swimming with clear outlines gradually increased. The number of abnormal swimming occurrences decreased on day 13. More than 80% of the crucian carp body color returned to dark on the 23rd day. The crucian carp did not respond to food until day 19, when most of the crucian carp began to scramble for food. Food consumption reached more than two thirds on day 22. In addition, glucose and total protein leveled off after day 21, when mean hemoglobin levels were highest. Triglycerides showed a trend of first decreasing and then increasing. The pigmented area of the skin section gradually decreases and eventually stabilizes. In summary, it takes at least 23 days for the crucian carp to adapt to the influence of the bionic robot fish.

1. Introduction

The welfare of fish is one of the important reference factors in aquaculture. In aquaculture experiments, fish are inevitably exposed to adverse environments, which can have a significant impact on fish welfare [1]. In some cases, fish can develop negative emotional states and even exhibit abnormal behavior, which ultimately leads to poor fish welfare [2]. However, too many external stimuli, such as temperature changes [3], toxic stimuli in the water environment [4], and external noise interference [5], will affect fish welfare and even lead to fish death.
Emotions are important messages for animal welfare [6]. The behavioral habits of fish are influenced by emotions, and negative emotions can cause freezing behavior in fish [7,8]; this reflects the animal’s subjective nervous system state and ability to avoid injury [9]. The emotional state of fish can be affected by foreign-object intrusion, and this effect can last for about one week. In addition, emotions can make fish react quickly in emergencies [10]. For example, when a fish exhibits fear, this enables it to develop reactive behaviors and respond to danger [11]. Fear can stimulate the survival function of fish; it can cause fish to produce behavior to protect themselves from harm [12]. Therefore, emotions can modify the behavioral characteristics and physiological parameters of fish. So, how to eliminate fear and the stress state of fish is the focus of research.
Most studies of fish under stress are reflected in biochemical, hematological and behavioral parameters [13,14]. Glucose level is one of the main parameters of fish stress response [15]. When fish are under stress, glucose levels in blood can change dramatically in response. Some researchers have tested other biochemical parameters and hematological indicators to analyze the stress status of fish after changes in the external environment, such as total protein, triglyceride and mean hemoglobin concentration [16]. In addition, the assessment of fish location distribution, swimming characteristics, food intake, and changes in body color are also useful tools for testing whether fish are under stress [17,18,19,20].
Before the experiment, the fish need to adapt to the environment [21]. The purpose is to ensure that the fish blood parameters tend to be at normal levels, so as to reduce experimental errors as much as possible [22]. Sources of experimental error include transporting fish to designated experimental sites, arranging monitoring cameras in fish boxes, and noise caused by turning on equipment. These processes are always mentioned in studies, where stress duration and criteria for assessing fish state stability are lacking. Determining the adaptation period for fish by a specific parameter is not feasible, and the use of multi-parameter indicators reflecting fish welfare is considered to be a more reliable solution [23].
Monitoring fish with bionic robot fish can make an impact on their behavior and physiology. At present, the most common ways to obtain fish behavior information are to arrange cameras [24], to use implantable electronic tags [25], and sonar [26]. The third is mainly used in large-scale water scenarios, and the first two will produce a certain stress response in fish. However, there are relatively few studies using bionic robot fish to obtain fish behavior information. Therefore, few studies have determined the minimum acclimation period for crucian carp to return to normal levels after being stressed by the bionic robot fish.
To sum up, the main purposes of this study are: (1) using three-color bionic robot fish to measure the fear index of experimental fish. (2) using a multi-parameter evaluation method based on behavior, feeding, biochemistry and physiology to monitor the stress response of experimental fish. (3) to clarify the adaptation period of experimental fish returning to normal after being affected by the bionic robot fish.

2. Materials and Methods

2.1. Experimental Materials

The crucian carp (140 tails, 110 ± 5 g per culture unit) used in this study were provided by Guangdong Xiongfeng Fry Co., Ltd., Shunde, China. They were first acclimated in RAS for 30 days. RAS includes water quality monitoring systems, oxygen supply pans, thermostats and filters. And there are two containers (6 m × 2 m × 2 m) in the experiment. The material of the containers is rectangular in pvc. The water temperature was maintained at 23–26 °C, the pH was maintained at 6.2–6.7, the ammonia nitrogen level was maintained at 0–0.12 mg/L and the nitrite content was maintained at 0–0.12 mg/L. There were five aeration pans in each container and they are evenly distributed in the container. Ten percent of the water was replaced every day. During this period, the fish were placed on a 12 h:12 h light–dark cycle and fed twice a day (8:30 and 17:30). During each feeding process, the pelleted feed was manually fed to the fish until the fish were at satiety. The upper limit of the daily feeding amount was 2% of the total weight of the test fish. In addition, commercial pellets (protein 35%, fat 5%, ash 15% and water 12.5%) were provided by Shandong Binzhou Ruixing Biotechnology Co., Ltd., Binzhou, China. During the entire experiment, only one person entered the experimental area to feed the fish and clean the tank. The bionic robot fish were acquired from Boya Gongdao (Beijing) Robotics Technology Co., Ltd., Beijing, China. They are bionic and designed based on the prototype of the tropical boxfish. They have the characteristics of high energy conversion efficiency, low noise, small disturbance and high flexibility. And they can autonomously identify the target object and achieve the purpose of tracking and shooting.

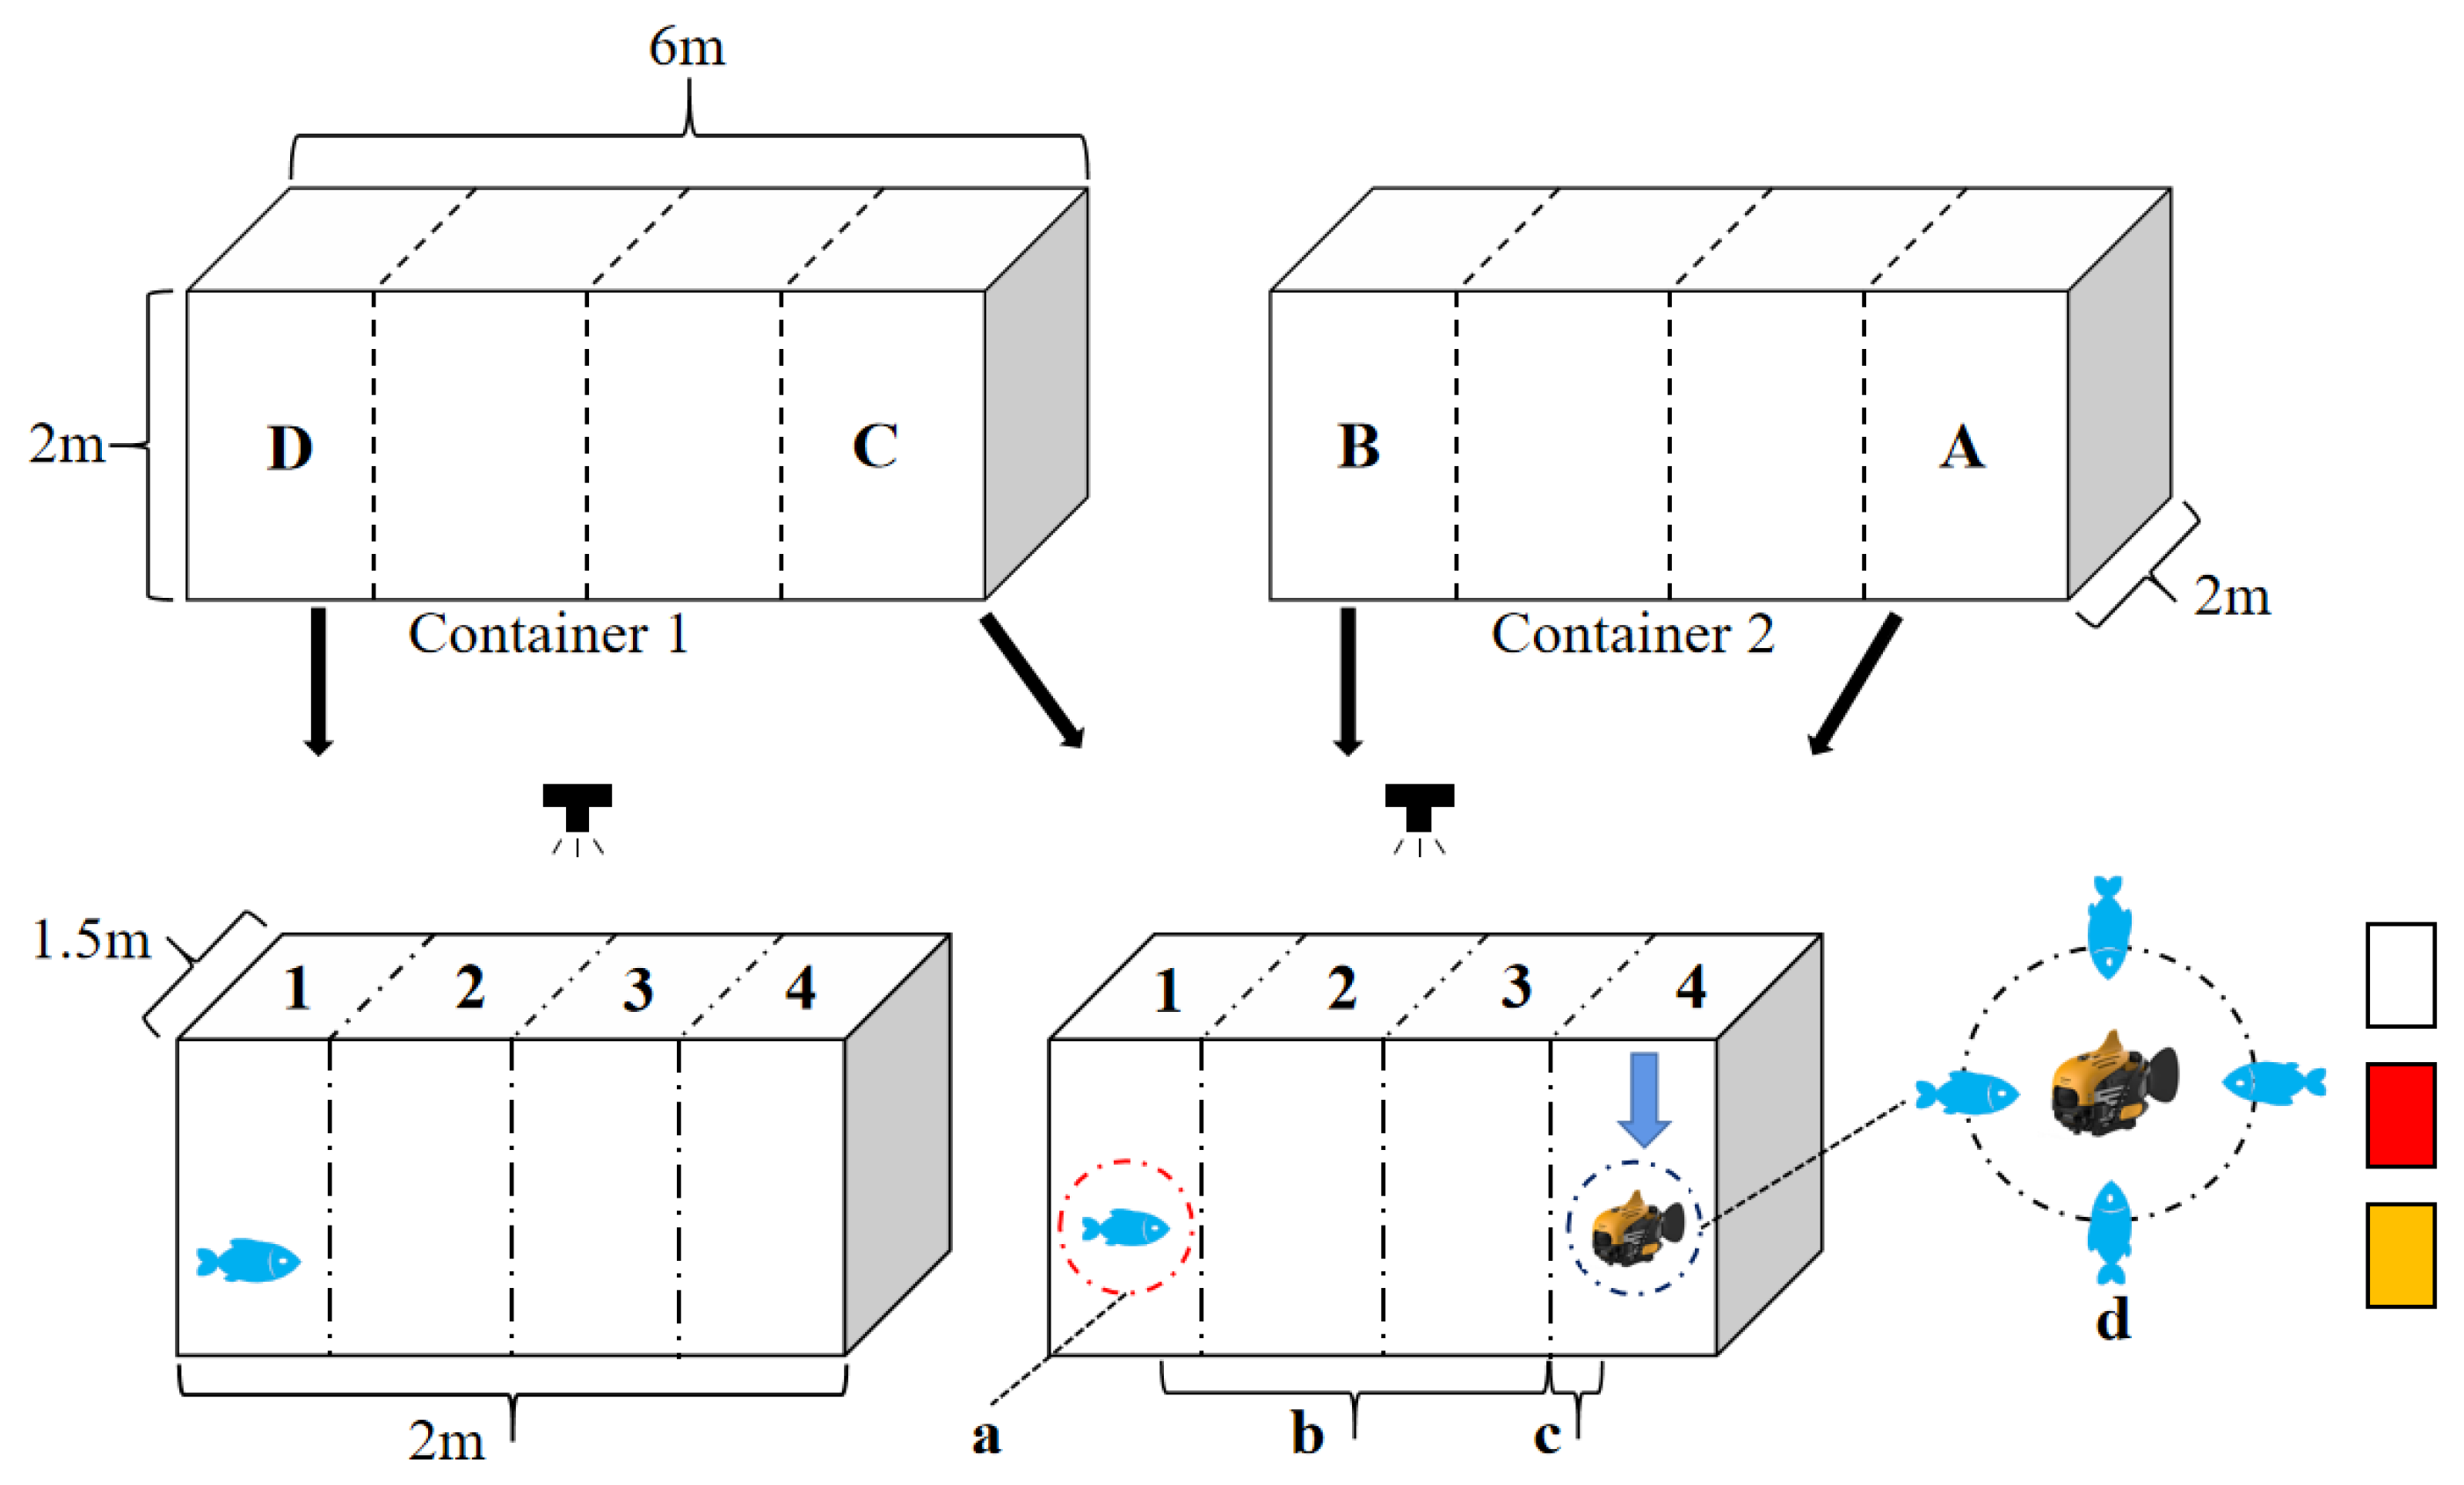
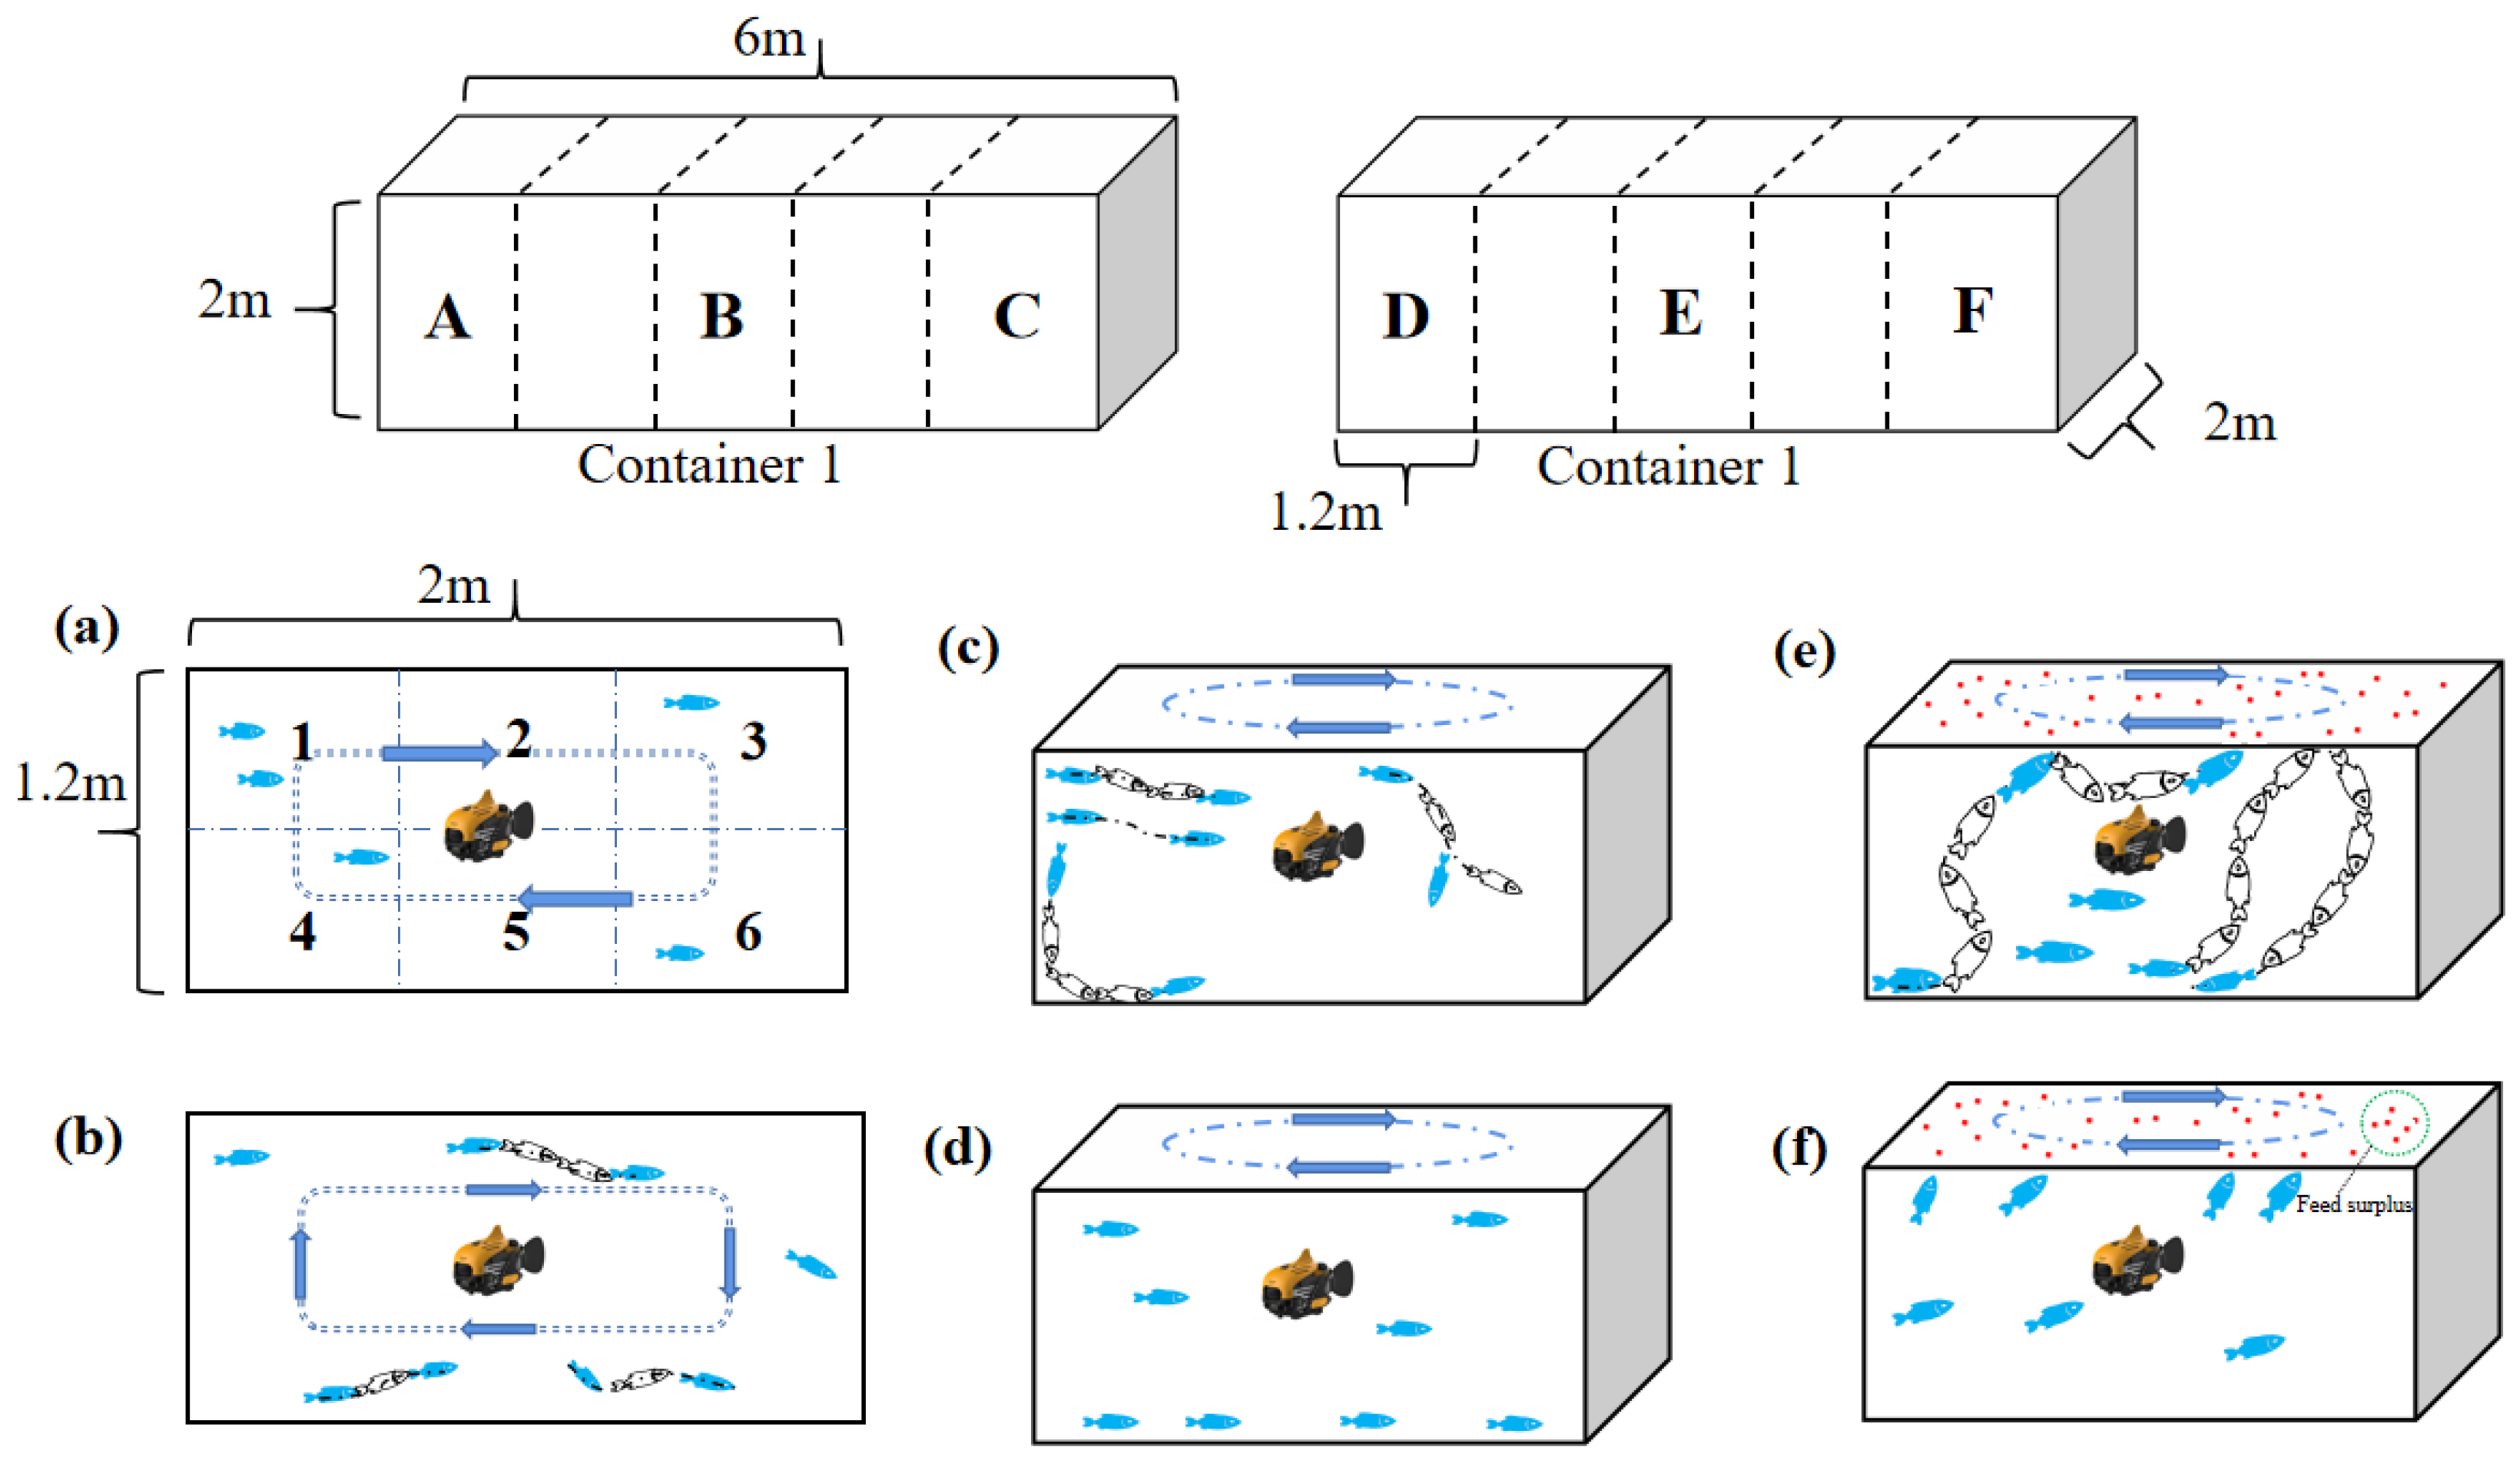
2.2. Experimental Design

Experiment 1: The experimental crucian carp was subjected to a new object test experiment one month after being domesticated. Three colors, yellow, white and red, of cloth strip (540 mm × 150 mm) were prepared. The width of the cloth strip was the same as the length of the bionic robot fish. First, the two containers (6 m × 2 m × 2 m) were equally divided into four areas (1.5 m × 2 m × 2 m) by iron nets. Four robust and responsive crucian carp were selected and respectively placed in four areas A, B, C and D, namely one control group (A) and three experimental groups (B, C and D). Then, different color bionic robotic (250 mm × 70 mm × 150 mm) fish were placed on the opposite side of the fish in the experimental groups, and the behavior changes of the crucian carp were recorded for 10 min by a camera (Gopro) which was placed one meter above the water surface. The parameters evaluated included freezing time (hardly any movement), exploration of new object (the time from being stationary to touching the vertical line of the area where the new object was located), close to new object (when the fish was approaching the new object, the time that part of the body was in the area of the new object) and observation of new object (the time fish spent with its head towards the new object), as shown in Figure 1.
Experiment 2: The two containers were divided into 5 areas of the same size with iron nets. A total of 120 experimental crucian carp were taken out of the RAS and placed in the areas marked A, B, C, D, E and F (1.2 m × 2 m × 2 m). In order to determine the optimal recovery time of crucian carp under the stress of bionic robot fish, blood was taken from fish to measure physiological and biochemical parameters on the 1st, 7th, 14th, 21st, and 28th days of the experiment (A-day1, B-day7, C-day14, D-day21 and E-day28). In addition, the containers were placed in a restricted access area, so that the distribution of fish in different parts of the tank could be observed with as little experimental error as possible. At the same time, the analysis of the information was carried out by the same observer, avoiding additional human interference. During the behavioral position test and feeding test of the experimental fish, the bionic robot fish was placed in the water tank to swim clockwise for ten minutes every day, as shown in Figure 2.

2.3. Behavioral Location and Body-Color Analysis

For the observation of the test fish, five parameters of information (regional location, behavioral activity, location in the water body, abnormal movement and body color) were recorded.
Regarding the regional location parameters, each water tank was viewed from top to bottom, the upper half and the lower half were equally divided into three positions, giving a total of six positions. At the same time, the number of areas occupied by the experimental fish was graded (occupying one position was grade 0; occupying two positions was grade 1; occupying three positions was grade 2; occupying four or more positions was grade 3). Regarding the behavioral activity parameters, about 20% of the fish showed a clear swimming profile that was grade 0, about 40% of the fish showed a clear swimming profile that was grade 1, about 60% of the fish showed a clear swimming profile that was grade 2, and about 80% of the fish showed a clear swimming profile that was grade 3. Regarding the location parameters in the water, 30% of the fish were in the water of the tank as grade 0, 60% of the fish were in the water of the tank as grade 1, and 90% of the fish were in the water of the tank as grade 2. Regarding the abnormal motion parameters, the abnormal motion included a sudden change in the swimming speed of the experimental fish, a sudden change in the swimming trajectory, and the experimental fish swimming along the inner wall of the tank. Absence of abnormal motion was grade 0 and presence of abnormal motion was grade 1. Regarding the body-color parameters, about 20% of the fish body color was light color was grade 0; about 40% of the fish body color was light color was grade 1; about 60% of the fish body color was light color was grade 2; and about 80% of the fish body color was light color was grade 3. The grading of each parameter in the experimental water tank was recorded every 2 min.

2.4. Feeding State Analysis

Feeding behavior was assessed for 10 min each morning. The experiment used commercial feed. Artificial feed was intermittently and randomly fed to various parts of the tank. Two parameters (reaction time and food consumption) were investigated in this experiment.
More than 50% of the fish not responding to the food was defined as grade 0, more than 50% of the fish scrambling to ingest the food was defined as grade 1, and more than 50% of the fish moving to the food and returning to their original position was defined as grade 2. Regarding the food consumption parameters, 1/3 food particles consumed was defined as grade 0, 1/3–2/3 food particles consumed was defined as grade 1, and more than 2/3 food consumed was defined as grade 2.

2.5. Sampling Link

The experimental crucian carp were starved for 24 h before sampling, and 6 experimental fish were randomly selected in each tank. Each fish was sampled individually and stored. All sampling was performed after 30 mg/L MS-222 anesthesia. Blood was drawn from the tail vein with a heparinized syringe, one part was used to measure blood parameters, and the other part was used to measure biochemical parameters. At the midpoint between the midline and dorsal fin of each fish, skin fragments (0.5 cm × 0.5 cm) were sampled to measure the area occupied by melanin in the fish epidermis.

2.6. Method for Determination of Blood and Plasma Parameters

Blood biochemical parameters (glucose, triglycerides, and total protein) were determined using a Cobas C-311 fully automated biochemical analyzer and commercial kits. The mean hemoglobin content (MCH) was detected by BM830 automatic blood analyzer.

2.7. Skin Melanin Ratio

The skin fragments were fixed for 48 h and transferred to 70% ethanol for histological processing and paraffin embedding. Skin fragments were sliced in cross sections with a microtome. Without any staining procedure, it was then mounted in DPX and photographed under a microscope at 40×. The external background of this area was removed using Image J software. It was then converted to a black and white binary image, thus calculating the melanin ratio.

2.8. Statistical Analyses

All data are shown as the mean ± SD. All statistical analyses were performed with SPSS22.0 software. The statistical differences between groups were analyzed using ANOVA. The least significant difference (LSD) test was used to determine significance at a significance level of p < 0.05.

3. Results

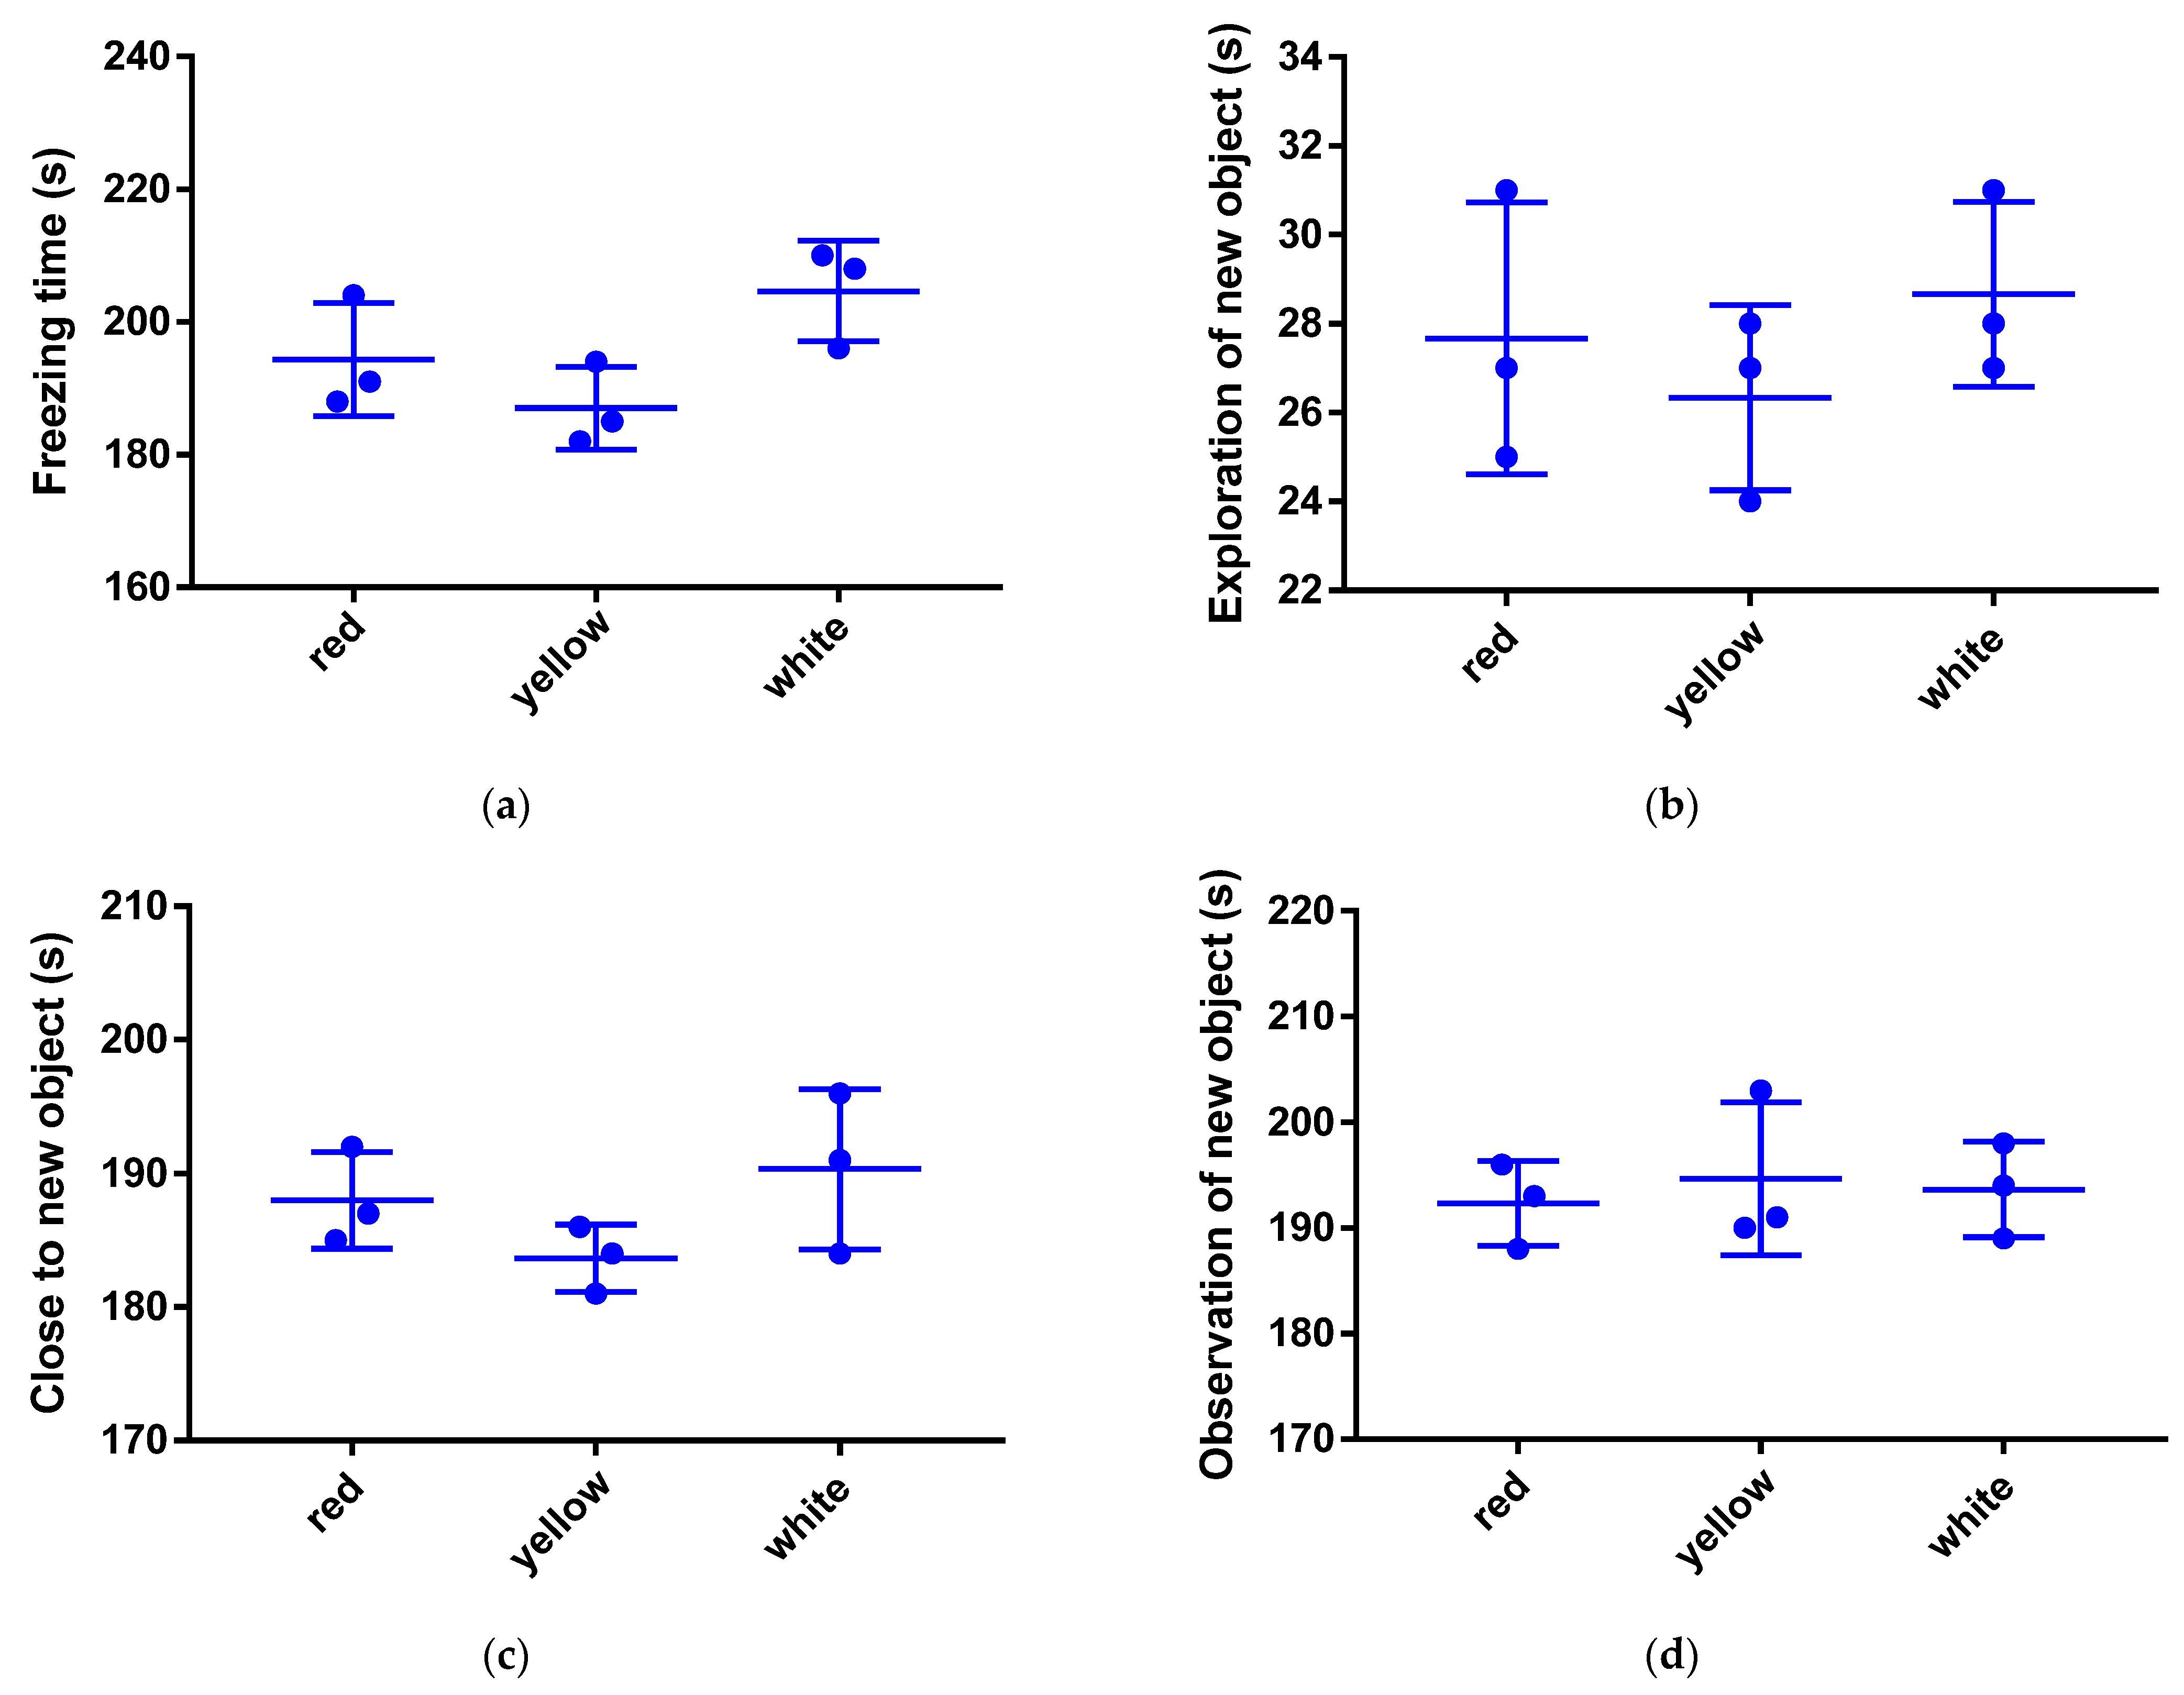
3.1. New Object Test

Under the stress condition of yellow bionic robot fish, the freezing time of crucian carp was slightly lower than that of red and white. Regarding the time to explore new objects, the time spent by the crucian carp for the red and white bionic robot fish was slightly higher than that of the yellow one. Yellow was slightly lower than red and white when the time spent by the crucian carp was close to the new object. The observation time of the red bionic robot fish on the crucian carp was slightly higher than that of the yellow and white, but the effect was not significant. When the crucian carp faced the three-color bionic robot fish, the behavioral characteristics of freezing appeared. The color of the robot fish had less effect on crucian fish exploration and time spent close to the bionic robot fish. According to Figure 3, it can be seen that the impact on crucian carp of the three-color bionic robot fish on the new object test index was small. Therefore, the responses of crucian carp to yellow, red and white were generally similar and universal. The following experiments were carried out using yellow bionic robot fish.

3.2. Behavior and Color Analysis

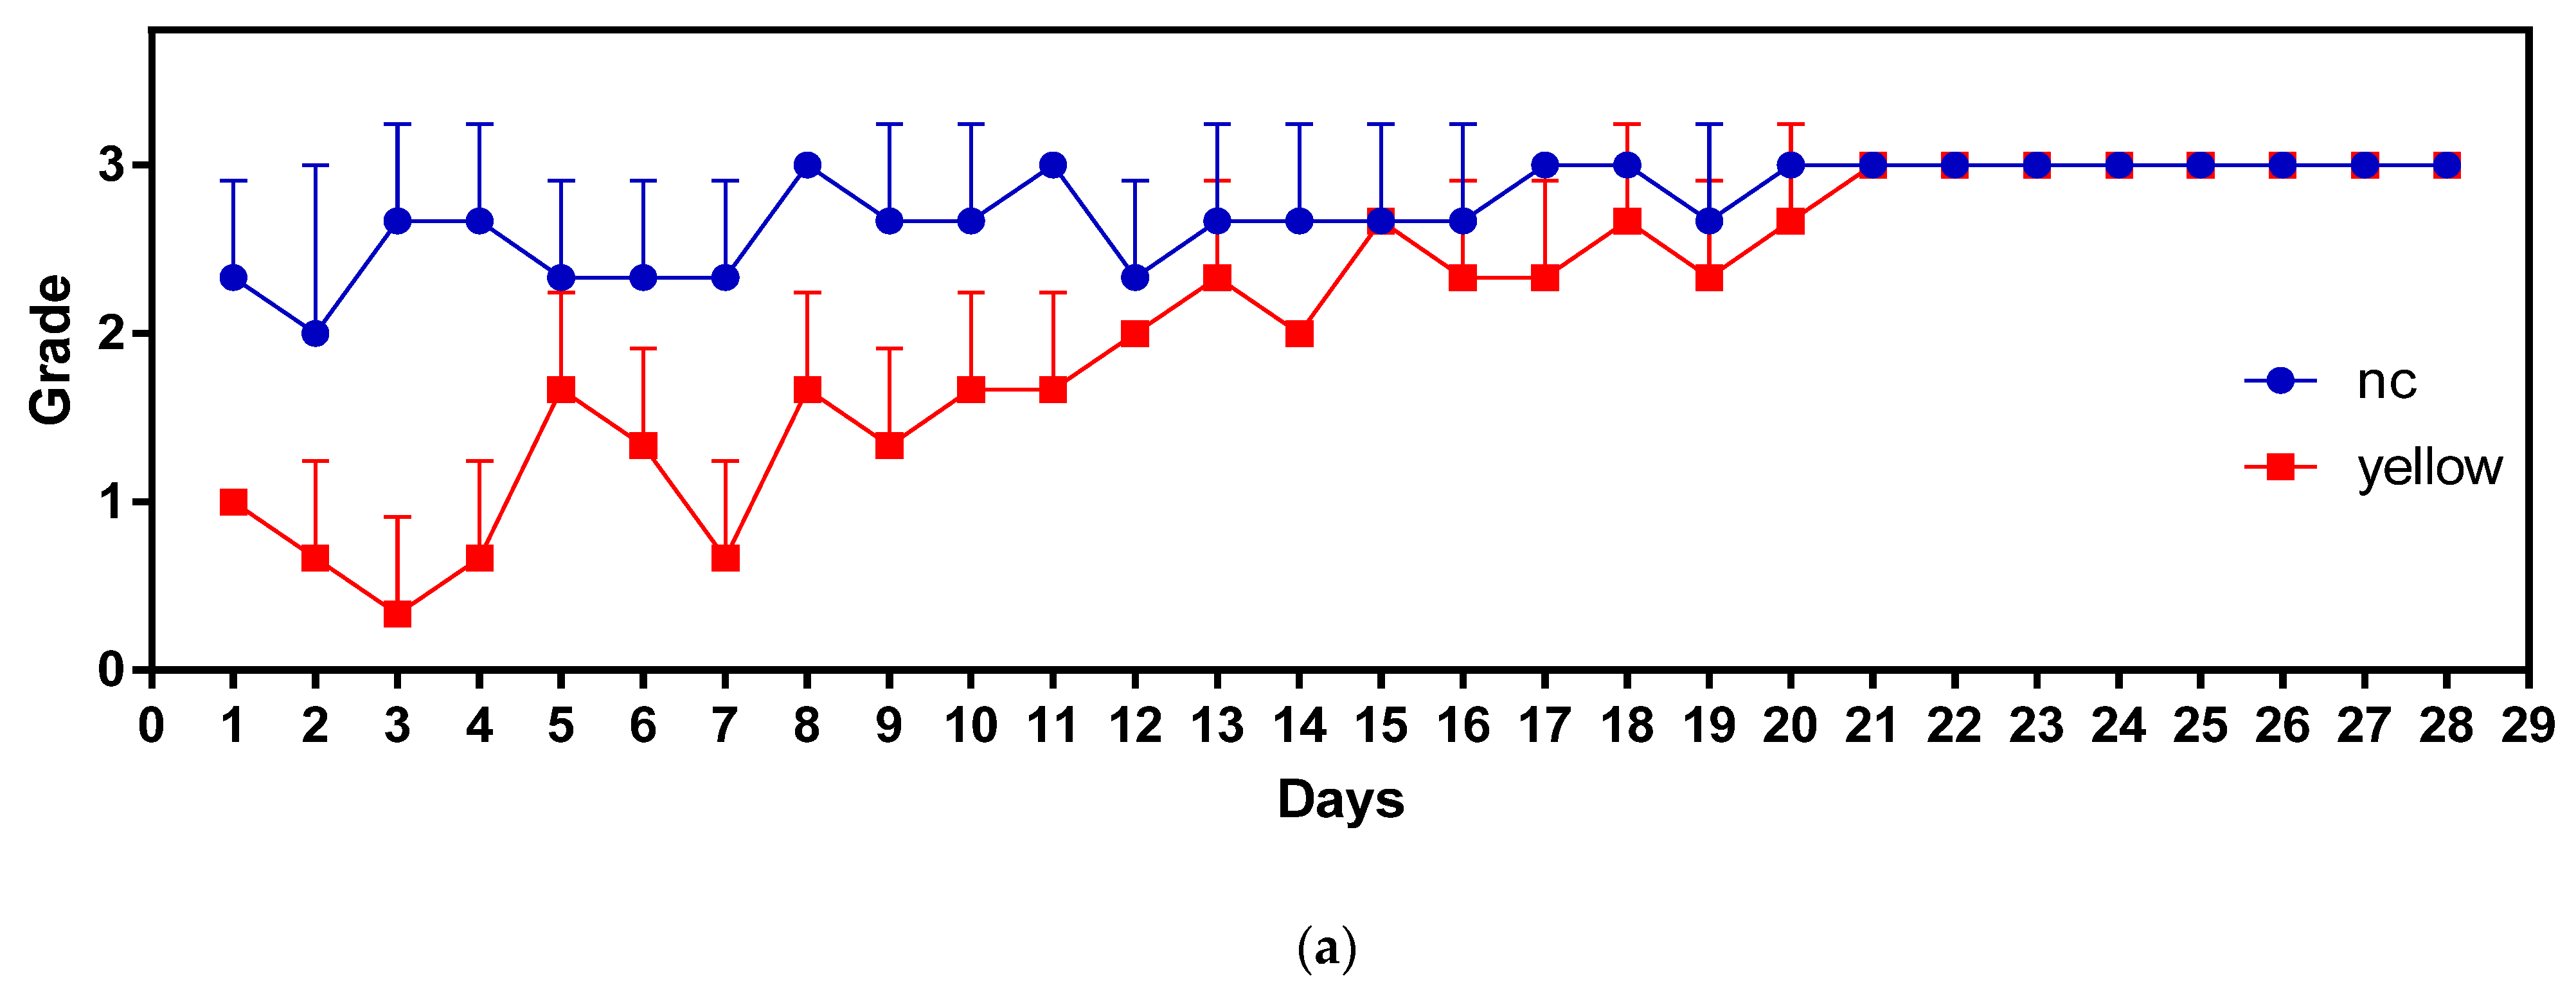
3.2.1. Position Analysis
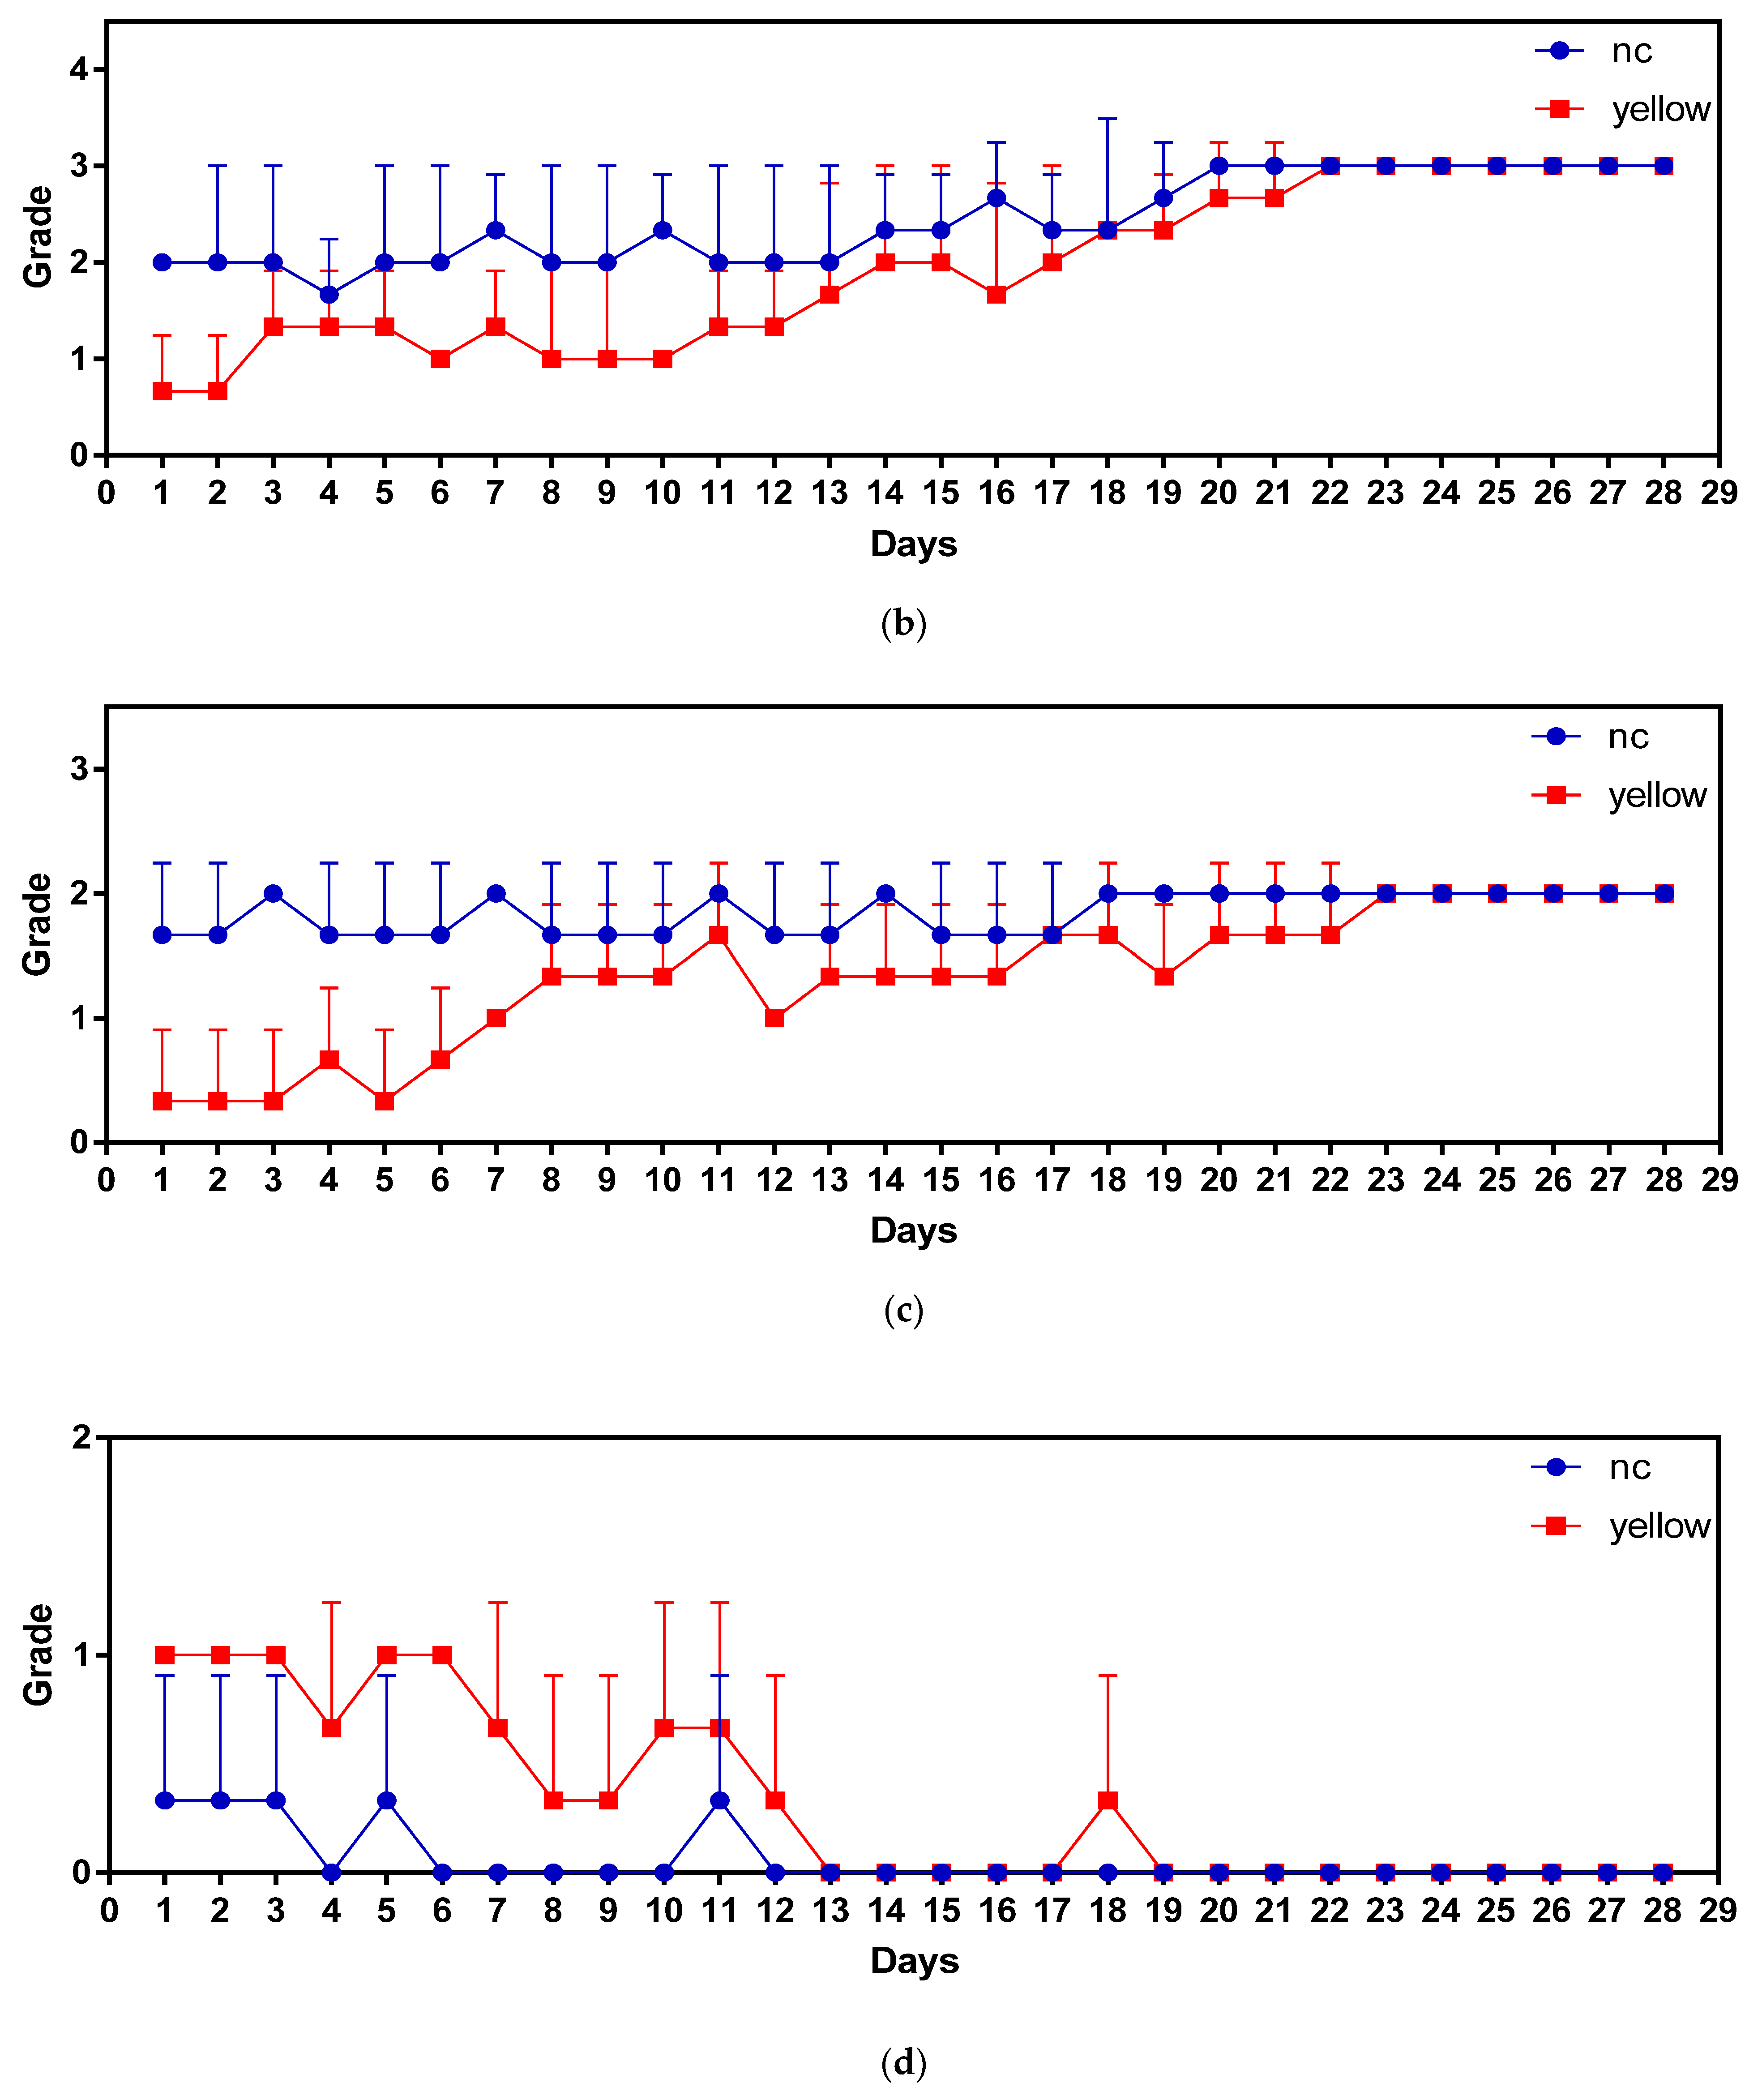
In the first 7 days, the crucian carp were greatly affected by the stress of the bionic robot fish, and the activity distribution area was mainly in grade 1; occasionally grade 2 occurred on the fifth day. From the 8th to the 14th day, the space occupied by the crucian carp gradually increased, sometimes reaching grade 2. After the 15th day, the distribution area of crucian carp at grade 3 increased significantly. After the 21st day, the main distribution area of crucian carp was at grade 3, as shown in Figure 4a.

3.2.2. Activity

For the first two days of the bionic robot fish invasion, the behavioral activity of the crucian carp was at level 0, which indicated that the crucian carp had a fear response. From day 3 to day 11, 40% of the crucian carp had a clear swimming profile (grade 1), indicating that the carp were gradually adaptable. Until the 13th day, the behavioral activity of crucian carp was at grade 2. After day 14, more crucian carp showed a clear swimming profile. From day 22, almost all of the crucian carp maintained a clear swimming profile (grade 3), as shown in Figure 4b.

3.2.3. Position in the Water

From day 1 to day 5, the crucian carp were mainly distributed at the bottom of the container (grade 0) after the invasion of the bionic robot fish. From the 6th to the 8th day, 60% of the crucian carp swam in the water (grade 1). Then, from day 9, the number of crucian carp located in the middle of the container increased. The location parameters of crucian carp in the water remained at grade 2 from the 23rd day, as shown in Figure 4c.

3.2.4. Abnormal Swimming
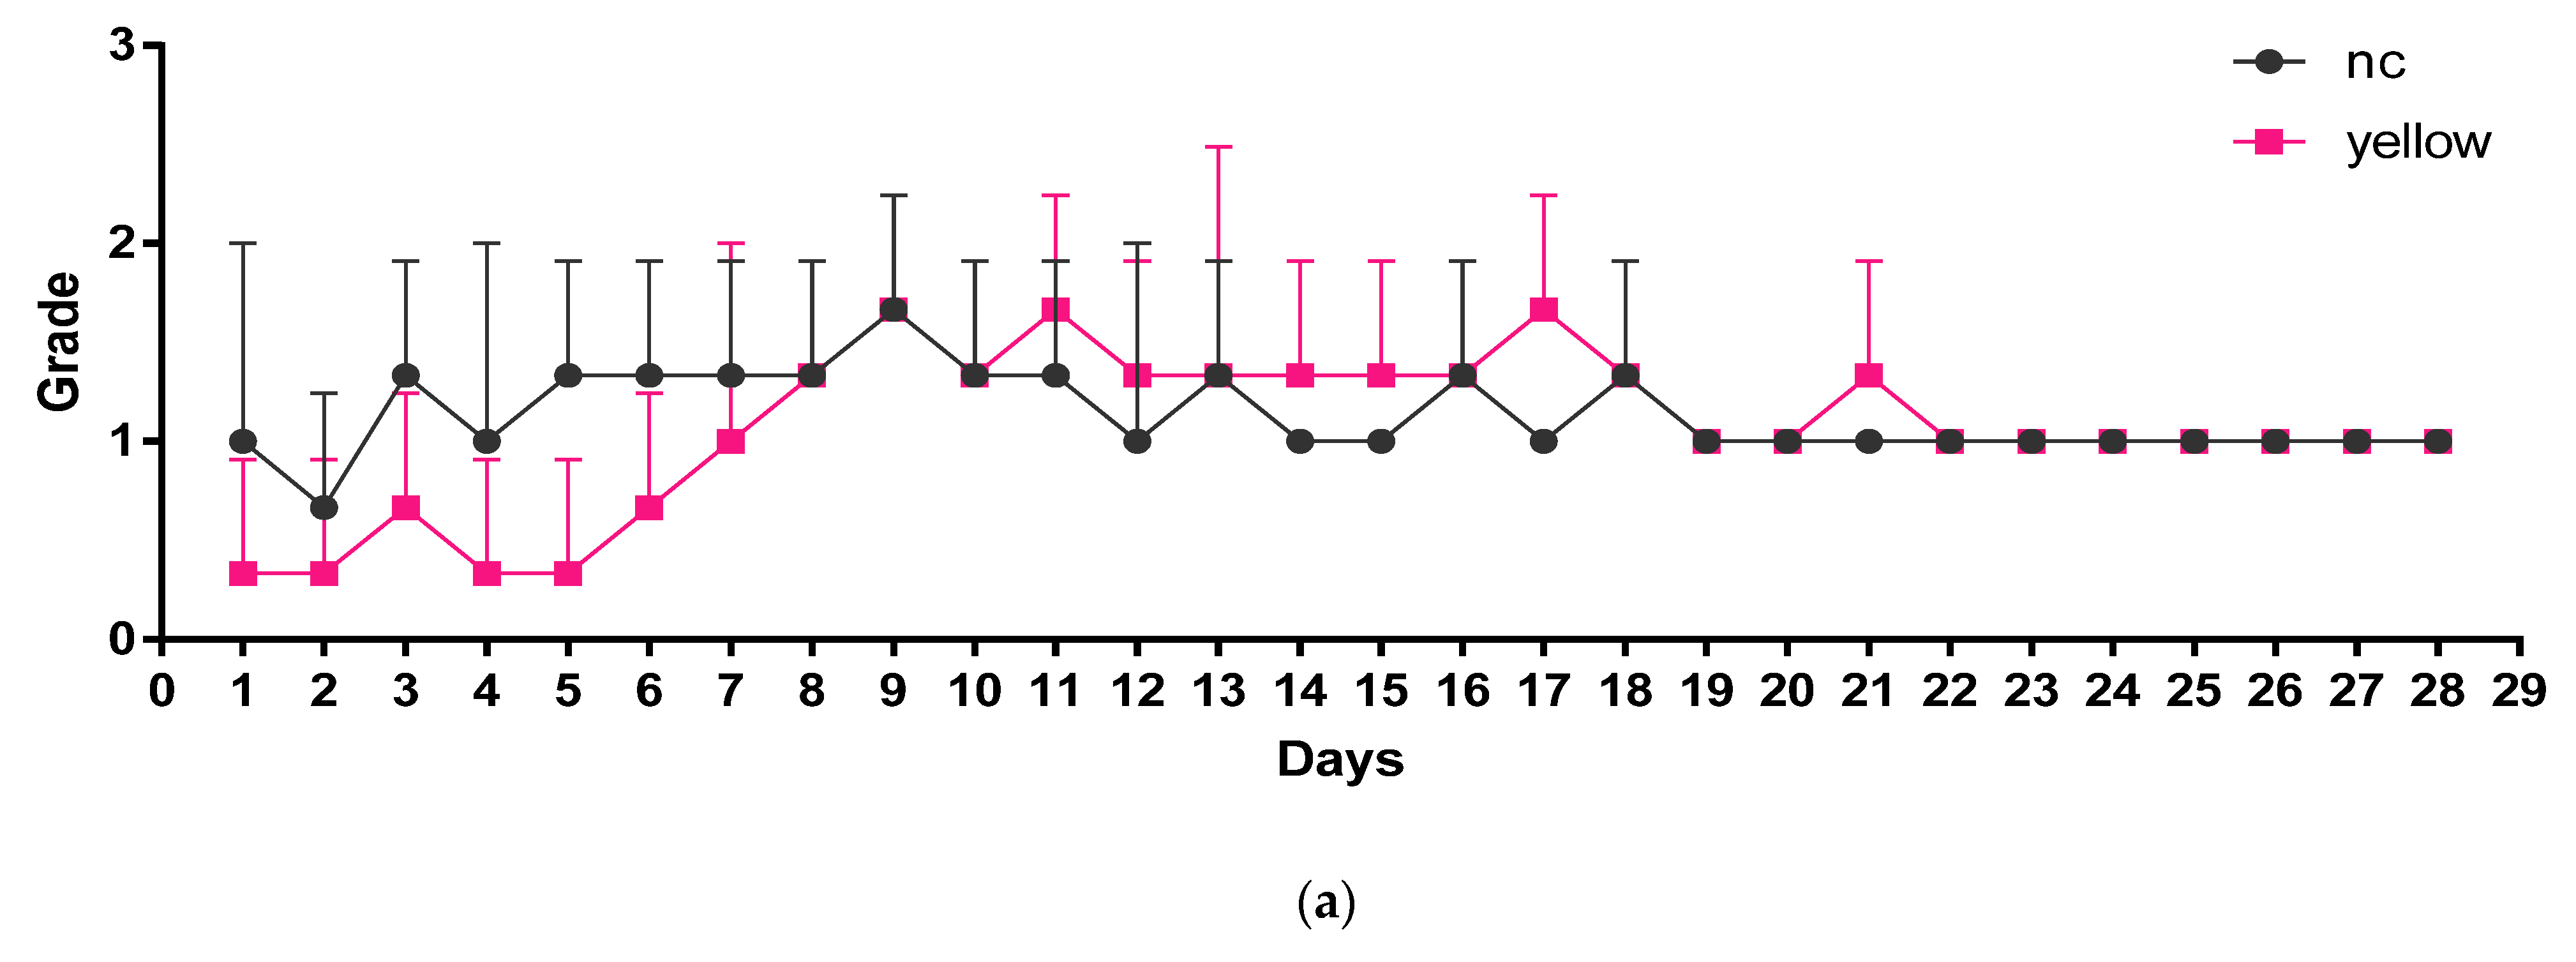
From day 1 to day 6, abnormal movements (grade 1) appeared more frequently than at other times. From the 7th day to the 13th day, the abnormal behavior of crucian carp decreased. On day 18, individual crucian carp showed a little abnormal behavior. From day 19, there was no abnormal movement (grade 0) in crucian carp, as shown in Figure 4d.

3.2.5. Body Color

During the first five days of monitoring, 80% of crucian carp were light-colored (grade 3), and the number of light-colored crucian carp was gradually decreasing from the 6th to the 11th day. From day 12 to day 20, 40% of crucian carp showed lighter body color (grade 1). From the 23rd day, the number of crucian carp with deepened body color increased, and the grade at this time remained at grade 0 until the 28th day, as shown in Figure 4e.
Figure 4. Behavior and body-color changes of crucian carp within 28 days after being stimulated by the bionic robot fish. (a) Regional location; (b) Behavioral activity; (c) Location in the water body; (d) Abnormal movement; (e) Body color. Values are represented as mean ± SD of data from triplicates per treatment (n = 5).
Fishes 07 00198 g004aFishes 07 00198 g004bFishes 07 00198 g004c

3.3. Feeding Behavior Analyses

3.3.1. Reaction to Food

Crucian carp did not respond to food pellets for the first six days. From day 7 to day 17, crucian carp went from no response (grade 0) to scrambling for food pellets (grade 1). Between the 11th and 17th days, the behavior of the crucian carp swimming slowly to the food position was occasionally found, and the crucian carp returned to the original position after eating the pellets (grade 2). From the 18th to the 21st day, the active food intake of crucian carp increased significantly. From the 22nd day onwards, crucian carp always maintained a state of flexible food intake (grade 1), as shown in Figure 5a.

3.3.2. Food Consumption

The food intake of crucian carp in the first 6 days approached the lowest grade (grade 0). Food intake was significantly increased to grade 1 from day 7 to day 13, and gradually approached grade 2 from day 14 to day 21. The food consumption level of crucian carp was maintained at grade 2 from day 22, as shown in Figure 5b.
Figure 5. Feeding situation of crucian carp within 28 days after being stimulated by the bionic robot fish. (a) Response time; (b) Food consumption. Values are represented as mean ± SD of data from triplicates per treatment (n = 5).
Fishes 07 00198 g005aFishes 07 00198 g005b

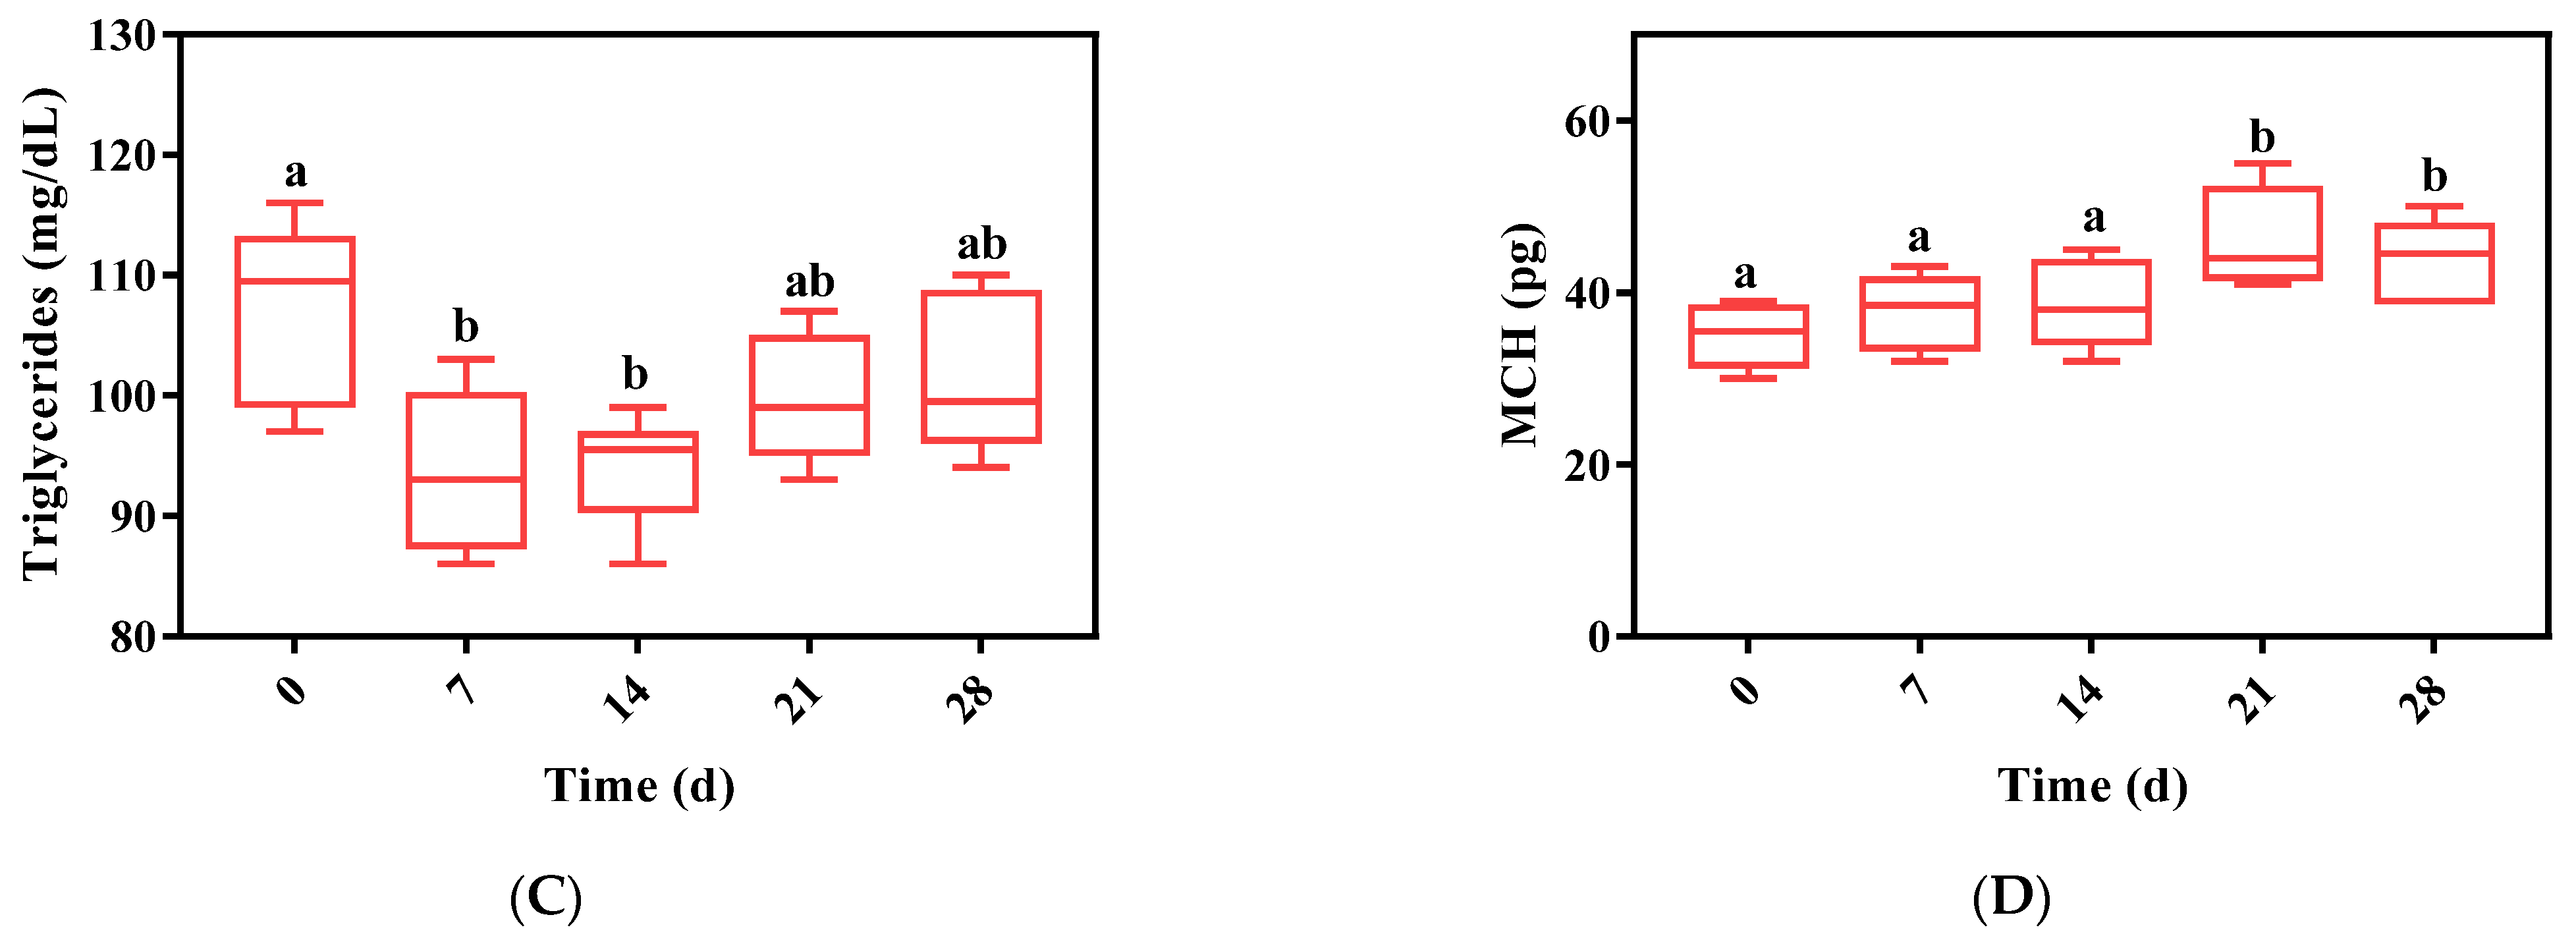
3.4. Determination of Blood and Plasma

According to Figure 6A, the glucose level of crucian carp was significantly increased on the first day, then decreased significantly by 25.0% and 24.0% (p < 0.01) on days 7 and 14 respectively, and finally stabilized on the 21st and 28th days. As shown in Figure 6B, the total protein content was less at the first time point, then gradually increased from the 7th day, significantly increased by 31.0% on the 21st day compared with the first day (p < 0.01), then gradually stabilized. As shown in Figure 6C, the triglyceride level increased significantly at the beginning, then it decreased significantly at the 7th day by 25.8% (p < 0.01), increasing slightly on the 14th day, and stabilizing on the 21st and 28th day. As shown in Figure 6D, the mean hemoglobin content (MCH) was initially low, increased slightly on days 7 and 14, significantly increased, by 31.8% (p < 0.01), on day 21, and eventually stabilized.

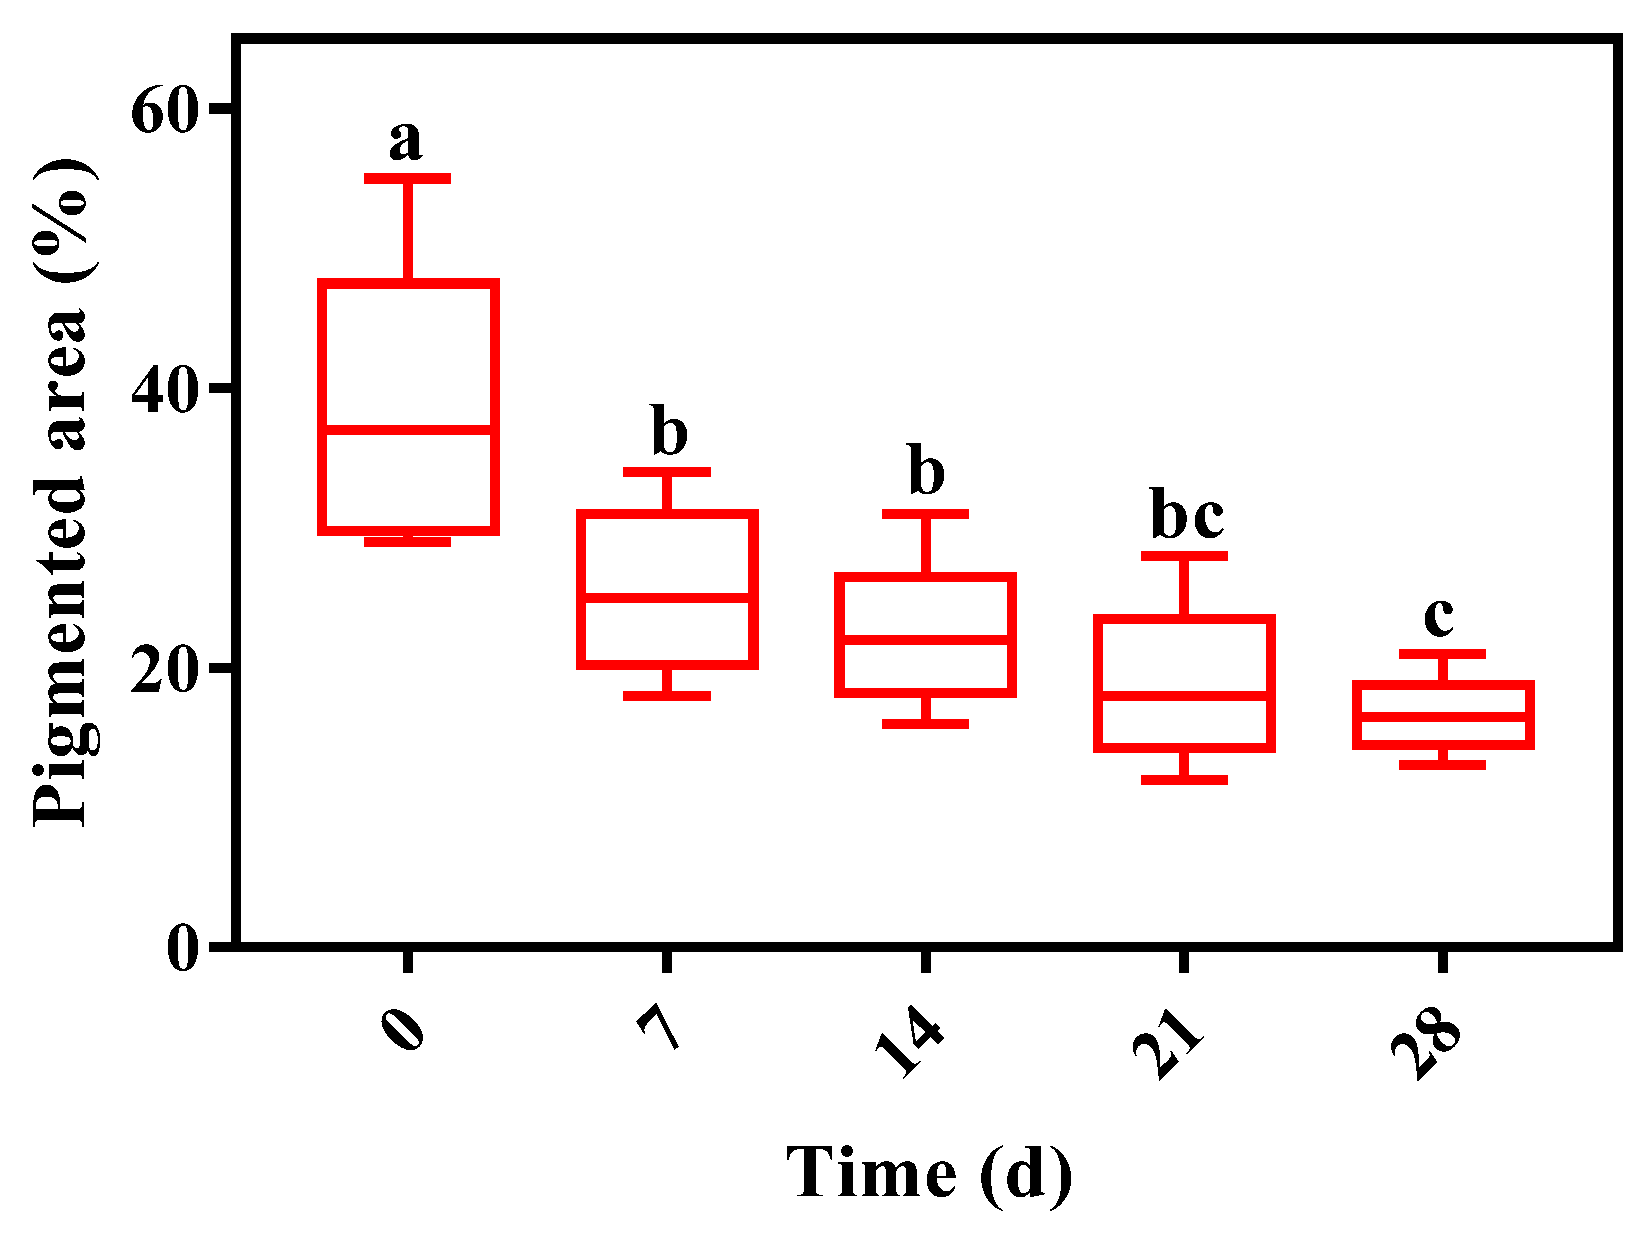
3.5. Skin Melanin Area Analysis

The pigmented area of crucian carp on day 1 was 13.3% higher than that on day 7 (p < 0.05). The pigmented area subsequently stabilized from day 14 to the end of the experiment, as shown in Figure 7.

4. Discussion

The swimming activity and feeding status of fish are effective means to monitor fish welfare [27]. Studies have shown that fish behavioral responses are highly influenced by new object stress [28,29]. Studies have shown that the domestication period is roughly one month in scientific departments of fish research [30]. Therefore, in this study, a multifactorial assay which includes the determination of fish behavior, physiology, biochemistry, and pigment area ratio was used to evaluate how long the acclimation period of crucian carp was after being stressed by the bionic robot fish.
Studies have shown that freezing time and exploratory behavior of tilapia can be influenced by the environment [2,31]. In this study, results showed that the objects with the same shape but different colors would appropriately change the freezing time of crucian carp, as well as the time to explore new objects and the time close to new objects. This suggests that different species may exhibit similar behavioral changes in the face of environmental changes. There is little change between these three parameters. In addition, there is little or no effect on observing time for new objects. That is to say, when the living environment of crucian carp changes, they will perceive and make corresponding behavioral changes [32]. In general, the four parameters of crucian carp under the stress condition of three colors of bionic robot fish have small differences [33,34], indicating that the stress response of crucian carp to the three colors is similar and universal.
According to the results, the crucian carp initially stayed at the bottom of the tank and swam inactively, then the behavioral pattern of crucian carp was re-established obviously on the 23rd day. This may be for the reason that crucian carp are susceptible to specific parts of the tank and showed limited swimming activity. Normal crucian carp like to swim close to the food and have a clear swimming profile in the water. Abnormal swimming movements were also found and persisted until day 13. The presence or absence of abnormal behavior parameters reflects the stress state of the fish [13]. The color of crucian carp became lighter under stressful conditions [22]. Until the 21st day, the color of the crucian carp darkened.
Appetitive status of fish is one of the common indicators of stress response in aquaculture [35]. From the beginning to the 6th day, the food consumption of crucian carp was very low, only one-third of the total pellets, and gradually increased from the 7th day to the 13th day. Furthermore, from day 12, the fish responded immediately and actively swam towards the food pellets. This may be due to the formation of a hierarchy among these crucian carp, resulting in different food intakes among different crucian carp [36].
Glucose is the main substance in the metabolism and physiological activities of cells and tissues [37], and it is also one of the main biochemical parameters of fish stress indicators [38,39]. In this study, the glucose level reached 121 mg/dL on the first day, decreased significantly on the 7th day and recovered slightly on the 14th day. Finally, it was relatively stable on the 21st and 28th day. Some researchers have also suggested that the glucose level in crucian carp may peak on the first day, and then gradually stabilize in the later period [40]. The main function of total protein is to repair damaged tissues and participate in the regulation of plasma osmotic pressure [41]. Under stress conditions, the total protein content of crucian carp was lower on the 1st and 7th days, increased slightly on the 14th day, and was finally stable on the 21st and 28th days. This may be due to damage to carp epidermis under stress conditions [42], which affects the osmotic pressure parameters of plasma [43]. Stress conditions are closely related to the metabolic demands of crucian carp. Triglycerides are an important energy source for fish metabolism [44]. Herein, triglyceride levels decreased significantly on day 7, which may be for the reason that the stressful response of crucian carp could induce higher metabolic function and require more energy to adapt to the environment [45]. In addition, the mean hemoglobin content is one of the key indicators in hematological parameters [46]. It increased on the 7th and 14th days, compared to the first day, and was relatively stable on the 21st and 28th days. This showed that the aerobic metabolism of crucian carp will be affected by the bionic robot fish. Similarly, some researchers have determined the adaptation period of brown trout after acute transportation by measuring physiological and biochemical parameters such as glucose and triglycerides [22].
The darkening of skin pigmentation in fish is considered to be a response to social environmental stress [47,48]. The area that was pigmented area in the skin sections was the highest on day 1 and decreased significantly on day 7. From the 7th day, the pigmented area gradually became stable. Studies have shown that fish with less pigment grow better than fish with more pigment [49].

5. Conclusions

This paper proposed a multi-parameter evaluation method for crucian carp, under the stress conditions of the bionic robot fish, to determine the best adaptation period for crucian carp. Comprehensive analysis was performed on freezing time and exploratory behavior, as well as non-invasive parameters and invasive parameters. According to the experimental results, crucian carp generally tended to be stable from 14 to 21 days, with occasional errors on the 22nd day. From 21 to 28 days, the behavioral and feeding parameters were stable, and the physiological, biochemical and pigment area percentage parameters became steady. To sum up, results suggested that when using the bionic robot fish for the experimental detection of crucian carp, the adaptation period should be at least 23 days, to ensure the normal level of various parameters of crucian fish and to avoid experimental deviation.

Author Contributions

Conceptualization, B.W. and H.M.; methodology, B.W., J.Z., Y.W. and Y.L.; software, B.W., J.Z. and Y.W.; validation, B.W. and X.D.; data curation, B.W. and J.Z.; writing—original draft preparation, B.W. Y.L. and X.D.; writing—review and editing, B.W. Y.W. and J.Z.; project administration, H.M.; funding acquisition, H.M. All authors have read and agreed to the published version of the manuscript.

Funding

This research was funded by the National Natural Science Foundation of China (32071905) and the Project of Agricultural Equipment Department of Jiangsu University (NZXB20210106), and the Modern Agriculture Industrial Technology System Special Project—the National Technology System for Conventional Freshwater Fish Industries (grant no. CARS-45-26).

Institutional Review Board Statement

The maintenance, handling and experiments conducted on fish during this study were carried out in strict accordance with the guidelines of the Association for the Study of Animal Behaviour Use of Zhejiang University (no. ZJU20190073).

Acknowledgments

The authors would like to thank the Key Laboratory of Agricultural Engineering in Jiangsu University and Zhejiang University for supporting the experimental conditions of the research.

Conflicts of Interest

The authors declare no conflict of interest.

References

  1. Bortoletti, M.; Maccatrozzo, L.; Radaelli, G.; Caberlotto, S.; Bertotto, D. Muscle Cortisol Levels, Expression of Glucocorticoid Receptor and Oxidative Stress Markers in the Teleost Fish Argyrosomus regius Exposed to Transport Stress. Animals 2021, 11, 1160. [Google Scholar] [CrossRef] [PubMed]
  2. Tatemoto, P.; Valença-Silva, G.; Queiroz, M.R.; Broom, D.M. Living with low environmental complexity increases fear indicators in Nile tilapia. Anim. Behav. 2021, 174, 169–174. [Google Scholar] [CrossRef]
  3. Wang, B.; Ma, G.; Liu, Y.; Wang, Y.; Du, X.; Shi, Q.; Mao, H. Effects of Different Temperatures on the Antibacterial, Immune and Growth Performance of Crucian Carp Epidermal Mucus. Fishes 2021, 6, 66. [Google Scholar] [CrossRef]
  4. Paunescu, A.; Soare, L.C.; Fierascu, I.; Fierascu, R.C.; Mihaescu, C.F.; Tofan, L.; Ponepal, C.M. Ecotoxicological Studies on the Action of Actara 25 WG Insecticide on Prussian Carp (Carassius gibelio) and Marsh Frog (Pelophylax ridibundus). Toxics 2022, 10, 114. [Google Scholar] [CrossRef] [PubMed]
  5. Hang, S.; Zhao, J.; Ji, B.; Li, H.; Zhang, Y.; Peng, Z.; Zhou, F.; Ding, X.; Ye, Z. Impact of underwater noise on the growth, physiology and behavior of Micropterus salmoides in industrial recirculating aquaculture systems. Environ. Pollut. 2021, 291, 118152. [Google Scholar] [CrossRef] [PubMed]
  6. Lambert, H.; Cornish, A.; Elwin, A.; D’Cruze, N. A Kettle of Fish: A Review of the Scientific Literature for Evidence of Fish Sentience. Animals 2022, 12, 1182. [Google Scholar] [CrossRef]
  7. Chen, B.K.; Murawski, N.J.; Cincotta, C.; McKissick, O.; Finkelstein, A.; Hamidi, A.B.; Merfeld, E.; Doucette, E.; Grella, S.L.; Shpokayte, M.; et al. Artifificially Enhancing and Suppressing Hippocampus-Mediated Memories. Curr. Biol. 2019, 29, 1885–1894. [Google Scholar] [CrossRef]
  8. MacIver, M.A.; Finlay, B.L. The neuroecology of the water-to-land transition and the evolution of the vertebrate brain. Phil. Trans. R. Soc. B 2021, 377. [Google Scholar] [CrossRef]
  9. Brunet, V.; Kleiber, A.; Patinote, A.; Sudan, P.-L.; Duret, C.; Gourmelen, G.; Moreau, E.; Fournel, C.; Pineau, L.; Calvez, S.; et al. Positive welfare effects of physical enrichments from the nature-, functions and feeling- based approaches in farmed rainbow trout (Oncorhynchus mykiss). Aquaculture 2022, 550, 737825. [Google Scholar] [CrossRef]
  10. Jerez-Cepa, I.; Ruiz-Jarabo, I. Physiology: An Important Tool to Assess the Welfare of Aquatic Animals. Biology 2021, 10, 61. [Google Scholar] [CrossRef]
  11. Bruzsik, B.; Biro, L.; Sarosdi, K.R.; Zelena, D.; Sipos, E.; Szebik, H.; Török, B.; Mikics, E.; Toth, M. Neurochemically distinct populations of the bed nucleus of stria terminalis modulate innate fear response to weak threat evoked by predator odor stimuli. Neurobiol. Stress 2021, 15, 100415. [Google Scholar] [CrossRef] [PubMed]
  12. LeDoux, J.E. As soon as there was life, there was danger: The deep history of survival behaviours and the shallower history of consciousness. Philos. Trans. R. Soc. B Biol. Sci. 2021, 377. [Google Scholar] [CrossRef] [PubMed]
  13. Zidan, E.M.; Goma, A.A.; Tohamy, H.G.; Soliman, M.M.; Shukry, M. Insight study on the impact of different salinity levels on behavioural responses, biochemical stress parameters and growth performance of African catfish (Clarias gariepinus). Aquac. Res. 2022, 53, 2750–2759. [Google Scholar] [CrossRef]
  14. Chekani, R.; Akrami, R.; Ghiasvand, Z.; Chitsaz, H.; Jorjani, S. Effect of dietary dehydrated lemon peel (Citrus limon) supplementation on growth, hemato-immunolological and antioxidant status of rainbow trout (Oncorhynchus mykiss) under exposure to crowding stress. Aquaculture 2021, 539, 736597. [Google Scholar] [CrossRef]
  15. Franco-Martinez, L.; Brandts, I.; Reyes-López, F.; Tort, L.; Tvarijonaviciute, A.; Teles, M. Skin Mucus as a Relevant Low-Invasive Biological Matrix for the Measurement of an Acute Stress Response in Rainbow Trout (Oncorhynchus mykiss). Water 2022, 14, 1754. [Google Scholar] [CrossRef]
  16. Yousefi, M.; Hoseini, S.M.; Aydın, B.; Mirghaed, A.T.; Kulikov, E.V.; Drukovsky, S.G.; Seleznev, S.B.; Rudenko, P.A.; Hoseinifar, S.H.; Van Doan, H. Anesthetic efficacy and hemato-biochemical effects of thymol on juvenile Nile tilapia, Oreochromis niloticus. Aquaculture 2022, 547, 737540. [Google Scholar] [CrossRef]
  17. Muñoz, L.; Aspillaga, E.; Palmer, M.; Saraiva, J.; Arechavala-Lopez, P. Acoustic Telemetry: A Tool to Monitor Fish Swimming Behavior in Sea-Cage Aquaculture. Front. Mar. Sci. 2020, 7, 645. [Google Scholar] [CrossRef]
  18. Souza, R.C.R.; Pompeu, P.S. Ecological separation by ecomorphology and swimming performance between two congeneric fish species. Zoologia 2020, 37, 1–8. [Google Scholar] [CrossRef]
  19. de Alba, G.; Carrillo, S.; Sánchez-Vázquez, F.J.; López-Olmeda, J.F. Combined blue light and daily thermocycles enhance zebrafish growth and development. J. Exp. Zool. Part A Ecol. Integr. Physiol. 2022, 337, 501–515. [Google Scholar] [CrossRef]
  20. Talijančić, I.; Žužul, I.; Kiridžija, V.; Šiljić, J.; Pleadin, J.; Grubišić, L.; Šegvić-Bubić, T. Plastic Responses of Gilthead Seabream Sparus aurata to Wild and Aquaculture Pressured Environments. Front. Mar. Sci. 2021, 8, 694627. [Google Scholar] [CrossRef]
  21. Tunçelli, G.; Pirhonen, J. Effects of weekend starvation and the duration of daily feeding on production parameters of rainbow trout Oncorhynchus mykiss. Aquaculture 2021, 543, 737028. [Google Scholar] [CrossRef]
  22. Madureira, T.V.; Costa, J.L.; Malhão, F.; Lopes, C.; Gonçalves, J.F.; Rocha, E. Design of a multi-parametric profile for assessing the acclimation period of juvenile brown trout after an acute transport to new housing environment. Appl. Anim. Behav. Sci. 2019, 219. [Google Scholar] [CrossRef]
  23. Tsakoumis, E.; Tsoulia, T.; Feidantsis, K.; Mouchlianitis, F.A.; Berillis, P.; Bobori, D.; Antonopoulou, E. Cellular Stress Responses of the Endemic Freshwater Fish Species Alburnus vistonicus Freyhof & Kottelat, 2007 in a Constantly Changing Environment. Appl. Sci. 2021, 11, 11021. [Google Scholar]
  24. Artero, C.; Marchetti, S.; Bauer, E.; Viala, C.; Noël, C.; Koenig, C.; Berzins, R.; Lampert, L. High-Resolution Acoustic Cameras Provide Direct and Efficient Assessments of Large Demersal Fish Populations in Extremely Turbid Waters. Appl. Sci. 2021, 11, 1899. [Google Scholar] [CrossRef]
  25. Walli, A.; Teo, S.L.H.; Boustany, A.; Farwell, C.J.; Williams, T.; Dewar, H.; Prince, E.; Block, B.A. Seasonal Movements, Aggregations and Diving Behavior of Atlantic Bluefin Tuna (Thunnus thynnus) Revealed with Archival Tags. PLoS ONE 2009, 4, e6151. [Google Scholar] [CrossRef]
  26. Gutierrez-Estrada, J.C.; Pulido-Calvo, I.; Castro-Gutierrez, J.; Peregrín, A.; Domínguez, S.L.; Gomez-Bravo, F.; Garrocho-Cruz, A.; de la Rosa-Lucas, I. Fish abundance estimation with imaging sonar in semi-intensive aquaculture ponds. Aquac. Eng. 2022, 97, 102235. [Google Scholar] [CrossRef]
  27. Calduch-Giner, J.; Holhorea, P.G.; Ferrer, M.Á.; Naya-Català, F.; Rosell-Moll, E.; García, C.V.; Prunet, P.; Espmark, Å.M.; Leguen, I.; Kolarevic, J.; et al. Revising the Impact and Prospects of Activity and Ventilation Rate Bio-Loggers for Tracking Welfare and Fish-Environment Interactions in Salmonids and Mediterranean Farmed Fish. Front. Mar. Sci. 2022, 9, 854888. [Google Scholar] [CrossRef]
  28. De Pasquale, C.; Kemerer, N.; White, N.; Yost, M.; Wolfkill, J.; Sturgill, J.; Li, X. The Influence of an Enriched Environment in Enhancing Recognition Memory in Zebrafish (Danio rerio). Front. Vet. Sci. 2021, 8, 749746. [Google Scholar] [CrossRef]
  29. Sánchez-Muros, M.J.; Sánchez, B.; Barroso, F.G.; Toniolo, M.; Trenzado, C.E.; Rus, A.S. Effects of rearing conditions on behavioural responses, social kinetics and physiological parameters in gilthead sea bream Sparus aurata. Appl. Anim. Behav. Sci. 2017, 197, 120–128. [Google Scholar] [CrossRef]
  30. Zhao, J.; Bao, W.J.; Zhang, F.D.; Ye, Z.Y.; Liu, Y.; Shen, M.W.; Zhu, S.M. Assessing appetite of the swimming fish based on spontaneous collective behaviors in a recirculating aquaculture system. Aquac. Eng. 2017, 78, 196–204. [Google Scholar] [CrossRef]
  31. Lai, Y.-H.; Audira, G.; Liang, S.-T.; Siregar, P.; Suryanto, M.; Lin, H.-C.; Villalobos, O.; Villaflores, O.; Hao, E.; Lim, K.-H.; et al. Duplicated dnmt3aa and dnmt3ab DNA Methyltransferase Genes Play Essential and Non-Overlapped Functions on Modulating Behavioral Control in Zebrafish. Genes 2020, 11, 1322. [Google Scholar] [CrossRef]
  32. Suriyampola, P.S.; Iruri-Tucker, A.A.; Padilla-Velez, L.; Enriquez, A.; Shelton, D.S.; Martins, E.P. Small increases in group size improve small shoals’ response to water flow in zebrafish. J. Zool. 2022, 316, 271–281. [Google Scholar] [CrossRef] [PubMed]
  33. McLean, E. Fish tank color: An overview. Aquaculture 2021, 530, 735750. [Google Scholar] [CrossRef]
  34. Wu, H.; Murata, M.; Matsumoto, H.; Ohnuki, H.; Endo, H. Integrated Biosensor System for Monitoring and Visualizing Fish Stress Response. Sensors Mater. 2020, 32, 4095. [Google Scholar] [CrossRef]
  35. Höglund, E.; Fernandes, P.; Rojas-Tirado, P.; Rundberget, J.T.; Hess-Erga, O.-K. Assessing Stress Resilience After Smolt Transportation by Waterborne Cortisol and Feeding Behavior in a Commercial Atlantic Salmon (Salmo salar) Grow-Out Recirculating Aquaculture System. Front. Physiol. 2022, 12, 771951. [Google Scholar] [CrossRef]
  36. Carbonara, P.; Dioguardi, M.; Cammarata, M.; Zupa, W.; Vazzana, M.; Spedicato, M.T.; Lembo, G. Basic knowledge of social hierarchies and physiological profile of reared sea bass Dicentrarchus labrax (L.). PLoS ONE 2019, 14, e0208688. [Google Scholar] [CrossRef]
  37. Dasgupta, P. Temporal variations in glucose level, oxidative stress and antioxidant profle of Koi carps (Cyprinus carpio var koi) in response to hypoxic tolerance. Biol. Futur. 2021, 72, 421–429. [Google Scholar] [CrossRef]
  38. Demska-Zakęś, K.; Gomułka, P.; Rożyński, M.; Zakęś, Z. Effect of a short-term sodium chloride bath on juvenile pikeperch (Sander lucioperca) welfare. Aquac. Rep. 2021, 19, 100569. [Google Scholar] [CrossRef]
  39. Wang, W.; Zhang, Y.; Liu, Y.; Adányi, N.; Zhang, X. Effects of waterless live transportation on survivability, physiological responses and flesh quality in Chinese farmed sturgeon (Acipenser schrenckii). Aquaculture 2020, 518, 734834. [Google Scholar] [CrossRef]
  40. Barton, B.A. Salmonid Fishes Differ in Their Cortisol and Glucose Responses to Handling and Transport Stress. North Am. J. Aquac. 2000, 62, 12–18. [Google Scholar] [CrossRef]
  41. Mirghaed, A.T.; Baes, M.; Hoseini, S.M. Humoral immune responses and gill antioxidant-related gene expression of common carp (Cyprinus carpio) exposed to lufenuron and flonicamide. Fish Physiol. Biochem. 2020, 46, 739–746. [Google Scholar] [CrossRef] [PubMed]
  42. Souza-Bastos, L.R.; Bastos, L.P.; Carneiro, P.C.F.; Freire, C.A. Acute salt exposure of the freshwater Characiformes: Pacu (Piaractus mesopotamicus, Holmberg 1887), Tambaqui (Colossoma macropomum, Cuvier 1818), and their hybrid “Tambacu”. Aquaculture 2016, 465, 352–358. [Google Scholar] [CrossRef]
  43. Sadoul, B.; Alfonso, S.; Cousin, X.; Prunet, P.; Begout, M.L.; Leguen, I. Global assessment of the response to chronic stress in European sea bass. Aquaculture 2021, 544, 737072. [Google Scholar] [CrossRef]
  44. Kawakami, Y. Characterization of triglycerides during early development of the Japanese eel (Anguilla japonica). Comp. Biochem. Physiol. Part A Mol. Integr. Physiol. 2022, 265, 111125. [Google Scholar] [CrossRef]
  45. Li, M.; Wang, X.; Qi, C.; Li, E.; Du, Z.; Qin, J.G.; Chen, L. Metabolic response of Nile tilapia (Oreochromis niloticus) to acute and chronic hypoxia stress. Aquaculture 2018, 495, 187–195. [Google Scholar] [CrossRef]
  46. Borowiec, B.G.; Scott, G.R. Rapid and reversible modulation of blood haemoglobin content during diel cycles of hypoxia in killifish (Fundulus heteroclitus). Comp. Biochem. Physiol. Part A Mol. Integr. Physiol. 2021, 261, 111054. [Google Scholar] [CrossRef]
  47. Costa, D.C.; Mattioli, C.C.; Silva, W.S.; Takata, R.; Leme, F.O.P.; Oliveira, A.L.; Luz, R.K. The effect of environmental colour on the growth, metabolism, physiology and skin pigmentation of the carnivorous freshwater catfish Lophiosilurus alexandri. J. Fish Biol. 2017, 90, 922–935. [Google Scholar] [CrossRef]
  48. Gozdowska, M.; Sokołowska, E.; Pomianowski, K.; Kulczykowska, E. Melatonin and cortisol as components of the cutaneous stress response system in fish: Response to oxidative stress. Comp. Biochem. Physiol. Part A Mol. Integr. Physiol. 2022, 268. [Google Scholar] [CrossRef]
  49. Øverli, Ø.; Nordgreen, J.; Mejdell, C.M.; Janczak, A.M.; Kittilsen, S.; Johansen, I.B.; Horsberg, T.E. Ectoparasitic sea lice (Lepeophtheirus salmonis) affect behavior and brain serotonergic activity in Atlantic salmon (Salmo salar L.): Perspectives on animal welfare. Physiol. Behav. 2014, 132, 44–50. [Google Scholar] [CrossRef]
Figure 1. Schematic diagram of the setup for experiment one. a represents the freezing time; b represents the exploration of new object; c represents the close to new object; d represents the observation of new object.
Fishes 07 00198 g001
Figure 2. Schematic diagram of the setup for experiment two. (a) Regional location; (b) Behavioral activity; (c) Location in the water body; (d) Abnormal movement; (e) Response time; (f) Food consumption.
Fishes 07 00198 g002
Figure 3. The effect of three-color bionic robot fish on the fear and exploratory behavior of crucian carp. (a) Freezing time; (b) Exploration time of new object; (c) Time close to new object; (d) Observation time of new object. Values are represented as mean ± SD of data from triplicates per treatment (n = 3).
Fishes 07 00198 g003
Figure 6. Blood biochemical levels of crucian carp at different sampling times. (A) Glucose (mg/dL); (B). Total protein (g/L); (C) Triglycerides (mg/dL); (D) MCH (pg). The results are expressed as mean ± SD (n = 6), and different letters indicate significant differences between groups (p < 0.05).
Fishes 07 00198 g006aFishes 07 00198 g006b
Figure 7. Skin pigmented area (%) of crucian carp at different sampling times. Results are expressed as mean ± SD (n = 6), and different letters indicate significant differences between groups (p < 0.05).
Fishes 07 00198 g007
Publisher’s Note: MDPI stays neutral with regard to jurisdictional claims in published maps and institutional affiliations.

