Article

Impacts of Recreational Angling on Fish Population Recovery after a Commercial Fishing Ban

1
Nature Research Centre, Akademijos Str. 2, LT-08412 Vilnius, Lithuania
2
School of Biosciences, The University of Melbourne, Melbourne, VIC 3010, Australia
3
Institute for Marine and Antarctic Studies, University of Tasmania, Hobart, TAS 7004, Australia
*
Author to whom correspondence should be addressed.
Fishes 2022, 7(5), 232; https://doi.org/10.3390/fishes7050232
Submission received: 2 August 2022 / Revised: 26 August 2022 / Accepted: 26 August 2022 / Published: 1 September 2022

Abstract

:
It is often assumed that recreational fishing has negligible influences on fish stocks compared to commercial fishing. However, for inland water bodies in densely populated areas, this assumption may not be supported. In this study, we demonstrate variable stock recovery rates among different fish species with similar life histories in a large productive inland freshwater ecosystem (Kaunas Reservoir, Lithuania), where previously intensive commercial fishing has been banned since 2013. We conducted over 900 surveys of recreational anglers from 2016 to 2021 to document recreational fishing catches and combined these catch estimates with drone and fishfinder device-based assessments of recreational fishing effort. Fish population recovery rates were assessed using a standardized catch-per-unit-effort time series in independent scientific surveys. We show that recreational fishing is slowing the recovery of predatory species, such as pikeperch Sander lucioperca (Linnaeus, 1758) and Eurasian perch Perca fluviatilis Linnaeus, 1758. The estimated annual recreational catches for these species were 19 tons (min-max of 7–55 tons) and 9 tons (4–28), respectively, which was considerably higher than the average commercial catch before the fishery closure (10 and 1 tons, respectively). In contrast, the recovery of roach Rutilus rutilus (Linnaeus, 1758), rarely caught by anglers (annual recreational catch of ca 3 tons compared to ca 100 tons of commercial catch), has been rapid, and the species is now dominating the ecosystem. Our study demonstrates that recreational fishing can have strong and selective impacts on fish species, reduce predator abundance, alter relative species composition and potentially change ecosystem state and dynamics.

1. Introduction

Lakes and rivers are essential habitats for biodiversity and provide multiple ecosystem services for people all around the world [1,2]. However, these are also among the most vulnerable ecosystems, heavily influenced by fishing, pollution, energy generation, and other human activities. Despite freshwater fish species being among the most threatened in the world [3], the status of fish stocks in inland waters has received far less consideration than marine stocks [4,5,6,7]. This is partly due to limited funding because most commercially valuable and, therefore, highly researched fisheries occur in marine ecosystems [8,9]. Another reason is that commercial fishing, which is often easier to monitor, has largely diminished in inland waters [10], while at the same time, recreational fishing effort appears to have increased rapidly [11,12]. The global recreational harvest is poorly documented but may be in the order of 2 million metric tons [4]. However, there are few studies that address the influence of recreational fishing on stock recovery after commercial fishing closures.
In developed countries, recreational angling often involves participation rates of 10–30% of the total population [13,14], constituting substantial social and economic activity and potentially exerting substantial environmental pressure. This is not surprising, considering that about half the people around the globe live within several kilometers of a freshwater body [15]. Moreover, during recent decades recreational angling has also become more efficient, facilitated by the use of advanced fish-finding devices and complex recreational gear, as well as increased mobility of anglers in search of fishing opportunities [16,17,18]. However, the sociopolitical importance of recreational angling and a lack of accurate estimates to draw attention to its influence [19] means that its sustainability is seldom questioned or seriously addressed [20]. The prevailing perception among many people is that angling is an ecologically benign activity [21] that has negligible impacts compared to commercial fishing.
Estimation of the recreational catch and rate of fishing mortality is important ecologically and from a regulatory perspective [22], but it can also be politically contentious [23]. Management agencies have increasingly relied on length, daily bag or trip limits, and seasonal closures to manage recreational catches [24], but these are often set without clear data on the level of regulatory needs. Some studies demonstrated that citizen science can be used for fish population size structure estimates [25], and in other cases, estimates of recreational fishing mortality relied on tagging and post-release survival [26,27]. They show that angler impacts could be substantial. In Lake Mjels in Denmark, nearly 20% of northern pike Esox lucius Linnaeus, 1758 was repeatedly caught by anglers within a 1.5-year period [27], while Cline et al. [28] reported that individually marked largemouth bass Micropterus salmoides (Lacepède, 1802) were recaptured one to six times per season, with recapture intervals ranging from 1 to 98 days. It was demonstrated that recreational angling can reduce target fish stock abundance in marine [29] and freshwater [30,31,32,33] systems, and recreational catches even exceed those taken by the commercial sector [12,34,35]. As a result, the negative effects of recreational fishing on aquatic systems have been clearly demonstrated [12,20,33,34,36].
One such case could be Kaunas Water Reservoir in Lithuania. This is a highly productive and relatively large (65 km2) water body, which for decades has supported important commercial fisheries and is also one of the most popular recreational fishing destinations in Lithuania. A commercial fishery operated in the reservoir from the 1960s, with catches averaging ca 100 tons per year and reaching almost 230 tons in the early 2000s (Figure S1). From 2005 onwards, commercial catches steadily declined, with stocks of many species collapsing, leading to a complete closure of all commercial fisheries in 2013 and expectations for a rapid recovery of populations. Regular scientific surveys have been conducted in the reservoir since 1992, and some fish species have indeed shown remarkable rates of recovery over the last decade [37]. Nevertheless, recovery rates appear to vary greatly across species, posing a question about the potential impacts of recreational fishing. In this study, we assess fish population abundance changes using data from scientific surveys, apply novel methods to estimate recreational fishing effort and catches and explore whether different rates of species recovery could be explained by differential recreational harvesting of fishes.

2. Materials and Methods

2.1. Research Area and Commercial Catch Data

Our study area is Kaunas Reservoir (54.87, 24.14), Lithuania’s largest artificial water body, created in 1959 (Figure 1). It occupies 65 km2, spans 3.3 km at its widest point, and has a maximum depth of 22 m. Based on scientific surveys, the dominant fish species are roach Rutillus rutillus (Linnaeus, 1758), bream (Abramis brama) (Linnaeus, 1758), pikeperch Sander lucioperca (Linnaeus, 1758), Eurasian perch Perca fluviatilis Linnaeus, 1758, and silver bream Blicca bjoerkna (Linnaeus, 1758) [37]; however, the abundance of some species such as Prussian carp Carassius gibelio (Bloch, 1782), common carp Cyprinus carpio Linnaeus, 1758, and vimba Vimba vimba (Linnaeus, 1758) might be underestimated due to scientific survey gillnetting methods (see below). Data about commercial catches were collected from monthly catch statistics reported by commercial fishing bodies and compiled by the Ministry of Environment or similar institutions since 1961. Since 2013 all commercial fishing has been banned.

2.2. Scientific Fish Abundance Data Collection

Scientific sampling in Kaunas Reservoir was conducted from 1991 to 2021 using a range of standard gillnetting approaches. In most cases, two sets of selective gillnet series ranging from 14 to 70 mm (14, 17, 21.5, 25, 30, 33, 38, 45, 50, 60, and 70 mm (knot to knot)) mesh size were used at each sampling station. The nets were typically set between 17:00 and 19:00 h and lifted the next day between 07:00 and 09:00 h, although slightly different soak times and net lengths were used during the 30-year sampling period; small variation in sampling methodology was accommodated in the statistical catch-per-unit-effort (CPUE) standardization (described below). Catches were typically weighed to the nearest gram, separately for each mesh size, net, and species. In aggregate, the study included 480 fishing events.

2.3. Statistical Analyses of Scientific Monitoring Data

Standardized annual CPUE was estimated for five main fish species commonly observed during scientific surveys: roach, bream, silver bream, Eurasian perch, and pikeperch. Other fish species, such as vimba, Prussian carp, or common carp, are also commonly caught by anglers in Kaunas Reservoir, but their abundances cannot be reliably estimated using gillnetting surveys. This is either because these species mostly stay in shallow vegetated areas that cannot be sampled with gillnets or, in the case of common carp, because even the largest mesh of 70 mm is too small to collect representative population samples. To account for systematic and random variation across sampling events, we standardized scientific CPUE for each of the five fish species using generalized linear models (GLM), as implemented in the R package ‘statmod’ (v. 1.4.33; [38]). For this analysis, year, season, location (station), gear material (nylon, capron), gear length, soak time, and mesh size were treated as fixed effects, and residuals of the year parameter were used as standardized CPUE values:
CPUEsc ~ year + season + station + gear_material + gear_length + soak_time + mesh_size + error
To account for the statistical properties of the scientific survey data, where many fishing events yield zero catches for a given species, we used the Tweedie distribution [39], as implemented in the R package ‘tweedie’ (v. 2.3.3; [40]).
For each species, standardization models were started using the full model with all explanatory variables, and then the variable number was reduced in a backward selection process based on Akaike’s Information Criterion (AIC; [41]). The model with the lowest AIC score (cut-off at delta AIC < 2, [42]) was selected as the best model (Table S1), as is commonly used in scientific CPUE standardization routines (e.g., [43]). The parameter year was treated as an unordered factor, which means that for each year value, the model estimated separate coefficients. This series of year deviations was then extracted as GLM model coefficients, back-transformed to the original values, and used in further analyses as standardized annual CPUE. For visual purposes and easier comparison across species, these CPUE values were scaled to ensure that the mean estimate in the entire time series is equal to 1. In some cases, exact net lengths, mesh sizes, or soak time were not available for scientific survey data from the earliest years. Therefore, in GLM analyses, net lengths were assigned into five groups (short to very long), mesh sizes into three groups (small, large, and full), and soak times into three values (short to long) and treated as ordered factors. Our sensitivity analyses on a separate data set showed that these categories were sufficient to capture CPUE trends (Table S2, Figure S2).
Finally, we aimed to test whether there was a significant trend in CPUE associated with the closure of commercial fisheries in 2013. For this, we conducted separate CPUE standardization analyses with the same model parameters, but in this instance, using only data from 2013 to 2021 and treating year as a numeric variable. In this way, we tested a hypothesis of whether there was a linear positive trend in annual CPUE deviations for each species over the last nine years, i.e., whether the regression slope is significantly positive. To assess whether there might be different CPUE trends in all length classes versus those in larger fish only, analyses were first performed using all records from scientific surveys (mesh sizes 14 to 70 mm) and then repeated using only fish records from mesh sizes >38 mm.

2.4. Onsite Recreational Fishing Surveys

In Lithuania, recreational fishing requires an angling license (yearly, monthly, or 2-day), but this does not apply to pensioners and children under 16 years of age, who can fish without a license. The annual number of licenses is not capped, and licenses are valid for the entire country (i.e., they are not location specific). For all anglers, total catch per trip (bag limit) in inland water bodies is capped at 5 kg, and there are also individual catch limits for some species: one individual of Wels catfish Silurus glanis Linnaeus, 1758, two for each of northern pike, pikeperch and asp Leuciscus aspius (Linnaeus, 1758), and 5 for chub Leuciscus cephalus (Linnaeus, 1758). Further, the total number of individuals from the five species cannot exceed five individuals per trip. In addition, minimum size limits are applied for some species, and all individuals below this limit must be released: Wels catfish-75 cm; asp-55 cm; pikeperch-45 cm; northern pike-50 cm; chub-30 cm; common carp-40 cm. Anglers are not required to report their trips or catches; therefore, the state has no information about the recreational effort (apart from the number of licenses sold), catches, or recreational CPUE through time.
To assess recreational fishing catches, we conducted voluntary onsite surveys of anglers. Over the course of 2016, 2017, 2020, and 2021, a total of 910 angler surveys were conducted, with a daily maximum of nearly 150 surveys. Surveys were conducted during all seasons, but the largest number of surveys was completed during the ice-fishing season, when angler activity was highest (Figure S3). The goal of the angling surveys was to assess recreational catches rather than to estimate recreational effort, which instead was estimated using a different method (see below). Surveys were conducted using modified methods recommended by Malvestuto [44] and Kaemingk et al. [45]. Briefly, surveys were distributed throughout the year, with more surveys conducted during weekends and the ice-fishing season, when fishing activity was high. During the open-water fishing season, anglers were interviewed at boat ramps and access points around Kaunas Reservoir, whereas during the ice-fishing season, anglers were interviewed at their fishing locations on the ice (Figure 1). Accordingly, in subsequent analyses, fishing trips were categorized as those conducted from the shore, on a boat, or on ice. Boat angler interviews were mostly complete trips, whereas shoreline interviews comprised both incomplete and complete trips (duration of the fishing trip was included in the model). As recommended by VanDeValk et al. [46], for angling parties containing more than one individual, catch data were collected separately from each angler.
Catch, effort, and harvest data were obtained by asking a series of structured questions. The following data were collected during each interview: geographic coordinates of angling location; fishing method (shore, boat, ice); duration of the angling trip; numbers (and length and weight when possible) and species of fish caught in total; number and species of fish released; numbers, length and species of fish retained; quantity and type of gear used (number of rods per angler); and a few other questions related to sex, age, angling importance and usage of fishfinder devices (not used in analyses presented here) (see Table S3). The surveys were voluntary and conducted by the Nature Research Centre scientific staff, and anglers could refuse to participate (this was the case with about 5% of anglers). Whenever anglers agreed, the harvested fish were identified, counted, and measured by the interviewers.

2.5. Assessment of Recreational Fishing Effort

To estimate the total annual recreational effort in Kaunas Reservoir, we used two sources of information. First, during 2020 we conducted drone-based angler surveys and calibrated anonymous daily usage of a popular fishfinder device Deeper®. Full methodological details, estimates of angler numbers, and uncertainty ranges are available in Dainys et al. [47]. Second, for the years prior to 2020, where no recreational effort estimates were available, we followed the general approach employed in FAO [48] and used data on recreational fishing license sales available from the Lithuanian Ministry of Environment. These data were available on an annual basis for 2002–2021, and the number of licenses issued was recorded only for Lithuania as a whole and not specific locations but included annual, monthly, and two-day license categories. In 2002 about 35 thousand licenses were sold, and by 2014, that number had more than doubled. Since 2014 the number issued has been relatively stable with an average of 74.8 thousand per year (min. 70.7; max. 78.5). Because the license data are available at a country level, we cannot use license data alone to estimate fishing effort in Kaunas WR, but we do make an assumption that spatial distribution of anglers remained approximately similar over the last 5 years. This means that we assume that if the total license sale was similar, recreational effort in Kaunas WR was also similar. This is consistent with other studies [49], which assumed that the trends in license sales reflected trends in recreational angling effort.

2.6. Statistical Analyses for Recreational Catches

As with the scientific survey CPUE, we used GLMs to estimate recreational CPUE using data from 910 onsite individual angler surveys. Here the full CPUE model included year, season, gear type (4 categories: float fishing, feeder (bottom) fishing, spin fishing, ice fishing), number of gears, duration of the fishing trip, and method (3 categories: shore, boat, ice).
CPUErec ~ year + season + gear_type + gear_number + duration + method + error
Separate CPUE models were built for each species and for all species combined (total catch per trip). Analyses were performed using the Tweedie distribution to account for zero catches. For each species, the full model was progressively reduced in a backward selection based on AIC values (delta AIC < 2).
In these analyses, we included all reported catches, regardless of whether the fish was retained or released. This was for two reasons. First, it is not known how many of the released fish survive, with estimated release mortality rates ranging from almost zero to nearly 90% [24,50,51]. Second, because angler surveys were voluntary and conducted by scientific personnel and not fisheries enforcement officers, some anglers were reluctant to show their catches and responded that all fish were released or that they did not catch anything. Consequently, our observed and recorded catches are likely to underestimate the actual retained catches. Future studies are needed to assess the correspondence between voluntarily reported survey catches and those observed by officials with enforcement power; this number is likely to differ across countries and socio-economic groups. Based on angler reports, about half of the caught fish were released. In an extreme case, if all angler reports were true and all released fish survived, actual recreational angler catch would be about half of our current estimates; we discuss these assumptions and implications in the Section Discussion.
To estimate total recreational catch, we needed to combine estimates of recreational effort and catch per effort. Here we used estimated daily angler numbers in Kaunas Reservoir, as described in Dainys et al. [47]. For these daily numbers, we did not have information about gear types, numbers, fishing duration, or fishing method. Therefore, we developed a set of simplified statistical models to predict recreational CPUE using the season as the only predictive variable. For nearly all species, the season was one of the most significant factors in the full models (see Section Results), although naturally, the season-only models explained considerably less variation than the full models (see Section Results). Nevertheless, parameter estimates for full and season-only models were generally similar (Table S4, Figure S5), indicating that season-only models provided a reasonable general estimate of recreational catch, given the available data.
The R code and full details of the statistical analyses and data sets of recreational data are available as a supplement to this manuscript and through https://github.com/astaaudzi/recreationalCatch, accessed on 29 August 2022. Scientific CPUE standardization used similar methods and codes to the recreational catch CPUE standardization details.

3. Results

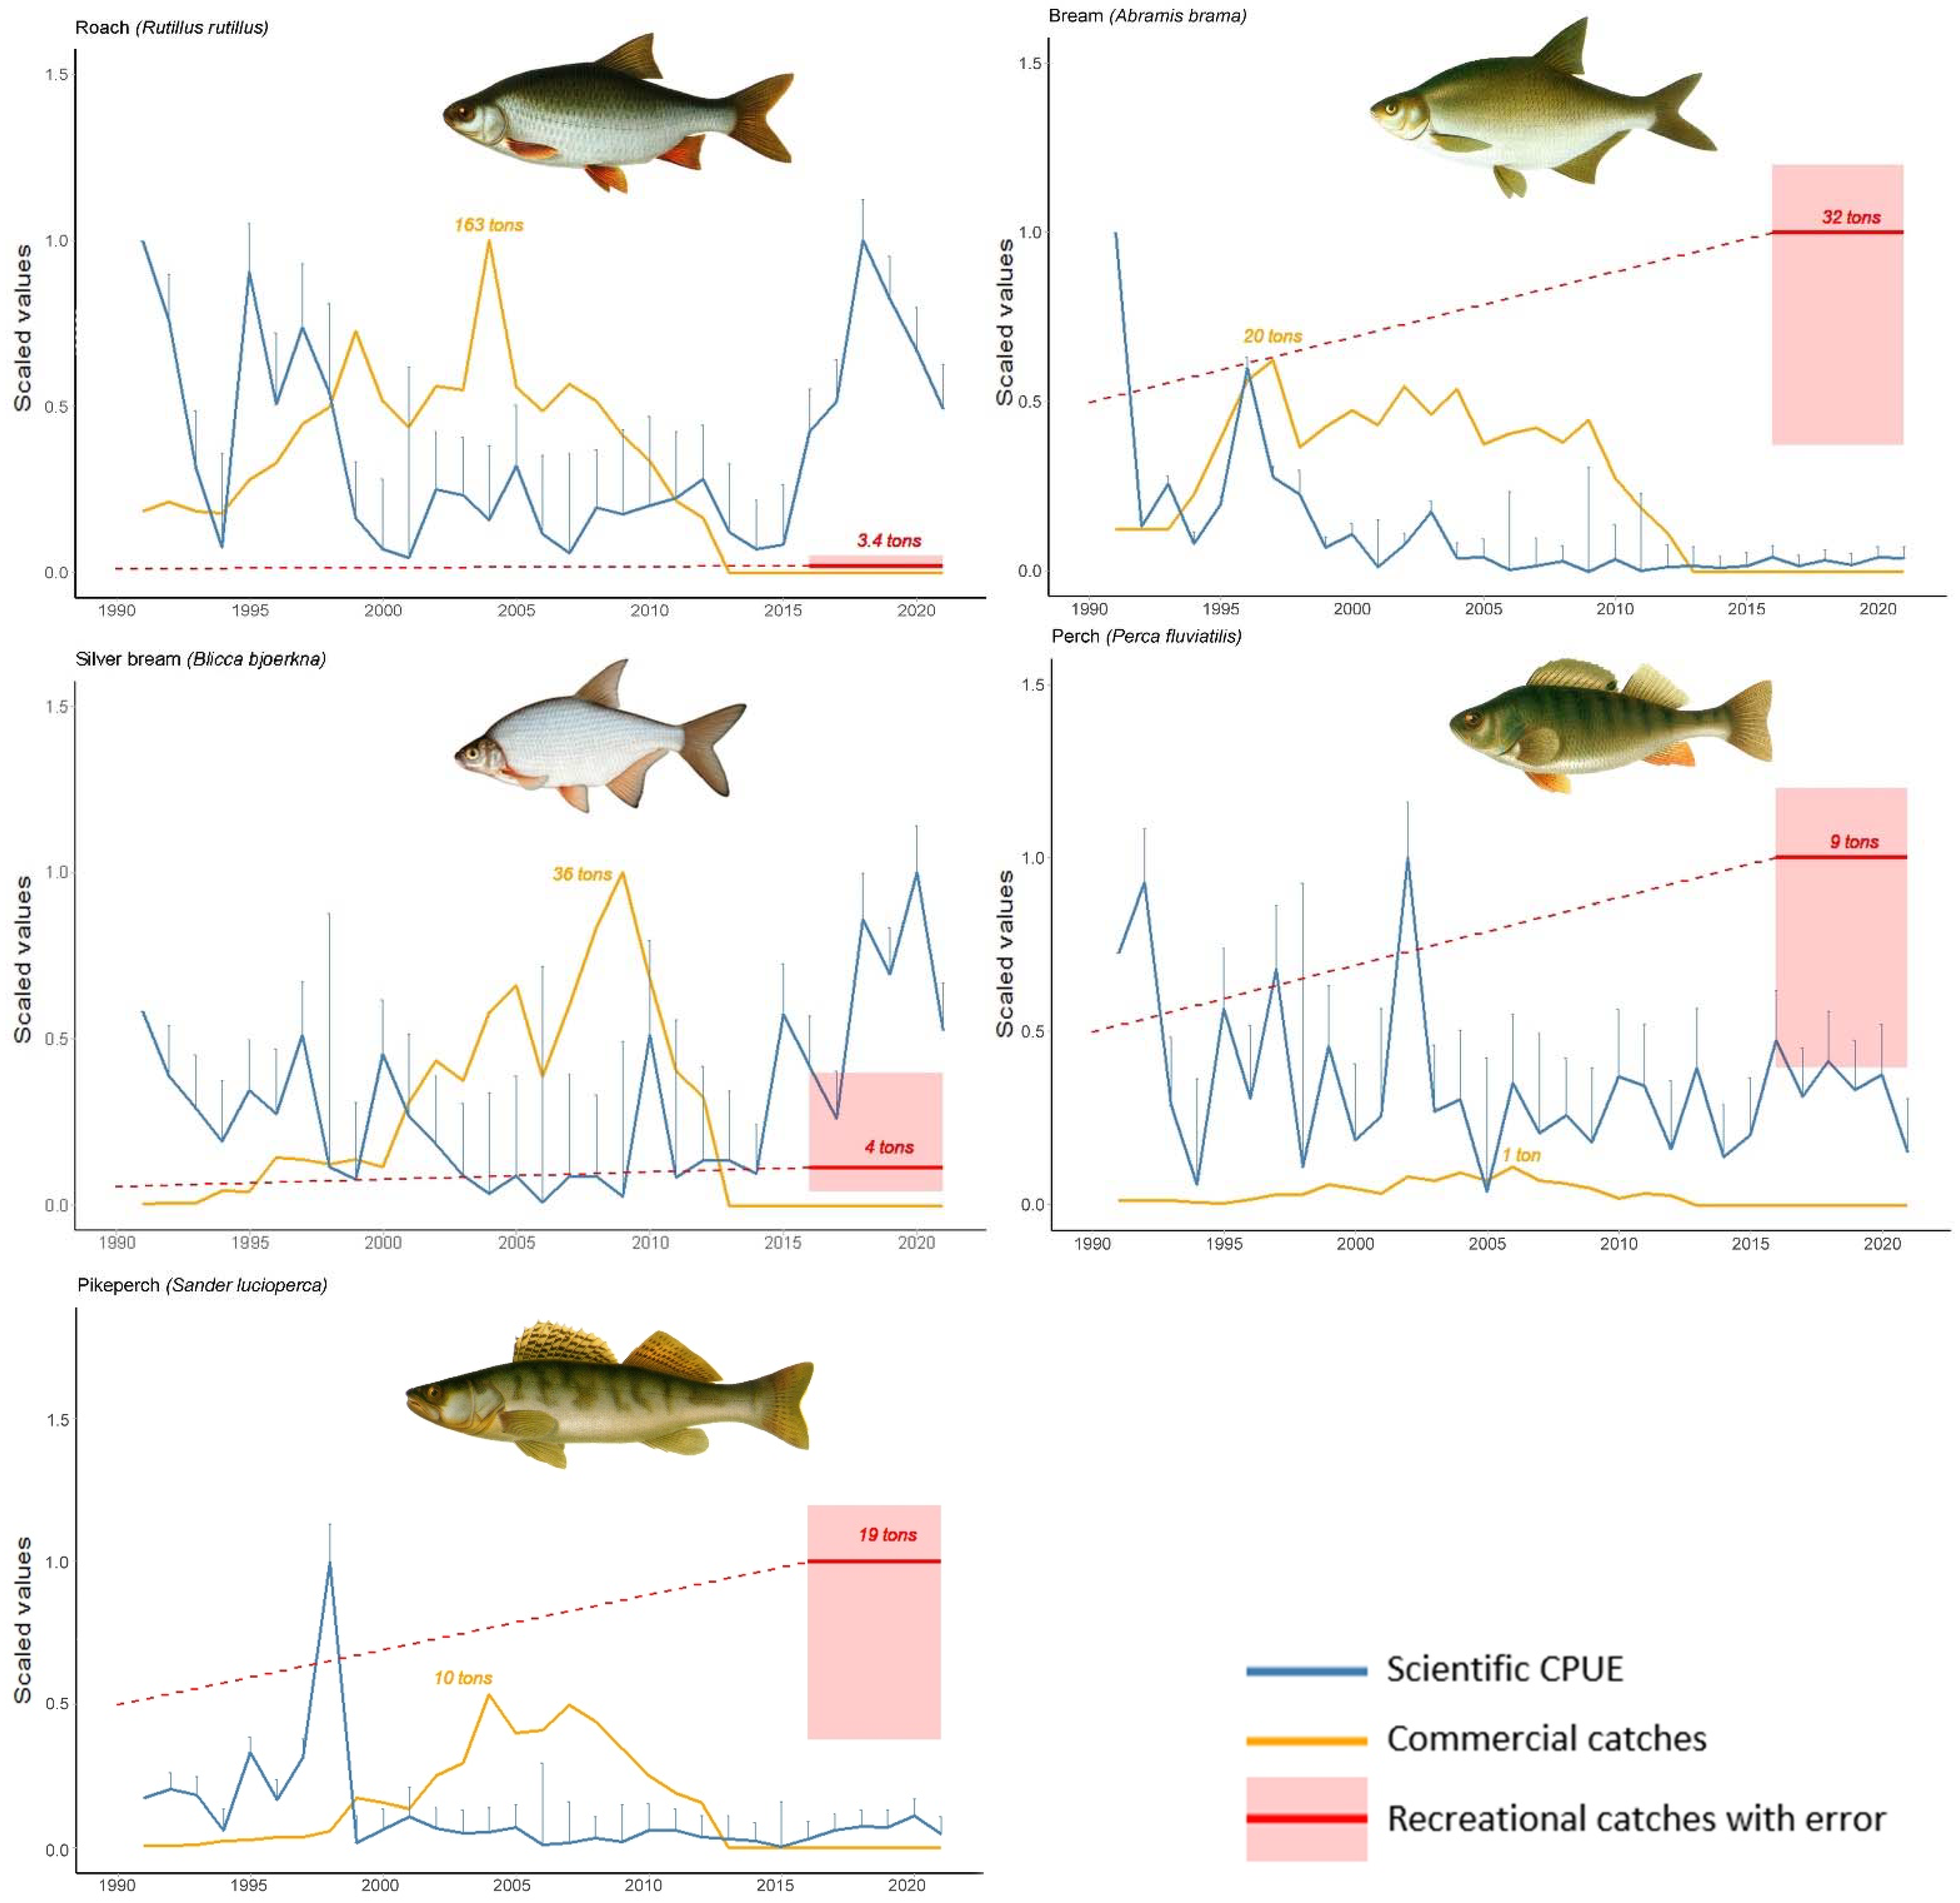
3.1. Scientific Catch-Per-Unit-Effort Trends Show Slow Recovery Rates of Piscivorous Species

The standardized scientific CPUE values for bream, silver bream, roach, and pikeperch were reasonably high during the 1990s and then decreased in the 2000s (Figure 2), whereas for Eurasian perch, the values remained relatively stable throughout the 1990s to the 2000s. After the closure of the commercial fishery in 2013, there was a marked increase in scientific CPUE for roach and silver bream (Figure 2), although there appears to be a decline in roach CPUE during the last few years. In contrast, for bream, Eurasian perch, and pikeperch, no clear trends over the last decade were evident.
To assess the magnitude and significance of a linear CPUE trend since 2013, we checked whether there was a significantly positive slope of standardized yearly CPUE values during 2013–2021, where the year was treated as a numeric variable (Figure S4). In these analyses, roach and silver bream showed a steep positive and highly significant (p < 1× 10⁻⁴) trend, with slopes of about 0.2, indicating about a 20% increase in CPUE each year. These trends were evident both in the analyses across all fish lengths and those restricted to mesh sizes > 38 mm. Bream also showed a positive, although weaker (ca 10%) slope (p = 0.002 for all lengths and p = 0.017 for large lengths). Similarly, a 10% slope was observed in pikeperch when all lengths were included (p = 0.007), but there was no significant trend when only large fish were analyzed (p = 0.27). In contrast, there was a negative CPUE trend for Eurasian perch, suggesting about a 6–7% decrease in scientific CPUE per year, although this trend was only marginally significant for large sizes (p = 0.056). In summary, scientific survey data showed no recovery in perch or large pikeperch but very rapid recovery rates in roach and silver bream (Table S5).

3.2. Recreational Angling Mostly Targets Piscivorous Fish and Some Cyprinids

In 910 angler surveys conducted over the course of 2016, 2017, 2020, and 2021, 53.2% (N = 484) of the interviewed anglers were fishing during the open-water season, and of these 484 anglers, about one-quarter (25.8%, N = 125) were fishing from boats, and the rest (74.2%, N = 359) fished from the shore. The remaining 46.8% of anglers (N = 426) were interviewed during the ice-fishing season. In total, 14 different fish species were recorded during the angler surveys: Eurasian perch, Prussian carp, common carp, common bream, common roach, northern pike, silver bream, ruffe Gymnocephalus cernuus (Linnaeus, 1758), common rudd Scardinius erythrophthalmus (Linnaeus, 1758), asp, pikeperch, Wels catfish, chub and vimba. Perch and pikeperch were the main species taken by anglers who were fishing from boats, comprising almost 79% of the total catch by numbers. Prussian carp and bream comprised more than half (56.5%) of the total catch caught by anglers fishing from the shore. Perch was the main species caught by anglers fishing on ice, comprising 57.9% of the total catch by numbers.
In GLMs applied to recreational catch, the best model for the weight of total recreational catch per fishing trip (all species combined) included all parameters (Table S4). This model indicated that total recreational CPUE was highest during summer, when fishing from a boat and targeting bottom-feeding (demersal) species (Table S4, Figure S5). For all fish species combined, the highest catches per trip were recorded in 2020, and despite the closure of commercial fisheries, we found no obvious trend of increasing recreational catch per trip between 2016 and 2021 (Figure S5, red symbols from full model parameters). Fishing duration and number of gears used also had a positive and significant effect on the total catch. Total standardized recreational catch per trip was highest in spring and summer (Table 2), reaching approximately 1.0–2.5 kg per fishing trip, and lowest in winter, with about 300 g per trip.
When recreational CPUE was modeled separately for different species, parameter and catch estimates were more uncertain. Nevertheless, in most cases, the season had a significant effect, with the highest catches of Prussian carp, pikeperch, silver bream, or bream observed in the summer or spring, and boat-based or spin fishing yielding higher catches of predatory species, such as pikeperch and Eurasian perch (Table S4, Figure S5). Again, as with the total recreational catch, there were no clear annual trends. The year was identified as an important variable for some species, but typically this reflected one or two years that were significantly higher or lower than the average. For species that were less common in recreational catches, such as roach, pike, asp, vimba, and some others, most parameter estimates were highly uncertain. For example, for roach, the best recreational CPUE model included only the type of fishing gear, where ice fishing had higher catches than other methods (in this instance, although the ice-fishing method coincides exclusively with the winter season, catches in other seasons were similar to those in winter and therefore season was not selected as an important variable). In the analyses performed at a species level, the highest spring and summer recreational CPUE were for Prussian carp, common carp, bream, and pikeperch (Table 2). In autumn, the highest recreational CPUE was for bream, common carp, and Eurasian perch. In winter, Eurasian perch dominated catches, and the uncertainty of parameter estimates for other species was very high due to the limited number of observations.
To assess the total catch per year, we combined the estimated annual number of angling trips with the catch per trip. For these extrapolations, we used season-only recreational catch CPUE models because estimates of total angling trips were available daily but without information about gear types, trip duration, or other variables that might affect CPUE. In cases where specific species x season predictions generated infinite catch, this season was omitted from the total recreational catch estimation. To assess whether season-only CPUE models gave similar magnitude and direction of coefficient estimates, we compared the best models with several parameters versus season-only CPUE models (Figure S5). Generally, the season coefficient estimates were similar between the two model sets, although uncertainty ranges were higher in season-only models (Figure S5). This was especially true for catch estimates during winter (for pikeperch, Prussian carp, common carp, asp). Season had no significant effect on the catch of roach in full and season-only models; hence, for this species, catch extrapolation was undertaken using the intercept-only model (Table S4). Season-only models explained considerably less variance (5–35%, except for roach, Table S4) compared to the best model (21–69%); therefore, predictions of total catch had high uncertainty ranges (see below).

3.3. Estimated Recreational Catches for Some Fish Species Are Much Larger Than Former Commercial Catches

In our earlier study [47], we estimated the total number of angling trips in Kaunas Reservoir for each season between March 2020 and March 2021. Using Bayesian analyses, we showed that during spring, summer, and autumn, there were (in thousands, K) about 40K (26K–64K), 31K (20K–49K), and 21K (13K–35K) angling trips, where the ranges in parentheses are the 80% posterior Bayesian probability limits. Note that the Bayesian posterior probability limits are not the same as confidence intervals from frequentist statistical models and are often considerably wider. Therefore, in Dainys et al. [47] and here we use 80% posterior probability ranges for angler effort. When this uncertainty is combined with a statistical assessment of recreational CPUE, we use min and max (rather than 95% intervals) to indicate uncertainty. For the ice-fishing season, the estimated number of trips was 17K (13K–22K). Combining these estimates with the estimated catch per angling trip in the season-only models and propagating the error from both sets of estimates suggests that during one year, anglers caught about 143 tons (70–305 t) of fish (Table 1), with the highest catches observed in summer and spring (61 t and 56 t, respectively).
The annual catch estimates for the five fish species that were important commercially and had scientific CPUE trend estimates were as follows: about 19 tons for pikeperch but with very high uncertainty ranges (7–55 t), ca 9 t for Eurasian perch (4–28 t), ca 32 t for bream (12–90 t), 4 t for silver bream (2–14 t) and only ca 3 t for roach (1–8 t). For roach and silver bream, these recreational catches were negligible compared with the past commercial catches, which in peak years used to reach >100 t for roach and >30 t for silver bream (Figure S1). For the other species, however, the picture was completely different. For example, for Eurasian perch, recreational catches were 10–20 times higher than the former commercial take (at least 4 times higher if we apply the minimum uncertainty range of the recreational catch and the peak of the commercial catch). Similarly, for pikeperch, the recreational take was about 5 times higher than former commercial catches, and for bream about 3 times higher (Figure 2). This is despite the pikeperch and bream being some of the most valuable commercial species. Non-commercial fish species such as Prussian and common carp also comprised a large proportion of the annual recreational catch, at 44 t and 17 t, respectively. For these species, commercial annual average catches were 4 and 0.5 t, respectively, but no reliable scientific CPUE series was available to assess population trends. Finally, although highly uncertain, around 11 t of catfish were caught per year by anglers, whereas annual recreational catches of other species, such as asp, pike, or vimba, were about 1 t each (Table 1).

4. Discussion

4.1. Recreational Fishing Has Disproportional Impact on Predatory Species

Commercial fishing in inland and coastal ecosystems has been in decline [52]. This is generally good news for freshwater ecosystems, given that freshwater fish are among the most vulnerable and threatened taxa in the world [53]. In line with this general trend, about 10 years ago, all commercial fishing ceased in Kaunas Reservoir due to regulatory closure. Given the high productivity levels of Kaunas Reservoir, it was expected that fish population biomass and abundance would increase rapidly after the closure, but this was only observed in some species, such as roach [37]. Population growth rates differed greatly among species, but the reasons for this difference remained unclear. This study presents detailed analyses of recreational fishing catches in Kaunas Reservoir and shows that angling, through direct and indirect effects, is likely to be the main reason for the variability in responses of fish species to the commercial fishing closure. Our estimates of recreational anglers’ catches are based on some of the most detailed surveys available to date (daily estimates of angler numbers and nearly one thousand onsite surveys), yet they still have high uncertainties reflecting inherent variability in recreational catches. They nevertheless clearly show that fish species exhibiting slow or even negative scientific CPUE trends, such as Eurasian perch or pikeperch, have been subject to high recreational exploitation. This contrasts with the low recreational catch pressure on rapidly recovering species, such as roach or silver bream. Other species, such as Prussian carp or common carp, may also be adversely affected by angling, but scientific CPUE for these species was imprecise, precluding the detection of trends in abundance. Moreover, both species are non-native to Lithuania and therefore are of less ecological concern.
Although Kaunas Reservoir has always been recognized as a popular angling destination in Lithuania, only vague estimates of total recreational catches were available prior to our study, as is the case for most waterbodies in Europe or worldwide. This has led to a general assumption that recreational angling has a relatively minor influence compared with the commercial sector and that recreational fishing mortality lies within the range of fluctuations in natural mortality (e.g., below 10% per year). Despite this perception, there is growing recognition that recreational fishing can be a significant contributor to global declines in fish populations, particularly in inland waters [12,32,33,34,54]. For example, Zeller et al. [55] found that during 1950–2005 non-commercial catches from demersal fish stocks in coastal marine areas in Hawaii were more than double the reported commercial catches. In Lake Erie (USA), commercial estimates of walleye Sander vitreus (Mitchill, 1818) fishing mortality over the course of 18 years ranged around 0.20 (peak of 0.55), whereas recreational fishing mortality was more stable over time and ranged between 0.05 and 0.16 [26]. However, in nearby Lakes St. Clair and Huron, recreational fishing mortality reached 0.37 in 2005. In fact, anglers may have a particularly strong influence on depressing the size structure of target fish populations as they exhibit greater size selectivity than commercial fishers, for example, through the choice of lure and hook size [56]. For freshwater ecosystems located near densely populated areas, recreational fishing mortality can be extreme, reaching annual exploitation rates up to 80% of the average standing stock biomass (for review, see [57]).
In this study, we did not estimate total population biomasses or mortality rates for different fish species in Kaunas Reservoir, as this would require more detailed modeling. However, it is clear that compared to commercial catches, recreational fishing has an especially strong influence on bream and predatory species, with potentially adverse ecological implications for the entire ecosystem. There might be several reasons why Eurasian perch and pikeperch recreational catches are considerably higher than past commercial catches. It seems unlikely that Eurasian perch or pikeperch were not targeted by commercial fishers because both species are prized and have high resale value. Instead, it seems more likely that angling imposed consistently high mortality rates, and as a result, the commercial harvest prior to closure was dominated by other species that were either difficult for recreational anglers to catch (roach) or were not targeted (silver bream). Such a scenario would suggest that anglers were very efficient at targeting perch, pikeperch, and bream, and this is not surprising. Our assessment of recreational effort in Kaunas Reservoir indicates that during 2020 an average of about 300 recreational fishing trips were conducted daily [47]. While this number might have been slightly inflated by COVID-19 effects (although based on license sales or yet unpublished analyses of fishfinder data, there is no strong evidence in support), the numbers are still very high. When combined with angler flexibility to specifically target suitable habitats, technically advanced fishing gear [17,18], and a determination to explore a wide range of places, anglers’ efficiency is likely to be even higher than in the commercial sector. However, some species may still be difficult to catch. Notably, in our interviews, many anglers commented that roach would be a desirable catch, yet recreational catches for this species were very low. It is possible that roach are not attracted to lures due to ample quantities of Dreissena mussels, a common non-native mollusk that constitutes up to 80% of the roach diet [58]. The situation is different for silver bream, another species that has shown rapid recovery since 2013. This species is considered of low value by recreational and commercial fishers but was a substantial component of commercial bycatch, with up to 30 tons per year landed (compared to only about 1 t of recreational catch).
Selective removal of predatory fishes by recreational anglers is a well-recognized issue, which is likely to have adverse ecological consequences in Kaunas Reservoir and possibly other Lithuanian and central European lakes and reservoirs. Pikeperch and large Eurasian perch play important regulatory roles, and their low abundance can lead to trophic cascades where the water body they inhabit becomes dominated by roach and phytoplankton [59]. If biomass and lengths of predatory species are strongly suppressed by anglers, their populations can become less able to exert predatory control on cyprinid abundance. Larger cyprinid species may even switch to feed on Eurasian perch [60], thereby leading to positive feedback loops in the ecosystem, which further exacerbate the depletion of Eurasian perch. Roach, which is extremely abundant in Kaunas Reservoir, is known to be a generalist species [61] that, together with other abundant cyprinids such as bream and white bream, can consume eggs and fry of other species. Potential competition for food and space is also possible, especially at a young age.

4.2. Limitations and Future Research Needs

Although this study provides the first comprehensive assessment of recreational catches in Lithuania, like all assessments of recreational effort and catch, it has large uncertainty ranges and a range of limitations that warrant some caveats. First, detailed recreational effort data were available only for one year and therefore had to be extrapolated on the basis of recreational fishing license sales. Such extrapolation is commonly used to estimate recreational effort but is imprecise. It is possible that during 2020, in association with the outbreak of the COVID-19 pandemic, anglers conducted more trips per annual license, compared with previous years [62]. This would produce overestimates in our recreational catch estimates for the period 2016–2019. Second, as mentioned in the Methods, we considered that all fish recorded in angler surveys were retained, even though, according to angler reports, about half of the catch was released. Our choice to ignore the released fish aimed to account for post-release mortality and the likely underestimation of disclosed catches in our voluntary surveys. Nevertheless, even if we consider that catch-and-release rates were reported accurately and all released fish survived, our recreational catch estimates by biomass would be about 30–50% lower (because most released fish were small, contributing less to the total biomass caught). This would still suggest that recreational catches of Eurasian perch, pikeperch, and bream were far higher than the commercial catches of the past and are likely to be having a major influence on population abundances. Third, for some species, our statistical models of recreational CPUE had very high upper confidence ranges, indicating high uncertainty about the maximum possible recreational catch. However, the estimated total catch per trip (1.5–2.5 kg per trip during the open-water season) was compatible with online surveys we conducted earlier and is less than half of the total allowable catch per trip (currently at 5 kg). Access-point creel surveys are generally assumed to provide relatively accurate estimates of angler harvest [63]. Jones et al. [64] recommended a minimum of 100 interviews for a reliable creel survey, particularly when angler catch rates are highly variable. In this study, we interviewed 910 anglers, which provides suitable spatial and temporal coverage. However, all of our interviews were performed by scientific staff, with voluntary participation, i.e., anglers could refuse to respond to questions. It is normal that harvest data obtained during creel surveys are based on angler reports and are accepted without validation [65,66]. However, in several lakes in Florida (USA), a comparison between reported and counted harvests revealed differences of 7–22% for anglers targeting sunfish (Lepomis spp.) or black crappie Pomoxis nigromaculatus (Lesueur, 1829), although smaller biases were found when anglers were targeting sunshine bass, palmetto bass (male Morone chrysops × female M. saxatilis) and largemouth bass [66]. These biases are likely to differ across countries, recreational fishing rules, and socio-economic groups. For example, in the Florida example above, accuracy among species was inversely related to bag limit size [66]. In the future, it would be important to assess discrepancies between catches reported based on voluntary angler surveys, such as ours, and those conducted by fisheries regulatory bodies. Finally, in this study, we focus on recreational catch as the main explanation for the difference in species recovery rates after the commercial fishing ban. We show that for species with suitable scientific CPUE data, the trends in abundance are well explained by the changes in mortality due to recreational fishing. However, there could be other factors that might affect these species differently. For example, changes in water quality or other limnological parameters, habitat availability, or other factors could also influence the recovery of these species. This should be addressed in future studies.

4.3. Suggestions for Recreational Angling Management

Recreational activities such as angling are important for human well-being and can provide substantial contributions to local economies [48,67]. In many countries, including Lithuania, they are also likely to provide some proportion of the local protein supply. What are the possible management solutions for sustainable use of inland ecosystems? It is unrealistic to expect that low population densities of predatory fishes will automatically reduce angling pressure. Lewin et al. [57] point out that perceptions about the self-regulation of anglers through reducing fishing pressure in response to declining abundance are false. Instead, awareness campaigns and more targeted management measures may be needed. One of the main challenges in recreational fishing management is that fishing effort is usually unknown and not regulated. Fishing licenses are not limited, and they are cheap, and, at least in Lithuania, annual licenses allow an unlimited number of fishing trips. This means that even with regulations on daily bag limits, total catch can be exceptionally high. More successful measures for facilitating resource sustainability and angler satisfaction are likely to be achieved through length and slot limits, especially if they also protect large and highly fecund individuals [68]. Limiting or prohibiting recreational fishing access in protected areas could be important but is often contentious and conflict-prone because peoples’ freedom of choice is affected [69]. However, recreational influences can be managed using tools that do not prohibit access to a site entirely, such as spatial and temporal zoning [70,71]. In many countries, anglers now also engage in catch-and-release fishing, especially for more vulnerable predatory species. This can be an effective measure, although there can be substantial post-release mortality [50] as well as reduced growth and fitness among survivors [72]. Either way, to understand and assess recreational fishing influences, society and recreational fisheries managers need reasonably accurate, and cost-effective methods to monitor angler effort and catch, as have been initiated during this study and will continue to evolve.

Supplementary Materials

The following supporting information can be downloaded at: https://www.mdpi.com/article/10.3390/fishes7050232/s1, Figure S1: Commercial catches in tons (t) since 1961 in Kaunas Reservoir.; Figure S2: Comparison of the standardized CPUE when treating net length and soak time as numeric vs ordinal variables (Curonian Lagoon data, See Table S2.); Figure S3: Number of daily angler surveys in Kaunas Reservoir. Days with very high daily survey numbers (>50) correspond to ice fishing season, when fishing activity is very high; Figure S4: Trends in standardized scientific CPUE since fishery closure across all fish sizes (left) and those restricted to mesh sizes > 38 mm (right); Figure S5: Estimates of general linear model coefficients (±standard error) for total and species-specific recreational catch. Coefficient estimates for the best model are shown in red and those for the season-only model (used to predict total angler catches) are shown in blue. Due to high confidence intervals, values of some estimates are not shown as they are out of scale (SE provided in Table S4). The coefficients for variables that are treated as factors in the GLM are shown as differences from the first value of each parameter; they are autumn for ‘season’, Feeder for ‘gear_type’ (compared to Spin and Float fishing), shore fishing for ‘method’, and 2016 for ‘year’; ‘gear_no’ and ‘fishing_duration’ were treated as numeric variables; and ‘fishing_duration’ was estimated in minutes. Table S1: Parameters included in the best (lowest AIC value) general linear model of scientific CPUE and the proportion of total variance explained. All variables are treated as fixed effects; Table S2: Categories of net length, mesh sizes and soak time used to standardise scientific catch per unit effort. Because only approximate values were available for some fishing trips, we used 5 net length, 3 mesh size and 3 soak time categories. These categories were sufficient to capture the trend in CPUE, assessed using a smaller number of surveys where exact numeric values of these parameters were available (Figure S5); Table S3: Questionary that was used for onsite angler surveys done by the scientific personnel; Table S4: Coefficients of the general linear models applied to recreational fishing catch CPUE estimation. For each species or total catch, we show the full, best and the season only model. Note that for each parameter that is treated as a factor, coefficients are relative to the first value; this is indicated in the coefficients of Total catch. Season “Winter” fully corresponded with the ice fishing season and “Ice fishing rod” gear type. Therefore in most cases only three gear types (Bottom, Spin and Float fishing) are included in the model (except for roach, where season was not included in the best model); Table S5: Commercial catches and scientific monitoring standardised CPUE time series of different fish species before and after closure of commercial fishery; Table S6: Estimated recreational catches (grams per fishing trip) and their uncertainty for less common species in Kaunas WR (main species are shown in Table 2); Supplementary R code and data used in the analysis.

Author Contributions

Conceptualization, J.D. and A.A.; methodology, J.D., M.K. and A.A.; software, E.J. and A.A.; formal analysis, J.D., E.J. and A.A.; investigation, M.K., J.D., A.R. and A.M.; resources, L.L. and A.A.; data curation, E.J., Ž.P., L.L. and A.A.; writing—original draft preparation, J.D., E.J., H.G., M.K., A.R., A.M., Ž.P., L.L. and A.A.; writing—review and editing, J.D., E.J., H.G., M.K. and A.A.; visualization, J.D., E.J., A.M. and A.A.; supervision, H.G. and A.A.; project administration, A.A.; funding acquisition, A.A. All authors have read and agreed to the published version of the manuscript.

Funding

This study has received funding from the European Regional Development Fund (project no. 01.2.2-LMT-K-718-02-0006) under a grant agreement with the Research Council of Lithuania (LMTLT).

Institutional Review Board Statement

All sampling and surveys were conducted in accordance with the Lithuanian law. Permits for fish sampling were issued by the Environmental Protection Agency under the Ministry of Environment of the Republic of Lithuania.

Data Availability Statement

Data and code used in the analyses are available as a supplement to this publication and also stored in a publicly accessible repository (GitHub) that does not issue DOIs, available through https://github.com/astaaudzi/recreationalCatch.

Conflicts of Interest

The authors declare no conflict of interest.

References

  1. Biggs, J.; von Fumetti, S.; Kelly-Quinn, M. The importance of small waterbodies for biodiversity and ecosystem services: Implications for policy makers. Hydrobiologia 2017, 793, 3–39. [Google Scholar] [CrossRef]
  2. Tockner, K. Freshwaters: Global Distribution, Biodiversity, Ecosystem Services, and Human Pressures. In Handbook of Water Resources Management: Discourses, Concepts and Examples; Springer: Cham, Switzerland, 2021. [Google Scholar] [CrossRef]
  3. Su, M.; Wang, L.; Xiang, J.; Ma, Y. Adjustment trend of China’s marine fishery policy since 2011. Mar. Policy 2021, 124, 104322. [Google Scholar] [CrossRef]
  4. FAO. Review of the State of World Fishery Resources: Inland Fisheries; FAO Fisheries Circular No. 942; FAO Fisheries Department: Rome, Italy, 1999. [Google Scholar]
  5. Hilborn, R.; Branch, T.; Ernst, B.; Magnusson, A.; Minte-Vera, C.; Scheuerell, M.; Valero, J. State of the World’s Fisheries. Ann. Rev. Environ. Resour. 2003, 28, 359–399. [Google Scholar] [CrossRef]
  6. Kura, Y.; Revenga, C.; Hoshino, E.; Mock, G. Fishing for Answers: Making Sense of the Global Fish Crisis; World Resources Institute: Washington, DC, USA, 2004. [Google Scholar]
  7. Funge-Smith, S.; Bennett, A. A fresh look at inland fisheries and their role in food security and livelihoods. Fish Fish. 2019, 20, 1176–1195. [Google Scholar] [CrossRef]
  8. Walters, C. Designing fisheries management systems that do not depend upon accurate stock assessment. In Reinventing Fisheries Management; Springer: Dordrecht, The Netherlands, 1998; pp. 279–288. [Google Scholar]
  9. Mangin, T.; Costello, C.; Anderson, J.; Arnason, R.; Elliott, M.; Gaines, S.D.; Hilborn, R.; Peterson, E.; Sumaila, R. Are fishery management upgrades worth the cost? PLoS ONE 2018, 13, e0204258. [Google Scholar] [CrossRef]
  10. FAO. The State of World Fisheries and Aquaculture 2010; FAO Fisheries and Aquaculture Department: Rome, Italy, 2010; p. 214. [Google Scholar]
  11. Cowx, I.G. Analysis of Threats to Freshwater Fish Conservation: Past and Present Challenges. In Conservation of Freshwater Fish: Options for the Future; Collares-Pereira, M.J., Cowx, I.G., Coelho, M.M., Eds.; Blackwell Science: Oxford, UK, 2002; pp. 201–220. [Google Scholar]
  12. Coleman, F.C.; Figueira, W.F.; Ueland, J.S.; Crowder, L.B. The Impact of United States Recreational Fisheries on Marine Fish Populations. Science 2004, 305, 1958–1960. [Google Scholar] [CrossRef] [PubMed]
  13. Arlinghaus, R.; Cooke, S.J. Recreational Fisheries: Socioeconomic Importance, Conservation Issues and Management Challenges. Recreat. Hunt. Conserv. Rural. Livelihoods 2009, 1, 39–58. [Google Scholar] [CrossRef]
  14. Arlinghaus, R.; Tillner, R.; Bork, M. Explaining participation rates in recreational fishing across industrialised countries. Fish. Manag. Ecol. 2015, 22, 45–55. [Google Scholar] [CrossRef]
  15. Kummu, M.; de Moel, H.; Ward, P.J.; Varis, O. How close do we live to water? A global analysis of population distance to freshwater bodies. PLoS ONE 2011, 6, e20578. [Google Scholar] [CrossRef] [Green Version]
  16. Papenfuss, J.T.; Phelps, N.; Fulton, D.; Venturelli, P.A. Smartphones Reveal Angler Behavior: A Case Study of a Popular Mobile Fishing Application in Alberta, Canada. Fisheries 2015, 40, 318–327. [Google Scholar] [CrossRef]
  17. Feiner, Z.S.; Latzka, A.W.; Wolter, M.H.; Eslinger, L.D.; Hatzenbeler, G.R. Assessing the Rage Against the Machines: Do Ice Anglers’ Electronics Improve Catch and Harvest Rates? Fisheries 2020, 45, 327–333. [Google Scholar] [CrossRef]
  18. Cooke, S.J.; Venturelli, P.; Twardek, W.M.; Lennox, R.J.; Brownscombe, J.W.; Skov, C.; Hyder, K.; Suski, C.D.; Diggles, B.K.; Arlinghaus, R.; et al. Technological innovations in the recreational fishing sector: Implications for fisheries management and policy. Rev. Fish Biol. Fish. 2021, 31, 253–288. [Google Scholar] [CrossRef]
  19. Wadiwel, D. ‘Fishing for Fun’: The Politics of Recreational Fishing. Anim. Stud. J. 2019, 8, 202–228. [Google Scholar] [CrossRef]
  20. McPhee, D.; Leadbitter, D.; Skilleter, A.G. Swallowing the bait: Is recreational fishing in Australia ecologically sustainable? Pac. Conserv. Biol. 2002, 8, 40–51. [Google Scholar] [CrossRef]
  21. Kearney, R.E. Fisheries property rights and recreational/commercial conflict: Implications of policy development in Australia and New Zealand. Mar. Policy 2001, 25, 49–59. [Google Scholar] [CrossRef]
  22. Pope, K.L.; Powel, L.A.; Harmon, B.S.; Pegg, M.A.; Chizinski, C.J. Estimating the number of recreational anglers for a given waterbody a given waterbody. Fish. Res. 2017, 191, 69–75. [Google Scholar] [CrossRef]
  23. Winstanley, R. A Wake-Up Call for Recreational Fishing in Australia. SETFIA News, 22 February 2019. Available online: https://setfia.org.au/a-wake-up-call-for-recreational-fishing-in-australia/(accessed on 7 April 2021).
  24. Bartholomew, A.; Bohnsack, J.A. A review of catch-and-release angling mortality with implications for no-take reserves. Rev. Fish Biol. Fish. 2005, 15, 129–154. [Google Scholar] [CrossRef]
  25. Conron, S.; Bridge, N.F.; Oliveiro, P.; Bruce, T.K. Angler Diary Monitoring of Recreational Fishing in Selected Victorian Waters during 2010/11. Recreational Fishing Grant Program Final Report; Department of Primary Industries: St Melbourne, Australia, 2012; 24p. [Google Scholar]
  26. Vandergoot, C.S. Estimation of Regional Mortality Rates for Lake Erie Walleye Sander vitreus Using Spatial Tag-Recovery Modeling. Ph.D. Thesis, Michigan State University, East Lansing, MI, USA, 2014. [Google Scholar]
  27. Kristensen, E.; Sand-Jensen, K.; Martinsen, K.T.; Madsen-Østerbye, M.; Kragh, T. Fingerprinting pike: The use of image recognition to identify individual pikes. Fish. Res. 2020, 229, 105622. [Google Scholar] [CrossRef]
  28. Cline, T.J.; Weidel, B.C.; Kitchell, J.F.; Hodgson, J.R. Growth response of largemouth bass (Micropterus salmoides) to catch-and-release angling: A 27-year mark-recapture study. Can. J. Fish. Aquat. Sci. 2018, 69, 224–230. [Google Scholar] [CrossRef]
  29. Bennett, B.A. Long-term trends in the catches by shore anglers in False Bay. Trans. R. Soc. S. Afr. 1991, 47, 683–692. [Google Scholar]
  30. Olson, D.E.; Cunningham, P.K. Sport-fishing trends shown by an annual Minnesota fishing contest over a 58-year period. N. Am. J. Fish. Manag. 1989, 9, 287–297. [Google Scholar] [CrossRef]
  31. Beard, T.D., Jr.; Essington, T.E. Effects of angling and life history processes on bluegill size structure: Insights from an individual-based model. Trans. Am. Fish. Soci. 2000, 129, 561–568. [Google Scholar] [CrossRef]
  32. Post, J.R.; Sullivan, M.; Cox, S.; Lester, N.P.; Walters, C.J.; Parkinson, E.A.; Paul, A.J.; Jackson, L.; Shuter, B.J. Canada’s recreational fisheries: The invisible collapse? Fisheries 2002, 27, 6–17. [Google Scholar] [CrossRef]
  33. Embke, H.S.; Rypel, A.L.; Carpenter, S.R.; Sass, G.G.; Ogle, D.; Cichosz, T.; Hennessy, J.; Essington, T.E.; Vander Zanden, M.J. Production dynamics reveal hidden overharvest of inland recreational fisheries. Proc. Natl. Acad. Sci. USA 2019, 116, 24676–24681. [Google Scholar] [CrossRef] [PubMed]
  34. Cooke, S.J.; Cowx, I.G. The Role of Recreational Fishing in Global Fish Crises. Bioscience 2004, 54, 857–859. [Google Scholar] [CrossRef]
  35. Morales-Nin, B.; Moranta, J.; García, C.; Tugores, M.P.; Grau, A.M.; Riera, F.; Cerdà, M. The recreational fishery off Majorca Island (western Mediterranean): Some implications for coastal resource management. ICES J. Mar. Sci. 2005, 62, 727–739. [Google Scholar] [CrossRef]
  36. West, R.J.; Gordon, G.N.G. Commercial and recreational harvest of fish from two Australian coastal rivers. Aust. J. Mar. Freshw. Res. 1994, 45, 1259–1279. [Google Scholar] [CrossRef]
  37. Ložys, L.; Stanevičius, V.; Pūtys, Ž.; Dainys, J.; Levickienė, D.; Jakimavičius, D.; Akstinas, V.; Adžgauskas, G.; Tomkevičienė, A.; Irbinskas, V. Assessment of the Impact of Water Level Fluctuations on Fish and Waterbird Populations in Kaunas Reservoir (In Lithuanian); Nature research centre: Vilnius, Lithuania, 2020; 98p. [Google Scholar]
  38. Giner, G.; Smyth, G.K. statmod: Probability calculations for the inverse Gaussian distribution. R J. 2016, 8, 339–351. [Google Scholar] [CrossRef]
  39. Shono, H. Confidence interval estimation of CPUE year trend in delta-type two-step model. Fish. Sci. 2008, 74, 712–717. [Google Scholar] [CrossRef]
  40. Dunn, P.K. Tweedie: Evaluation of Tweedie Exponential Family Models; R Package Version 2.3.3; 2017. [Google Scholar]
  41. Akaike, H. A New Look at the Statistical Model Identification. IEEE Trans. Autom. Control 1974, 19, 716–723. [Google Scholar] [CrossRef]
  42. Burnham, K.P. Model Selection and Multimodel Inference: A Practical Information-Theoretic Approach, 2nd ed.; Springer: New York, NY, USA, 2002; ISBN 0-387-95364-7. [Google Scholar]
  43. Forrestal, F.; Goodyear, C.; Schirripa, M. Applications of the longline simulator (LLSIM) using US pelagic longline logbook data and Atlantic blue marlin. Fish. Res. 2019, 211, 331–337. [Google Scholar] [CrossRef]
  44. Malvestuto, S.P. Sampling the recreational creel. In Fisheries Techniques, 2nd ed.; Murphy, B.R., Willis, D.W., Eds.; American Fisheries Society: Bethesda, MD, USA, 1996; pp. 591–623. [Google Scholar]
  45. Kaemingk, M.; Chizinski, C.J.; Hurley, K.L.; Pope, K.L. Synchrony—An emergent property of recreational fisheries. J. Appl. Ecol. 2018, 55, 2986–2996. [Google Scholar] [CrossRef]
  46. VanDeValk, A.J.; Jackson, J.R.; Krueger, S.D.; Brooking, T.E.; Rudstam, L.G. Influence of party size and trip length on angler catch rates on Oneida Lake, New York. N. Am. J. Fish. Manag. 2007, 27, 127–136. [Google Scholar] [CrossRef]
  47. Dainys, J.; Gorfine, H.; Mateos-González, F.; Skov, C.; Urbonavičius, R.; Audzijonyte, A. Angling counts: Harnessing the power of technological advances for recreational fishing surveys. Fish. Res. 2022, 254, 106410. [Google Scholar] [CrossRef]
  48. FAO. The role of Recreational Fisheries in the sustainable management of marine resources. In GLOBEFISH Highlights—Issue 2/2017; FAO: Rome, Italy, 2017; pp. 65–68. [Google Scholar]
  49. Melville-Smith, R.; Thomson, A.W.; Caputi, N. Improved forecasts of recreational western rock lobster (Panulirus cygnus) catches in Western Australia, by predicting licence usage. Fish. Res. 2004, 68, 203–208. [Google Scholar] [CrossRef]
  50. Muoneke, M.I.; Childress, W.M. Hooking mortality: A review for recreational fisheries. Rev. Fish. Sci. 1994, 2, 123–156. [Google Scholar] [CrossRef]
  51. Sass, G.G.; Shaw, S.L. Catch-and-Release Influences on Inland Recreational Fisheries. Rev. Fish. Sci. Aquac. 2020, 28, 211–227. [Google Scholar] [CrossRef]
  52. Cowx, I.G. Characterisation of inland fisheries in Europe. Fish. Manag. Ecol. 2015, 22, 78–87. [Google Scholar] [CrossRef]
  53. Zhang, H.; Wu, J.; Gorfine, H.; Shan, X.; Shen, L.; Yang, H.; Du, H.; Li, J.; Wang, C.; Zhou, Q.; et al. Inland fisheries development versus aquatic biodiversity conservation in China and its global implications. Rev. Fish Biol. Fish. 2020, 30, 637–655. [Google Scholar] [CrossRef]
  54. Cooke, S.J.; Cowx, I.G. Contrasting Recreational and Commercial Fishing: Searching for Common Issues to Promote Unified Conservation of Fisheries Resources and Aquatic Environments. Biol. Conserv. 2006, 128, 93–108. [Google Scholar] [CrossRef]
  55. Zeller, D.; Darcy, M.; Booth, S.; Lowe, M.K.; Martell, S. What about recreational catch?: Potential impact on stock assessment for Hawaii’s bottomfish fisheries? Fish. Res. 2008, 91, 88–97. [Google Scholar] [CrossRef]
  56. Beard, T.D., Jr.; Kampa, J.M. Changes in bluegill, black crappie, and yellow perch populations in Wisconsin during 1967–1991. N. Am. J. Fish. Manag. 1999, 19, 1037–1043. [Google Scholar] [CrossRef]
  57. Lewin, W.C.; Arlinghaus, R.; Mehner, T. Documented and Potential Biological Impacts of Recreational Fishing: Insights for Management and Conservation. Rev. Fish. Sci. 2006, 14, 305–367. [Google Scholar] [CrossRef]
  58. Yount, J.D. Ecology and Management of the Zebra Mussel and Other Introduced Aquatic Nuisance Species; Saginaw Valley State University: Saginaw, MI, USA, 1991. [Google Scholar]
  59. Carpenter, S.R.; Kitchell, J.F.; Hodgson, J.R. Cascading Trophic Interactions and Lake Productivity: Fish predation and herbivory can regulate lake ecosystems. BioScience 1985, 35, 634–639. [Google Scholar] [CrossRef]
  60. Vejřík, L.; Matějíčková, I.; Seďa, J.; Blabolil, P.; Jůza, T.; Vašek, M.; Ricard, D.; Matěna, J.; Frouzová, J.; Kubečk, J.; et al. Who Is Who: An Anomalous Predator-Prey Role Exchange between Cyprinids and Perch. PLoS ONE 2016, 11, e0156430. [Google Scholar] [CrossRef]
  61. Persson, L. Effects of habitat and season on competitive interactions between roach (Rutilus rutilus) and perch (Perca fluviatilis). Oecologia 1987, 73, 170–177. [Google Scholar] [CrossRef]
  62. Midway, S.R.; Lynch, A.J.; Peoples, B.K.; Dance, M.; Caffey, R. COVID-19 influences on US recreational angler behavior. PLoS ONE 2021, 16, e0254652. [Google Scholar] [CrossRef]
  63. Barnes, M. A Comparison of A Creel Census to Modeled Access-Point Creel Surveys on Two Small Lakes Managed as Put-and-Take Rainbow Trout Fisheries. Fish. Aquac. J. 2014. [Google Scholar] [CrossRef]
  64. Jones, C.M.; Robson, D.S.; Lakkis, H.D.; Kressel, J. Properties of catch rates in analysis of angler surveys. Trans. Am. Fish. Soc. 1995, 124, 911–928. [Google Scholar] [CrossRef]
  65. Lockwood, R.N.; Benjamin, D.M.; Bence, J.R. Estimating Angling Effort and Catch from Michigan Roving and Access Site Angler Survey Data; Fisheries Research Report 2044; Michigan Department of Natural Resources: Lansing, MI, USA, 1999. [Google Scholar]
  66. Mallison, C.T.; Cichra, C.E. Accuracy of angler-reported harvest in roving creel surveys. N. Am. J. Fish. Manag. 2004, 24, 880–889. [Google Scholar] [CrossRef]
  67. Venohr, M.; Langhans, S.D.; Peters, O.; Hölker, F.; Arlinghaus, R.; Mitchell, L.; Wolter, C. The underestimated dynamics and impacts of water-based recreational activities on freshwater ecosystems. Environ. Rev. 2018, 26, 199–213. [Google Scholar] [CrossRef]
  68. Ahrens, R.N.; Allen, M.S.; Walters, C.; Arlinghaus, R. Saving large fish through harvest slots outperforms the classical minimum-length limit when the aim is to achieve multiple harvest and catch-related fisheries objectives. Fish Fish. 2020, 2, 483–510. [Google Scholar] [CrossRef]
  69. Stoll-Kleemann, S.; de la Vega-Leinert, A.; Schultz, L. The role of community participation in the effectiveness of UNESCO Biosphere Reserve management: Evidence and reflections from two parallel global surveys. Environ. Conserv. 2010, 37, 227–238. [Google Scholar] [CrossRef]
  70. Abell, R.; Allan, J.D.; Lehner, B. Unlocking the potential of protected areas for freshwaters. Biol. Conserv. 2007, 134, 48–63. [Google Scholar] [CrossRef]
  71. Manning, R.E. Studies in Outdoor Recreation: Search and Research for Satisfaction; Oregon State University Press: Corvallis, OR, USA, 2010. [Google Scholar]
  72. Cooke, S.; Schreer, J.; Wahl, D.; Philipp, D. Physiological impacts of catch-and-release angling practices on largemouth and smallmouth bass. Am. Fish. Soc. Symp. 2002, 31, 489–512. [Google Scholar]
Figure 1. Map of Kaunas Reservoir with gray dotted lines showing locations of angler surveys during the open-water fishing season and gray areas—surveys during the ice-fishing season. Black dots represent locations of scientific surveys.
Fishes 07 00232 g001
Figure 2. Scaled scientific catch-per-unit-effort (CPUE, model standardized annual deviations based on biomass) and commercial and recreational catches (tons) for the five main fish species in Kaunas Reservoir. Scientific CPUE show standardized annual values and confidence ranges. Recreational catches were estimated for the last 5 years, and show mean estimates and uncertainty ranges. For years since 2016, we provide just an indicative trendline, assuming that recreational effort and, therefore, catches were about half as intense in 1990 and have been steadily growing since then. Note that the y-axis shows relative values, where scientific CPUE was scaled separately, but commercial and recreational catches were scaled together, so they can be compared. The uncertainty ranges for scientific CPUE are symmetrical (up and down), but only upper ranges are plotted because lower ranges are bound by zero (original analysis is performed in a log-transformed space). Absolute commercial fishing values are shown in Figure S1, and estimates for recreational fishing are shown in Table 1.
Fishes 07 00232 g002
Table 1. Estimated annual recreational catches (average over 2016–2021), in tons per year, for the main fish species in Kaunas Reservoir, assuming that fishing effort remained approximately similar.
SpeciesMeanMinMax
Prussian carp43.6319.62101.44
Bream31.9811.9489.52
Pikeperch *19.367.2954.79
Common carp17.245.5372.06
Catfish11.494.1233.37
Eurasian perch9.093.6127.9
Silver bream4.141.5514.32
Roach3.381.328.45
Vimba1.290.3613.45
Asp1.070.324.08
Northern pike *1.070.226.06
Total catch142.9170.08304.65
The min and max values refer to the uncertainty ranges from the combined annual angler effort and predicted average yearly recreational CPUE catch (see Methods). For species marked with *, the total catches were estimated, excluding seasons for which an infinite recreational catch was predicted. For recreational catches and their uncertainty of less common species, see Table S6.
Table 2. Estimated average recreational catch-per-unit-effort (grams per fishing trip) during the study period (2016–2021) and their uncertainty for selected species and season combinations, using data from total number of angling trips and models that included only a random intercept and season (for roach, season was non-significant and therefore not included).
ParameterMean Catch2.5% CI97.5% CIp
Total catch
Autumn991.32752.251306.370.00
Spring1396.70985.081980.310.13
Summer1975.641551.602515.580.00
Winter299.76211.98423.890.00
Roach Rutillus rutillus
Total average (intercept)31.1318.2249.750.00
Pikeperch Sander lucioperca
Autumn20.485.3977.730.00
Spring238.11123.95457.430.00
Summer302.84188.53486.460.00
Winter0.470.0099.850.18
Eurasian perch Perca fluviatilis
Autumn140.8788.28224.800.00
Spring24.905.53112.120.00
Summer75.3735.98157.870.00
Winter170.61124.60233.610.5
Bream Abramis brama
Autumn322.90207.51502.450.00
Spring430.57242.66763.980.44
Summer230.56124.73426.200.38
Winter50.2223.75106.180.00
Silver bream Blica bjoerkna
Autumn41.3722.4376.310.00
Spring3.770.2753.670.08
Summer98.9360.37162.100.03
Winter3.170.7613.200.00
Prussian carp Carassius gibelio
Autumn110.6162.77194.900.00
Spring643.87440.97940.130.00
Summer500.49355.19705.240.00
Winter0.000.00Inf0.98
Common carp Cyprinus carpio
Autumn220.78112.12434.750.00
Spring28.302.27352.140.12
Summer370.37195.08703.160.28
Winter0.000.00Inf0.99
Catfish Silurus glanis
Autumn0.000.00Inf0.99
Spring0.000.00Inf1.00
Summer370.37201.49680.790.99
Winter0.000.00Inf1.00
The p-value refers to the variables that were significantly different from zero as identified through t-statistics in general linear model analysis.
Publisher’s Note: MDPI stays neutral with regard to jurisdictional claims in published maps and institutional affiliations.

