Communication

Prokaryotic and Eukaryotic Microbial Community in Kumamoto Oyster (Crassostrea sikamea) Larvae: Response to Antibiotics in Trace Concentration

1
Ninghai Institute of Mariculture Breeding and Seed Industry, Zhejiang Wanli University, Ningbo 315604, China
2
Zhejiang Key Laboratory of Aquatic Germplasm Resource, College of Biological and Environmental Sciences, Zhejiang Wanli University, Ningbo 315100, China
*
Author to whom correspondence should be addressed.
Fishes 2022, 7(5), 272; https://doi.org/10.3390/fishes7050272
Submission received: 6 September 2022 / Revised: 27 September 2022 / Accepted: 30 September 2022 / Published: 4 October 2022
(This article belongs to the Section Biology and Ecology)

Abstract

:
Antibiotic treatment is regarded as an emergency measure to avoid disease occurrence of aquatic animals during metamorphosis in an aquaculture system, which is very common in hatcheries of bivalve mollusc larvae. However, it is still unclear how and to what extent the antibiotic addition affects the prokaryotic and eukaryotic microbial communities of marine bivalve larvae. We profiled the community compositions and dominant taxonomies of prokaryotic and eukaryotic microbiota of Kumamoto oyster (Crassostrea sikamea) larvae exposed to seawater with antibiotics in trace concentration. A total of 500,664 16S rRNA and 501,933 18S rRNA gene fragments were selected for classification, resulting in 714 prokaryotic Operational Taxonomic Units (OTUs) and 47 eukaryotic OTUs. Antibiotic exposure altered the structure of larval microbiome and increased the prokaryotic but decreased the eukaryotic microbial diversity. Larval microbiota was sensitive to antibiotics, as evidenced by alternation of the dominant bacterial phyla Proteobacteria, Bacteroidetes, Firmicutes, Chlamydiae, and Actinobacteria, and eukaryotic phyla Streptophyta, Cercozoa, Chlorophyta and Haptophyta. Similarly, a significant effect was observed at the family and genus level, especially the increased bacterial Devosiaceae, Microbacteriaceae, Halieaceae, Vibrionaceae families, and Devosia, Stappia and Vibrio genera, and eukaryotic Isochrysidaceae and TAGIRI1-linage family and Tisochrysis genus. These results indicate that antibiotic treatment may induce a shift in the larval microbiome, which may cause an unstable community structure and in turn affect the oyster health.

1. Introduction

The Kumamoto oyster (Crassostrea sikamea) is an ecologically important marine bivalve, which is distributed along the coast of China, especially Zhejiang province. However, diseases that are caused by bacterial pathogens have led to huge losses in aquaculture industry of important shellfish [1]. Larval oysters, especially during their metamorphosis development, are susceptible to disease, often by etiological agents from the Vibrio genus [2,3]. A practical approach for disease prevention in aquaculture involves the use of antibiotics, which is very common in the larval hatchery of bivalve mollusks [4]. Under this premise, antibiotics at low concentrations are often added in hatching tanks to prevent pathogenic infections and improve the survival of larval bivalves. Studies on vertebrates and humans have suggested that antibiotic treatment greatly disturbs the native intestinal microbiota, thereby facilitating pathogenic proliferation [5,6,7]. Contradictory to these findings, studies on Atlantic halibut have suggested that antibiotic addition insignificantly affects the larval survival and gut microbiota [6]. However, to date, it has never been investigated whether antibiotic exposure affects the larval microbial assemblages of Kumamoto oyster during metamorphosis.
There is growing evidence of the importance of commensal microorganisms in the health and development of marine bivalve larvae [8,9]. Microorganisms, including prokaryotes and eukaryotes, are known to be an important factor for the fitness of aquatic animals [10,11]. Thus, shifts in the structure of commensal microbial community have a detrimental impact on host health [12]. Currently, available studies are primarily focused on the bacterial effect on oyster larvae [8,13,14], by comparison, the role of eukaryotes has gained little attention. Eukaryotes are a major component of commensal microbiota due to their large body size in relation to bacteria, and they can exploit diverse predatory life strategies [15,16]. Additionally, eukaryotic microbial assemblages are less resilient to environmental selection [16]. In these regards, eukaryotic microbes could exert a disproportionate role in host, as evidenced by study showing that gut eukaryotic microbiota significantly influence shrimp growth performance [17]. Recently, a comprehensive analysis through next-generation sequencing technology has revealed some characteristics of microbiome in aquatic animals in response to environmental disturbance [6]. It is reported that a reduction of gut microbial diversity occurs within a few days from antibiotics treatment, and it is rare to achieve the complete recovery of initial microbial community compositions [18,19]. Indeed, studies on humans have reported that antibiotics overuse has permanently altered gut microbiome, resulting in an increase in obesity, diabetes, and so on [18,20]. Notably, key microbes colonized in oyster larvae are of importance for stabilizing host homeostasis and promoting larval organ development [8,21]. Given these reports, the extent of antibiotic-induced disturbance in the larval microbiome of Kumamoto oyster remains poorly characterized, particularly at the community level.
The present study aims to explore the relationship between antibiotic exposure and oyster larval microbiome. We hypothesized that antibiotic exposure could induce the changes in larval microbial community structure. To test this idea, here, we evaluated the effects of penicillin exposure on the structures and compositions of prokaryotic and eukaryotic microbiota in Kumamoto oyster larvae by using high-throughput analysis of both 16S and 18S rRNA genes. Our findings deepen our understanding of the effect of antibiotic addition into the rearing system of oyster aquaculture during larval hatching.

2. Materials and Methods

2.1. Sample Collection

In this study, the investigated Kumamoto oyster (C. sikamea) larval nursery tanks were located at Marine Fishery Technology Innovation Research Base of Ningbo, Zhejiang Province, China. The indoor standard hatching tanks (8 m × 4 m × 1.3 m) were maintained by uniform management including the input of sand-filtered natural seawater without any further treatment. The rearing water was constantly micro-aerated and maintained at daily water exchange of 50%, dissolved oxygen at 7–8 mg/L, temperature of 27 ± 3 °C and salinity of 25 ± 5‰ throughout larval nursery. These water parameters were measured in situ with a YSI 6000 multiparameter probe (YSI Inc., Yellow Springs, OH, USA). It has been proposed that larva is easily prone to pathogenic invasion during metamorphosis development [3]. To prevent the occurrence of microbial diseases when larvae molted to the D-stage at 20 h of larval development, which was confirmed by microscopy according to the morphological characteristics described by Wallace et al. [22], the antibiotic penicillin with concentration of about 0.041~0.063 mg/L was added into hatching tanks. To assess to what extent the larval physiologies were affected by short-term antibiotic exposure, the hatching tank with antibiotic addition was monitored as a treatment group, whereas the adjacent one hatching tank without antibiotic addition was selected as a control group. Larval samples after exposure to antibiotics for 8 days were collected from both the groups. About 500 mg larvae from each tank were collected to compose one biological sample. To improve statistical power, 3 pseudo-biological replicates of larval samples from each tank were employed. As a result, there were 6 larval samples from each tank from each group for microbiome analysis.

2.2. DNA Extraction

The larval samples were soaked and washed for 10–15 s with sterilized water to remove the adsorbed rearing water, and finally transferred into sterilized and enzyme-free centrifuge tubes, followed by centrifugation at 700 rpm for 1 min at 4 °C to remove the wash water and consequently, to pellet the larvae precipitates. The larval samples were immediately snap-frozen in liquid nitrogen and then stored at −80 °C before DNA extraction.
Genomic DNA (gDNA) of larval samples was extracted with FAST DNA Spin kit (MO BIO Laboratories, CA, USA) according to the manufacturer’s instructions. The concentration and purity of gDNA extracts were measured using a NanoDrop ND-2000 spectrophotometer (NanoDrop Technologies, Wilmington, OH, USA).

2.3. 16S rRNA and 18S rRNA Gene Library Construction and Sequencing

Purified total DNA was used to amplify the partial sequence of 16S rRNA gene and 18S rRNA gene. The primer pair 338F (5’-ACTCCTACGGGAGGCAGCA-3’) and 806R (5’-GGACTACHVGGGTWTCTAAT-3’) corresponding to the V3-V4 hypervariable regions of the bacterial 16S rRNA genes and 528F (GCGGTAATTCCAGCTCCAA) and 706R (AATCCRAGAATTTCACCTCT) corresponding to the V4 hypervariable region of the eukaryotic 18S rRNA genes with Illumina adapters and dual larval barcodes were applied. The PCR reaction procedure was performed according to the description of Dai et al. [11]. The PCR amplicons were validated using electrophoresis in a 1.5% agarose gel at 100 V for 30 min. To minimize PCR induced biases, triplicates amplicons for each sample were pooled and then purified using a PCR fragment purification kit (TaKaRa, Kyoto, Japan). The amplicon products were sequenced using an Illumina MiSeq platform.
Sequence data in FASTQ format were analyzed with an integrated pipeline of Dix-seq, and barcode and low-quality sequences were filtered using Trimmomatic [23]. After filtering, the chimeric reads were removed using atlas-utilis. The sequences were classified using the SILVA 132 database. Based on the OTU clustering results, the α-diversity parameters of the samples were generated using the Usearch alpha_div tool [23]. Furthermore, the β-diversity distance and differences between the samples were estimated with the Usearch beta_div tool [23].

2.4. Statistical Analysis

Alpha diversities (including Shannon diversity, Chao 1, observed species and Simpson index) between control and treatment groups were compared using an unpaired t-test in SPSS 13.0 software. Shared and unique taxa between control and treatment groups were analyzed and displayed in a Venn diagram. Principal coordinate analysis (PCoA) was performed to assess the differences in larval bacterial communities between control and treatment groups based on Bray–Curtis distances, and graphed with Origin v8.0 software (OriginLab, Northampton, MA, USA). Statistical analysis of metagenomic profiles (STAMP) v2.0 software (Queensland, Australia) was performed to identify taxa (at family and genus level) that showed significant differences (Welch’s t-test, p < 0.05) in their relative abundances between control and treatment groups based on the Tukey–Kramer post hoc test [24].

3. Results

3.1. Sequencing Data Characteristics and Diversity

A total of 500,664 16S rRNA and 501,933 18S rRNA gene reads were selected for classification. An average of 83,534 and 83,354 high-quality reads for the control samples and treatment samples were obtained, resulting in 558 and 655 bacterial OTUs, respectively (Table 1). While an average of 83,738 and 83,573 high-quality reads for the control samples and treatment samples were generated, resulting in 41 and 35 eukaryotic OTUs, respectively (Table 1). There were 499 bacterial OTUs (accounting for 69.9% of total OTUs) and 29 eukaryotic OTUs (accounting for 61.7% of total OTUs) shared between treatment and control samples (Figure 1). In addition, 156 bacterial and 6 eukaryotic OTUs were exclusively detected in treatment samples (Figure 1). The diversity of prokaryotic microbiota at each taxonomical level was higher in treatment group than that in the control group (Table 1). However, an opposite pattern was found in the eukaryotic microbial diversity (Table 1). These findings were demonstrated by α-diversity indices. For instance, the Shannon diversity and Chao 1 of prokaryotic microbial community in treatment group were significantly (p < 0.05 in both cases) higher than those in the control group (Table 2). Similar to what was observed for prokaryotes, the Shannon diversity of eukaryotic microbial community was higher in the treatment group compared with that in the control group (Table 2).

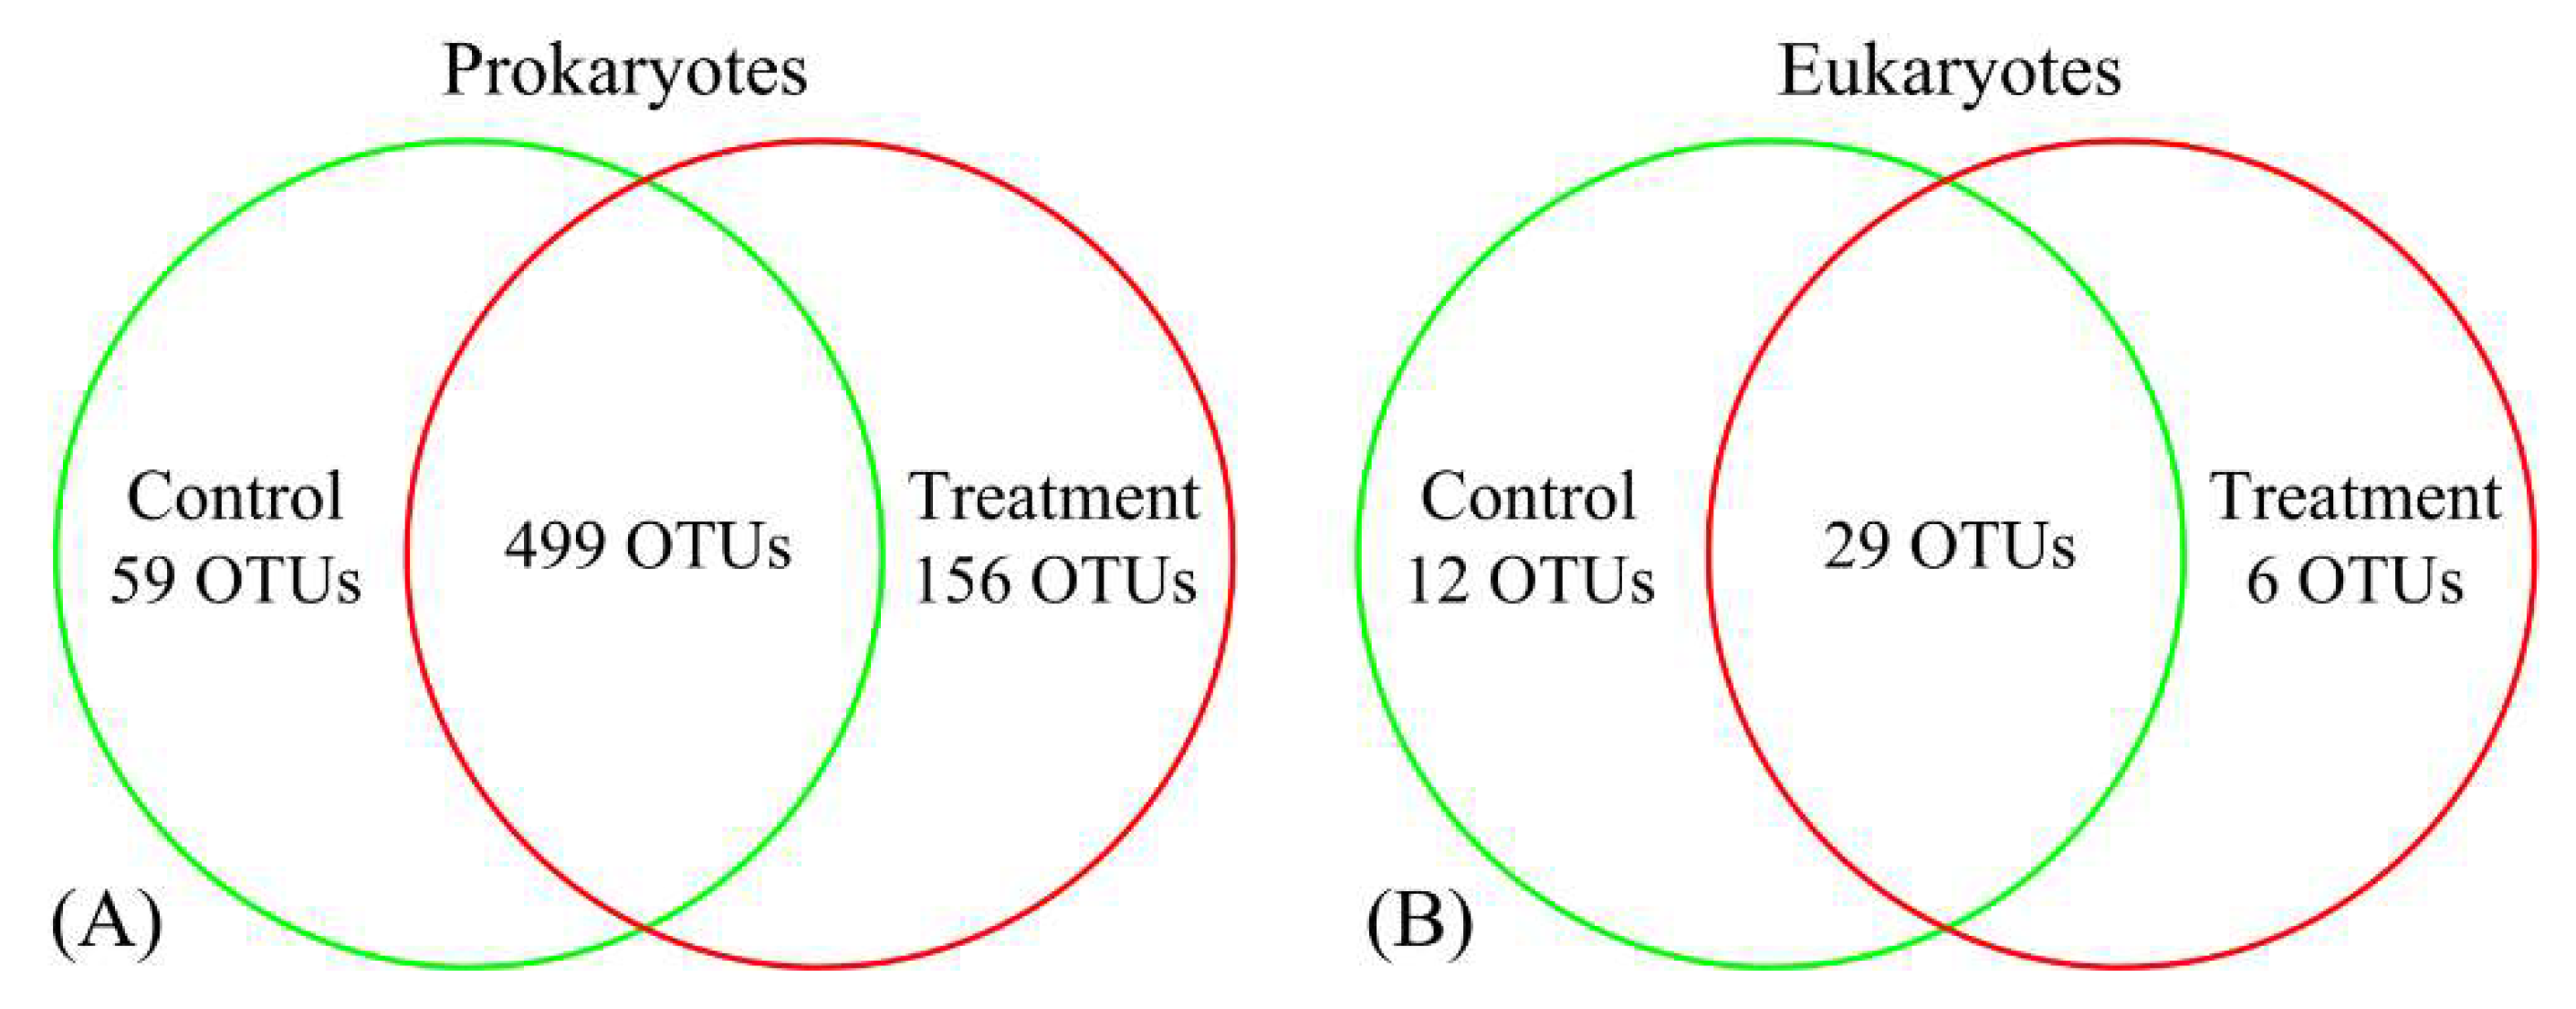
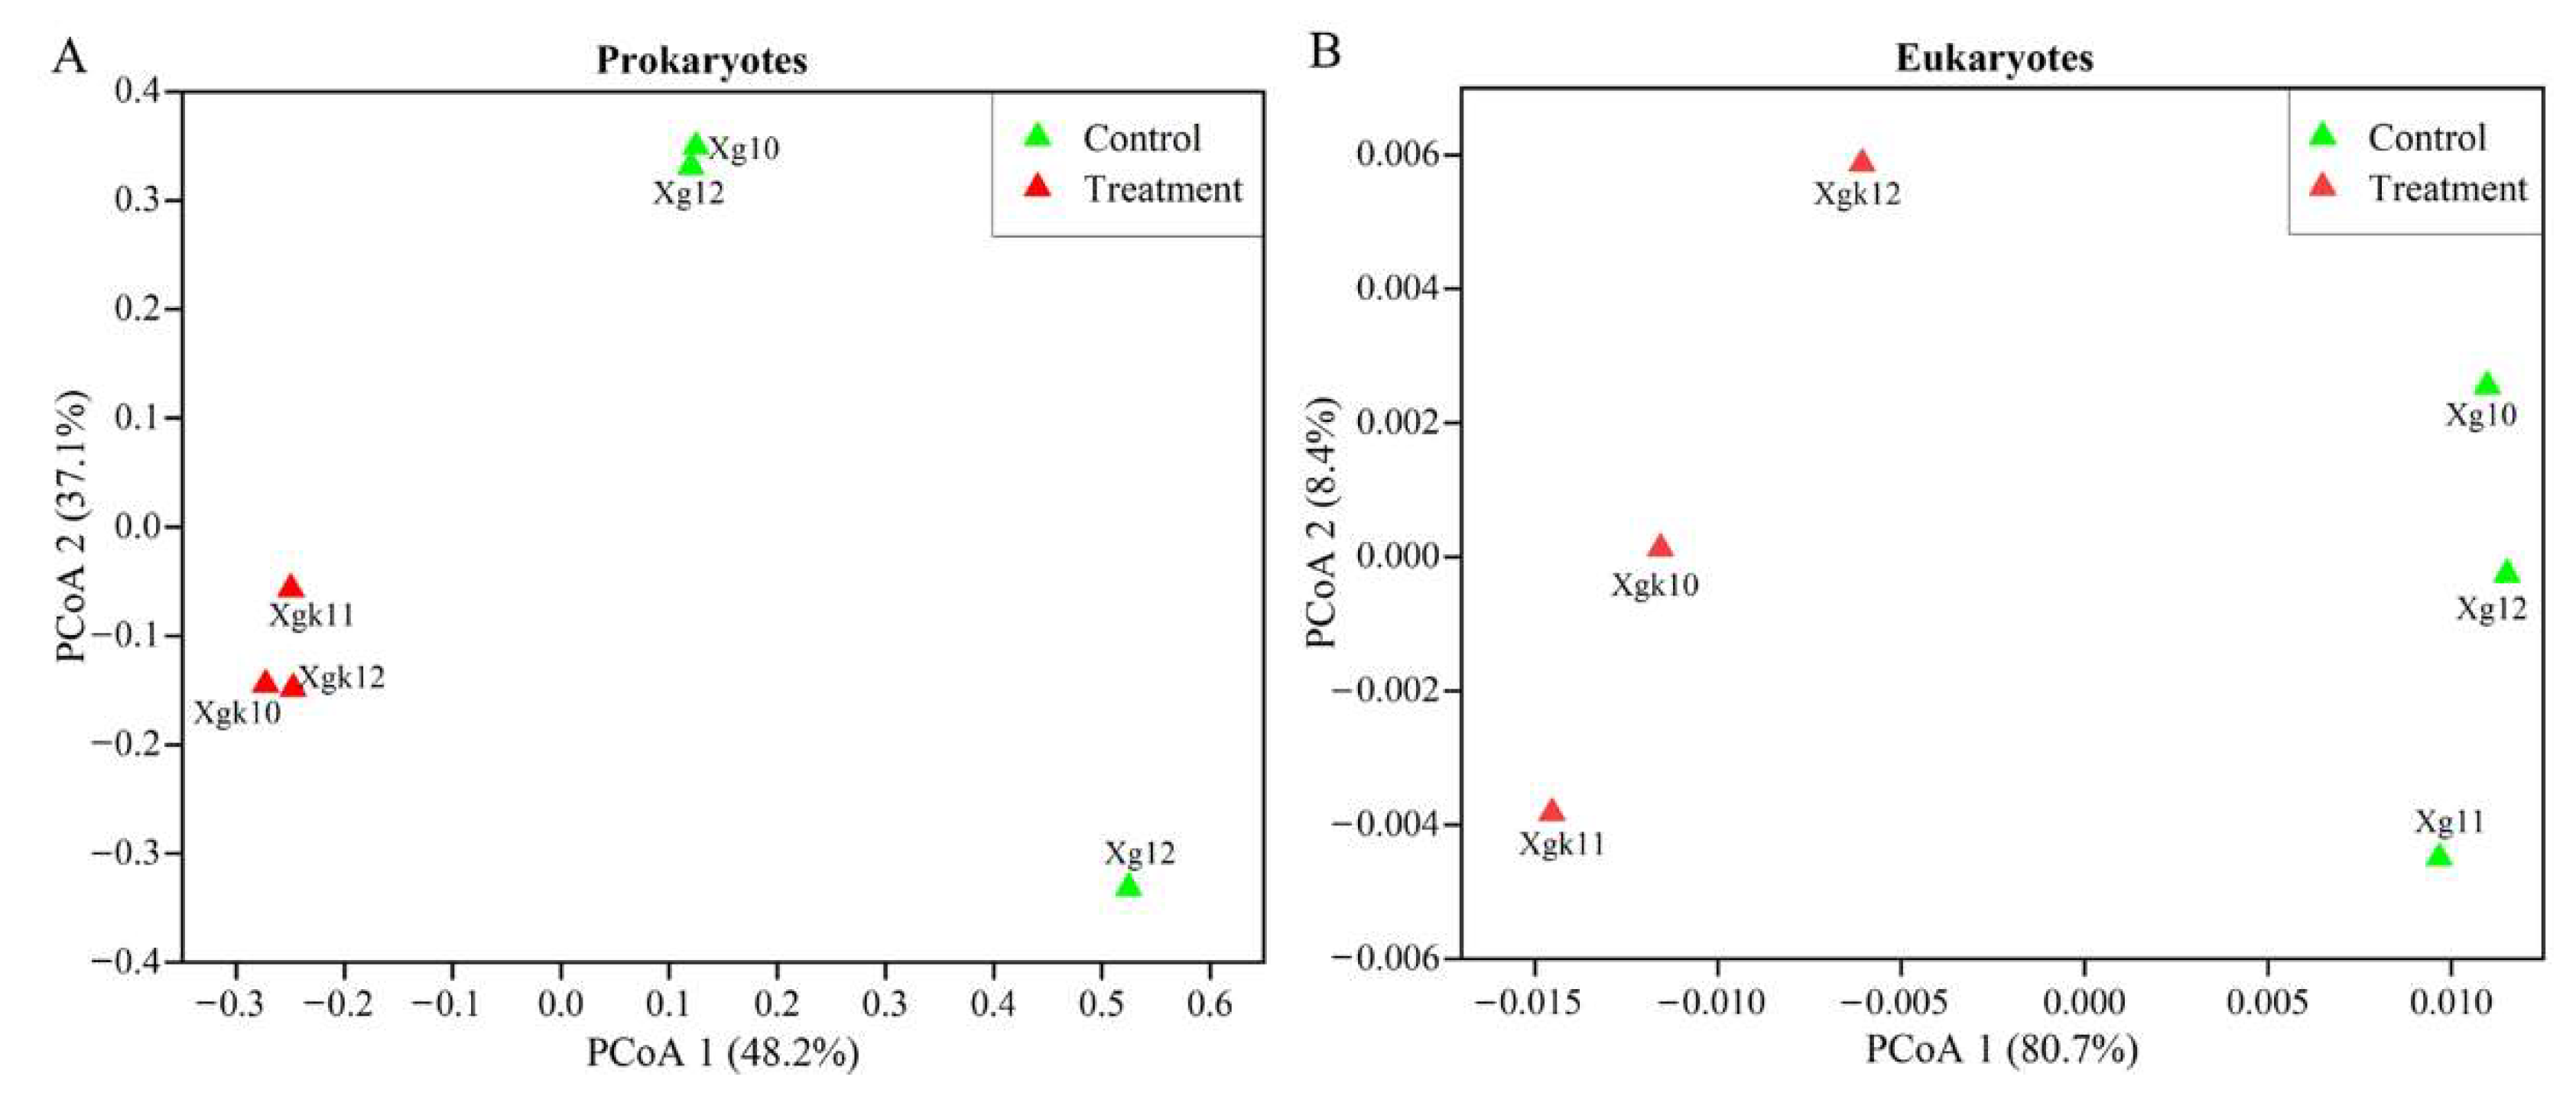
3.2. Variations in Prokaryotic and Eukaryotic Microbial Communities in Response to Antibiotics

PCoA analysis was used to compare the larval microbial communities between treatment and control groups at the OTU level. As shown in Figure 2, generally, samples of the same group were clustered together, suggesting that the bacterial and eukaryotic microbial communities of the treatment group were clearly distinct from those of the control group.

3.3. Variations in Prokaryotic and Eukaryotic Microbial Compositions at Phylum Level

All of the 16S rRNA sequences were affiliated with at least 15 bacterial phyla (Table 3). For most of total sequences, prokaryotic taxonomical profiles at the phylum level were dominated by Proteobacteria, followed by Bacteroidetes, Firmicutes, Chlamydiae, Actinobacteria, Candidatus Saccharibacteria and Parcubacteria. These phyla accounted for at least 97.2% of all sequences. Notably, the relative abundances of these dominant phyla showed different degrees of variance between treatment and control groups. For example, significant differences were observed in Chlamydiae and Actinobacteria (p = 0.01 in both cases) with greater abundance in the treatment group compared to the control group. However, the relative abundances of Proteobacteria and Parcubacteria increased in the treatment group compared to the control group, although statistical significance was not reached.
All of the 18S rRNA sequences were affiliated with at least nine eukaryotic phyla (Table 3). The two major eukaryotic phyla associated with larval microbiota were Metazoa and Streptophyta. Among them, Metazoa (99.4% of total sequences) dominated in all larval microbiota. Notably, the relative abundances of eukaryotic microbial phyla markedly changed between treatment and control groups. In particular, the relative abundances of Cercozoa, Chlorophyta and Haptophyta in treatment group were significantly higher (p < 0.05) than those in the control group.

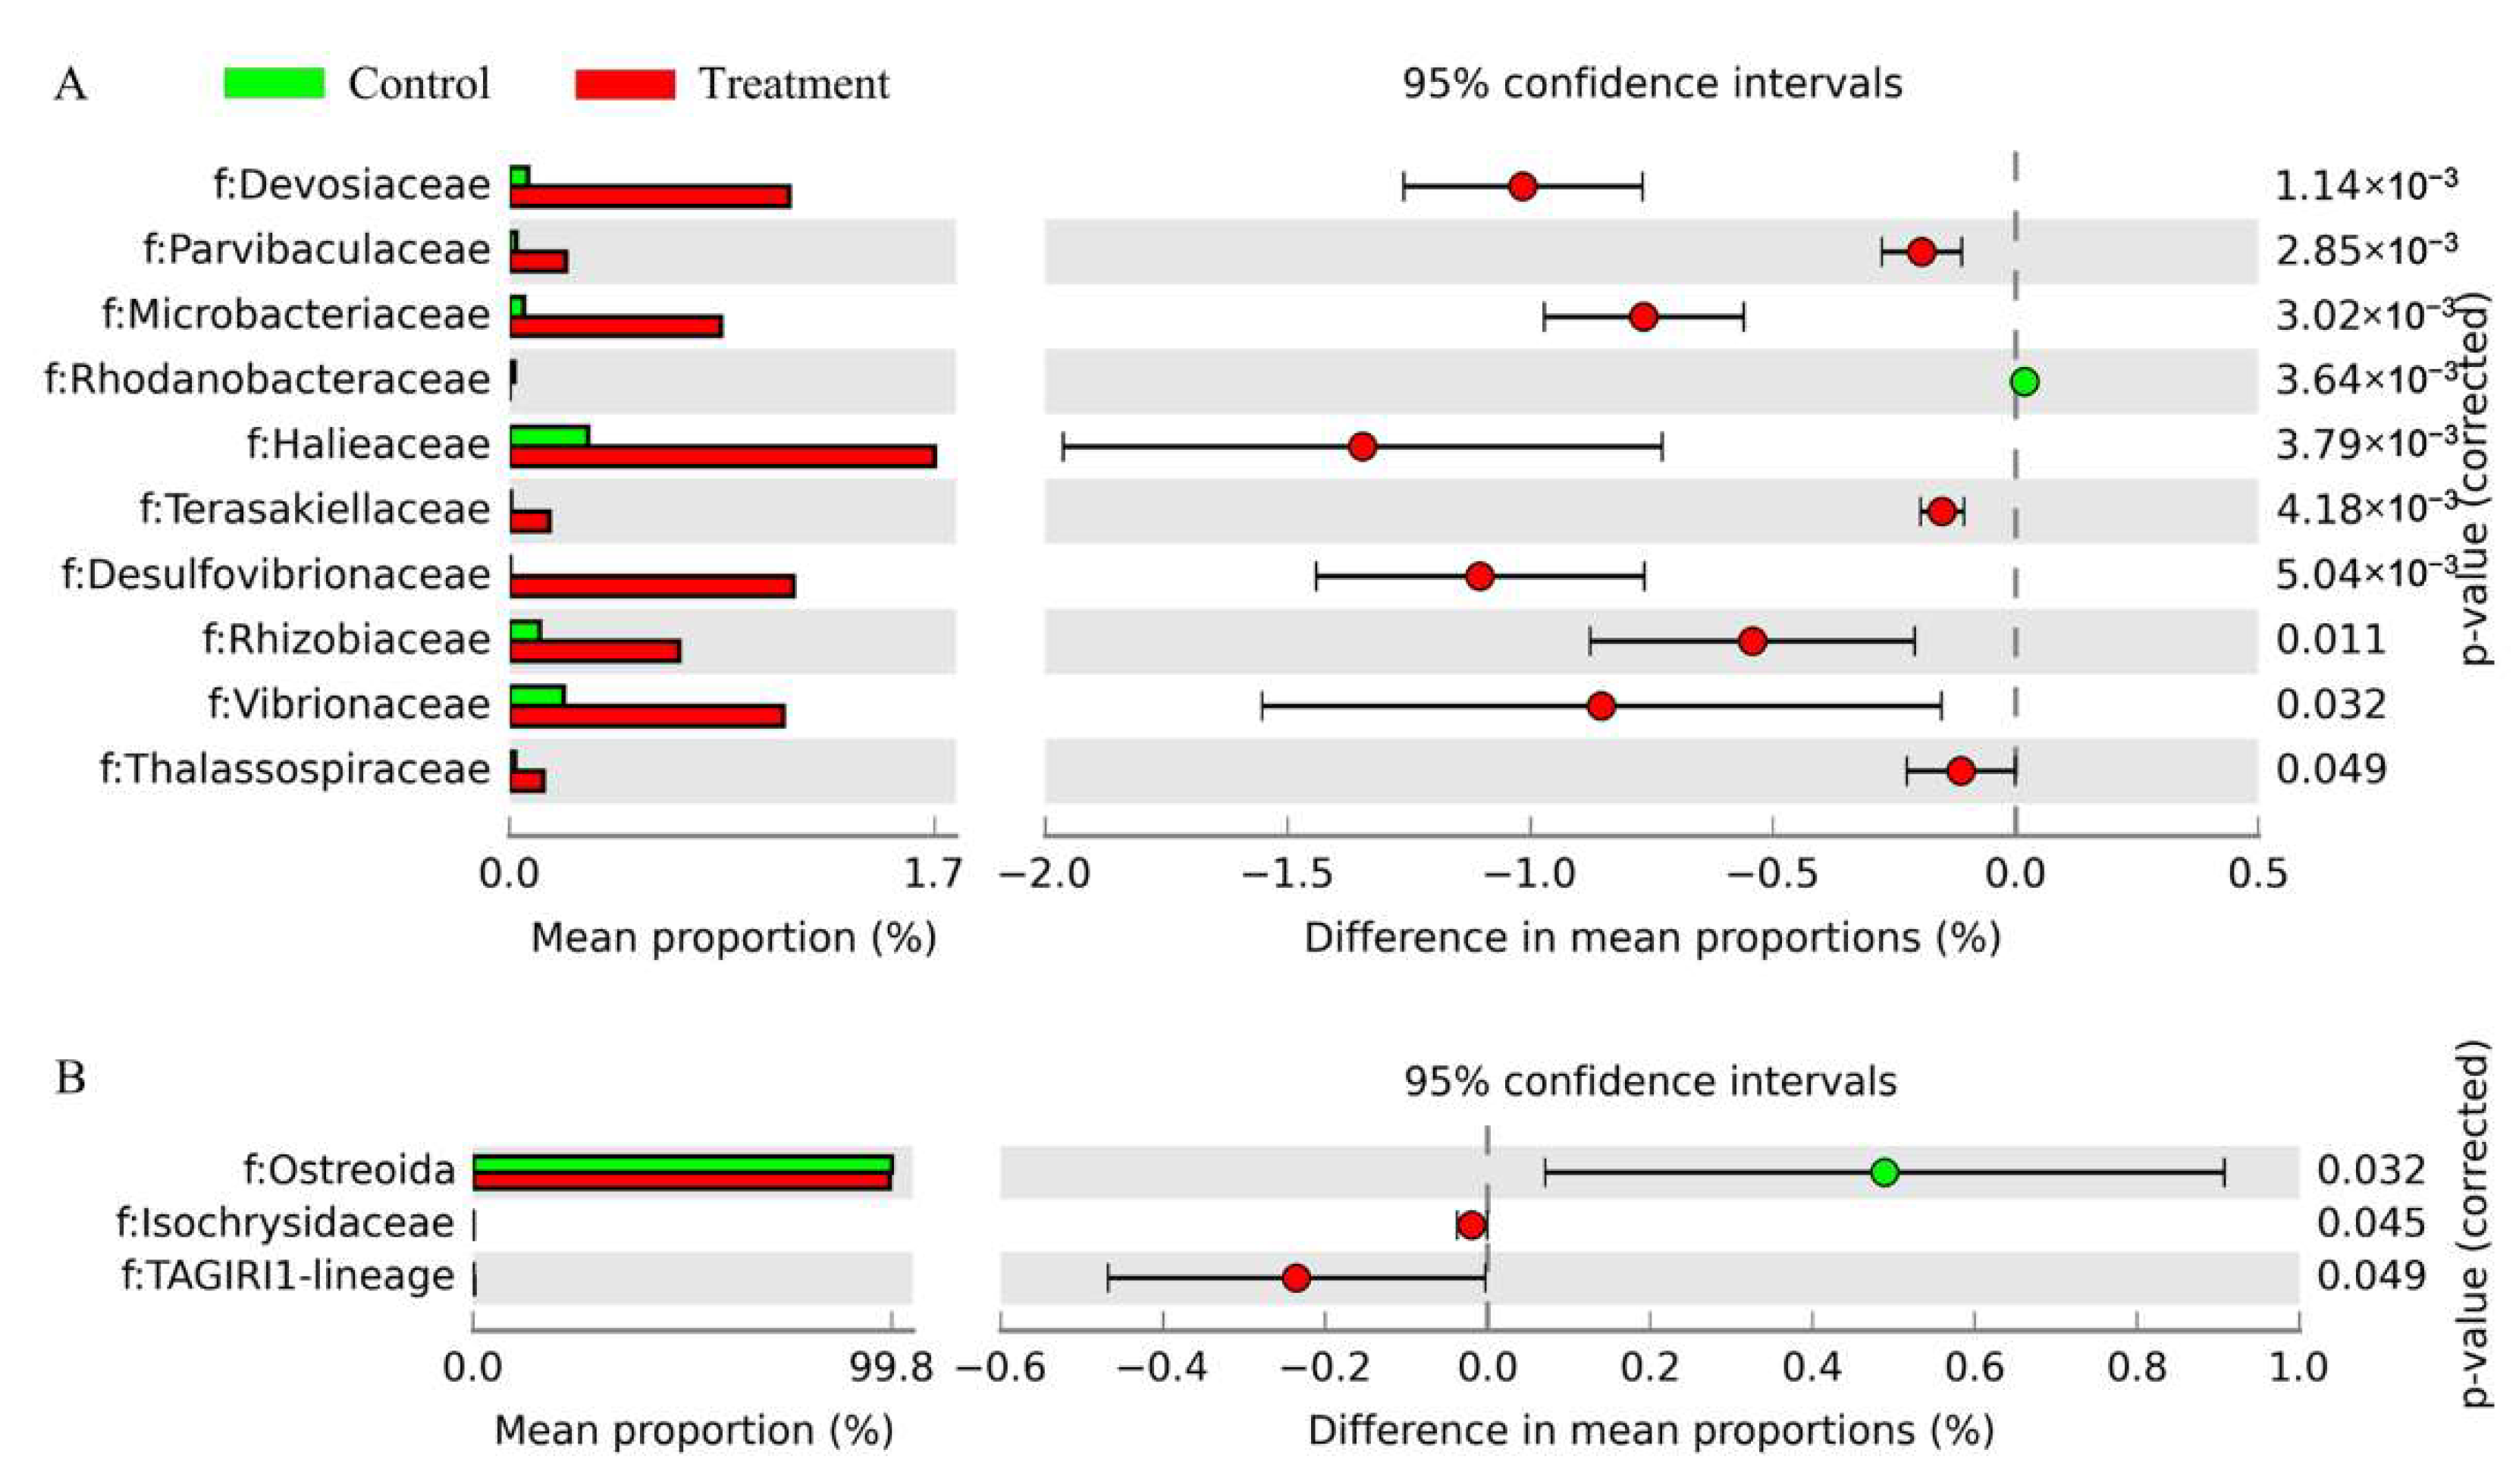
3.4. Variations in Prokaryotic and Eukaryotic Microbial Compositions at Family Level

The dominant taxa of larval microbiome between treatment and control groups were compared to evaluate the effect of antibiotic exposure on larval microbial composition. Several sensitive microbial taxa were identified in larvae microbiome in response to antibiotics. As shown in Figure 3, both groups showed enrichment of their corresponding dominant microbial taxa. Most of the dominant microbial taxa exhibited dramatically higher abundance (p < 0.05) in the treatment group in relation to the control group. At the family level, significant differences were detected in the relative abundances of Devosiaceae, Parvibaculaceae, Microbacteriaceae, Rhodanobacteraceae, Halieaceae, Terasakiellaceae, Desulfovibrionaceae, Rhizobiaceae, Vibrionaceae and Thalassobaculaceae when comparing the larval bacteria between treatment and control groups (Figure 3A). Notably, the relative abundances of these bacterial taxa except Rhodanobacteraceae significantly increased (p < 0.05) in treatment group compared to control group (Figure 3A). Significant differences were also detected in the relative abundances of Ostreoida, Isochrysidaceae and TAGIRI1-lineage when comparing the larval eukaryotic microbiota between treatment and control groups (Figure 3B). Among them, the relative abundances of Isochrysidaceae and TAGIRI1-lineage were enriched prominently (p < 0.05) in the treatment group compared with those in the control group (Figure 3B). By contrast, the relative abundance of Ostreoida exhibited an opposite pattern (Figure 3B).

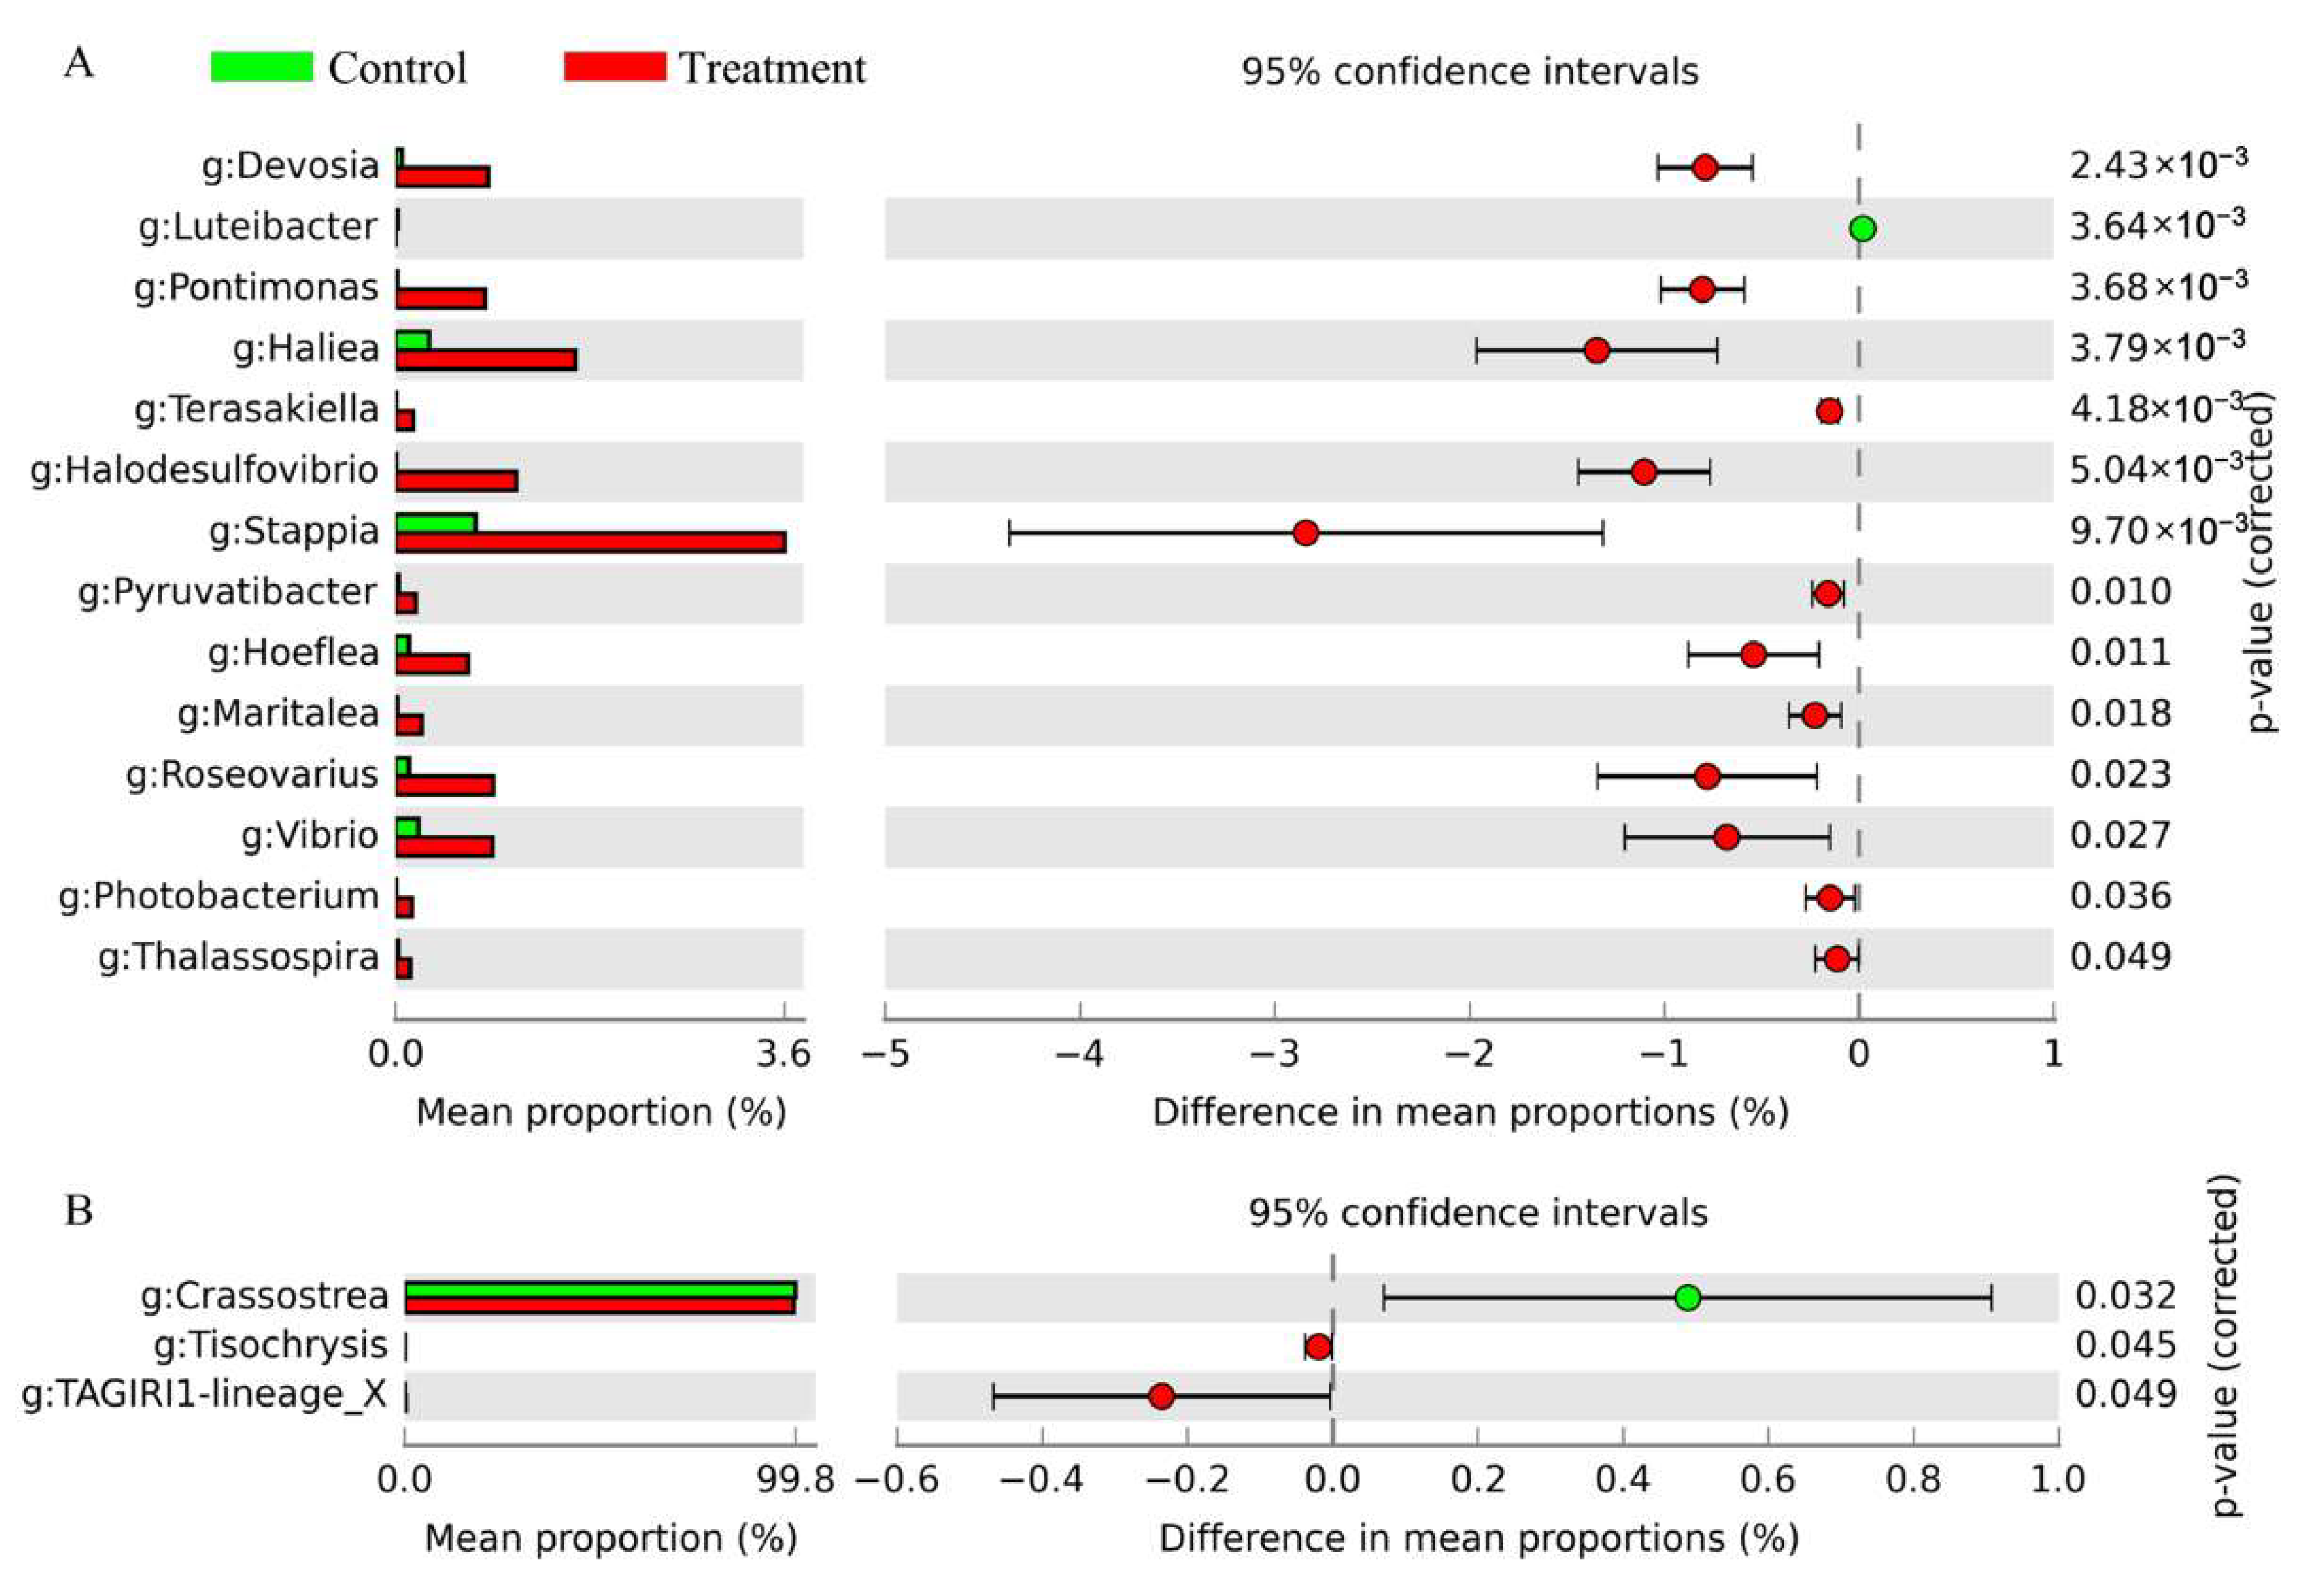
3.5. Variations in Prokaryotic and Eukaryotic Microbial Compositions at Genus Level

We further explored the responses of larval microbiome compositions at the finer genus level to antibiotics. As shown in Figure 4, most of the dominant microbial taxa exhibited remarkably higher abundance in the treatment group in comparison with the control group (p < 0.05). The relative abundances of Vibrio, Devosia, Pontimonas, Haliea, Terasakiella, Halodesulfovibrio, Stappia, Hoeflea, Maritalea, Roseovarius, Photobacterium, Thalassospira and Pyruvatibacter were significantly enriched, while that of Luteibacter was significantly underrepresented in the treatment group compared with the control group (Figure 4A). Significant differences were also detected in the relative abundances of Crassostrea, Tisochrysis and TAGIRI1-lineage_X when comparing the genus-level eukaryotic microbiota between treatment and control groups (Figure 4B). Notably, the relative abundances of Tisochrysis and TAGIRI1-lineage_X were dramatically higher, while that of Crassostrea was significantly lower in the treatment group compared with the control group (Figure 4B).

4. Discussion

It is well known that antibiotic treatment is regarded as an emergency measure to prevent disease deterioration of aquatic animals in an aquaculture system, which is very common in bivalve mollusc larvae hatcheries [25,26]. However, it is still not reported whether this management affects the larval microbiome compositions (prokaryotes and eukaryotes) of Kumamoto oyster in a nursery. Study on the prokaryotic and eukaryotic microbial communities of oyster larvae in response to antibiotics is of critical importance for understanding the microbial structure and function for oyster management practices during hatchery rearing.
Our findings showed that although PCoA showed a distinction in both prokaryotic and eukaryotic communities between treatment group and control group, analysis of similarity revealed no significant difference in the β-diversity between both groups. This finding is also supported by Venn diagrams demonstrating that the two groups shared a large proportion of common OTUs after antibiotics exposure. Further testing with larger sample sizes may be necessary to identify significant compositional differences between antibiotics-treated and non-treated larvae. These results were inconsistent with the observation on the yolk-sac larvae of Atlantic halibut showing that antibiotics addition significantly affected its gut microbiota [6]. Intriguingly, here, antibiotic treatment increased the α-diversity indexes of oyster larval microbiome communities, indicating that the application of antibiotics did not result in the suppression of larval microbial numbers.
It has been reported that antibiotic exposure does not eliminate the gut bacteria due to high levels of resistance in several bacterial members [27]. In contrast to this finding, antibiotic treatment obviously induced the change in larval bacterial compositions of Kumamoto oyster in this study. In particular, the abundances of Bacteroidetes and Verrucomicrobia greatly decreased in antibiotics-treated larvae. Bacteroides is a probiotic bacillus, and can take advantage of various feed carbohydrates as energy [28,29]. Verrucomicrobia members are known probiotics in aquaculture, and their overrepresentation and colonization can promote the homeostasis of gut microbial community in healthy individuals [30]. However, the Bacteroidetes and Verrucomicrobia members in Kumamoto oyster larval microbiome were shown to be underrepresented under antibiotics exposure. The decrease in the abundances of these known probiotics may have a negative effect on oyster larval growth. Additionally, we observed that Proteobacteria was the most abundant phylum in Kumamoto oyster larvae, which was consistent with the previous reports on the larval microbiome of Kumamoto oyster and eastern oyster [8,31]. It is well known that most members of Proteobacteria are pathogenic, especially Vibrio species [2]. Notably, we found its enrichment in antibiotics-treated larvae, and this result was also evident at the finer genus level. For example, potentially pathogenic Photobacterium and Vibrio affiliated with Proteobacteria were markedly overrepresented in larval microbiome under antibiotics treatment. It has been shown that juvenile oyster disease is caused by Stappia stellulata-like strains [32]. Consistently, Stappia showed a substantially proportional increase in antibiotics-treated larvae. Collectively, these findings indicate that larvae under antibiotic exposure may be at a high risk for developing diseases due to the underrepresentation of probiotics and the enrichment of potential pathogenic bacteria. Indeed, probiotic treatment has been demonstrated to improve the performance of Kumamoto oyster larvae exposed to virulent Vibrio coralliilyticus [33]. Thus, a new perspective for Kumamoto oyster farming is to regard the use of probiotics as an alternative to antibiotic use.
It is becoming increasingly clear that eukaryotes have important ecological roles in the microbiome and health of hosts [34,35]. Previous studies have found the insensitivity of eukaryotic microbial members to antibiotics [36]. Consistent with this assertion, compared with larval bacteria, fewer eukaryotes varied at finer taxonomic levels under antibiotics treatment. Nevertheless, our results showed high variability in eukaryotic microbial compositions. This finding may be explained by the weak resistance to environmental change due to larval organ immaturity [8,37]. Interestingly, dynamic changes of the eukaryotic microbiota, including the alternation of dominant taxa, were observed between antibiotics-treated and non-treated larvae in this study. This may be an important finding because the eukaryotic microbial community and their characteristics in oyster larvae are not as well studied as the bacterial microbial community. Here, Metazoa was the most abundant eukaryotic phylum in larval microbiome, followed by Streptophyta. However, antibiotic treatment did not affect the abundance of Metazoa, indicating that this species was insensitive to antibiotics. In contrast, the relative abundance of Streptophyta was lower in antibiotics-treated larvae in comparison with non-treated ones, but an opposite trend was observed in Cercozoa. The fluctuation of these dominant eukaryotes could disturb the structure of larval microbiome, thereby destabilizing the microbial communities. Under this scenario, larval microbial-mediated potential functions may be affected. It has been shown that Cercozoa is abundant in marine habitats, and it serves as a quantitatively important player in carbon cycles and food webs by preying on diatom and bacteria [38,39]. Notably, the exposure to antibiotics can cause stress to the immune system of Kumamoto oyster larvae. Our results showed that the proportion of Cercozoa was enhanced in antibiotics-treated larvae, which may aid host energy compensation. These results were coincident with the notion that low-rank organisms can reallocate energy from anabolism to immunological activity in the environment stress [40,41]. Notably, the abundance of Crassostrea was detected in tested Kumamoto oyster larvae, which was consistent with the notion of host species-specific microbial communities [10,13,42]. Putting these pieces together, the addition of antibiotics altered the structure and compositions of Kumamoto oyster larval microbiome to some extent.

5. Conclusions

This study allows to obtain a complete profile of the prokaryotic and eukaryotic microbiota in oyster larvae. Our findings showed that antibiotic treatment perturbed the larval microbiome, in particular, causing alteration in the dominant taxa. Some potentially pathogenic microorganisms became abundant in antibiotics-treated larvae, which may have a negative impact on oyster larval growth. Further investigation on the effect of antibiotic exposure on oyster larval survival and immunity is recommended to provide a more comprehensive understanding of the physiological response of larvae exposed to antibiotics.

Author Contributions

Q.X. and Z.L. conceived and designed the experiments. J.Y. and S.L. performed the experiments under the support of H.X. and M.L. W.D. analyzed the data. W.D. and Q.X. wrote and revised the manuscript. All authors have read and agreed to the published version of the manuscript.

Funding

This work was supported by the “3315” Innovative Team Project of Ningbo City, National Natural Science Foundation of China (32202989), Zhejiang Province Natural Science Foundation (LQ22C190005), Ningbo Key Social Public Welfare Project (2021S009), China Agriculture Research System of MOF and MARA, Research Plan Project of Zhejiang Wanli University.

Institutional Review Board Statement

The animal study was reviewed and approved by the Institutional Animal Care and Use Committee (IACUC) of Zhejiang Wanli University, China (Approval code: 20221003001).

Informed Consent Statement

We certify that this work is original and it has been never submitted or published elsewhere. The authors are responsible for all content in the manuscript.

Data Availability Statement

Relevant information has been added in the article.

Conflicts of Interest

The authors declare no competing or financial interest.

References

  1. Paillard, C.; Le Roux, F.; Borrego, J.J. Bacterial disease in marine bivalves, a review of recent studies: Trends and evolution. Aquat. Living Resour. 2004, 17, 477–498. [Google Scholar] [CrossRef] [Green Version]
  2. Beaz-Hidalgo, R.; Balboa, S.; Romalde, J.L.; Figueras, M.J. Diversity and pathogenecity of Vibrio species in cultured bivalve molluscs. Environ. Microbiol. Rep. 2010, 2, 34–43. [Google Scholar] [CrossRef] [PubMed]
  3. Prado, S.; Romalde, J.L.; Montes, J.; Barja, J.L. Pathogenic bacteria isolated from disease outbreaks in shellfish hatcheries. First description of Vibrio neptunius as an oyster pathogen. Dis. Aquat. Organ. 2005, 67, 209–215. [Google Scholar] [CrossRef] [PubMed]
  4. Blogoslawski, W.J.; Stewart, M.E.; Rhodes, E.W. Bacterial disinfection in shellfish hatchery disease control. In Proceedings of the Annual Meeting-World Mariculture Society; Blackwell Publishing Ltd.: Oxford, UK, 1978; Volume 9, pp. 587–602. [Google Scholar]
  5. Keeney, K.M.; Yurist-Doutsch, S.; Arrieta, M.C.; Finlay, B.B. Effects of antibiotics on human microbiota and subsequent disease. Annu. Rev. Microbiol. 2014, 68, 217–235. [Google Scholar] [CrossRef]
  6. Verner-Jeffreys, D.W.; Shields, R.J.; Bricknell, I.R.; Birkbeck, T.H. Effects of different water treatment methods and antibiotic addition on larval survival and gut microflora development in Atlantic halibut (Hippoglossus hippoglossus L.) yolk-sac larvae. Aquaculture 2004, 232, 129–143. [Google Scholar] [CrossRef]
  7. Sekirov, I.; Tam, N.M.; Jogova, M.; Robertson, M.L.; Li, Y.; Lupp, C.; Finlay, B.B. Antibiotic-induced perturbations of the intestinal microbiota alter host susceptibility to enteric infection. Infect. Immun. 2008, 76, 4726–4736. [Google Scholar] [CrossRef] [PubMed] [Green Version]
  8. Arfken, A.; Song, B.; Allen, S.K., Jr.; Carnegie, R.B. Comparing larval microbiomes of the eastern oyster (Crassostrea virginica) raised in different hatcheries. Aquaculture 2021, 531, 735955. [Google Scholar] [CrossRef]
  9. Li, Z.; Nicolae, V.V.; Akileh, R.; Liu, T. A brief review of oyster-associated microbiota. Microbiol. Res. J. Int. 2017, 20, 1–14. [Google Scholar] [CrossRef] [Green Version]
  10. Dai, W.; Qiu, Q.; Chen, J.; Xiong, J. Gut eukaryotic disease-discriminatory taxa are indicative of Pacific white shrimp (Litopenaeus vannamei) white feces syndrome. Aquaculture 2019, 506, 154–160. [Google Scholar] [CrossRef]
  11. Dai, W.; Dong, Y.; Ye, J.; Xue, Q.; Lin, Z. Gut microbiome composition likely affects the growth of razor clam Sinonovacula constricta. Aquaculture 2022, 550, 737847. [Google Scholar] [CrossRef]
  12. Robinson, C.J.; Bohannan, B.J.; Young, V.B. From structure to function: The ecology of host-associated microbial communities. Microbiol. Mol. Biol. Rev. 2010, 74, 453–476. [Google Scholar] [CrossRef] [PubMed] [Green Version]
  13. Trabal Fernández, N.; Mazón-Suástegui, J.M.; Vázquez-Juárez, R.; Ascencio-Valle, F.; Romero, J. Changes in the composition and diversity of the bacterial microbiota associated with oysters (Crassostrea corteziensis, Crassostrea gigas and Crassostrea sikamea) during commercial production. FEMS Microbiol. Ecol. 2014, 88, 69–83. [Google Scholar] [CrossRef] [PubMed] [Green Version]
  14. Clerissi, C.; Lorgeril, J.D.; Petton, B.; Lucasson, A.; Toulza, E. Diversity and stability of microbiota are key factors associated to healthy and diseased Crassostrea gigas oysters. BioRxiv 2018. BioRxiv:378125. [Google Scholar]
  15. Parfrey, L.W.; Walters, W.A.; Knight, R. Microbial eukaryotes in the human microbiome: Ecology, evolution, and future directions. Front. Microbiol. 2011, 2, 153. [Google Scholar] [CrossRef] [PubMed] [Green Version]
  16. Massana, R.; Logares, R. Eukaryotic versus prokaryotic marine picoplankton ecology. Environ. Microbiol. 2013, 15, 1254–1261. [Google Scholar] [CrossRef] [PubMed] [Green Version]
  17. Dai, W.; Yu, W.; Zhang, J.; Zhu, J.; Zhen, T.; Xiong, J. The gut eukaryotic microbiota influences the growth performance among cohabitating shrimp. Appl. Microbiol. Biotechnol. 2017, 101, 6447–6457. [Google Scholar] [CrossRef]
  18. Reyman, M.; Van Houten, M.A.; Watson, R.L.; Chu, M.L.J.; Arp, K.; De Waal, W.J.; Schiering, I.; Plötz, F.B.; Willems, R.J.L.; Schaik, W.; et al. Effects of early-life antibiotics on the developing infant gut microbiome and resistome: A randomized trial. Nat. Commun. 2022, 13, 1–12. [Google Scholar] [CrossRef]
  19. Argentini, C.; Mancabelli, L.; Alessandri, G.; Tarracchini, C.; Barbetti, M.; Carnevali, L.; Longhi, G.; Viappiani, A.; Anzalone, R.; Milani, C.; et al. Exploring the ecological effects of naturally antibiotic-insensitive bifidobacteria in the recovery of the resilience of the gut microbiota during and after antibiotic treatment. Appl. Environ. Microb. 2022, 88, e00522-22. [Google Scholar] [CrossRef]
  20. Patangia, D.V.; Anthony, R.C.; Dempsey, E.; Paul, R.R.; Stanton, C. Impact of antibiotics on the human microbiome and consequences for host health. MicrobiologyOpen 2022, 11, e1260. [Google Scholar] [CrossRef]
  21. Luna-Gonzalez, A.; Maeda-Martínez, A.; Sainz, J.; Ascencio-Valle, F. Comparative susceptibility of veliger larvae of four bivalve mollusks to a Vibrio alginolyticus strain. Dis. Aquat. Organ. 2002, 49, 221–226. [Google Scholar] [CrossRef]
  22. Wallace, R.K.; Waters, P.; Rikard, F.S. Oyster Hatchery Techniques; Southern Regional Aquaculture Center: Stoneville, MS, USA, 2008. [Google Scholar]
  23. Wei, Y.; Ren, T.; Zhang, L. Dix-seq: An integrated pipeline for fast amplicon data analysis. bioRxiv 2020. bioRxiv:2020.05.11.089748. [Google Scholar]
  24. Parks, D.H.; Tyson, G.W.; Hugenholtz, P.; Beiko, R.G. STAMP: Statistical analysis of taxonomic and functional profiles. Bioinformatics 2014, 30, 3123–3124. [Google Scholar] [CrossRef] [PubMed]
  25. Robert, R.; Miner, P.; Nicolas, J. Mortality control of scallop larvae in the hatchery. Aquacult. Int. 1996, 4, 305–313. [Google Scholar] [CrossRef]
  26. Prado, S. Microbiota Asociada a Criaderos de Moluscos: Patogénesis and Probiosis. Ph.D. Thesis, University of Santiago de Compostela, Santiago de Compostela, Spain, 2006. [Google Scholar]
  27. Jernberg, C.; Löfmark, S.; Edlund, C.; Jansson, J.K. Long-term impacts of antibiotic exposure on the human intestinal microbiota. Microbiology 2010, 156, 3216–3223. [Google Scholar] [CrossRef] [Green Version]
  28. Amoah, K.; Dong, X.; Tan, B.; Zhang, S.; Chi, S.; Yang, Q.; Liu, H.; Yang, Y.; Zhang, H. Administration of probiotic Bacillus licheniformis induces growth, immune and antioxidant enzyme activities, gut microbiota assembly and resistance to Vibrio parahaemolyticus in Litopenaeus vannamei. Aquacult. Nutr. 2020, 26, 1604–1622. [Google Scholar] [CrossRef]
  29. Sandvang, D.; Skjoet-Rasmussen, L.; Cantor, M.D.; Mathis, G.F.; Lumpkins, B.S.; Blanch, A. Effects of feed supplementation with 3 different probiotic Bacillus strains and their combination on the performance of broiler chickens challenged with Clostridium perfringens. Poult. Sci. 2021, 100, 100982. [Google Scholar] [CrossRef]
  30. Dai, W.; Sheng, Z.; Chen, J.; Xiong, J. Shrimp disease progression increases the gut bacterial network complexity and abundances of keystone taxa. Aquaculture 2020, 517, 734802. [Google Scholar] [CrossRef]
  31. Dai, W.; Ye, J.; Liu, S.; Chang, G.; Xu, H.; Lin, Z.; Xue, Q. Bacterial Community Dynamics in Kumamoto Oyster Crassostrea sikamea Hatchery During Larval Development. Front. Microbiol. 2022, 13, 933941. [Google Scholar] [CrossRef]
  32. Boettcher, K.J.; Barber, B.J.; Singer, J.T. Additional evidence that juvenile oyster disease is caused by a member of the Roseobacter group and colonization of nonaffected animals by Stappia stellulata-like strains. Appl. Environ. Microb. 2000, 66, 3924–3930. [Google Scholar] [CrossRef] [Green Version]
  33. Madison, D.; Schubiger, C.; Lunda, S.; Mueller, R.S.; Langdon, C. A marine probiotic treatment against the bacterial pathogen Vibrio coralliilyticus to improve the performance of Pacific (Crassostrea gigas) and Kumamoto (C. sikamea) oyster larvae. Aquaculture 2022, 560, 738611. [Google Scholar] [CrossRef]
  34. Laforest-Lapointe, I.; Arrieta, M.C. Microbial eukaryotes: A missing link in gut microbiome studies. MSystems 2018, 3, e00201-17. [Google Scholar] [CrossRef] [PubMed] [Green Version]
  35. Hooks, K.B.; O’Malley, M.A. Contrasting strategies: Human eukaryotic versus bacterial microbiome research. J. Eukaryot. Microbiol. 2020, 67, 279–295. [Google Scholar] [CrossRef] [PubMed]
  36. Strand, M.R. Composition and functional roles of the gut microbiota in mosquitoes. Curr. Opin. Insect Sci. 2018, 28, 59–65. [Google Scholar] [CrossRef] [PubMed]
  37. Bakke, I.; Coward, E.; Andersen, T.; Vadstein, O. Selection in the host structures the microbiota associated with developing cod larvae (Gadus morhua). Environ. Microbiol. 2015, 17, 3914–3924. [Google Scholar] [CrossRef] [PubMed]
  38. Nakamura, Y.; Imai, I.; Yamaguchi, A.; Tuji, A.; Not, F.; Suzuki, N. Molecular phylogeny of the widely distributed marine protists, Phaeodaria (Rhizaria, Cercozoa). Protist 2015, 166, 363–373. [Google Scholar] [CrossRef] [Green Version]
  39. Hou, D.; Zeng, S.; Liu, J.; Yan, M.; Weng, S.; He, J.; Huang, Z. Characterization of prokaryotic and eukaryotic microbial community in pacific white shrimp ponds. J. Aquac. Res. Dev. 2016, 7, 463–472. [Google Scholar] [CrossRef] [Green Version]
  40. Fan, W.; Ye, Y.; Chen, Z.; Shao, Y.; Xie, X.; Zhang, W.; Liu, H.; Li, C. Metabolic product response profiles of Cherax quadricarinatus towards white spot syndrome virus infection. Dev. Comp. Immunol. 2016, 61, 236–241. [Google Scholar] [CrossRef]
  41. Yiu, J.H.; Dorweiler, B.; Woo, C.W. Interaction between gut microbiota and toll-like receptor: From immunity to metabolism. J. Mol. Med. 2017, 95, 13–20. [Google Scholar] [CrossRef] [Green Version]
  42. Yildirim, S.; Yeoman, C.J.; Sipos, M.; Torralba, M.; Wilson, B.A.; Goldberg, T.L.; Stumpf, R.M.; Leigh, S.R.; White, B.A.; Nelson, K.E. Characterization of the fecal microbiome from non-human wild primates reveals species specific microbial communities. PLoS ONE 2010, 5, e13963. [Google Scholar] [CrossRef]
Figure 1. Venn diagrams showing the numbers of OTUs shared between the control and treatment groups for the prokaryotic (A) and eukaryotic (B) communities, respectively. Green cycles represent the control group and red cycles represent the treatment group.
Fishes 07 00272 g001
Figure 2. Principal coordinates analysis of the larval microbial communities. PCoA of prokaryotic (A) and eukaryotic (B) communities by treatment based on Bray–Curtis distance dissimilarities. Each point corresponds to a sample and the letters above the points indicate sample names. Control and treatment groups are shown in different colors.
Fishes 07 00272 g002
Figure 3. STAMP analysis identifying the significant differences of relative abundances of dominant taxa of the prokaryotes (A) and eukaryotes (B) at the family level in the control (green) and treatment (red) groups (95% confidence intervals) by using extended error bar plot. Corrected p-values are shown on the right. f represents the taxon at the family level.
Fishes 07 00272 g003
Figure 4. STAMP analysis identifying the significant differences of relative abundances of dominant taxa of the prokaryotes (A) and eukaryotes (B) at the genus level in control (green) and treatment (red) groups (95% confidence intervals) by using extended error bar plot. Corrected p-values are shown on the right. g represents the taxon at genus level.
Fishes 07 00272 g004
Table 1. Summary of sequencing results at different taxonomical levels of prokaryotic and eukaryotic microbiota in the control and treatment groups.
ProkaryotesEukaryotes
ControlTreatmentControlTreatment
Reads83,53483,35483,73883,573
OTUs5586554135
Phylum1515810
Class23271717
Order43492121
Family75782322
Genus1091141817
Table 2. Comparison of the α-diversity indices of larval microbial communities between control group and treatment group.
Microbial CommunitiesShannon Diversity Chao 1 Observed Species Simpson Index
ControlTreatmentpControlTreatmentpControlTreatmentpControlTreatmentp
Prokaryotes4.60 ± 0.405.80 ± 0.150.048466.90 ± 18.26528.87 ± 8.680.038418.00 ± 32.62504.67 ± 3.180.1160.14 ± 0.040.05 ± 0.000.089
Eukaryotes0.10 ± 0.020.23 ± 0.010.00431.20 ± 5.2729.77 ± 2.030.81227.33 ± 3.8428.33 ± 1.860.8260.98 ± 0.000.95 ± 0.000.006
Table 3. Frequency distribution of prokaryotic and eukaryotic taxonomic profiles at the phylum level in control and treatment groups.
Phyla in Prokaryotic CommunityControlTreatmentp-Value
Proteobacteria79.41% ± 2.81%85.51% ± 2.81%0.20
Bacteroidetes11.25% ± 5.42%3.77% ± 0.63%0.04
Firmicutes6.28% ± 6.16%0.31% ± 0.01%0.04
Chlamydiae0.55% ± 0.02%5.04% ± 1.04%0.01
Actinobacteria0.46% ± 0.16%1.52% ± 0.14%0.01
Candidatus Saccharibacteria0.08% ± 0.02%0.09% ± 0.03%0.74
Verrucomicrobia0.04% ± 0.01%0.03% ± 0.02%0.77
Planctomycetes0.04% ± 0.01%0.10% ± 0.02%0.07
Fusobacteria0.10% ± 0.01%0.00% ± 0.00%0.37
Tenericutes0.01% ± 0.00%0.07% ± 0.03%0.11
SR10.01% ± 0.01%0.00% ± 0.00%0.42
Parcubacteria0.01% ± 0.00%0.11% ± 0.05%0.16
Campilobacterota0.00% ± 0.00%0.06% ± 0.05%0.38
Spirochaetes0.00% ± 0.00%0.01% ± 0.01%0.14
Abditibacteriota0.00% ± 0.00%0.01% ± 0.01%0.42
Unclassified1.86% ± 0.81%3.37% ± 1.26%0.37
Phyla in eukaryotic communityControlTreatmentp-value
Metazoa99.37% ± 0.30%99.46% ± 0.11%0.78
Streptophyta0.53% ± 0.28%0.07% ± 0.05%0.18
Perkinsea0.03% ± 0.03%0.00% ± 0.00%0.42
Ochrophyta0.02% ± 0.01%0.01% ± 0.00%0.21
Fungi0.02% ± 0.01%0.01% ± 0.01%0.40
Chlorophyta0.01% ± 0.00%0.07% ± 0.01%0.02
Cercozoa0.00% ± 0.00%0.32% ± 0.07%0.01
Haptophyta0.00% ± 0.00%0.02% ± 0.00%0.01
Sagenista0.00% ± 0.00%0.02% ± 0.01%0.07
Unclassified0.00% ± 0.00%0.02% ± 0.00%0.02
Note: Mean ± standard error % were compared by using unpaired t-test.
Publisher’s Note: MDPI stays neutral with regard to jurisdictional claims in published maps and institutional affiliations.

