
Validation of a Portable eDNA Detection Kit for Invasive Carps
by
 ,
,
Stacie A. Kageyama
* ,
,
Matthew R. Hoogland
,
Tariq Tajjioui
,
Theresa M. Schreier
,
Richard A. Erickson
and
Christopher M. Merkes
U.S. Geological Survey, Upper Midwest Environmental Sciences Center, 2630 Fanta Reed Rd., La Crosse, WI 54603, USA
*
Author to whom correspondence should be addressed.
Fishes 2022, 7(6), 363; https://doi.org/10.3390/fishes7060363
Submission received: 16 November 2022
/
Revised: 21 November 2022
/
Accepted: 24 November 2022
/
Published: 30 November 2022
(This article belongs to the Special Issue Application of Environmental DNA Technology in Fishery Resources)
Abstract
:Loop-mediated isothermal amplification (LAMP) is a rapid molecular detection technique that has been used as a diagnostic tool for detecting human and animal pathogens for over 20 years and is promising for detecting environmental DNA shed by invasive species. We designed a LAMP assay to detect the invasive carps, silver carp (Hypophthalmichthys molitrix), bighead carp (Hypophthalmichthys nobilis), black carp (Mylopharyngodon piceus), and grass carp (Ctenopharyngodon idella). To determine the sensitivity of the LAMP assay, we determined limit of detection (LOD) for each invasive carp species and compared with the performance of a grass carp quantitative PCR (qPCR) assay in LOD and in a mesocosm study. We used two grass carp densities, 3 juvenile grass carp in one mesocosm and 33 juvenile grass carp in the other. Prior to adding grass carp to the mesocosms, we added 68 kg of fathead minnows (Pimephales promelas) to each mesocosm to simulate farm ponds used for raising bait fish. We filtered 500 mL of water per sample to compare LAMP and qPCR analysis, and we collected 50 mL grab samples that were only analyzed using qPCR to gain additional data using a higher-throughput method to monitor environmental DNA (eDNA) levels throughout the study period. No eDNA for any of the four invasive carp species was detected in water collected from the mesocosms during the three days prior to adding grass carp. Forty-eight hours after grass carp addition to mesocosms, we detected grass carp eDNA in the mesocosm containing 33 grass carp using the LAMP assay. However, we failed to detect any grass carp DNA in the mesocosm containing 3 grass carp with the LAMP assay throughout the study. We analyzed the data using an occupancy model and found that the 500 mL filter samples yielded a higher eDNA capture probability than 50 mL grab samples in the mesocosm containing three grass carp but had similar eDNA capture probability in the mesocosm containing 33 grass carp. Both LAMP and qPCR reliably detected grass carp eDNA 2 days after grass carp addition, but detections were more consistent with qPCR. The LAMP assay may have utility for certain niche uses because it can be used to rapidly analyze eDNA samples and is robust to inhibition, despite having some limitations.
1. Introduction
Aquatic invasive species are a growing global threat with thousands of organisms being transported around the world in ballast water [1], and other potential aquatic invasive species being introduced to North America intentionally for aquaculture [2,3,4], bait [5,6,7,8], or the pet trade [9,10]. An example of a very damaging invasive species in North America is Zebra mussel (Dreissena polymorpha) which were only discovered in North America in 1986; but have since contributed to the extirpation of native mussel species [11], and have caused extensive damage to infrastructure including water treatment [12] and hydropower plants [13]. Another group causing concern is the invasive carp group, hereafter referred to as “invasive carp” which is currently threatening the Laurentian Great Lakes and other water bodies. The group includes bighead carp (Hypophthalmichthys nobilis Valenciennes), silver carp (H. molitrix Gray), black carp (Mylopharyngodon piceus Richardson), and grass carp (Ctenopharyngodon idella Valenciennes). Bighead, silver, and black carp have been listed as injurious wildlife under the Lacey Act [14,15,16] in the USA. The U.S. Army Corps of Engineers has estimated the cost of keeping invasive carp out of the Great Lakes at U.S. $778 million dollars [17].
Countless numbers of invasive species go undetected in the early stages of the invasion simply because no one is looking for them, or because they are difficult to detect when populations are very small prior to the exponential growth phase of the invasion [18,19,20,21]. Therefore, early detection is a critical component of invasive species management. This is especially true in aquatic invasive species management, because aquatic organisms are highly capable of circumventing protocols to prevent species introductions [22]. However, early detection of aquatic invasive species can be problematic [23], and the vast sampling effort needed for using traditional surveillance techniques can render them ineffective for detecting rare species [24].
Environmental DNA (eDNA) methods used along with adequate sampling intensity are useful for detecting and monitoring aquatic taxa in low abundance that are infrequently detected with conventional sampling techniques [24,25,26,27,28]. Using eDNA to detect macrobiota is not new and early studies include assays for amphibians such as the American bullfrog (Lithobates catesbeianus) [29], for Rocky Mountain tailed frogs (Ascaphus montanus), and Idaho giant salamanders (Dicampton aterrimus) [30]. To date, molecular methods such as qPCR and high-throughput sequencing (HTS) are being used to analyze eDNA for detecting and monitoring both rare and invasive species, in addition to total biodiversity.
Routine use of qPCR with eDNA has improved the management of aquatic invasive species by contributing to early detection of cryptic taxa [31] and the detection of taxa in low abundance at the invasion front [32]. However, results from many qPCR eDNA techniques are not available until samples are transported and processed in the laboratory, offsetting results by days to weeks in many instances. Loop-mediated isothermal amplification (LAMP) is a method that has been available for more than twenty years to quickly amplify target DNA [33]. As the name suggests, loop-mediated isothermal amplification uses one temperature to amplify DNA instead of repeatedly cycling between a set of temperatures used in PCR [33]. LAMP has been found to be much more robust than qPCR [34,35,36], because PCR (and qPCR) is susceptible to inhibition. Comparisons between LAMP and PCR (or qPCR) have been made by using unextracted biological samples as DNA templates [34,35,36] including, urine, stool, and blood [35], or with the addition of food rinses [36] where PCR and qPCR were inhibited at lower concentrations of inhibitors or crude sample material, and LAMP was not inhibited until higher concentrations of inhibitors or crude sample material were added to the reaction.
LAMP is currently used as a diagnostic tool in human [37,38,39,40] and veterinary medicine [41,42,43], plant pathology [44,45,46], and in the food industry [47,48,49,50]. In human and veterinary medicine, LAMP is used to rapidly detect pathogens including the viruses (SARS-CoV-2) responsible for causing coronavirus 2019 [40], influenza [39], Ebola [37], Zika [51], and canine and porcine parvo [41,42], and the parasites causing toxoplasmosis [43] and malaria [38]. LAMP is also used to detect microbial plant pathogens, as well as for detecting the presence of invasive insects such as the emerald ash borer (Agrilus planipennis) [46] and the red imported fire ant (Solenopsis invicta) [52]. In addition, LAMP has been used for sex determination in raptors [53] and for detection of invasive Dreissena spp. in the Great Lakes basin, USA [54].
DNA templates from water samples with high turbidity [55], or high humic or fulvic acid content [56,57,58] can result in PCR inhibition. Extracting eDNA from turbid water or water with high humic or fulvic acid content requires the additional step of removing inhibitors [55,58] which can add additional time and expense to a project as well as decrease the extract yield of eDNA. In regard to inhibition, LAMP is more robust than PCR [35,36] and can be used to amplify samples from water that is unsuitable for qPCR.
Quantitative PCR assays are available for invasive carp, including assays for bighead carp and silver carp [59,60], grass carp [61], and black carp [31,62]. We designed a LAMP assay to rapidly screen for the four invasive carp species in situations where the presence of any of the four species would be problematic. Molecular tools such as qPCR or high throughput sequencing have detected invasive carp in live bait as contaminating species, but results were obtained too late to inform a management response [63]. Methods like our LAMP assay could be useful for management agency conservation officers to test for invasive carp contamination in live bait and yield results in time to prevent spread through that invasion pathway. Bait growers and other aquaculturists could use this method to test their own ponds after stocking or flooding events to keep their own investments free from invasive carp. Lock and dam operators could use this method to periodically test approach channels or lock chambers to rapidly assess the threat of invasive fish passage that could then trigger enhanced biosecurity measures. This method could also be used to rapidly scout areas for intensive control or harvesting efforts. Here, we report the results of a study testing the utility of a LAMP assay for detecting invasive carp in a simulated bait pond with contextual comparisons to more commonly used qPCR eDNA methods.
2. Methods
2.1. LAMP Primer Design
We designed LAMP primers (AC1) targeting the 16S rRNA region from mitochondrial DNA sequences published in the NCBI GenBank database (www.ncbi.nlm.nih.gov) specific for bighead carp (EU343733, HM1628, KJ679504), silver carp (EU315941, JQ231114, KJ671449), grass carp (EU391390, HQ891005, JQ231115), and black carp (DQ026435, EU979305, EU979306). Sequences were aligned using Geneious 10.0.5 (Auckland, New Zealand) to find areas of conserved DNA. We designed several variations of the LAMP primers to optimize the assay and tested each set over a range of temperatures to determine which combination of primers performed best with each of the four invasive carp species (e.g., some with ambiguous bases and some species-specific). The primers consist of the forward outer primer (F3), backward outer primer (B3), forward inner primer (FIP), backward inner primer (BIP), forward looping primer (FLP) and backward looping primer (BLP) (Table 1). We also included an endogenous positive control assay with a set of primers targeting the bacterial 16S rRNA gene (Table 1). Eight target regions were identified within the 16S rRNA gene spanning 206 bp using 16S sequences from NCBI GenBank database for Escherichia coli (AB272358, AB305017, AB594752, AB609595, AJ567607, AM184252, GU348986, JF961336, JQ781559, JQ781567, JQ781579, JQ781641, JQ781645, JQ781646, JX467700, KC759521, KJ585688, KJ810542, KP297459, KR265352, KT873246, KT153187, KT153199, KT873237, KX023348, KX572970, KX758560, KX898812, KY399966, KY655039, KY655087, KY655103). Primers were synthesized by Integrated DNA Technologies (Coralville, IA, USA).
2.2. LAMP Optimization
LAMP reactions were carried out with a total volume of 25 µL, containing 15 µL Isothermal Master Mix ISO-004 (Optigene, Horsham, UK), 0.2 mM of F3 and B3 primers, 1.6 mM of FIP and BIP primers, and 0.4 mM of FLP and BLP primers. All LAMP reagents were kept on ice, as were 96-well plates, during plate setup. We added 1 µL of genomic DNA from fin clips of bighead, silver, grass, and black carp as template for each reaction. The assay was then run at 62.9 °C for 40 min, measuring SYBR fluorescence every 10 s, with a melting curve analysis (75–95 °C ramping at 0.1 °C per minute) using a CFX96 Touch qPCR system (Bio-Rad; Hercules, CA, USA). Fluorescence data were smoothed with a 5-point rolling average, and then reactions were considered positive if 5 consecutive points increased by 40 relative fluorescence units (rfu) between 300 and 1400 s. If a reaction was positive, the first of the 5 consecutive points was noted as the time to result. We tested the sensitivity of the assay by using gBlocks Gene Fragments (Integrated DNA Technologies; Coralville, IA, USA) of the target region for each species. Reactions with 104, 103, 102 and 10 copies of DNA were performed using the LAMP conditions above. We then determined the assay’s specificity by testing genomic DNA extracted from fin clips obtained from the animal holding unit at the U.S. Geological Survey Upper Midwest Environmental Sciences Center (UMESC) in La Crosse, Wisconsin, USA. for bighead, silver, black, grass carp, and 20 other non-target species including 4 cyprinid species (Table 2).
2.3. Limit of Detection
Limit of detection (LOD) is defined as the target DNA concentration that can be reliably detected with 95% confidence, and our effective LOD (because we tested samples in 5 replicates) is the target DNA concentration that can be reliably detected with 95% confidence in at least 1 of 5 replicates [64]. We determined the LOD of the AC1 LAMP assay as well as a qPCR assay for grass carp using a hydrolysis probe that we designed to use with previously published primers targeting the ND2 gene (Table 1) [61]. Mahon et al. [61] had previously tested the ND2 primers against non-target species including fathead minnows. We tested the modified ND2 assay using genomic DNA from bighead, silver, black, and grass carp, and found that the assay only amplified our target species, grass carp. Final qPCR reaction volumes were 25 µL with 500 nM of primers, 250 nM of probe, 12.5 µL of ToughMix® mastermix (Quantabio, Beverly, MA, USA), and 2 µL of template. We used thermocycling conditions of: an initial denaturation at 95.0 °C for 2 min, followed by 50 cycles of 95.0 °C for 5 s and annealing temperature of 57.0 °C for 30 s, and final extension of 72.0 °C for 3 min.
For the LAMP LOD, at least four different gBlock concentrations from 10 to 10,000 copies per reaction were used for each of the four invasive carp species following the protocol described in Klymus et al. [64]. For each species, we ran two concentrations with 100% detection, one concentration with <100% detection but >20%, and one concentration with <20% detection, and ran 48 replicates each per concentration. For the qPCR LOD, we used five different concentrations of grass carp gBlocks ranging from 5 copies to 10,000 copies. Each concentration was run with 48 replicates. We analyzed both LAMP and qPCR LOD data using R [65] with a previously published script for LOD analysis available at https://doi.org/10.5066/P9GT00GB with the “Best” fitting model setting for LOD and limit of quantification (LOQ) function selection and CV threshold set at 35% for LOQ determination. Because LAMP is an isothermal reaction, no temperature cycling and no cycle of quantification is determined. The LOD calculator R script was designed to analyze qPCR data and requires a quantitation cycle (Cq) value column, but it also can function with other kinds of similar data formatted accordingly. We used the time to result as Cq for the purposes of the LOD script when determining the LAMP LOD. We used the script for the ease of calculating LODs for both LAMP and qPCR data, but LAMP is not quantitative. Therefore, we ignored the LOQ outputs that also came from the script for the LAMP data.
2.4. Mesocosm Validation
For mesocosm validation of the LAMP assay, we set up an experiment in artificial ponds at UMESC in August 2017 in two 40 m2 concrete ponds. Ponds were filled with well water at 12 °C to an average depth of 1.2 m. Water flow into the ponds was set at the lowest setting (<4 L per minute) to: (1) supplement oxygen to the ponds by aerating the water, (2) flush ammonia from the ponds, and (3) minimize loss of eDNA. Grass carp were chosen as the target species because preliminary sensitivity data indicated that the LAMP assay was the least sensitive for grass carp. We added approximately 68 kg (a representative loading density for baitfish ponds) of live fathead minnows (4–8 cm long) to each pond to simulate farm ponds for raising baitfish on August 17, 2017. We collected 10 samples (50 mL of water) from each pond per day and analyzed for invasive carp eDNA by qPCR in 4 replicates in the three days before adding grass carp. We extracted DNA using the gMax Mini Kit (IBI Scientific, Peosta, IA, USA) according to the manufacturer’s directions with a final elution volume of 100 µL. DNA extracts were analyzed with qPCR using the modified grass carp ND2 assay described above and a previously published bigheaded carp assay [60]. Juvenile grass carp (15–20 cm long) were added to both ponds on August 29, 2017, with 33 grass carp added to Pond 2 and 3 grass carp added to Pond 4. UMESC Fish Culture personnel fed the fish every three days. Moribund fathead minnows were removed from the ponds each day, however, no grass carp died before the end of the experiment. All fathead minnows and grass carp that survived until the end of the experiment were humanely euthanized.
Mesocosm water samples for LAMP and qPCR analysis were collected near the outflow of each pond and where any sediment would eventually end up. We chose to sample at the outlet because the ponds were concrete rectangles with gradual slopes and the fish were able to swim the entire area with no distinctive features to attract the fish. The eDNA may have had a gradient from the end of the pond where we collected samples to the opposite end where the inflow of water was, but that was beyond the scope of our study as LAMP is not quantitative and it was not tested. We initially sampled 4 h after adding grass carp to the ponds, and then on each subsequent day for a total of 7 days. Ten 500-mL filtered samples were collected per mesocosm plus five 50-mL grab samples per mesocosm on each day of sampling at the same time each day throughout the duration of the experiment. For the 500-mL filtered samples, we sampled by pumping 500-mL of pond water through filtering apparatuses containing 47 mm diameter 1.2-µm pore size mixed cellulose ester (MCE) membrane filters (Merck Millipore; Burlington, MA, USA) using Masterflex® Model 7015–21 peristaltic pump heads (Cole Parmer, Vernon Hills, IL, USA) powered by cordless 12V drills fitted with 12 mm hex sockets. In order to eliminate cross-contamination, one set of filtering apparatuses was dedicated to each pond per sampling day. Each filter was then set aside for DNA extraction and LAMP analysis on the day of sampling. For the 50-mL grab samples, we collected water from the ponds in five 50-mL Falcon conical tubes (Fisher Scientific, Pittsburgh, PA, USA) per pond per day to be analyzed by qPCR. After completion of each day’s sampling, we sterilized filtering apparatuses by soaking them in a 10% bleach solution for 30 min, rinsed them thoroughly with DI water, and allowed them to air-dry.
2.5. DNA Extractions
2.5.1. 500-mL Filter DNA Extraction
Although DNA extraction is not necessary for using LAMP, we chose to extract DNA, because we had concentrated eDNA on MCE filters during our sampling process and to allow us to analyze these samples using qPCR in addition to LAMP. DNA was extracted from filters within an hour after collection using the portable Biomeme Bulk Developer Kit–DNA (Biomeme; Philadelphia, PA, USA) with extraction columns modified with double filters at our request. We also modified the extraction procedure by using 5 mL syringes to load the columns with 4 mL of lysis buffer instead of using the 1 mL syringes included in the kit. Once extraction columns were loaded, we used the 1 mL syringes provided in the kit for subsequent extraction steps according to the manufacturer’s instructions. We eluted DNA in 200 µL of the kit’s elution buffer rather than the recommended 100 µL to have enough DNA extract to run both LAMP and qPCR assays.
2.5.2. 50-mL Grab Sample DNA Extraction
We centrifuged the 50-mL pond water grab samples at 5000× g for 30 min at 4 °C in an Avanti J 26 XPI High-Performance Centrifuge (Beckman Coulter, Brea, CA, USA), then discarded the supernatant, and extracted DNA from the remaining pellet using the gMax Mini Kit Aaccording to the manufacturer’s directions with a final elution volume of 100 µL.
2.6. LAMP Assay
We analyzed the 500 mL filtered DNA extracts in the laboratory using the LAMP assay immediately after extractions were completed. LAMP reactions were carried out as described above except with 8 µL of DNA template. Each sample was run in 5 replicates with one positive control using grass carp gBlock as template at 1000 copies per reaction, one no template control, and another endogenous positive control by amplifying the extracted DNA template with a 16S bacterial LAMP primer set (Table 1). We chose the 16S bacterial primer set as the positive control because we presumed that bacteria would be in the pond water, and a positive LAMP reaction would indicate that bacterial DNA was in the template even if grass carp were not detected.
2.7. Spike qPCR
Additionally, both the 500 mL filter and 50 mL grab sample DNA extracts for each day of the experiment were analyzed with qPCR in quadruplicate using the modified grass carp ND2 assay described above. All qPCR reactions were run on Bio-Rad CFX96 Touch™ Real-Time PCR Detection System (Bio-Rad, Hercules, CA, USA) thermal cyclers using final volumes of 25 µL and 2 µL of template. The qPCR reactions were run with an initial denaturation at 95.0 °C for 2 min, 50 cycles of 95.0 °C for 5 s and annealing temperature of 57.0 °C for 30 s, and a final extension of 72.0 °C for 3 min. We tested for PCR inhibition by spiking in 200 copies of grass carp gBlocks into three additional replicates containing sample template. If gBlocks failed to amplify, we assumed that something was in the sample matrix causing inhibition during PCR. We re-ran any samples that appeared to be inhibited. We ran one no-template control reaction per sample and a standard curve of gBlock synthetic template with two replicates at 20,000 copies, two replicates at 2000 copies, four replicates at 200 copies, and four replicates at 20 copies on every qPCR plate.
2.8. Statistical Analysis
Environmental DNA-based sampling methods require accounting for imperfect sampling probabilities (i.e., did the water sample capture eDNA?) and detection probabilities (i.e., did the molecular method detect eDNA?) [66]. Often, eDNA-based methods also require the use of three-level models to account for site-level occupancy of eDNA (i.e., is a species’ DNA present at a location during sampling) [26,67]. We used a two-level occupancy model to account for imperfect capture of eDNA in water samples and imperfect molecular detection. We assumed eDNA would be present in our study ponds because we stocked the ponds with known densities of fish. Our model had two levels following the notation of Erickson et al. [26]. The lowest level of the model was the probability of molecular detection, p. The next level of the model was the probability of sample capture, θ. We fit two different models to address our study questions.
First, we fit a model to compare the two different sampling methods: 50-mL centrifuged and 500-mL filtered. This comparison was only done with samples processed using the qPCR assay. For this comparison, we estimated sample capture probabilities (θ) for each day, fish stocking density, and sampling method combination (e.g., Day 1, fish stocking density of 3 carp, and the 50-mL). We estimated the molecular detection probability for qPCR for each day of sampling and estimated θ for each day. Comparing the estimates for θ allowed us to compare the effectiveness of the different extraction methods. For this model, we estimated a molecular detection probability p for each day and stocking combination.
Second, we fit a model to compare the LAMP assay to conventional qPCR. For this model, we examined data from the 500-mL filtered extraction method where the same eDNA samples were analyzed using both LAMP and qPCR assays. This allowed us to estimate the sample capture probabilities (θ) for each day and fish stocking density combination while using both LAMP and qPCR assays to estimate θ. For example, if qPCR detected eDNA in a sample, but the LAMP assay did not, this modeling choice would decrease the estimated p for the LAMP assay because it missed eDNA even though it was there. The sample detection probability p was estimated for each molecular assay for each day and stocking density combination. Comparing the estimates for p allowed us to compare the two different molecular estimates.
For visualizing the eDNA concentration, we calculated means for each pond by day from the qPCR data using the best estimates we obtained for values below the LOQ. We determined the 95% and 80% credible intervals using a basic nonparametric bootstrap with 1000 resamples.
We used R version 4.0.2 [65] for our analysis and plotting. We fit the model using RStan version 2.21 [68]. Our source code is published at https://doi.org/10.5066/P9NICB9V [69]. Data collected for this study are available at https://doi.org/10.5066/P9FOS091 [70]. The data release includes an RMarkdown file that lists the R session information as well as a Dockerfile to create an image with all of our versions.
3. Results
3.1. Specificity Testing
Results from specificity testing of the LAMP assay using genomic DNA for bighead carp, silver carp, black carp, and grass carp, and 20 non-target species indicated that the assay was specific for the four target invasive carp species. None of genomic DNA templates from the non-target species amplified including the non-target cyprinids (Table 2).
3.2. Limit of Detection and Limit of Quantification
We determined the effective LODs for the LAMP assay with one replicate to be 1923 copies/reaction for bighead carp, 1002 copies/reaction for silver carp, 2014 copies/reaction for black carp, and 6327 copies/reaction for grass carp. With five replicates, the effective LODs for the LAMP assay are 291 copies/reaction for bighead carp, 307 copies/reaction for silver carp, 466 copies/reaction for black carp, and 507 copies/reaction for grass carp. We determined the effective LOD for the grass carp ND2 qPCR assay with one replicate to be 64 copies/reaction. With four replicates, the effective LOD for the grass carp ND2 qPCR assay is 7 copies/reaction. Note that the effective LOD decreases as the number of replicates increase because increased sampling of a binomial test gives a better chance of obtaining a successful result even with a lower probability of detection [64]. We determined the LOQ for the grass carp ND2 qPCR assay to be 201 copies/reaction.
3.3. Mesocosm Validation
All samples collected from the ponds for three days prior to stocking the grass carp were tested with the modified ND2 grass carp assay [61] and a previously published bigheaded carp qPCR assay [60]. All samples were negative for invasive carp eDNA. Following the addition of grass carp to the mesocosms, all 500-mL filtered samples tested positive with the endogenous positive control and gBlock positive control. Furthermore, all extraction negative controls, and no template controls were negative for invasive carp eDNA as determined by both LAMP and qPCR.
We found that both the 500-mL and 50-mL sampling methods were effective at recovering grass carp eDNA with qPCR (Figure 1). We observed some positive detections for the 500-mL filtered samples from both ponds collected 24 h after adding the grass carp. In contrast, we did not observe any positive detections from the 50-mL samples collected from either pond until 48 h after grass carp addition (Figure 1). After three days, grass carp eDNA was reliably captured from the pond containing 33 carp using both sampling methods. For the pond containing 3 grass carp, 500-mL samples had a greater probability of capturing grass carp eDNA than those where only 50-mL was collected (Figure 1). This was a substantial difference as indicated by the mostly non-overlapping credible intervals on days 4-6, but otherwise both methods performed similarly.
3.4. LAMP vs. qPCR
Using qPCR, our initial analysis indicated that 1 out of 139 DNA extracts extracted with the Biomeme kit and 2 out of 69 DNA extracts extracted with the IBI kit may have been inhibited as evidenced by a 1-3 cycle delay in Cq found in 1 of the spiked replicates. We re-ran the qPCRs for those samples that resulted in expected Cq values for all three spiked wells for each sample. Therefore, we concluded that the initial flag was likely due to edge effects on the PCR plate and there was no PCR inhibition. We observed positive detections with qPCR in one sample from the pond containing three grass carp and in three samples from the pond containing 33 grass carp on Day 2 (24 h after grass carp introduction) and observed positive detections with LAMP in samples from both ponds on Day 3 (48 h after grass carp introduction) (Figure 2). We observed a consistently higher probability of detection in both ponds with qPCR than LAMP, as we observed positive detections with qPCR in every sample collected from the pond containing 33 grass carp from Day 2 on (Figure 2). We also observed consistent detections for samples collected from the pond containing 33 grass carp with LAMP with the probability of detection being from <0.25 to <0.75 per day from Day 3 on, while the probability of detection was from >0.63 to >0.75 for the same time period for qPCR (Figure 2). We only were able to detect target eDNA in two samples collected from the pond containing three grass carp with LAMP throughout the duration of the study.
3.5. Accumulation of Grass Carp eDNA over Time
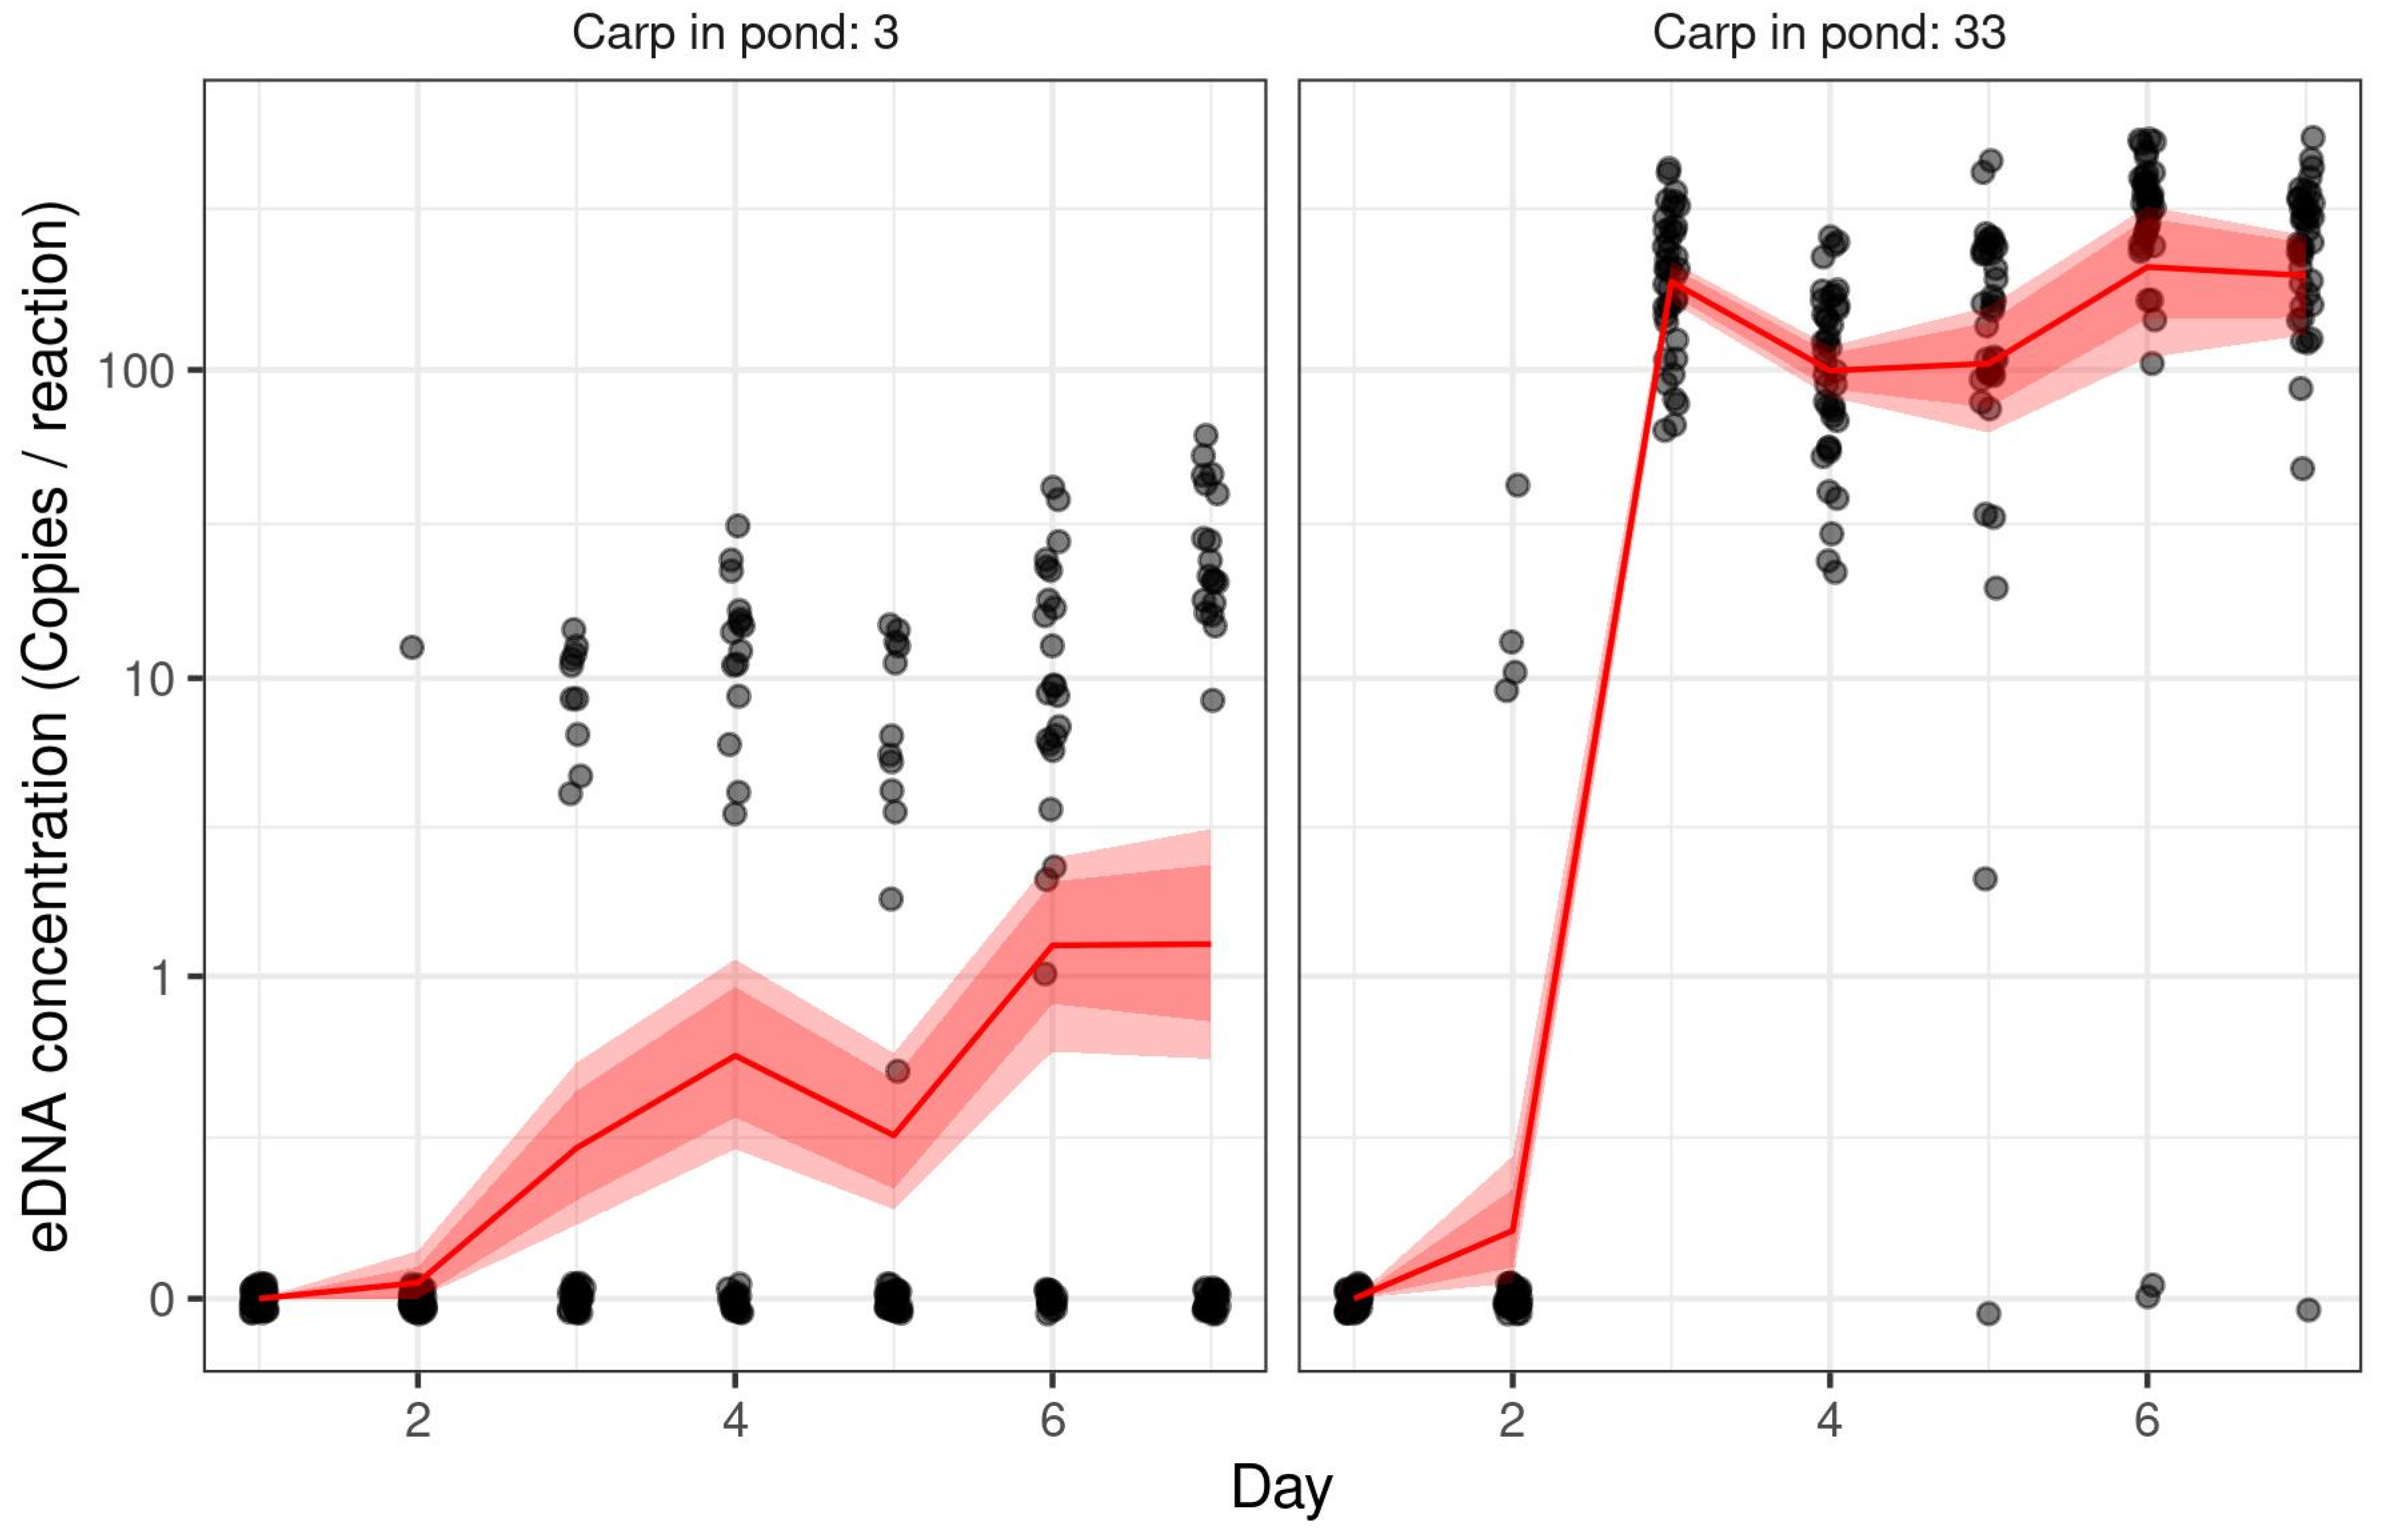
We observed an increase in our probability to capture eDNA in a sample over time (Figure 3). We also observed that eDNA was successfully captured in every sample collected from the pond containing 33 grass carp by Day 3; however our probability to capture eDNA in samples collected from the pond containing three grass carp continued to increase until Day 6 (Figure 3). When looking at the eDNA concentration as measured by qPCR, we can see that the pond containing 33 grass carp quickly became saturated by day 3 while the pond containing 3 grass carp continued to accumulate eDNA throughout the study period (Figure 4). This likely indicates that the pond containing three grass carp may not have reached eDNA concentration equilibrium by the end of our study despite our observed slight dip in sample capture probability on Day 7.
4. Discussion
In our mesocosm study, we initially detected grass carp eDNA using qPCR on Day 1 but detections were not consistent until Day 2. We detected grass carp with the LAMP assay on Day 3 of the experiment. However, our rates of detection were lower with LAMP than with qPCR throughout the experiment and were consistent with the results of our LOD analyses which indicated that the LAMP assay is less sensitive than the qPCR assay by two orders of magnitude. The lower detection rate we observed with the LAMP assay compared to the qPCR assay is also consistent with results observed by others comparing LAMP to qPCR. Lin et al. [43] found that using LAMP to diagnose toxoplasmosis required 10-fold higher DNA concentrations than qPCR, whereas Khan et al. [72] found that LAMP required 1000-fold higher DNA concentrations to detect fungal DNA than the corresponding qPCR assay. In contrast, Zhang et al. [73] found that LAMP, qPCR, and reverse transcriptase-qPCR were comparable in sensitivity for detecting Salmonella spp. in produce and both Okiro et al. [74] and Anklam et al. [75] found that LAMP and qPCR were comparable in sensitivity for detecting bacterial pathogens.
We observed more detections in the 33-grass carp pond than in the 3-grass carp pond with both LAMP and qPCR assays. When comparing the two grass carp treatments using qPCR with the 500-mL DNA extracts, we observed that the 33-grass carp pond yielded higher eDNA capture rates and higher probabilities of detection than the 3-grass carp pond. Our findings are consistent with earlier studies that found total fish biomass to be positively correlated with eDNA copy numbers [76,77,78,79,80]. When we compared sample volumes using qPCR, we observed more grass carp detections with the 500-mL filtered samples than with the 50 mL grab samples. The disparity in the number of eDNA detections is likely due to the volume of water sampled rather than differences in DNA extraction kit yields or sampling methodology. Our results are consistent with results from earlier work that examined the effect of sample volume on eDNA detection and found that numbers of detections increased with larger sample volumes [81,82]. However, the caveat to using larger sample volumes is that the possibility of PCR inhibition may increase with larger sample volume [82], but we observed little inhibition in our study when we ran qPCR with the 500-mL filtered samples. This was expected as the ponds were fed by well water and sources of known inhibitors were not present. We suggest that any positive LAMP or qPCR detections were from grass carp in the mesocosms and not from contaminants introduced with the fathead minnows or with fish food, because the fathead minnows were stocked and being fed 12 days prior to addition of the grass carp and we did not detect invasive carp in samples collected in the 3 days leading up to addition of the grass carp. Additionally, all of our samples from the initial sampling event (4 h after addition of the grass carp) produced negative results.
The flow rate of water into both ponds was set to the lowest setting in order to minimize eDNA loss from the system, but some eDNA may have been flushed out of the ponds and contributed to lower detection rates. DNA is readily flushed from lotic systems [83], while it is unevenly distributed in lentic systems [84]. We collected multiple samples per day per pond, because eDNA is unevenly distributed throughout the water column. Although we initially sampled the ponds four hours after adding the grass carp on Day 1, it is unlikely that it was sufficient time for grass carp eDNA to build up to detectable levels and disperse in the ponds. The pond containing 33 grass carp rapidly increased eDNA concentration and became saturated on Day 3 also resulting in a 100% eDNA sample capture rate from then on. The pond containing 3 grass carp had continuously increasing eDNA concentration throughout our study period, and therefore we cannot know for certain if the pond reached equilibrium or if the eDNA concentration may have continued to increase. Had we continued the study for longer, this determination could be made. As would be indicated by the results from the pond containing 33 grass carp, had the eDNA concentration continued to rise, we may have expected greater detection rates with the LAMP assay. Maruyama et al. [85,86] observed that eDNA concentrations in tanks containing blue gill (Lepomis macrochirus) reached equilibrium on Day 4 of the experiment. Our goal when selecting the grass carp densities to sample was to test the practical limits of our assay and sampling method in an open water application. We achieved that goal as shown by the sparse detections with LAMP in the pond containing 3 grass carp and imperfect grass carp detections in the pond containing 33 grass carp. For an application like testing bait tanks, we would expect the density to be greater than in our ponds. For an application like testing farm ponds where live bait may be grown, the density could be similar or less depending on the rearing conditions. In other natural environments where one might use eDNA testing, we would expect the densities to be less than what we tested. Such practical limitations can be pushed further by increased sampling, but this would ideally be accompanied with appropriate modeling to verify that the sampling was adequate to meet the objectives.
Several factors may affect the rates of eDNA detection of fish including fish biomass [76,78], stress levels [76], water temperature [87], and feeding and waste excretion [29,76,78]. Our results using both LAMP and qPCR agree with the findings regarding biomass of Takahara et al. [76] using common carp and Klymus et al. [78] using bighead and silver carp where they found that greater biomass was correlated with greater amounts of total DNA being shed. Although potential physiological stress response post handling may increase DNA shedding [76], the process of moving fish into our ponds did not result in a detectable spike in eDNA detections when we sampled the ponds 4 and 24 h after grass carp addition. Warm water temperatures increase rates of fish metabolism and DNA-shedding up to a point [88], but the temperature of the well water flowing into our ponds was 12 °C which is well below the 25.3 °C preferred temperature for grass carp [89] and may have reduced rates of DNA shedding. Temperatures below 14 °C have been reported to decrease feeding by grass carp [87], so the water temperature in our ponds may have reduced grass carp feeding and slowed the rate of DNA shedding through waste excretion. Although grass carp and fathead minnows were fed every three days in our study, we did not observe any spikes in eDNA detection after feeding.
Portable DNA extraction kits are easy to use and have made eDNA analysis possible in the field. However, they are reported to be less efficient than laboratory-based DNA extraction kits at removing inhibitors that can affect PCR amplification [90,91]. Inhibition may be an issue if the DNA extracts are to be used for PCR or qPCR, so inhibitors may need to be removed prior to analysis. Inhibition is less of a factor when using LAMP as the reactions are more robust than PCR or qPCR and less likely to be affected by inhibitors present in eDNA extracts [92,93]. In some situations, the step of DNA extraction can be completely eliminated when using LAMP [34]. We did not feel it was necessary to test for LAMP inhibition because we used clean well water to fill the ponds and ran an endogenous positive control as part of the LAMP assay which we would expect to fail had the samples been inhibited for LAMP. However, we tested for inhibition with the modified grass carp ND2 qPCR assay using the same DNA extracts as part of our laboratory’s standard operating procedure for qPCR. Future work is planned to test for inhibition with the invasive carp LAMP assay in the field.
A potential use for the LAMP assay is to screen live bait for the presence of juvenile invasive carp, as contaminated live bait contributes to the introduction of aquatic invasive species throughout the United States and Canada [63,94,95,96,97]. Minnows sold as live bait are often caught in the wild and held in holding ponds until distribution. The live bait is then considered “farm-raised” but may contain juveniles of invasive species that are difficult to distinguish from minnow species permitted for use as live bait [98]. Litvak and Mandrak [94] sampled live bait from bait shops in Toronto, Ontario, Canada and found a total of 28 fish species in live bait, including 6 species that were illegal to sell as bait. Snyder et al. [99] observed similar results using metabarcoding to analyze eDNA extracted from water samples collected from bait and pond shops in Ohio and Michigan, USA, and detected 11 aquatic invasive species including bighead and silver carp. Furthermore, surveys of anglers purchasing live bait in Ontario, Canada found that 41% of anglers said that they released leftover bait when they were done fishing and 56% responded that they were unaware that releasing live bait was illegal in the province [94]. Several states in the US have passed laws against the release of live bait, but Kilian et al. [96] found that 65% of anglers in Maryland released leftover live fish baits while 69% released leftover live crayfish used for bait. Our LAMP assay could be used to screen water from ponds used to raise live bait or from tanks containing live bait in bait shops as an initial screening tool to test for the presence of invasive carp. Further confirmation can be done with qPCR in the laboratory. Although all four of the targeted invasive carp species are problematic, cases are conceivable in which one would want to test water where one or two of the target species are known to be present but with the intention to keep the other species out. Therefore, additional permutations of the assay with different primers targeting single species or excluding particular species remains an ongoing effort.
The AC1 LAMP assay presented here can be used to rapidly detect any of the four invasive carp species in the field. Although the assay does not identify any eDNA detected to species, it does allow for analyzing eDNA in the field using a point-of-use isothermal instrument immediately following sample collection thereby enabling a response in near real time. Because the LAMP assay is not as sensitive as qPCR and numerous samples are requires for reliable and informative detection due to the stochastic distribution of eDNA in the environment, the LAMP method should not be viewed as a replacement for more common eDNA practices or for working with an experienced laboratory. We demonstrated that under the right circumstances the LAMP assay performed well and showed promise. The right circumstances could be considered as follows: (1) the existence of a response or course of action that would be taken in response to a rapid result obtained on-site or nearby, (2) a situation where if invasive carp are present, their eDNA is likely present in high concentration, and (3) providing a screening tool where no other practical screening method presently exists. If a rapid response is not necessary, then the user will likely get better results using a higher throughput method with a more sensitive qPCR assay. Environmental DNA accumulates as fish are trapped in areas, and reported in the literature, as discussed above, and our study indicate that higher concentrations of fish will yield higher concentrations of eDNA. Lastly, the surveillance method can be considered appropriate for the consequences of that surveillance, and if absolute detection is critical, then the most sensitive methods warrant using. We propose that this method would be appropriate for niche uses such as for testing bait tanks or ponds, or prioritizing backwaters for control efforts. This method is easy to use and can go where more commonly used methods cannot.
5. Conclusions
Our LAMP assay is specific and sensitive for detection of the four target invasive carp species: silver carp, bighead carp, grass carp, and black carp. The LAMP assay is also easy to use, but it is not as sensitive as qPCR. Therefore, it is appropriate for niche uses where rapid results are needed at the point of sample collection and where reduced sensitivity is an acceptable tradeoff.
Author Contributions
Conceptualization, C.M.M.; Data curation, S.A.K., T.M.S. and R.A.E.; Formal analysis, S.A.K., M.R.H., R.A.E. and C.M.M.; Funding acquisition, C.M.M.; Investigation, S.A.K., T.T. and T.M.S.; Methodology, S.A.K., M.R.H., T.T., T.M.S., C.M.M. and R.A.E.; Project administration, S.A.K. and C.M.M.; Software, R.A.E.; Validation, S.A.K., M.R.H.,T.T. and C.M.M.; Writing—original draft, S.A.K., M.R.H., T.T., T.M.S., C.M.M. and R.A.E.; Writing—review and editing, S.A.K. and C.M.M. All authors have read and agreed to the published version of the manuscript.
Funding
This research was funded by the U. S. Geological Survey Ecosystems Mission Area Biological Threats Program.
Institutional Review Board Statement
Experimental procedures and vertebrate use approval were obtained from the UMESC Animal Care and Use Committee (protocol number AEH-16-EDNA-03) prior to testing.
Data Availability Statement
Our source code is published at https://doi.org/10.5066/P9NICB9V [69]. Data collected for this study are available at https://doi.org/10.5066/P9FOS091 [70]. The data release includes an RMarkdown file that lists the R session information as well as a Dockerfile to create an image with all of our versions.
Acknowledgments
We thank Justine Nelson, Todd Johnson, and Joel Putnam (US Geological Survey Upper Midwest Environmental Sciences Center) for assistance with mesocosms and in the laboratory, and the Fish Culture Crew at the Upper Midwest Environmental Sciences Center for assistance with pond maintenance and fish. Any use of trade, firm, or product names is for descriptive purposes only and does not imply endorsement by the U. S. Government.
Conflicts of Interest
The authors have no conflict of interest to declare.
References
- Pimentel, D.; Lach, L.; Zuniga, R.; Morrison, D. Environmental and economic costs of nonindigenous species in the United States. BioScience 2000, 50, 53–65. [Google Scholar] [CrossRef] [Green Version]
- Courtenay, W.R.; Robins, C.R. The grass carp enigma. BioScience 1972, 22, 210. [Google Scholar] [CrossRef]
- Burke, J.S.; Bayne, D.R.; Rea, H. Impact of silver and bighead carps on plankton communities of channel catfish ponds. Aquaculture 1986, 55, 59–68. [Google Scholar] [CrossRef]
- Lieberman, D.M. Use of silver carp (Hypophthalmichthys molotrix) and bighead carp (Aristichthys nobilis) for algae control in a small pond: Changes in water quality. J. Freshw. Ecol. 1996, 11, 391–397. [Google Scholar] [CrossRef]
- DiStefano, R.J.; Litvan, M.E.; Horner, P.T. The bait industry as a potential vector for alien crayfish introductions: Problem recognition by fisheries agencies and a Missouri evaluation. Fisheries 2009, 34, 586–597. [Google Scholar] [CrossRef]
- Drake, D.A.R.; Mandrak, N.E. Ecological risk of live bait fisheries: A new angle on selective fishing. Fisheries 2014, 39, 201–211. [Google Scholar] [CrossRef]
- Drake, D.A.R.; Mandrak, N.E. Bycatch, bait, anglers, and roads: Quantifying vector activity and propagule introduction risk across lake ecosystems. Ecol. Appl. 2014, 24, 877–894. [Google Scholar] [CrossRef]
- Mahon, A.R.; Nathan, L.R.; Jerde, C.L. Meta-genomic surveillance of invasive species in the bait trade. Conserv. Genet. Resour. 2014, 6, 563–567. [Google Scholar] [CrossRef]
- Strecker, A.L.; Campbell, P.M.; Olden, J.D. The aquarium trade as an invasion pathway in the Pacific Northwest. Fisheries 2011, 36, 74–85. [Google Scholar] [CrossRef] [Green Version]
- Patoka, J.; Magalhães, A.L.B.; Kouba, A.; Faulkes, Z.; Jerikho, R.; Vitule, J.R.S. Invasive aquatic pets: Failed policies increase risks of harmful invasions. Biodivers. Conser. 2018, 27, 3037–3046. [Google Scholar] [CrossRef]
- Schloesser, D.W.; Metcalfe-Smith, J.L.; Kovalak, W.P.; Longton, G.D.; Smithee, R.D. Extirpation of freshwater mussels (Bivalvia: Unionidae) following the invasion of dreissenid mussels in an interconnecting river of the Laurentian Great Lakes. Am. Midl. Nat. 2006, 155, 307–320. [Google Scholar] [CrossRef]
- Chakraborti, R.K.; Madon, S.; Kaur, J. Costs for controlling dreissenid mussels affecting drinking water infrastructure: Case studies. J. Am. Water Works Assoc. 2016, 108, E442–E453. [Google Scholar] [CrossRef]
- Prescott, T.H.; Claudi, R.; Prescott, K.L. Impact of dreissenid mussels on the infrastructure of dams and hydroelectric power plants. In Quagga and Zebra Mussels: Biology, Impacts, and Control; Nalepa, T.F., Schloesser, D.W., Eds.; CRC Press: Boca Raton, FL, USA, 2013; pp. 315–329. [Google Scholar]
- Department of Interior, U.S. Fish and Wildlife Service. Injurious Wildlife Species; Listing the Bighead Carp (Hypophthalmichthys nobilis) as Injurious Fish; Department of Interior, U.S. Fish and Wildlife Service: Fairfax, VA, USA, 2011; Volume 50, CFR Part 16, RIN 1018-AT49.
- Department of Interior, U.S. Fish and Wildlife Service. Injurious Wildlife Species; Silver Carp (Hypophthalmichthys molitrix) and Largescale Silver Carp (Hypophthalmichthys harmandi); Department of Interior, U.S. Fish and Wildlife Service: Fairfax, VA, USA, 2007; Volume 50, CFR Part 16, RIN 1018–AT29.
- Department of the Interior, U.S. Fish and Wildlife Service. Injurious Wildlife Species; Black Carp (Mylopharyngodon piceus); Department of Interior, U.S. Fish and Wildlife Service: Fairfax, VA, USA, 2007; Volume 50, CFR Part 16, RIN 1018-AG70.
- US Army Corps of Engineers. The Great Lakes and Mississippi River Interbasin Study—Brandon Road Final Integrated Feasibility Study and Environmental Impact Statement—Will County, Illinois; U.S. Army Corps of Engineers: Chicago, IL, USA, 2018; 516p. [Google Scholar]
- Mack, R.N. Invading Plants: Their Potential Contribution to Population Biology. In Studies on Plant Demography: A Festschrift for John L. Harper; White, J., Ed.; Academic Press: Cambridge, MA, USA, 1985; pp. 127–142. [Google Scholar]
- Kowarik, I. Time lags in biological invasions with regard to the success and failure of alien species. In Plant Invasions-General Aspects and Special Problems; Pysek, P., Prach, K., Rejmanek, M., Wade, M., Eds.; Academic Publishing: Amsterdam, The Netherlands, 1995; pp. 15–38. [Google Scholar]
- Sakai, A.K.; Allendorf, F.W.; Holt, J.S.; Lodge, D.M.; Molofsky, J.; With, K.A.; Baughman, S.; Cabin, R.J.; Cohen, J.E.; Ellstrand, N.C.; et al. The population biology of invasive species. Annu. Rev. Ecol. Syst. 2001, 32, 305–332. [Google Scholar] [CrossRef] [Green Version]
- Mehta, S.V.; Haight, R.G.; Homans, F.R.; Polasky, S.; Venette, R.C. Optimal detection and control strategies for invasive species management. Ecol. Econ. 2007, 61, 237–245. [Google Scholar] [CrossRef]
- Vander Zanden, M.J.; Hansen, G.J.A.; Higgins, S.N.; Kornis, M.S. A pound of prevention, plus a pound of cure: Early detection and eradication of invasive species in the Laurentian Great Lakes. J. Gt. Lakes Res. 2010, 36, 199–205. [Google Scholar] [CrossRef]
- Hayes, K.R.; Cannon, R.; Neil, K.; Inglis, G. Sensitivity and cost considerations for the detection and eradication of marine pests in ports. Mar. Pollut. Bull. 2005, 50, 823–834. [Google Scholar] [CrossRef]
- Jerde, C.L.; Mahon, A.R.; Chadderton, W.L.; Lodge, D.M. “Sight-unseen” detection of rare aquatic species using environmental DNA. Conserv. Lett. 2011, 4, 150–157. [Google Scholar] [CrossRef]
- Piaggio, A.J.; Engeman, R.M.; Hopken, M.W.; Humphrey, J.S.; Keacher, K.L.; Bruce, W.E.; Avery, M.L. Detecting an elusive invasive species: A diagnostic pcr to detect burmese python in Florida waters and an assessment of persistence of environmental DNA. Mol. Ecol. Resour. 2014, 14, 374–380. [Google Scholar] [CrossRef] [Green Version]
- Erickson, R.A.; Merkes, C.M.; Mize, E.L. Sampling designs for landscape-level eDNA monitoring programs. Integr. Environ. Assess. Manag. 2019, 15, 760–771. [Google Scholar] [CrossRef]
- Lor, Y.; Schreier, T.M.; Waller, D.L.; Merkes, C.M. Using environmental DNA (eDNA) to detect the endangered spectaclecase mussel (Margaritifera monodonta). Freshw. Sci. 2020, 39, 837–847. [Google Scholar] [CrossRef]
- Morisette, J.; Burgiel, S.; Brantley, K.; Daniel, W.M.; Darling, J.; Davis, J.; Franklin, T.; Gaddis, K.; Hunter, M.; Lance, R.; et al. Strategic considerations for invasive species managers in the utilization of environmental DNA (eDNA): Steps for incorporating this powerful surveillance tool. Manag. Biol. Invasions 2021, 12, 747–775. [Google Scholar] [CrossRef] [PubMed]
- Ficetola, G.F.; Miaud, C.; Pompanon, F.; Taberlet, P. Species detection using environmental DNA from water samples. Biol. Lett. 2008, 4, 423–425. [Google Scholar] [CrossRef] [PubMed] [Green Version]
- Goldberg, C.S.; Pilliod, D.S.; Arkle, R.S.; Waits, L.P. Molecular detection of vertebrates in stream water: A demonstration using Rocky Mountain tailed frogs and Idaho giant salamanders. PLoS ONE 2011, 6, e22746. [Google Scholar] [CrossRef] [PubMed]
- Guan, X.; Monroe, E.M.; Bockrath, K.D.; Mize, E.L.; Rees, C.B.; Lindsay, D.L.; Baerwaldt, K.L.; Nico, L.G.; Lance, R.F. Environmental DNA (eDNA) assays for invasive populations of black carp in North America. Trans. Am. Fish. Soc. 2019, 148, 1043–1055. [Google Scholar] [CrossRef] [Green Version]
- Hayer, C.-A.; Bayless, M.F.; George, A.; Thompson, N.; Richter, C.A.; Chapman, D.C. Use of environmental DNA to detect grass carp spawning events. Fishes 2020, 5, 27. [Google Scholar] [CrossRef]
- Notomi, T.; Okayama, H.; Masubuchi, H.; Yonekawa, T.; Watanabe, K.; Amino, N.; Hase, T. Loop-mediated isothermal amplification of DNA. Nucleic Acids Res. 2000, 28, e63. [Google Scholar] [CrossRef] [Green Version]
- Kaneko, H.; Kawana, T.; Fukushima, E.; Suzutani, T. Tolerance of loop-mediated isothermal amplification to a culture medium and biological substances. J. Biochem. Biophys. Methods 2007, 70, 499–501. [Google Scholar] [CrossRef]
- Francois, P.; Tangomo, M.; Hibbs, J.; Bonetti, E.-J.; Boehme, C.C.; Notomi, T.; Perkins, M.D.; Schrenzel, J. Robustness of a loop-mediated isothermal amplification reaction for diagnostic applications. FEMS Immunol. Med. Microbiol. 2011, 62, 41–48. [Google Scholar] [CrossRef] [Green Version]
- Yang, Q.; Wang, F.; Prinyawiwatkul, W.; Ge, B. Robustness of Salmonella loop-mediated isothermal amplification assays for food applications. J. Appl. Microbiol. 2014, 116, 81–88. [Google Scholar] [CrossRef]
- Kurosaki, Y.; Takada, A.; Ebihara, H.; Grolla, A.; Kamo, N.; Feldmann, H.; Kawaoka, Y.; Yasuda, J. Rapid and simple detection of Ebola virus by reverse transcription-loop-mediated isothermal amplification. J. Virol. Methods 2007, 141, 78–83. [Google Scholar] [CrossRef]
- Sirichaisinthop, J.; Buates, S.; Watanabe, R.; Han, E.-T.; Suktawonjaroenpon, W.; Krasaesub, S.; Takeo, S.; Tsuboi, T.; Sattabongkot, J. Evaluation of loop-mediated isothermal amplification (LAMP) for malaria diagnosis in a field setting. Am. J. Trop. Med. Hyg. 2011, 85, 594–596. [Google Scholar] [CrossRef] [PubMed] [Green Version]
- Ahn, S.J.; Baek, Y.H.; Lloren, K.K.S.; Choi, W.-S.; Jeong, J.H.; Antigua, K.J.C.; Kwon, H.; Park, S.-J.; Kim, E.-H.; Kim, Y.; et al. Rapid and simple colorimetric detection of multiple influenza viruses infecting humans using a reverse transcriptional loop-mediated isothermal amplification (RT-LAMP) diagnostic platform. BMC Infect. Dis. 2019, 19, 676. [Google Scholar] [CrossRef] [Green Version]
- Park, G.-S.; Ku, K.; Baek, S.-H.; Kim, S.-J.; Kim, S.I.; Kim, B.-T.; Maeng, J.-S. Development of reverse transcription loop-mediated isothermal amplification assays targeting severe acute respiratory syndrome coronavirus 2 (SARS-CoV-2). J. Mol. Diagn. 2020, 22, 729–735. [Google Scholar] [CrossRef] [PubMed]
- Kang, J.-I.; Park, N.-Y.; Cho, H.-S. Detection of canine parvovirus in fecal samples using loop-mediated isothermal amplification. J. Vet. Diagn. Investig. 2006, 18, 81–84. [Google Scholar] [CrossRef] [PubMed] [Green Version]
- Chen, C.; Cui, S. Detection of porcine parvovirus by loop-mediated isothermal amplification. J. Virol. Methods 2009, 155, 122–125. [Google Scholar] [CrossRef] [PubMed]
- Lin, Z.; Zhang, Y.; Zhang, H.; Zhou, Y.; Cao, J.; Zhou, J. Comparison of loop-mediated isothermal amplification (LAMP) and real-time PCR method targeting a 529-bp repeat element for diagnosis of toxoplasmosis. Vet. Parasitol. 2012, 185, 296–300. [Google Scholar] [CrossRef] [PubMed]
- Tomlinson, J.A.; Boonham, N.; Dickinson, M. Development and evaluation of a one-hour DNA extraction and loop-mediated isothermal amplification assay for rapid detection of phytoplasmas. Plant Pathol. 2010, 59, 465–471. [Google Scholar] [CrossRef]
- Niu, J.H.; Jian, H.; Guo, Q.X.; Chen, C.L.; Wang, X.Y.; Liu, Q.; Guo, Y.D. Evaluation of loop-mediated isothermal amplification (LAMP) assays based on 5S rDNA-IGS2 regions for detecting Meloidogyne enterolobii. Plant Pathol. 2012, 61, 809–819. [Google Scholar] [CrossRef]
- Kyei-Poku, G.; Gauthier, D.; Quan, G. Development of a loop-mediated isothermal amplification assay as an early-warning tool for detecting emerald ash borer (Coleoptera: Buprestidae) incursions. J. Econ. Entomol. 2020, 113, 2480–2494. [Google Scholar] [CrossRef]
- Zhou, D.; Guo, J.; Xu, L.; Gao, S.; Lin, Q.; Wu, Q.; Wu, L.; Que, Y. Establishment and application of a loop-mediated isothermal amplification (LAMP) system for detection of Cry1Ac transgenic sugarcane. Sci. Rep. 2014, 4, 4912. [Google Scholar] [CrossRef] [Green Version]
- Abdulmawjood, A.; Grabowski, N.; Fohler, S.; Kittler, S.; Nagengast, H.; Klein, G. Development of loop-mediated isothermal amplification (LAMP) assay for rapid and sensitive identification of ostrich meat. PLoS ONE 2014, 9, e100717. [Google Scholar] [CrossRef] [PubMed] [Green Version]
- Aartse, A.; Scholtens, I.M.J.; van der A, H.J.G.; Boersma-Greve, M.M.; Prins, T.W.; van Ginkel, L.A.; Kok, E.J.; Bovee, T.F.H. Evaluation of a loop-mediated isothermal amplification (lamp) method for rapid on-site detection of horse meat. Food Control 2017, 81, 9–15. [Google Scholar] [CrossRef]
- Sul, S.; Kim, M.-J.; Kim, H.-Y. Development of a direct loop-mediated isothermal amplification (LAMP) assay for rapid and simple on-site detection of chicken in processed meat products. Food Control 2019, 98, 194–199. [Google Scholar] [CrossRef]
- Da Silva, S.J.R.; Pardee, K.; Pena, L. Loop-mediated isothermal amplification (LAMP) for the diagnosis of Zika virus: A review. Viruses 2020, 12, 19. [Google Scholar] [CrossRef] [Green Version]
- Nakajima, N.; Sakamoto, Y.; Goka, K. Rapid detection of the red fire ant Solenopsis invicta (Hymenoptera: Formicidae) by loop-mediated isothermal amplification. Appl. Entomol. Zool. 2019, 54, 319–322. [Google Scholar] [CrossRef] [Green Version]
- Centeno-Cuadros, A.; Abbasi, I.; Nathan, R. Sex determination in the wild: A field application of loop-mediated isothermal amplification successfully determines sex across three raptor species. Mol. Ecol. Resour. 2017, 17, 153–160. [Google Scholar] [CrossRef] [Green Version]
- Williams, M.R.; Stedtfeld, R.D.; Engle, C.; Salach, P.; Fakher, U.; Stedtfeld, T.; Dreelin, E.; Stevenson, R.J.; Latimore, J.; Hashsham, S.A. Isothermal amplification of environmental DNA (eDNA) for direct field-based monitoring and laboratory confirmation of Dreissena sp. PLoS ONE 2017, 12, e0186462. [Google Scholar] [CrossRef]
- Williams, K.E.; Huyvaert, K.P.; Piaggio, A.J. Clearing muddied waters: Capture of environmental DNA from turbid waters. PLoS ONE 2017, 12, e0179282. [Google Scholar] [CrossRef]
- Abbaszadegan, M.; Huber, M.; Gerba, C.; Pepper, L. Detection of enteroviruses in groundwater with the polymerase chain reaction. Appl. Environ. Microbiol. 1993, 59, 1318–1324. [Google Scholar] [CrossRef] [Green Version]
- Ijzerman, M.M.; Dahling, D.R.; Fout, G.S. A method to remove environmental inhibitors prior to the detection of waterborne enteric viruses by reverse transcription-polymerase chain reaction. J. Virol. Methods 1997, 63, 145–153. [Google Scholar] [CrossRef]
- Matheson, C.; Gurney, C.; Esau, N.; Lehto, R. Assessing PCR inhibition from humic substances. Open Enzym. Inhib. J. 2010, 3, 38. [Google Scholar] [CrossRef] [Green Version]
- Farrington, H.L.; Edwards, C.E.; Guan, X.; Carr, M.R.; Baerwaldt, K.; Lance, R.F. Mitochondrial genome sequencing and development of genetic markers for the detection of DNA of invasive bighead and silver carp (Hypophthalmichthys nobilis and H. molitrix) in environmental water samples from the United States. PLoS ONE 2015, 10, e0117803. [Google Scholar] [CrossRef] [PubMed] [Green Version]
- Erickson, R.A.; Merkes, C.M.; Jackson, C.A.; Goforth, R.R.; Amberg, J.J. Seasonal trends in eDNA detection and occupancy of bigheaded carps. J. Gt. Lakes Res. 2017, 43, 762–770. [Google Scholar] [CrossRef]
- Mahon, A.R.; Jerde, C.L.; Galaska, M.; Bergner, J.L.; Chadderton, W.L.; Lodge, D.M.; Hunter, M.E.; Nico, L.G. Validation of eDNA surveillance sensitivity for detection of Asian carps in controlled and field experiments. PLoS ONE 2013, 8, e58316. [Google Scholar] [CrossRef] [PubMed] [Green Version]
- Roy, M.; Belliveau, V.; Mandrak, N.E.; Gagné, N. Development of environmental DNA (eDNA) methods for detecting high-risk freshwater fishes in live trade in Canada. Biol. Invasions 2018, 20, 299–314. [Google Scholar] [CrossRef]
- Nathan, L.R.; Jerde, C.L.; Budny, M.L.; Mahon, A.R. The use of environmental DNA in invasive species surveillance of the Great Lakes commercial bait trade. Conserv. Biol. 2015, 29, 430–439. [Google Scholar] [CrossRef]
- Klymus, K.E.; Merkes, C.M.; Allison, M.J.; Goldberg, C.S.; Helbing, C.C.; Hunter, M.E.; Jackson, C.A.; Lance, R.F.; Mangan, A.M.; Monroe, E.M.; et al. Reporting the limits of detection and quantification for environmental DNA assays. Environ. DNA 2020, 2, 271–282. [Google Scholar] [CrossRef] [Green Version]
- R Core Team. R: A Language and Environment for Statistical Computing; R Foundation for Statistical Computing: Vienna, Austria, 2020. [Google Scholar]
- Dorazio, R.M.; Erickson, R.A. Ednaoccupancy: An R package for multiscale occupancy modelling of environmental DNA data. Mol. Ecol. Resour. 2017, 18, 368–380. [Google Scholar] [CrossRef]
- Mize, E.L.; Erickson, R.A.; Merkes, C.M.; Berndt, N.; Bockrath, K.; Credico, J.; Grueneis, N.; Merry, J.; Mosel, K.; Tuttle-Lau, M.; et al. Refinement of eDNA as an early monitoring tool at the landscape-level: Study design considerations. Ecol. Appl. 2019, 29, e01951. [Google Scholar] [CrossRef]
- Stan Development Team. RStan: The R Interface to Stan, Version 2.21.2; 2020. Available online: http://mc-stan.org/ (accessed on 15 November 2022).
- Erickson, R.A.; Kageyama, S.A. Analysis of Grass Carp eDNA Data, U.S. Geological Survey Software Release; U.S. Geological Survey: Reston, VA, USA, 2022. [CrossRef]
- Kageyama, S.A.; Hoogland, M.R.; Tajjioui, T.; Schreier, T.M.; Erickson, R.A.; Merkes, C.M. Data Release for Validation of a Portable eDNA Detection Kit for Invasive Carps: U.S. Geological Survey Data Release; U.S. Geological Survey: Reston, VA, USA, 2022. [CrossRef]
- Wickham, H.; Navarro, D.; Pedersen, T.L. ggplot2: Elegant Graphics for Data Analysis; Springer: New York, NY, USA, 2016. [Google Scholar]
- Khan, M.; Wang, R.; Li, B.; Liu, P.; Weng, Q.; Chen, Q. Comparative evaluation of the LAMP assay and PCR-based assays for the rapid detection of Alternaria solani. Front. Microbiol. 2018, 9, 2089. [Google Scholar] [CrossRef] [Green Version]
- Zhang, X.; Lowe, S.B.; Gooding, J.J. Brief review of monitoring methods for loop-mediated isothermal amplification (LAMP). Biosens. Bioelectron. 2014, 61, 491–499. [Google Scholar] [CrossRef]
- Okiro, L.A.; Tancos, M.A.; Nyanjom, S.G.; Smart, C.D.; Parker, M.L. Comparative evaluation of LAMP, qPCR, conventional PCR, and ELISA to detect Ralstonia solanacearum in Kenyan potato fields. Plant Dis. 2019, 103, 959–965. [Google Scholar] [CrossRef] [PubMed] [Green Version]
- Anklam, K.; Kulow, M.; Yamazaki, W.; Döpfer, D. Development of real-time PCR and loop-mediated isothermal amplification (LAMP) assays for the differential detection of digital dermatitis associated treponemes. PLoS ONE 2017, 12, e0178349. [Google Scholar] [CrossRef] [PubMed] [Green Version]
- Takahara, T.; Minamoto, T.; Yamanaka, H.; Doi, H.; Kawabata, Z. Estimation of fish biomass using environmental DNA. PLoS ONE 2012, 7, e35868. [Google Scholar] [CrossRef] [PubMed] [Green Version]
- Jane, S.F.; Wilcox, T.M.; McKelvey, K.S.; Young, M.K.; Schwartz, M.K.; Lowe, W.H.; Letcher, B.H.; Whiteley, A.R. Distance, flow and PCR inhibition: eDNA dynamics in two headwater streams. Mol. Ecol. Resour. 2015, 15, 216–227. [Google Scholar] [CrossRef]
- Klymus, K.E.; Richter, C.A.; Chapman, D.C.; Paukert, C. Quantification of eDNA shedding rates from invasive bighead carp Hypophthalmichthys nobilis and silver carp Hypophthalmichthys molitrix. Biol. Conserv. 2015, 183, 77–84. [Google Scholar] [CrossRef]
- Doi, H.; Uchii, K.; Takahara, T.; Matsuhashi, S.; Yamanaka, H.; Minamoto, T. Use of droplet digital PCR for estimation of fish abundance and biomass in environmental DNA surveys. PLoS ONE 2015, 10, e0122763. [Google Scholar] [CrossRef] [Green Version]
- Coulter, D.P.; Wang, P.; Coulter, A.A.; Van Susteren, G.E.; Eichmiller, J.J.; Garvey, J.E.; Sorensen, P.W. Nonlinear relationship between silver carp density and their eDNA concentration in a large river. PLoS ONE 2019, 14, e0218823. [Google Scholar] [CrossRef] [PubMed]
- Schultz, M.T.; Lance, R.F. Modeling the sensitivity of field surveys for detection of environmental DNA (eDNA). PLoS ONE 2015, 10, e0141503. [Google Scholar] [CrossRef] [Green Version]
- Sepulveda, A.J.; Schabacker, J.; Smith, S.; Al-Chokhachy, R.; Luikart, G.; Amish, S.J. Improved detection of rare, endangered and invasive trout in using a new large-volume sampling method for eDNA capture. Environ. DNA 2019, 1, 227–237. [Google Scholar] [CrossRef]
- Rees, H.C.; Maddison, B.C.; Middleditch, D.J.; Patmore, J.R.M.; Gough, K.C. REVIEW: The detection of aquatic animal species using environmental DNA—A review of eDNA as a survey tool in ecology. J. Appl. Ecol. 2014, 51, 1450–1459. [Google Scholar] [CrossRef]
- Eichmiller, J.J.; Bajer, P.G.; Sorensen, P.W. The relationship between the distribution of common carp and their environmental DNA in a small lake. PLoS ONE 2014, 9, e112611. [Google Scholar] [CrossRef] [Green Version]
- Maruyama, A.; Nakamura, K.; Yamanaka, H.; Kondoh, M.; Minamoto, T. The release rate of environmental DNA from juvenile and adult fish. PLoS ONE 2014, 9, e114639. [Google Scholar] [CrossRef] [PubMed] [Green Version]
- Maruyama, A.; Nakamura, K.; Yamanaka, H.; Kondoh, M.; Minamoto, T. Correction: The release rate of environmental DNA from juvenile and adult fish. PLoS ONE 2019, 14, e0212145. [Google Scholar] [CrossRef] [PubMed]
- Colle, D.E.; Shireman, J.V.; Rottmann, R.W. Food selection by grass carp fingerlings in a vegetated pond. Trans. Am. Fish. Soc. 1978, 107, 149–152. [Google Scholar] [CrossRef]
- Cui, Y.; Wootton, R.J. Bioenergetics of growth of a cyprinid, Phoxinus phoxinus: The effect of ration, temperature and body size on food consumption, faecal production and nitrogenous excretion. J. Fish Biol. 1988, 33, 431–443. [Google Scholar] [CrossRef]
- Bettoli, P.W.; Neill, W.H.; Kelsch, S.W. Temperature preference and heat resistance of grass carp, Ctenopharyngodon idella (Valenciennes), bighead carp, Hypophthalmichthys nobilis (Gray), and their F1 hybrid. J. Fish Biol. 1985, 27, 239–247. [Google Scholar] [CrossRef]
- Sepulveda, A.J.; Hutchins, P.R.; Massengill, R.L.; Dunker, K.J. Tradeoffs of a portable, field-based environmental DNA platform for detecting invasive northern pike (Esox lucius) in Alaska. Manag. Biol. Invasions 2018, 9, 253–258. [Google Scholar] [CrossRef]
- Thomas, A.C.; Tank, S.; Nguyen, P.L.; Ponce, J.; Sinnesael, M.; Goldberg, C.S. A system for rapid eDNA detection of aquatic invasive species. Environ. DNA 2020, 2, 261–270. [Google Scholar] [CrossRef] [Green Version]
- Enosawa, M.; Kageyama, S.; Sawai, K.; Watanabe, K.; Notomi, T.; Onoe, S.; Mori, Y.; Yokomizo, Y. Use of loop-mediated isothermal amplification of the IS900 sequence for rapid detection of cultured Mycobacterium avium subsp. paratuberculosis. J. Clin. Microbiol. 2003, 41, 4359–4365. [Google Scholar] [CrossRef] [Green Version]
- Kiddle, G.; Hardinge, P.; Buttigieg, N.; Gandelman, O.; Pereira, C.; McElgunn, C.J.; Rizzoli, M.; Jackson, R.; Appleton, N.; Moore, C.; et al. GMO detection using a bioluminescent real time reporter (BART) of loop mediated isothermal amplification (LAMP) suitable for field use. BMC Biotechnol. 2012, 12, 15. [Google Scholar] [CrossRef] [PubMed] [Green Version]
- Litvak, M.K.; Mandrak, N.E. Ecology of freshwater baitfish use in Canada and the United States. Fisheries 1993, 18, 6–13. [Google Scholar] [CrossRef]
- Ludwig, H.R., Jr.; Leitch, J.A. Interbasin transfer of aquatic biota via anglers’ bait buckets. Fisheries 1996, 21, 14–18. [Google Scholar] [CrossRef]
- Kilian, J.V.; Klauda, R.J.; Widman, S.; Kashiwagi, M.; Bourquin, R.; Weglein, S.; Schuster, J. An assessment of a bait industry and angler behavior as a vector of invasive species. Biol. Invasions 2012, 14, 1469–1481. [Google Scholar] [CrossRef]
- Anderson, L.G.; White, P.C.L.; Stebbing, P.D.; Stentiford, G.D.; Dunn, A.M. Biosecurity and vector behaviour: Evaluating the potential threat posed by anglers and canoeists as pathways for the spread of invasive non-native species and pathogens. PLoS ONE 2014, 9, e92788. [Google Scholar] [CrossRef] [PubMed]
- Conover, G.; Simmonds, R.; Whalen, M. Management and Control Plan for Bighead, Black, Grass, and Silver Carps in the United States; Asian Carp Working Group, Aquatic Nuisance Species Task Force: Washington, DC, USA, 2007; 223p.
- Snyder, M.R.; Stepien, C.A.; Marshall, N.T.; Scheppler, H.B.; Black, C.L.; Czajkowski, K.P. Detecting aquatic invasive species in bait and pond stores with targeted environmental (e)DNA high-throughput sequencing metabarcode assays: Angler, retailer, and manager implications. Biol. Conserv. 2020, 245, 108430. [Google Scholar] [CrossRef]
Figure 1.
Probability of sample capture (Θ) over time. The probability of capturing Grass Carp eDNA within a sample is modeled for each pond using occupancy modeling with 80% credible intervals shown by dark shading and 95% credible intervals shown by light shading. Square points represent individual samples jittered around 0 (did not capture target eDNA) or 1 (did capture target eDNA). Points are jittered randomly to avoid overlap using ggplot2 [71]. The data are color coded by which sampling method was used: red = 50-mL Centrifuged, blue = 500-mL Filtered.

Figure 2.
Probability of detection (p) grass carp eDNA by LAMP and qPCR over time. The probability of detection within an analytical replicate is modeled for each pond using occupancy modeling with 80% credible intervals shown in dark shading and 95% credible intervals shown in light shading. Square points represent the positivity rate for individual samples jittered around the observed values (0, 0.2, 0.4, 0.6, 0.8, or 1 for LAMP and 0, 0.25, 0.5, 0.75, or 1 for qPCR). The data are color coded by analytical method used: red = LAMP, blue = qPCR.
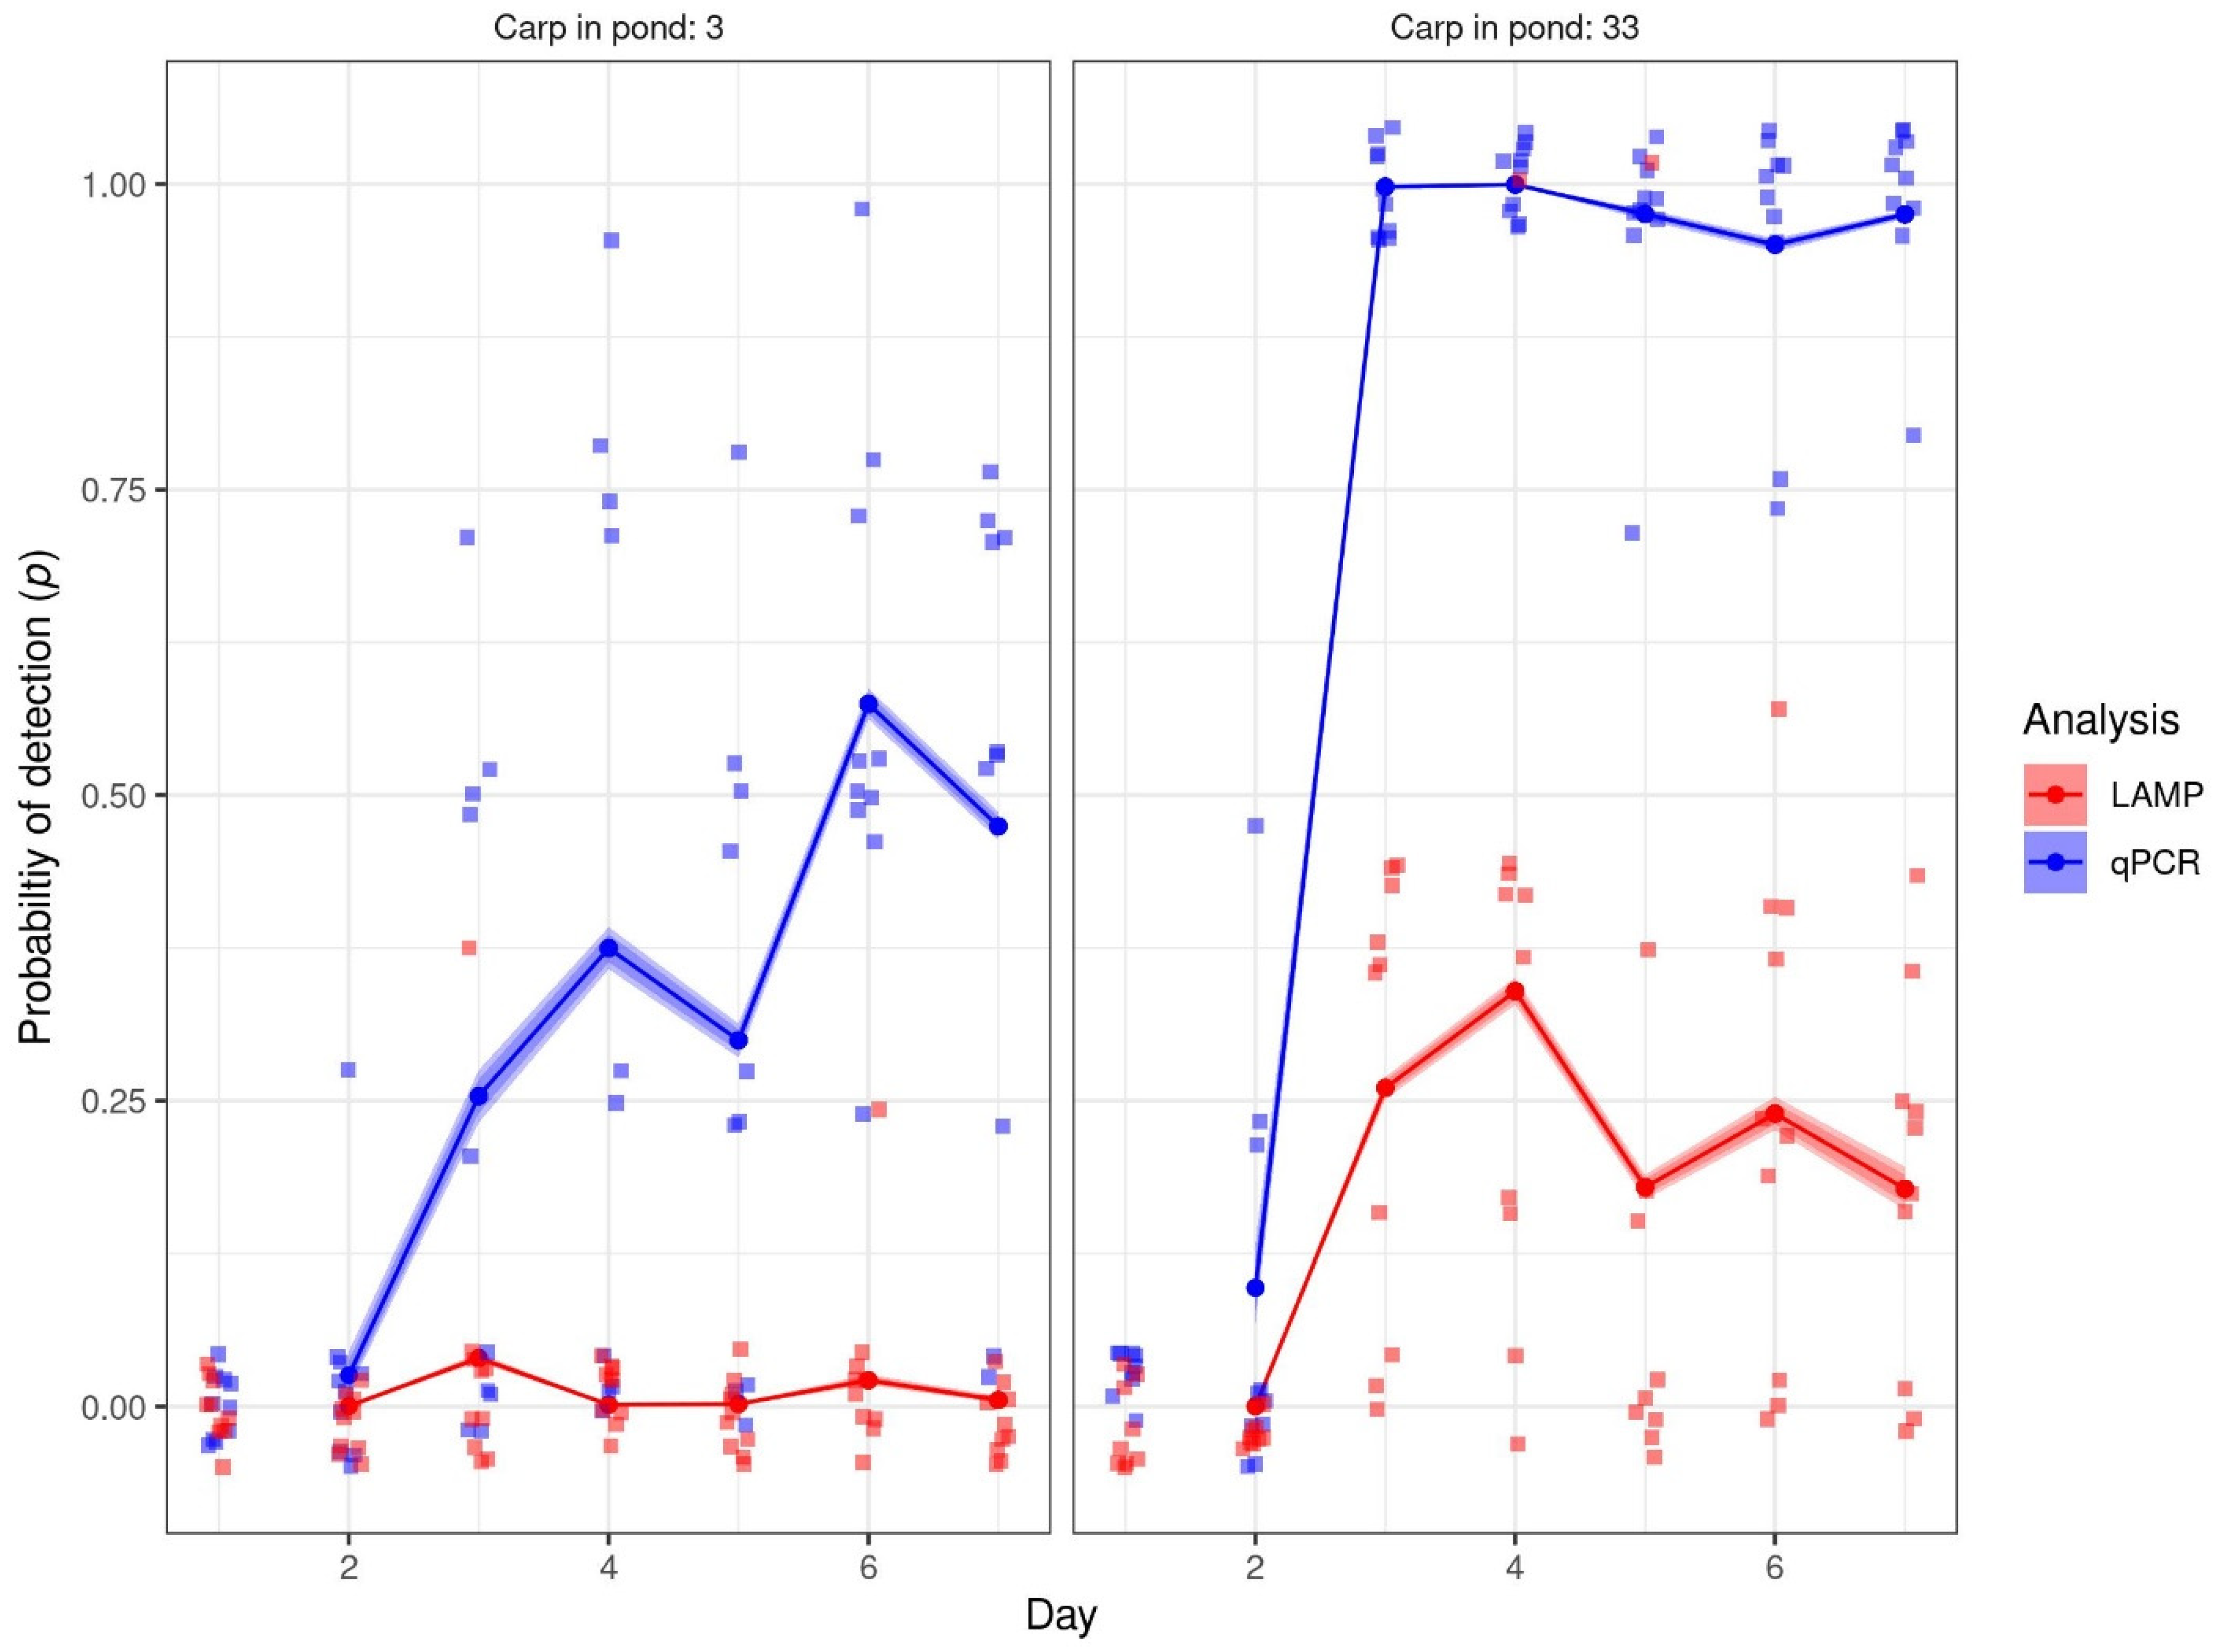
Figure 3.
Probability of capturing Grass Carp eDNA in a sample over time. The probability of capturing target eDNA in a sample over time is modeled for each pond using occupancy modeling with results from the LAMP or qPCR detections treated as multiple observers. The 80% credible interval is shown with dark shading and the 95% credible interval is shown with light shading. Square points represent individual samples jittered around 0 (did not capture target eDNA) or 1 (did capture target eDNA).

Figure 4.
Grass Carp eDNA concentration over time using qPCR. Data presented is for the 500 mL samples. The 80% credible intervals are shown with dark shading and the 95% credible intervals are shown with light shading. Round points represent individual samples jittered around eDNA concentration in copies per reaction. Measurements above the 201 copies/reaction LOQ should be considered as accurate, and measurements below the LOQ should be considered as best available estimates. Values reported as 0 copies/reaction should be considered as likely negative but possibly containing target eDNA below the 7 copies/reaction LOD.

Table 1.
Oligonucleotides used for the invasive carp LAMP assay and for qPCR.
| Assay Type | Oligo | Target Gene | Sequence (5′-3′) | Target Size (bp) |
|---|---|---|---|---|
| LAMP | AC1-F3 | 16S (invasive carp) | TTCCCCTAACARTATCAGGCT | 215 |
| LAMP | AC1-FIP | AGTGGTTTGTCCGATCTGGTCATGGAAGAAATTATGCTAAAATG | ||
| LAMP | AC1-FLP | CTTGGAGAAGAGCAGGTCT | ||
| LAMP | AC1-B3 | TAGCACTCCRGTGTGGGGT | ||
| LAMP | AC1-BIP | ATTAACGAACTCAACCCAAGAACGATTGTTTAATTGTGGGTTT | ||
| LAMP | AC1-BLP | GAGTAATGTRAAYAACAAAAAAACC | ||
| LAMP | 16S-F3 | 16S (bacteria) | AAGCCTGATGCAGCCATGC | 206 |
| LAMP | 16S-FIP | CGGGTAACGTCAATGAGCAAAGGGTATGAAGAAGGCCTTCGGG | ||
| LAMP | 16S-FLP | CCTTCCTCCCCGCTGAAAGTAC | ||
| LAMP | 16S-B3 | CGCCTGCGTGCGCTTTAC | ||
| LAMP | 16S-BIP | AAGCACCGGCTAACTCCGTGCCAGTAATTCCGATTAACGCTTGC | ||
| LAMP | 16S-BLP | AGCAGCCGCGGTAATACGGAG | ||
| PCR | ND2-F60 | ND2 | AATCAATACCTTAGCAATCATTCCA | 157 |
| PCR | ND2-R60 | TATTTATATCTCACTCTCCTGTAAT | ||
| Probe | ND2-probe | 56-FAM/AATAGCCCA/ZEN/ACACCACCACCCTC/3IABkFQ |
Table 2.
Specificity testing against various fish species. Plus (+) indicates positive detection. Minus (−) indicates failed to produce detectable signal.
Table 2.
Specificity testing against various fish species. Plus (+) indicates positive detection. Minus (−) indicates failed to produce detectable signal.
| Family | Species | Common Name | Result |
|---|---|---|---|
| Acipenseridae | Acipenser fulvescens | Lake sturgeon | − |
| Acipenseridae | Scaphirhynchus albus | Pallid sturgeon | − |
| Catostomidae | Ictiobus cyprinellus | Bigmouth buffalo | − |
| Centrarchidae | Lepomis macrochirus | Bluegill | − |
| Centrarchidae | Micropterus salmoides | Largemouth bass | − |
| Cichlidae | Oreochromis aureus × Oreochromis niloticus | Tilapia | − |
| Clupeidae | Dorosoma cepedianum | Gizzard shad | − |
| Cyprinidae | Ctenopharygodon idella | Grass carp | + |
| Cyprinidae | Cyprinella spiloptera | Spotfin shiner | − |
| Cyprinidae | Cyprinus carpio | Common carp | − |
| Cyprinidae | Hypophthalmichthys molitrix | Silver carp | + |
| Cyprinidae | Hypophthalmichthys nobilis | Bighead carp | + |
| Cyprinidae | Mylopharyngodon piceus | Black carp | + |
| Cyprinidae | Notemigonus crysoleucas | Golden shiner | − |
| Cyprinidae | Pimephales promelas | Fathead minnow | − |
| Ictaluridae | Ictalurus punctatus | Channel catfish | − |
| Percidae | Perca flavescens | Yellow perch | − |
| Percidae | Sander vitreus | Walleye | − |
| Petromyzontidae | Petromyzon marinus | Sea lamprey | − |
| Poeciliidae | Gambusia affinis | Mosquitofish | − |
| Polyodontidae | Polyodon spathula | Paddlefish | − |
| Salmonidae | Oncorhynchus mykiss | Rainbow trout | − |
| Salmonidae | Salvelinus fontinalis | Brook trout | − |
| Salmonidae | Salvelinus namaycush | Lake trout | − |
Publisher’s Note: MDPI stays neutral with regard to jurisdictional claims in published maps and institutional affiliations. |
© 2022 by the authors. Licensee MDPI, Basel, Switzerland. This article is an open access article distributed under the terms and conditions of the Creative Commons Attribution (CC BY) license (https://creativecommons.org/licenses/by/4.0/).
Share and Cite
MDPI and ACS Style
Kageyama, S.A.; Hoogland, M.R.; Tajjioui, T.; Schreier, T.M.; Erickson, R.A.; Merkes, C.M. Validation of a Portable eDNA Detection Kit for Invasive Carps. Fishes 2022, 7, 363. https://doi.org/10.3390/fishes7060363
AMA Style
Kageyama SA, Hoogland MR, Tajjioui T, Schreier TM, Erickson RA, Merkes CM. Validation of a Portable eDNA Detection Kit for Invasive Carps. Fishes. 2022; 7(6):363. https://doi.org/10.3390/fishes7060363
Chicago/Turabian StyleKageyama, Stacie A., Matthew R. Hoogland, Tariq Tajjioui, Theresa M. Schreier, Richard A. Erickson, and Christopher M. Merkes. 2022. "Validation of a Portable eDNA Detection Kit for Invasive Carps" Fishes 7, no. 6: 363. https://doi.org/10.3390/fishes7060363