Article

Application of the Method Evaluation and Risk Assessment Tool for a Small-Scale Grouper Fishery in Indonesia

1
Department of Fishery Resources Utilizations, Faculty of Fisheries and Marine Sciences, IPB University, Bogor 16880, West Java, Indonesia
2
Centre for Sustainable Aquatic Ecosystems Research, Harry Butler Institute, School of Environmental and Conservation Sciences, College of Environmental and Life Sciences, Murdoch University, Perth, WA 6150, Australia
3
Fisheries Resource Center of Indonesia, Rekam Nusantara Foundation, Bogor 16151, West Java, Indonesia
4
Research Center for Fishery, National Research and Innovation Agency Republic of Indonesia, Cibinong 16915, West Java, Indonesia
5
Konservasi Alam Nusantara Foundation, Jakarta Selatan 12160, DKI Jakarta, Indonesia
6
Blue Matter Science, North Vancouver, BC V7P 2T9, Canada
*
Author to whom correspondence should be addressed.
Fishes 2023, 8(10), 498; https://doi.org/10.3390/fishes8100498
Submission received: 1 September 2023 / Revised: 28 September 2023 / Accepted: 30 September 2023 / Published: 5 October 2023
(This article belongs to the Special Issue Diagnosis and Management of Small-Scale and Data-Limited Fisheries)

Abstract

:
Management strategy evaluation using the Method Evaluation and Risk Assessment (MERA) platform was used to evaluate management procedures (MPs) for improving the management of the leopard coral grouper (Plectropomus leopardus) fishery in Saleh Bay, Indonesia. This grouper is a valuable species currently under high fishing pressure. It is targeted by small-scale fisheries using a wide range of fishing methods; hence, management recommendations are needed to ensure sustainability. A suite of MPs for data-limited conditions were evaluated for their ability to achieve limit and target biomass reference points (B/BMSY = 0.5 and B/BMSY = 1, respectively), while maintaining a target yield of at least 0.5 MSY. The simulation results suggest that the currently implemented harvest control rules (HCRs) in Saleh Bay (size limit and spatial closure) may not be effective in achieving the management objective to attain the target biomass reference point due to relatively low compliance with the size limit regulation (320 mm total length) and the very small proportion of existing MPA no-take areas (~2.2%). This study recommends that the fisheries management authority explores the feasibility of implementing the total allowable catch (TAC) and seasonal closure in addition to the existing fishing regulations for P. leopardus in Saleh Bay.
Key Contribution: This study is the first application of the Method Evaluation and Risk Assessment tool to inform the small-scale grouper fishery in Indonesia. This is a case study that can serve as a model for other small-scale fisheries in Indonesia and other regions of the world.

1. Introduction

Grouper (Serranidae) are a key fishery resource with high economic value, and constitute an essential part of the livelihoods of local communities and help provide food security worldwide [1]. Due to increasing demand for these high-value species, total landings of grouper have gradually increased globally. For example, in the 1950s, total landings were around only 50,000 mt, but between 2006 and 2016, they increased from 237,000 mt to almost 450,000 mt annually [2,3]. China (128,000 mt) and Indonesia (100,000 mt) have the highest grouper landings, together accounting for over 60% of the landings reported to FAO [3]. The average annual grouper production in Indonesia was 105,569 mt from 2012 to 2021, representing 27.3% of the annual global production [4]. These catches contributed ~10% to the total landings of demersal and reef-associated fish species and are mainly targeted by small-scale fisheries [1,5].
Groupers are large, long-lived, late maturing, aggregating species, with high economic value, making them highly vulnerable to fisheries pressure and overfishing [3]. A recent assessment reported that 19 of 71 assessed grouper species were in the “threatened” category under the International Union for Conservation of Nature’s (IUCN) Red List of Threatened Species [3]. A study of 716 grouper and snapper fisheries globally suggested that about half of them are in overexploited status [1]. These findings were also confirmed by several studies at the country level. For example, a study on the stock status of 12 reef fish species in Palau [6] showed that the high-value species, such as leopard coral grouper (Plectropomus leopardus) and squaretail coral grouper (Plectropomus areolatus), are prone to overfishing, as demonstrated by their extremely low estimated spawning potential ratio (SPR) of 0.01 and 0.05, respectively, which is well below the generally accepted limit reference point of 0.20. In addition, a study by Mudjirahayu et al. in Cendrawasih Bay, Indonesia [7], suggested that Plectropomus maculatus and Plectropomus oligacanthus suffered from overfishing, as indicated by larger fishing mortality compared to their natural mortality rate (i.e. F/M > 1).
The leopard coral grouper has a wide distribution, mainly in the Western Pacific from southern Japan to Australia (Queensland and Western Australia), and from Thailand, Malaysia, Indonesia, eastward to the Solomon Islands, the Caroline Islands, and Fiji [8,9,10]. In Indonesia, this species is distributed throughout the country, living mainly in coral reefs at a wide range of depths from 3 to 100 m [11]. Typically, members of the Epinephelidae are slow growing and have low natural mortality rates and a long-life span. However, the coral groupers (Plectropomus spp.) have relatively shorter life spans, grow faster, and have higher rates of natural mortality, and so are considered less vulnerable to fishing pressure than other longer-lived grouper species [8]. However, populations of coral groupers continue to decline due to high exploitation and habitat degradation [6,8]. Despite grouper stocks continuing to decline worldwide, management efforts are almost nonexistent in most areas where fishing pressure on grouper populations is high [1,3,8].
Grouper is the main fisheries resource for the West Nusa Tenggara (WNT) province, Indonesia, with annual grouper production contributing 2.9% to the total WNT annual capture fisheries production from 2010 to 2021 [12]. Saleh Bay in Sumbawa is one of the main fishing grounds for grouper fisheries and other WNT fisheries, with an area of ~2087 km2 [13] (Figure 1). Local fishers in Saleh Bay target leopard coral grouper, spotted coral grouper (P. maculatus), orange-spotted grouper (Epinephelus coioides), and malabar blood snapper (Lutjanus malabaricus) using various fishing gear including bottom longlines, spearguns, and handlines [5]. Length-based assessments of the 12 most targeted grouper and snapper species in Saleh Bay indicated very high fishing mortality and low spawning potential ratio (SPR), suggesting that these species were under high fishing pressure that led to overfishing or even recruitment failure and collapse [5,14].
Management efforts for grouper fisheries in Saleh Bay have been implemented since 2018, through the enactment of Governor Regulation No. 32/2018 for managing 12 highly targeted grouper and snapper species. This regulation stipulates several management measures: catch size limit, fishing gear restriction, spatial closures through improving the management effectiveness of existing marine protected areas, and strengthening enforcement to stop destructive fishing practices (i.e., cyanide and blast fishing) [15]. Nevertheless, the annual fisheries monitoring and evaluation showed that the stock condition of some high-value species (including P. leopardus) remained relatively low in 2021, indicated by SPR values < 0.3 [16]. In addition, a study by Efendi et al. [14] suggested that P. leopardus in Saleh Bay has a poor conservation status as indicated by the length-at-first capture being shorter than the length-at-maturity (i.e. Lc/Lm < 1), and that the yield is lower than optimum as indicated by the ratio of average individual length to the optimum length (Lmean/Lopt) < 0.9). This prompted the WNT government to prepare a rebuilding stock strategy using a Management Strategy Evaluation (MSE) method for this species if the SPR is below the limit reference point (SPR < 0.2). This approach is also part of the requirements for the Marine Stewardship Council (MSC) certification of the grouper fishery in Saleh Bay [17].
Management strategy evaluation is an approach that compares the relative efficacy for accomplishing management objectives of various combinations of data gathering systems, techniques of analysis, and subsequent procedures leading to management actions (e.g., harvest strategy) using simulations with a mathematical model of the fishery system [18]. The MSE approach can help fisheries managers to select from a list of candidates, the management strategy that is most likely to achieve management goals or assess the effectiveness of an existing management approach, even when data for conventional stock assessment are not adequate [18,19]. Over the last decade, MSE has become increasingly used for planning, evaluating, and implementing fisheries management plans for data-limited fisheries, frequently including participatory modeling [20]. For example, MSE using the data-limited method toolkit (DLMtool) has been applied to Pacific groundfish species (Pleuronectidae and Scorpaenidae; [21]) in Canada; developing fisheries management plans for barred sand bass (Serranidae) in California, and halibut, red sea urchin, and warty sea cucumber in California [22]; and seven data-limited fisheries in Indonesia [23], including leopard coral grouper [11].
One methodology developed for applying MSE to fisheries is the Method Evaluation and Risk Assessment (MERA) application, which was developed as a tool to evaluate alternative management strategies and aid selection of the approach that is most likely to achieve the desired management objectives [24]. Since MERA applies a quantitative approach and documents all steps in the process, it has advantages over more qualitative approaches to MSE, such as the Productivity Susceptibility Analysis (PSA) [25]. Although often considered a useful tool for management evaluation, a qualitative approach is often subjective and not reproducible [25]. On the other hand, MERA enables clear quantitative documentation of the simulation and analysis process, including the data and assumptions being used, to allow the process to be repeatable [24,25].
This study is part of the process of providing fisheries management advice for P. leopardus, the main high-value grouper species targeted by small-scale fisheries in Saleh Bay [26]. The MERA application was applied to evaluate the performance of a suite of different management procedures for achieving fisheries management objectives, particularly the biological objective of achieving sustainable fish stocks and the fishery objective of sustaining yields from the fishery. This study conducted simulations and analysis using MERA to (1) evaluate the performances of 20 management procedures (MPs) to achieve management objectives of P. leopardus under current fishery conditions; (2) evaluate the performances of 20 MPs under a stock rebuilding scenario, i.e., under depleted P. leopardus stock conditions (biomass below the limit reference point); and (3) evaluate a suite of customized management procedures (19 MPs based on variations of catch reductions, size limits, and length of closure to fishing) as a basis for recommending technical harvest control rules that may be applicable for P. leopardus management in Saleh Bay. MERA was also used to evaluate the greatest sources of uncertainty affecting the simulation results of each MP. The results from this study will inform fisheries managers and stakeholders of the management procedures that are simulated to have a high probability of achieving management objectives, such as maintaining biomass within the population and yield from the fishery.

2. Materials and Methods

2.1. Study Area and Fishery

Saleh Bay is situated on Sumbawa Island and is one of the main fishing grounds for ~5800 pelagic, demersal, and reef fishers in WNT Province, Indonesia [5,13,14]. It is a semi-enclosed area with a total area of 2087 km2 and maximum depth of 324 m [13,27]. Its 128 km long coastline is inhabited by ~67,000 people distributed in 26 coastal villages [13,27]. Saleh Bay encompasses a variety of habitats, including small islands and varied coastal ecosystems such as coral reefs, seagrass, and mangroves, which provide vital habitats for a variety of fish resources [13].
Since 2016, the small-scale grouper and snapper fisheries in Saleh Bay have been intensively studied through the fish landing monitoring (FLM) program by the WNT provincial government, supported by various stakeholders. The FLM program has made it possible to improve the fisheries data quality of Saleh Bay, which also includes data on species, length composition, fishing effort, fishing unit characteristics, and socio-economic data. The FLM program in Saleh Bay focused on four main landing sites (Figure 1) that were agreed upon by the government and stakeholders as monitoring sites, where >80% of the fishing population in Saleh Bay is concentrated [13,15]. The resultant data allowed a fisheries action plan to be formulated through Governor Regulation No. 32/2018, which has been enforced and monitored since September 2018 [15]. This regulation governs the fishing activities targeting 12 main grouper and snapper species in Saleh Bay through (1) limiting the catch size, (2) limiting the size of fish to trade, (3) regulating the specifications of several fishing gears (e.g., hook and mesh size), and (4) recommending fishers and fisher groups to develop an agreement on restricted fishing times to reduce fishing pressures. Most of the data and information used in this study were taken from analyses of data from the FLM program.
Based on the technical and operational characteristics of fishing units, the grouper fishery in Saleh Bay is a small-scale complex fisheries system. This employs multiple types of fishing gear and methods with various boat characteristics and targets a wide range of species. Over 75 grouper and snapper species are caught in Saleh Bay, where P. leopardus is among the most targeted species. Among seven fishing gear/methods operating in Saleh Bay, the bottom longline, speargun, and handline contributed about 90% to the grouper catch in Saleh Bay [5], and P. leopardus is a high-value species for local and export markets, mainly Hong Kong and Taiwan [28].
Plectropomus leopardus is a protogynous hermaphroditic species, aggregating during spawning to form groups of several hundred fish [10]. In addition, this species also undergoes diandric protogyny, where male P. leopardus may develop from either immature or mature females [8]. In eastern Indonesia, spawning of P. leopardus occurs from October to January, with reproductive peaks in November and December [29]. The spawning season in higher latitude waters is from May to July in the Okinawa Islands, Japan [30], and from September to December in the Great Barrier Reef, Australia [8].
Species in the Plectropomus genus have a high level of inter-specific variation in mean size and age at maturity, with ranges of 35–62 cm TL (mean size), 1.8–4.6 years (age at maturity), and sex change at 42.0–87.4 cm TL [8]. The growth parameters of P. leopardus in Saleh Bay (for both sexes combined) used for this analysis were: L = 719.4 mm, k (year−1) = 0.12, t0 = −1.17 year, and natural mortality M = 0.16 year−1 (n samples = 1159) (Table 1; [26]). The growth parameters for P. leopardus vary widely among different regions, e.g., the estimated L ranges from 416 mm in Cendrawasih Bay (Papua) to 924 mm in South Sulawesi, and k ranges from 0.21 in Southeast Sulawesi to 1.2 year−1 in Papua [11]; see also [5,8].

2.2. MERA Operation

MERA uses two inputs: (1) responses from an essential quantitative questionnaire and (2) an optional input of fisheries data in a standardized format. The questionnaire consists of 30 questions which are grouped into three categories: fisheries characteristics (including biological attributes of the target species, 19 questions); suitable fisheries management type (7 questions); and the quality of data (4 questions) [24]. By default, MERA runs its simulation based on the data and information input into the questionnaire. When provided, the standardized fishery data is used for (1) conditioning an operating model when simulating Management Planning, Management Performance, and Risk Assessment modes using closed-loop simulation, and/or (2) estimating the status of exploited stocks in Status Determination Mode [24]. Seven categories of fishery data can be provided: biological parameters, selectivity parameters, historical catch and effort data, catch-at-age data, catch-at-length data, and reference points or other metrics [24].
MERA has three primary modes of operating for providing information on management options or procedures: (1) Management Planning: which entails determining an appropriate management mode; (2) Management Performance: which assesses current management practices; and (3) Calculating current stock status [24]. This study uses the Management Planning mode to evaluate the performance of the management procedures that will inform management. This mode provides a closed-loop simulation testing of numerous management procedures and diagnostics to help managers identify research priorities. The inputs required for MERA analysis are (1) responses from an essential quantitative questionnaire, (2) an optional input of fisheries data in a standardized format, and (3) a selection of management procedures (Figure 2). This study evaluates 20 management procedures conditioned to the current fishery state, based on data and information provided in the questionnaire and fishery data, and in the rebuilding scenario where the current biomass is assumed to be between 30 and 50% of BMSY (biomass at maximum sustainable yield; Figure 2). It also evaluates 19 custom management procedures developed specifically for P. leopardus in Saleh Bay.

2.2.1. MERA Questionnaire

The MERA questionnaire consists of 30 questions which are grouped into three categories: (1) fisheries characteristics (including biological attributes of the target species, 19 questions); (2) suitable fisheries management type (7 questions); and (3) the quality of data (4 questions; [24]). The questionnaire was completed through a data workshop involving scientists from the Indonesian Research and Innovation Agency (BRIN), the Fisheries Resources Center of Indonesia (FRCI), Mataram University, the Wildlife Conservation Society (WCS) Indonesia Program, the scientific forum for fisheries management of West Nusa Tenggara (FIP2B), and the West Nusa Tenggara Marine and Fisheries Agency as the fisheries management authority. The questions in the questionnaire were answered using the best available data, scientific literature, and expert judgment and knowledge of the fishery in the study area. The complete data inputs for the MERA questionnaire are provided in Supplementary Material S1.

2.2.2. Fishery Data

The available fishery data used in this study consist of (1) biological parameters, (2) selectivity parameters, (3) a time series of historical catch, coefficient of annual variation of catch (cv; estimated using expert judgement at 0.1 per year), and vulnerable abundance index, (4) catch-at-length, and (5) estimated current stock depletion (Table 1; Supplementary Material S2). The biological and selectivity parameters were derived from a study in Saleh Bay [26], a recent fisheries monitoring and evaluation report [16], and studies from other areas (e.g., [31]). The historical catch data were derived from the fisheries statistics data of the WNT Province from 2009 to 2015, and the fish landing monitoring data from 2016 to 2021. We used the catch per unit effort (CPUE) estimation from Efendi et al. [32] as the abundance index for 2009 to 2015, and standardized CPUE estimation from fish landing monitoring data for 2016 to 2021. Catch-at-length data were derived from the fish landing monitoring data from 2016 to 2021. When the fishery data matrix is uploaded, MERA overrides the corresponding data and information in the questionnaire and replaces it with data from the fishery data matrix. MERA then uses the fishery data matrix in conditioning the operating model to the current state of the fishery.
Table 1. Fishery parameters and data used for the Method Evaluation and Risk Assessment (MERA) simulations of different management procedures for P. leopardus in Saleh Bay, Indonesia. SPR = spawning potential ratio. FIPP2B = scientific forum for fisheries management of West Nusa Tenggara province.
ParametersValueReferences
Life history and stock
Maximum age (year)26Mathews and Samuels [31]; Agustina et al. [16,26,33]
M (year−1)0.16
Von Bertalanffy Linf parameter (cm)71.9
Von Bertalanffy k parameter0.12
Von Bertalanffy t0 parameter (year)−1.17
Length-weight parameter a0.0182
Length-weight parameter b2.97
Length at 50% maturity (cm)38.8
Length at 95% maturity (cm)41.8
Length at first capture (cm)34.6
Stock depletion0.32Estimated from current SPR relative to general MSY equilibrium model (Goethel et al. [34]; Hoshino et al. [35])
Catch data
Range of total annual catch (kg), from 2016 to 20213773.1–5629.4FIP2B fish landing monitoring data and analyses from 2016 to 2021 (unpublished)
Catch-at-length (cm), from 2016 to 2021Size class range: 20–64 cm; n = 4115
The stock depletion value for MERA’s model conditioning was calculated from the spawning potential ratio (SPR) estimation of P. leopardus in Saleh Bay from 2017 to 2022 using the equilibrium model of maximum sustainable yield (MSY) and the SPR relationship from Goethel et al. [34]. Based on the simulated equilibrium MSY model of Goethel et al., the SPR values at MSY range from 0.24 to 0.38, depending on the assumption used for the stock-recruit model. The LBSPR values of P. leopardus in Saleh Bay from 2017 to 2022 ranged from 0.12 to 0.32 (mean = 0.24) [16]. Given the unknown stock-recruit relationship for P. leopardus in Saleh Bay, we chose Goethel’s SPR at MSY value (SPRMSY) = 0.38 as a precautionary approach. Using the estimated SPR at MSY (SPRMSY) at 0.38, we approximated the current biomass of P. leopardus in Saleh Bay as 0.63 of BMSY (SPRcurr at 0.24 divided by SPRMSY at 0.38). Using the general equilibrium MSY model from Hoshino et al. [35] where BMSY = 0.5 B0, we estimated the current biomass level relative to unfished biomass (Bcurr/B0) or depletion of the P. leopardus ≈ 0.32 B0 (0.63 × 0.5 B0). Thus, we used the depletion value (D) = 0.32 in the uploaded fisheries data matrix as the reference value for the MERA simulation. The more detailed fishery data matrix used in this study is presented in Supplementary Material S2.

2.2.3. Management Procedures

In this simulation, we used two groups of management procedure (MP): MERA’s default MPs and a set of custom MPs. The default MPs are MERA’s “Top 20” MPs, a subset of 20 MPs that regularly rank among the top performers across a wide range of operating models. These procedures include those based on the total allowable catch (TAC), total allowable effort (TAE), size limits (SzLim), and spatial closures (Table 2; see Supplementary Material S3 for a detailed description of these 20 MPs). The 20 customized MPs (Table 2) included variations in TAC and TAE where the nominal total allowable catch and effort are reduced by 10 to 25% (with a 5% annual increment) of the current catch and effort level (mean of the five years from 2017 to 2021). We also tested a scenario of seasonal closure of fishing (reducing annual fishing effort), varying from a one-month closure to four months, to mimic the TAE. We also tested a wide range of catch size limits (from 25 to 40 cm in total length [TL]), starting from a hypothetical catch size smaller than the 50% length-at-maturity (L50 = 38.8 cm TL, Table 1), where the current agreed size limit for the P. leopardus in Saleh Bay is only 32 cm. The size limits tested were 25 cm TL, and then in 2 cm increments from 28 to 40 cm TL. To perform the customized MP simulation, a file containing a series of R-scripts was uploaded to MERA (Supplementary Material S4). The reference of R-scripts for operating model conditioning was accessed from https://openmse.com/ (accessed on 13 November 2022).

2.2.4. Evaluating the Performance and Selecting Management Procedures

We evaluated and selected the MPs as management recommendations based on their performances in achieving biomass (B) limit and target reference points relative to biomass at maximum sustainable yield (BMSY) and the probabilities of achieving a reasonably high yield (Y) relative to the current yield (Ycurr). We selected both the MERA default and custom MPs as management recommendations when the MPs (1) achieve the B/BMSY > 1 target in year 50, (2) achieve the B/BMSY > 1 target in medium-term stock rebuilding scenario (year 20), (3) achieve the B/BMSY > 1 in long-term stock rebuilding scenario (year 50), and (4) achieve Yt/Ycurr > 1 in year 50. MPs not meeting these criteria were filtered out and not selected for further discussion in this study.

2.2.5. Biomass and Yield Projections

Probability projection plots of biomass and yield for each selected MP were also provided to achieve the pre-determined reference points for the current fisheries condition (base simulation) and whether they could rebuild the hypothetical depleted stock (stock rebuilding simulation). The probability projection plots are simulated in two different time frames. The base simulation evaluates biomass and yield projections in 0–10 years (short-term) and 50 years (long-term), while the stock rebuilding simulation plots the projections in 20 years (medium-term) and 46–50 years (hereafter termed “50” years; long-term). In the stock rebuilding simulation, the MP will likely provide a high probability of rebuilding the stock when the median estimates of the probability plot exceed the target reference point B/BMSY > 1.
Tradeoff plots of project biomass (x-axis) and yield (y-axis) for the selected MPs are displayed to identify those MPs predicted to achieve biomass and yield reference points in the long-term. Two yield–biomass plots are provided with different probabilities of biomass targets shown on the x-axis: the probability of maintaining biomass level above (a) the limit reference point B > 0.5BMSY and (b) the target reference point B > BMSY over a long-term period (“50” years).

2.2.6. Source of Uncertainties and Variation in Yield Projections

Parameter inputs from answers to the MERA questionnaire and the fishery data matrix and the operational models used in MERA also contribute to uncertainties, causing variation in the probability projection of long-term yield. Uncertainty plots for the selected MPs are provided to identify the source of uncertainties that affect the variability in the projection of the long-term yield (LTY) as a percentage (%LTY).

3. Results

3.1. Selection of Available Management Procedures

Based on the selection criteria, ten default MPs and eight custom MPs were selected as potential management recommendations for P. leopardus in Saleh Bay (Table 3). These MPs were selected based on their performance in keeping biomass above the limit reference point (LRP) and simultaneously achieving the biomass and yield target reference points (TRP) in the 50-year simulation. For example, DBSRA4010 (depletion-based stock reduction analysis) had the highest probability (98.7%) of maintaining biomass above the limit reference point (B > 50% BMSY), while at the same time being able to achieve the target biomass (B/BMSY > 1) and target yield (Yt/Ycurr = 1). Only simulations for the selected default MPs achieved the limit and target reference points of biomass in the stock rebuilding scenario (Table 3). In addition to the TAC MPs, the selected MPs included those using a seasonal closure from two to four months (i.e., a form of total allowable effort) and size limits from the current size limit of 32 cm total length to 40 cm total length (Table 3). In contrast, no custom MPs performed well under the stock rebuilding scenario. All the default total allowable effort (TAE), size limit, and spatial closure (MPA)-based MPs showed poor performance in achieving the LRP and TRP for biomass (Table 3).

3.2. Yield–Biomass Trade-Offs

The yield–biomass trade-offs plot of the 18 selected MPs showed that only DBSRA and DBSRA4010 (TAC-based MPs; output control) had a high probability (>0.75) of exceeding the biomass limit (B > 50% BMSY) and target (B > BMSY) reference points, while still achieving a reasonably high probability (>0.75) of yield being >50% of the reference yield (i.e., the yield at MSY) over the long term (Figure 3). The custom size limit and seasonal closure MPs showed a high probability (>0.75) of yield being >50% yield at MSY with lower probability (0.5–0.75) in achieving biomass limit and reference points. The other MPs (TAC-based; output control) performed very well in maintaining the biomass condition (probability > 0.75) but had lower probability (<0.75) of having a reasonably high yield (Figure 3).

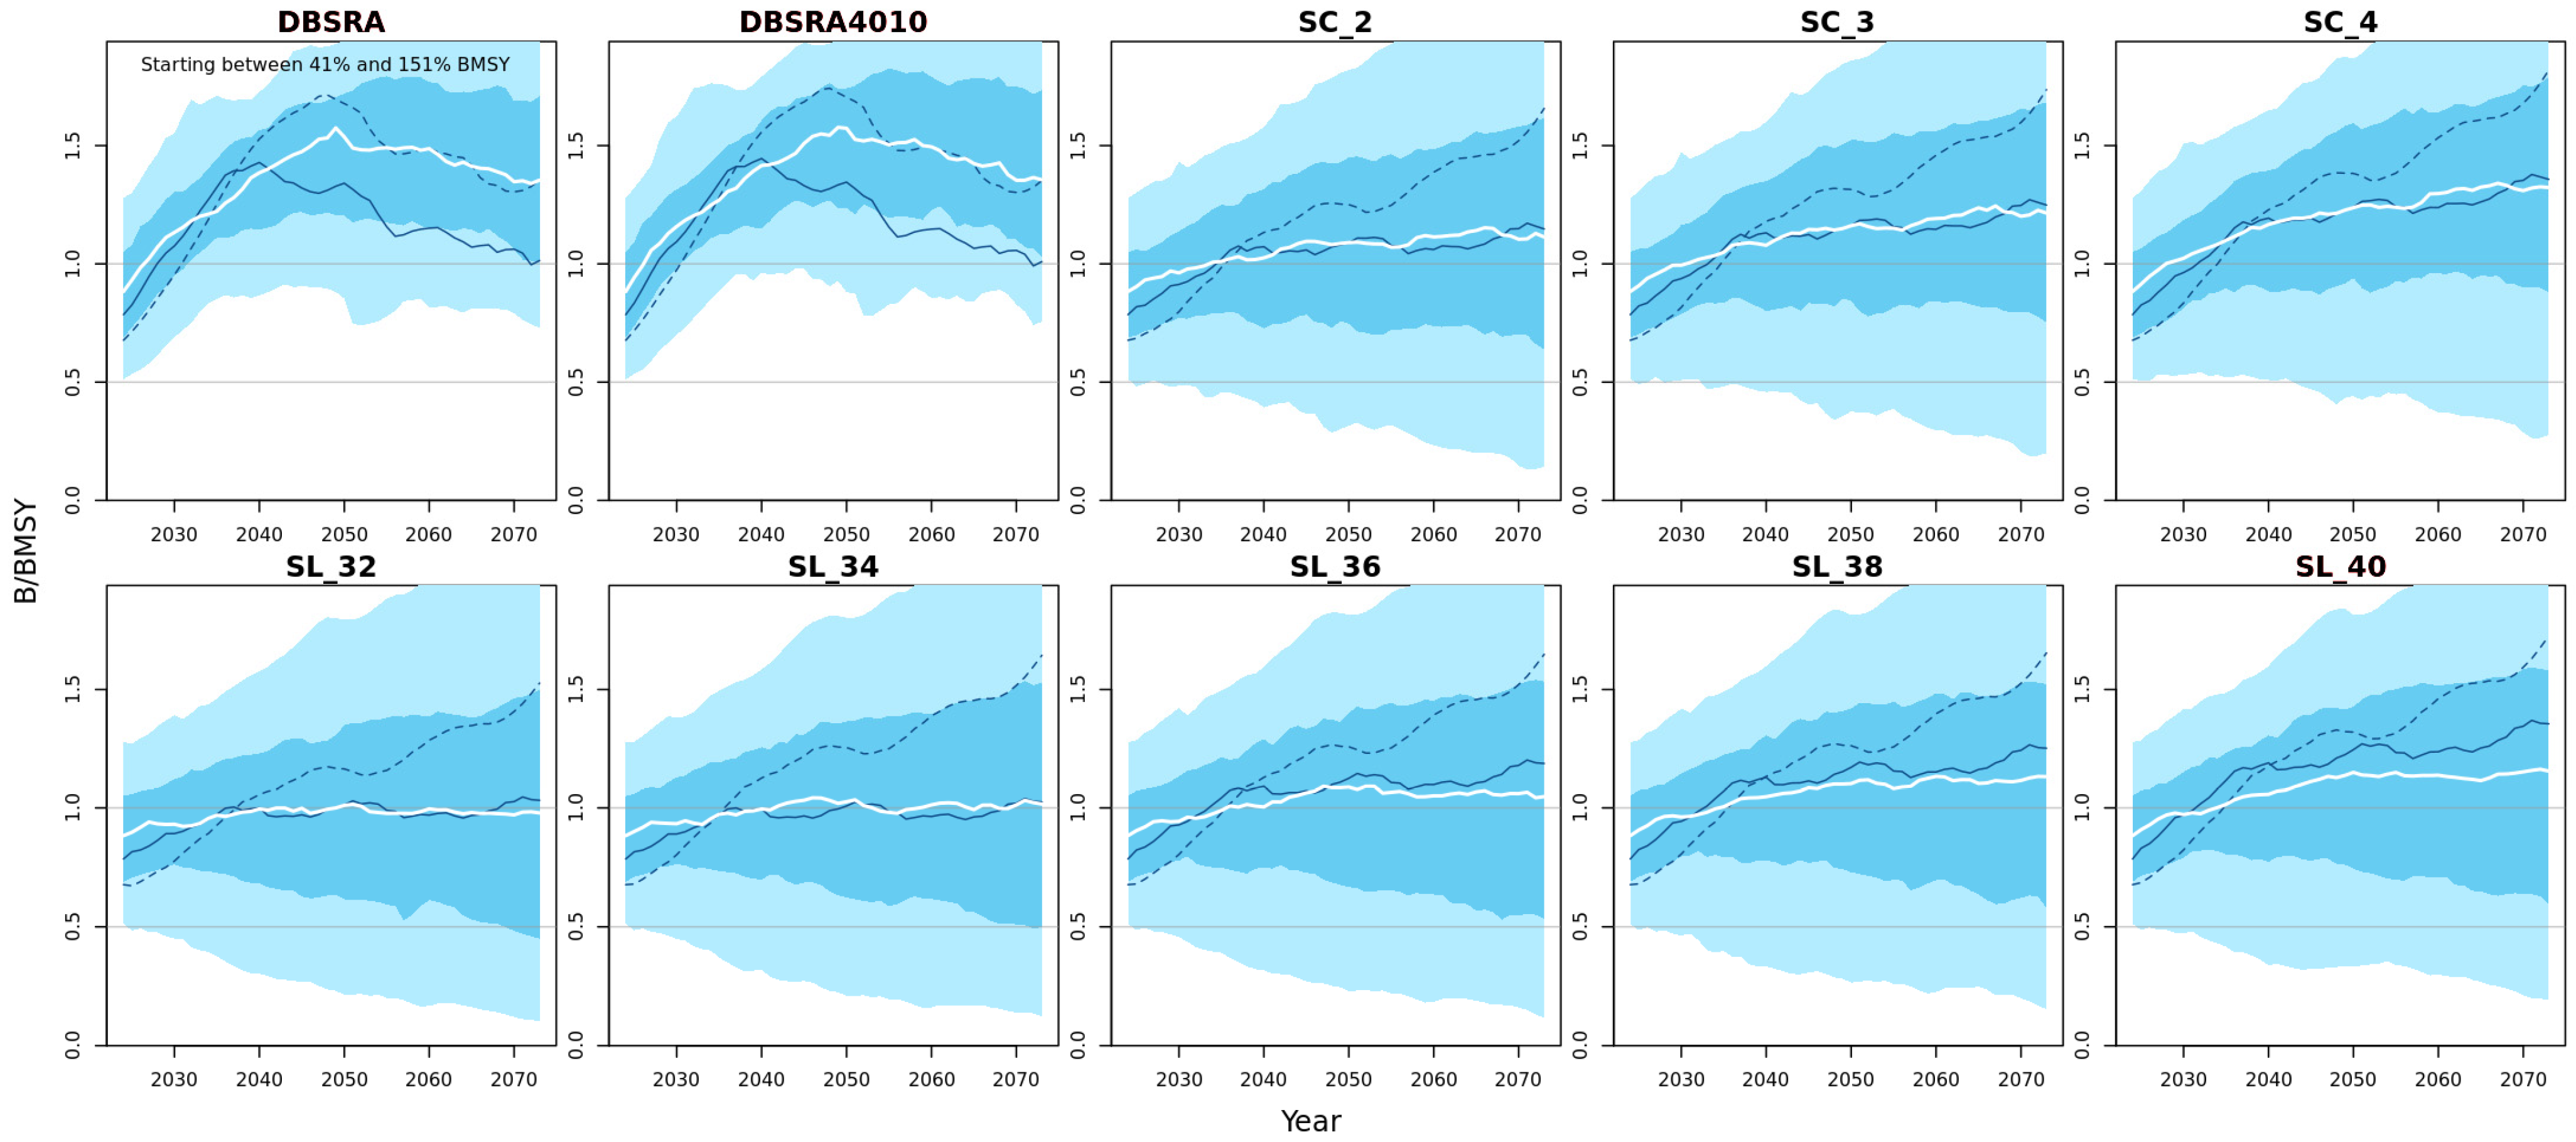
3.3. Biomass Projections

3.3.1. Biomass Probability Projections

Based on the trade-off plots (Figure 3), 10 MPs were selected as management recommendations for further analysis (Table 4 and Table 5). Eight of these ten MP projections (all except for the SL_32 and SL_34) had a very high probability (>90%) of being above the biomass limit reference point (B > 0.5 BMSY) over the first 10 years of simulation (i.e., 2024 to 2033, Table 4). In contrast, all of these MPs, except DBSRA and DBSRA4010, had low probabilities (<0.6) of achieving the biomass target reference point (B > BMSY) (Table 5).

3.3.2. Biomass Projections Plots

Under the current fishery conditions, all the selected MPs performed well in achieving the biomass target reference point (B/BMSY = 1) over the long-term simulation of 50 years (Figure 4). However, almost all MPs (except for DBSRA and DBSRA4010) have relatively higher uncertainty as shown by a wider probability interval (blue and light blue shades), and have 50% probability intervals (blue shade) being lower than the biomass target reference point.
Under the stock rebuilding scenario where the stock depletion rate is simulated between 30 and 50% BMSY, only DBSRA and DBSRA4010 performed well in achieving the target reference point within 20 years (Figure 5) and 50 years (Figure 6). The other MPs showed poor performance even in maintaining the biomass above the limit reference point in simulations within 20 and 50 years. A no-fishing scenario (NFref) projection is also plotted as a reference for other MPs (Figure 5 and Figure 6). For example, if a no-fishing regulation is implemented, the stock will likely be rebuilt to B/BMSY > 1 in ~5 years in the medium term and 15 years in the long-term simulation. This suggests that only DBSRA and DBSRA4010 will likely perform well in rebuilding the P. leopardus stock if its biomass falls below the limit reference point.

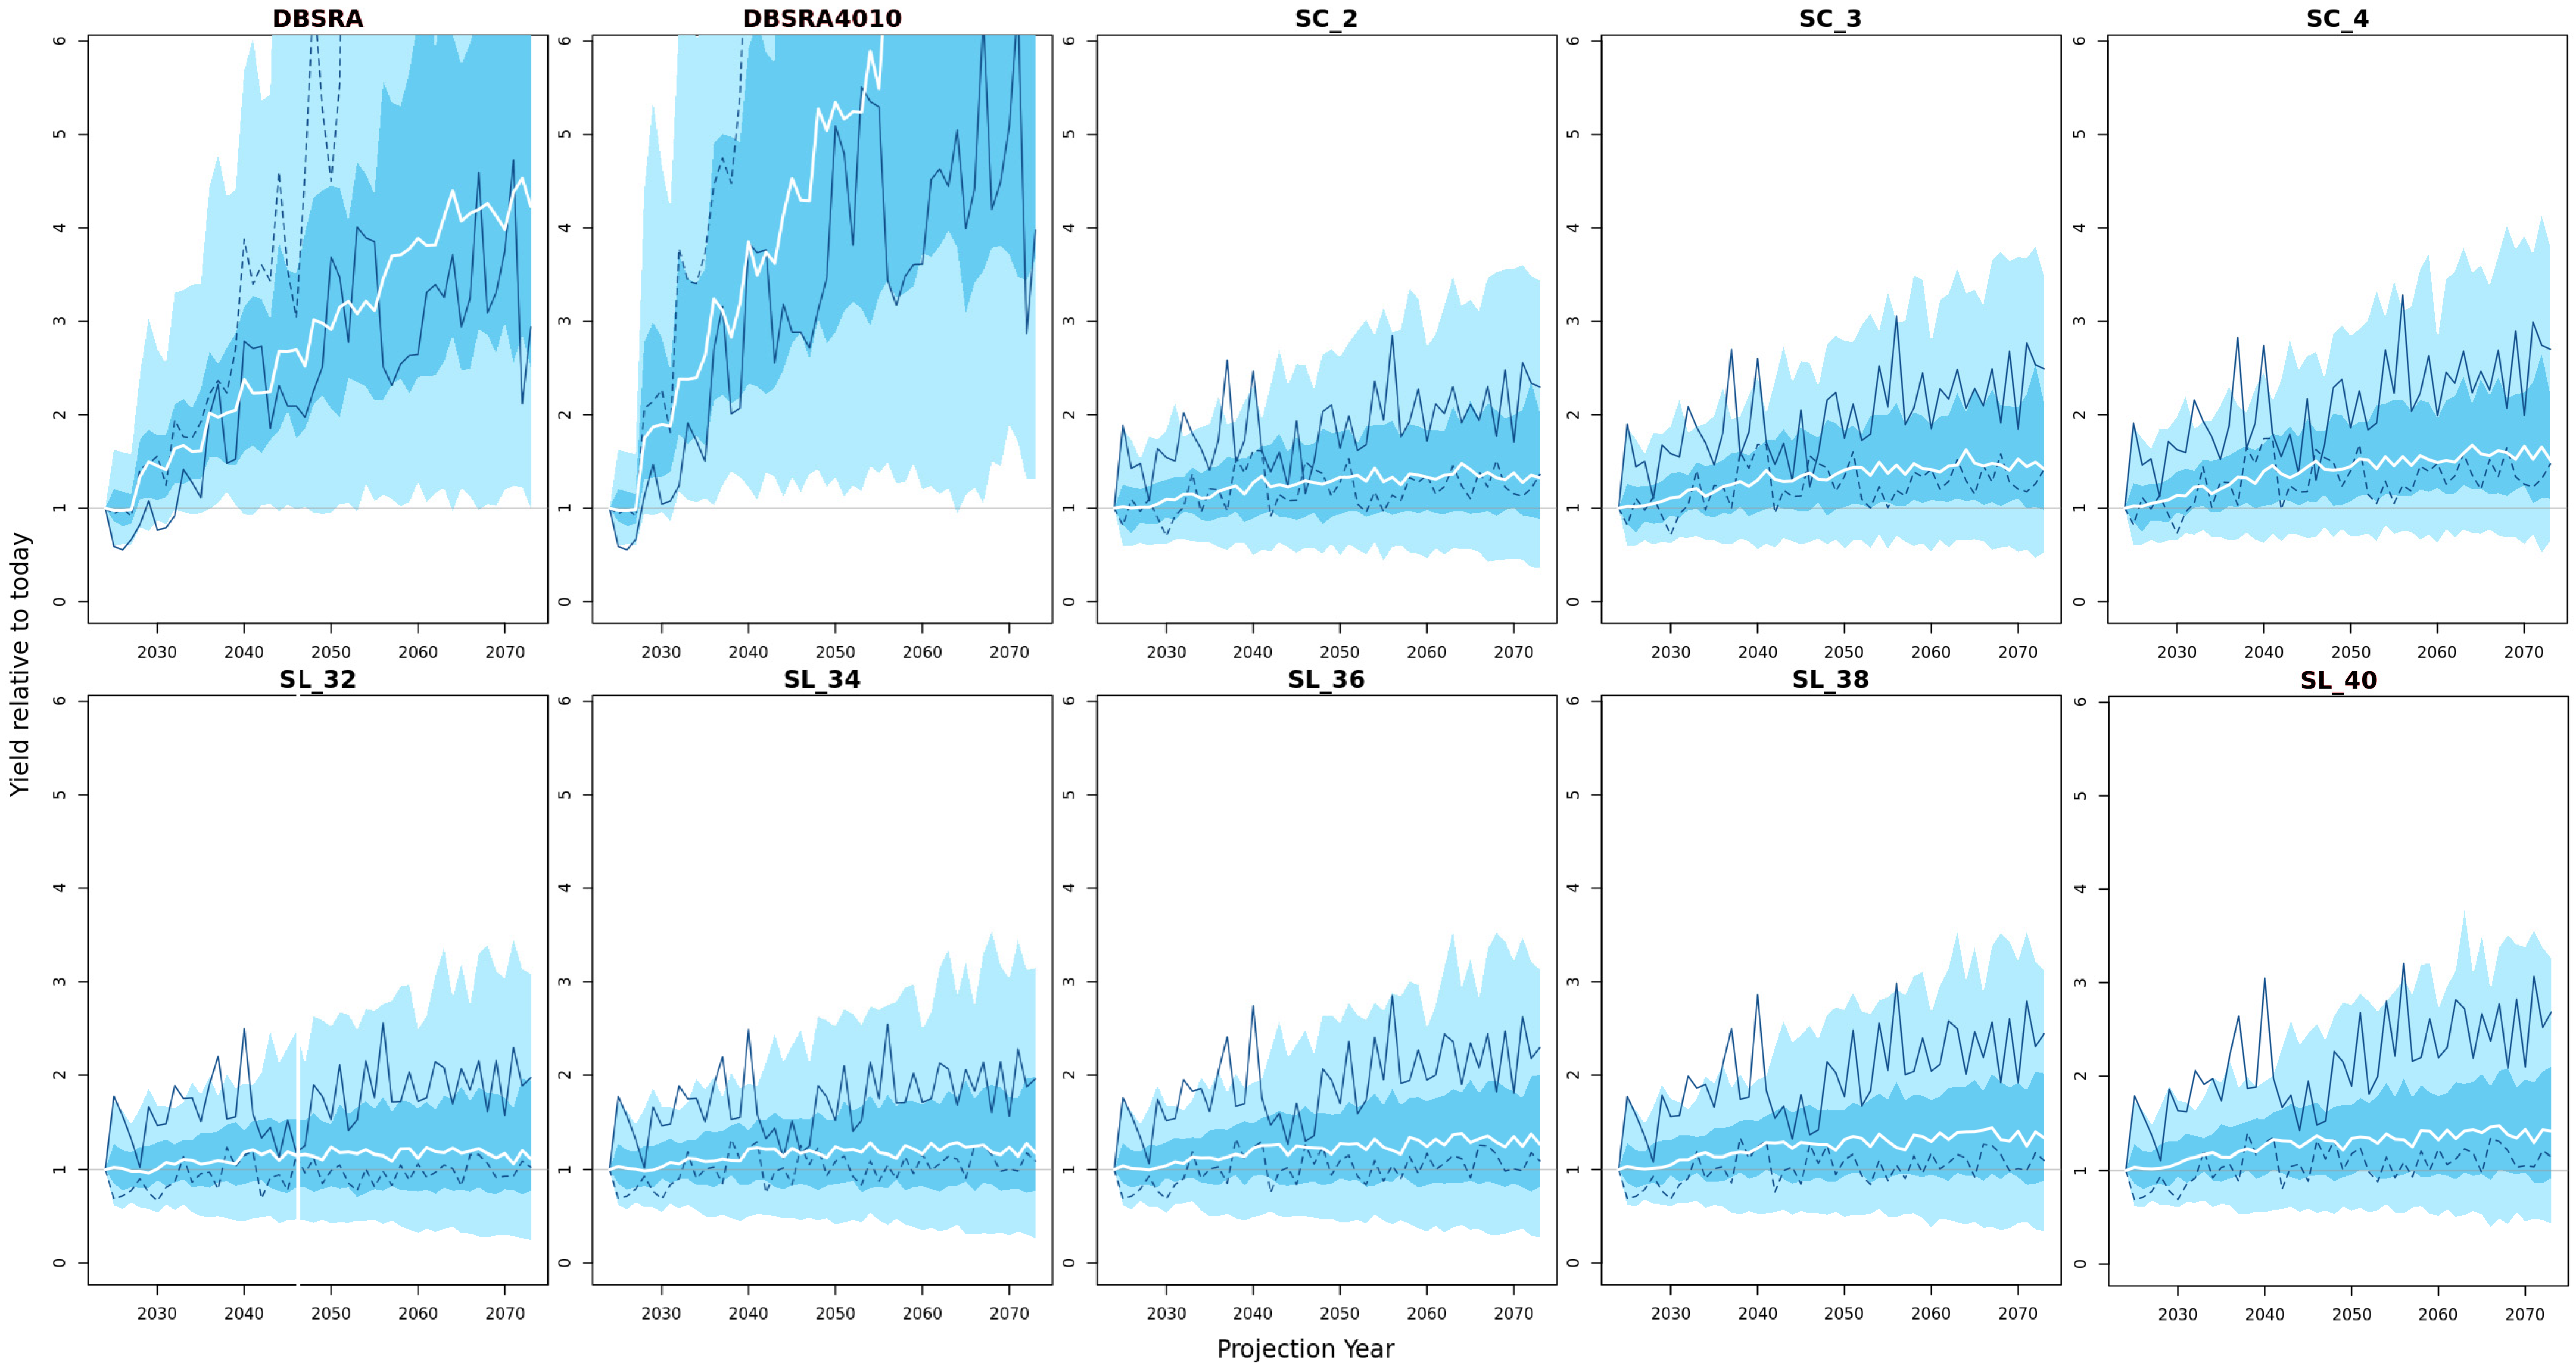
3.4. Yield Projections

In general, the yield projection plots over a 50-year period (from 2024 to 2074) showed a very good performance of the 10 MPs for maintaining the yields higher, or stable, above the current yields, i.e., Yt/Ycurr > 1 (Figure 7). The seasonal closure and size limit MPs showed a stable yield projection above the current yield with relatively low uncertainty (shown by narrow probability intervals). In contrast, DBSRA and DBSRA4010 showed a very high yield projection with a wide range of probability intervals (high uncertainty). This suggests that selecting any of these MPs to manage P. leopardus will likely maintain the long-term fishery yield in Saleh Bay.

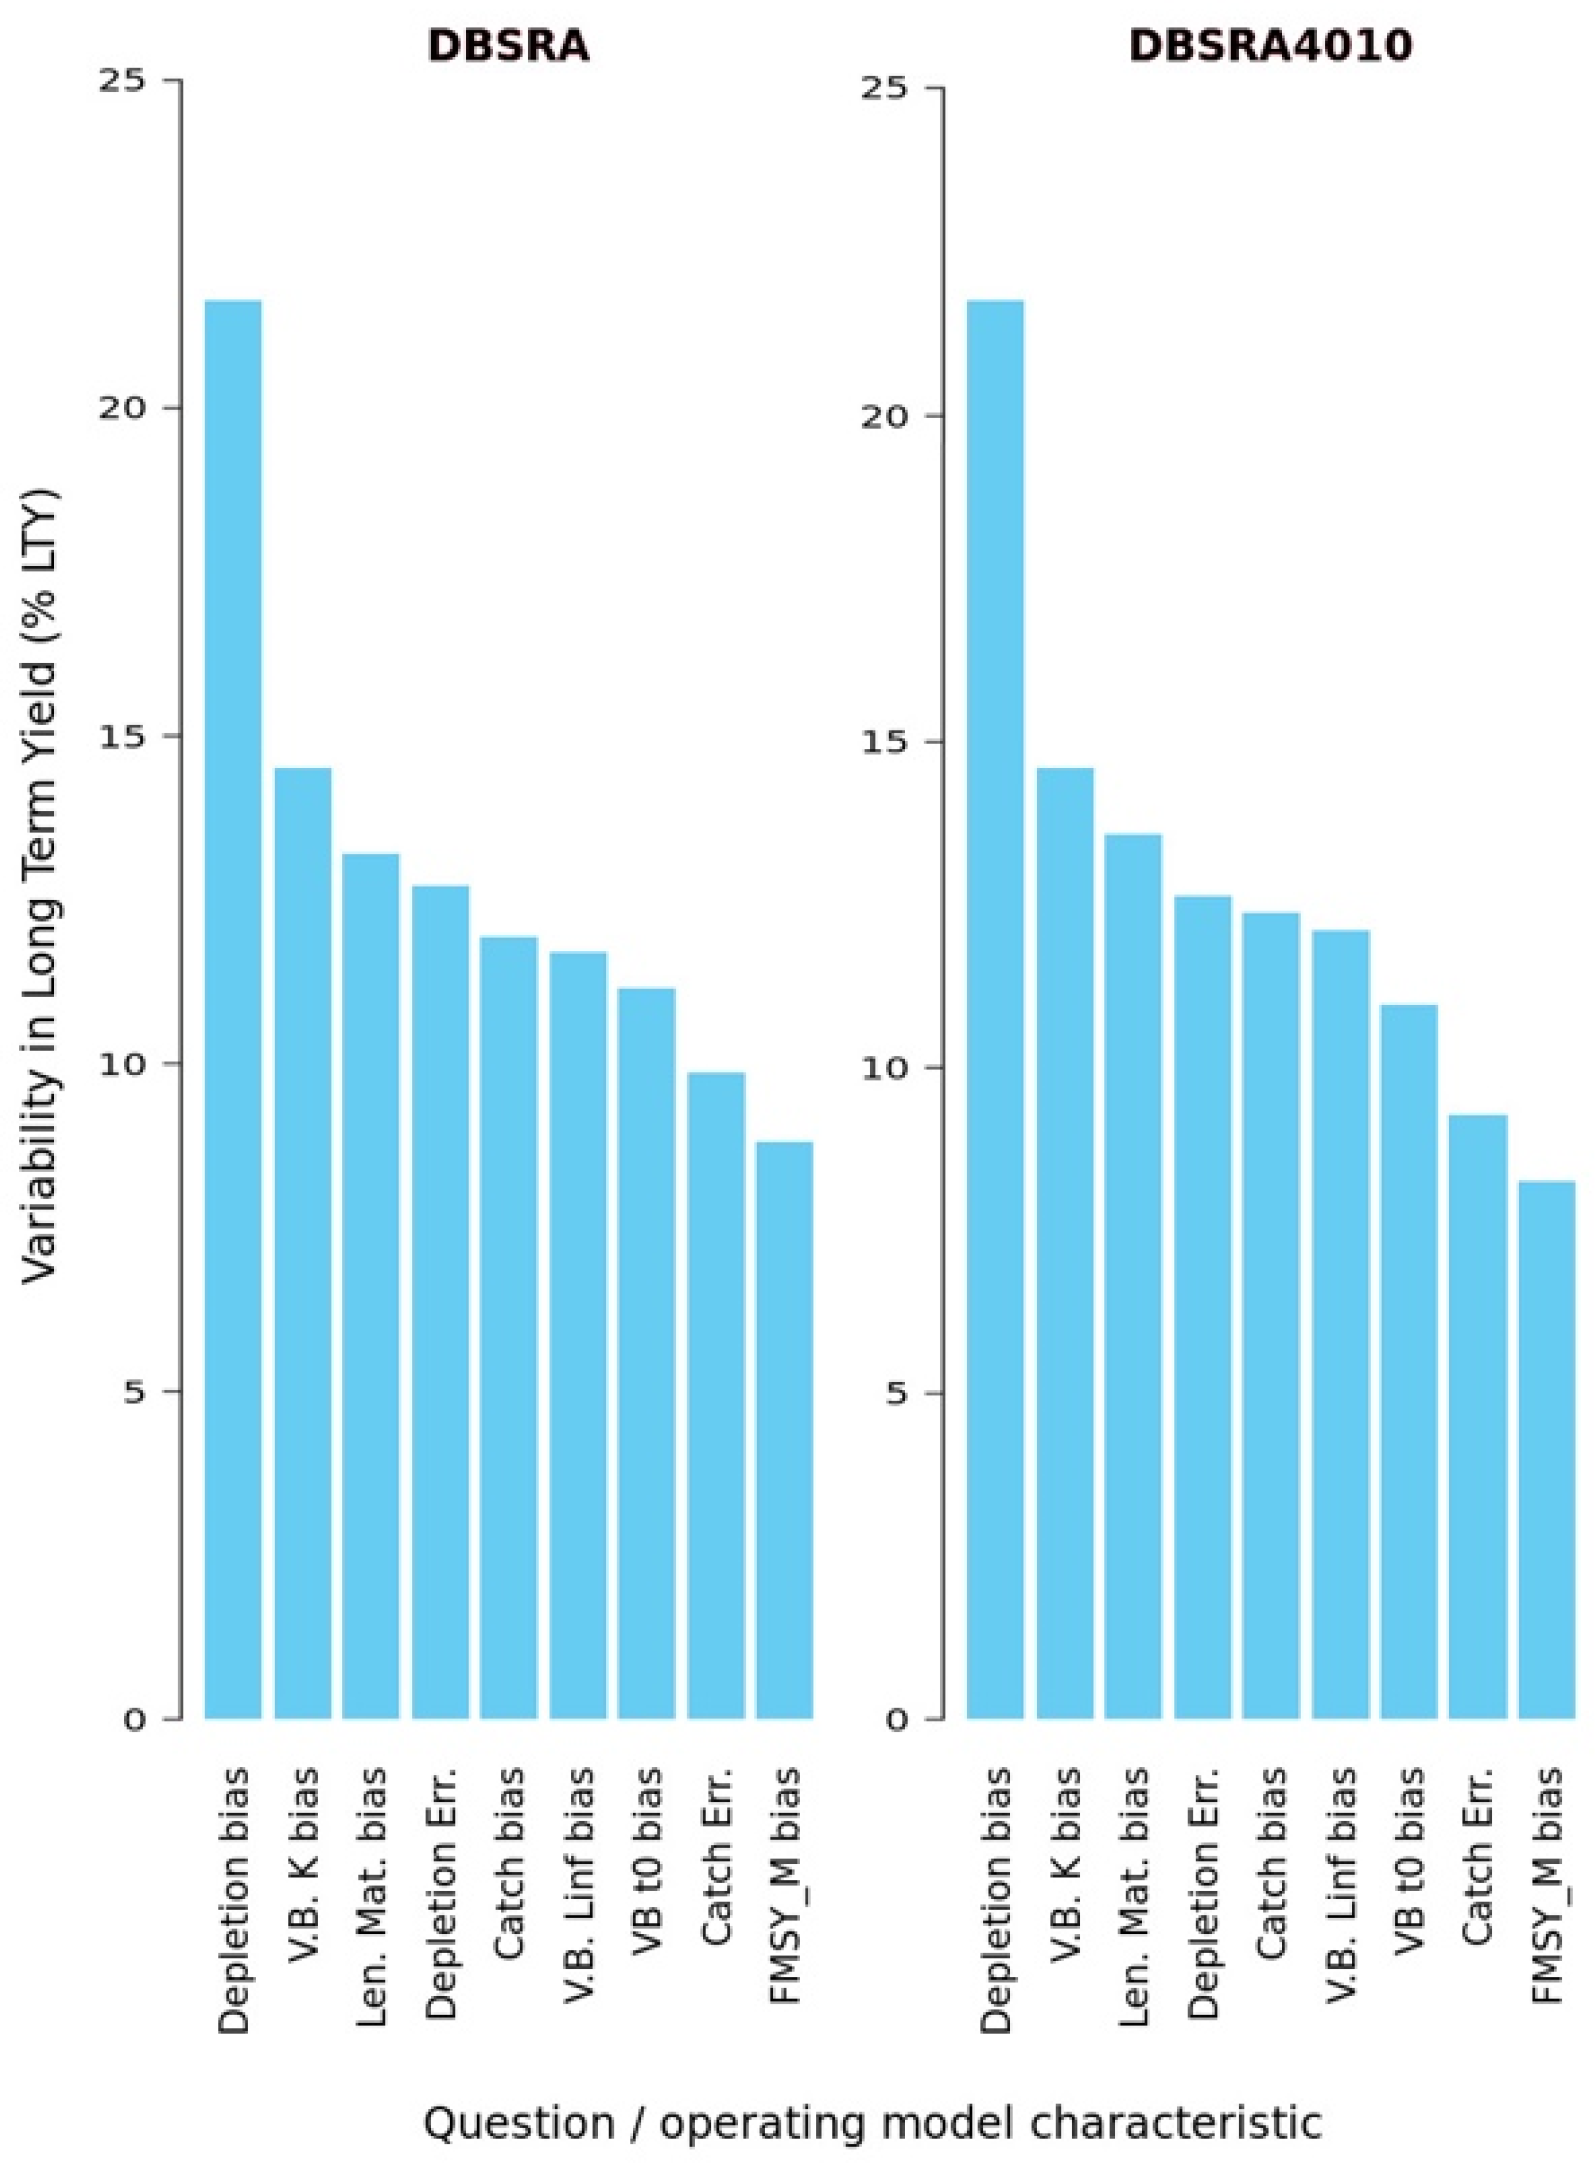
3.5. Sources of Uncertainty in Projections of the Long-Term-Yield

The sources of uncertainty contributing to the variation in the long-term yield projections (%LTY uncertainty) for P. leopardus varied across the 10 selected MPs. The maximum %LTY uncertainty ranged from 13 to 18% for the answers to the questionnaire (Figure 8), and were much higher (maximum = 27%) for the fishery data matrix (Figure 8). From the answers to the questionnaire, the longevity, fishing effort variation, TAC and TAE offsets, and hyperstability were the top five variables contributing to the uncertainty in projections of %LTY for the DBSRAs (Figure 7). The longevity (maximum age), steepness, fishing effort variation, post-release mortality, and hyperstability were the top five variables contributing to the uncertainty in projections of %LTY for the seasonal closure MPs, ranging from 11 to 14%. Fishing effort variation, post-release mortality, and hyperstability were also in the top five variables contributing most to the uncertainty in projections of %LTY for size limit MPs, as well as selectivity and future catchability. The uncertainty plots for the fishery data matrix are only available for MERA’s default MPs (DBSRAs). The top five contributing variables to uncertainty in the projections for the %LTY from the fishery data matrix were biases in depletion, von Bertalanffy’s k, length-at-maturity, and catch and depletion error (Figure 9). Depletion bias contributed by far the greatest to long-term yield uncertainty, i.e., 22%, in these projections, compared with <15% for all other variables (Figure 9).

4. Discussion

Using the Method Evaluation and Risk Assessment (MERA) application, the effect of a suite of the 10 selected default and custom management procedures (MPs) on the short (10 years), medium (20 years), and long-term (46–50 years) biomass and yield of the P. leopardus stock in Salah Bay, Indonesia, were evaluated, and uncertainties in the simulations were determined. The management procedures were evaluated in two groups: (i) simulations based on current fishery conditions and (ii) simulations under the stock rebuilding scenario. Simulations to evaluate management procedures in this study were performed based on quantitative information to the MERA questionnaire and fishery data matrix, which contains data and information on fishery dynamics, management, biology and life history, and historical catch and effort.

4.1. Performance of Management Procedures

Of the four groups of MPs simulated in MERA, i.e., total allowable catch (TAC), total allowable effort, size limits, and spatial closures, the majority of TAC-based MPs showed a high probability of achieving the limit and target reference points for biomass. Custom seasonal closure MPs, ranging from two to four months, also showed relatively high probabilities of achieving these reference points. In contrast, the default size limit and spatial closure (MPA)-based MPs (input control) were simulated to have low probabilities of achieving the reference points for almost all scenarios. The high retention of fish smaller than the 50% size-at-maturity (L50) likely contributed to the low performance of the size-limit-based MPs, especially in the stock rebuilding scenario. The catch-at-length data distribution in the fishery data matrix, collected from fish landing sites, suggests that almost 44% of P. leopardus catches are smaller than the estimated L50 (38.8 cm TL). Although the mean catch size of P. leopardus increased after enacting the size limit regulation [14], the current size limit regulation in Saleh Bay for P. leopardus is still nearly 7 cm smaller than the estimated L50.
At least two input parameters contributed to the poor performance of the spatial closure or marine protected area (MPA)-based MPs: (i) the very small size of the existing no-take area (NTA) of two MPAs, causing (ii) high spatial mixing (movement) of this species in and out of the NTAs. The total area of the NTAs of existing MPAs in Saleh Bay (Pulau Liang-Ngali MPA and Pulau Lipan-Rakit MPA, area = 45.4 km2) is ~2.2% of the total area of Saleh Bay. These two areas were designated as MPAs because they are the hotspots for coral reef ecosystem in Saleh Bay. The simulation results suggest that the current MPAs may not contribute to reducing fishing pressure on biomass. This may be because each of the NTAs of the two MPAs in Saleh Bay only has an area between 0.29 km2 and 10.1 km2 [36,37]; this is smaller than the home range of P. leopardus which can reach up to 28.2 km2 [8,38,39]. Furthermore, the majority of grouper fishing activities in Saleh Bay are carried out outside the MPA [40]. Thus, the existing MPAs will likely have a very small impact on sustaining stock.

4.2. Selection of Management Procedures

The MP selection criteria resulted in 18 MPs that achieved limit and target reference points (LRP, TRP) for biomass and yield well. However, further analysis based on the trade-off plots showed that only two default MPs, both based on the depletion-based biomass stock reduction analyses (DBSRA and DBSRA4010), performed well in maintaining the biomass above the TRP, while producing a reasonably high yield, i.e., yield at MSY. Trade-offs associated with fisheries management have been a component of providing management advice since the development of quantitative approaches in fisheries science [41,42]. In the context of single-species fisheries, trade-offs are often quantified for various purposes, for example, trade-offs between (i) maintaining high long-term yield and the risk of the stock dropping below some biomass thresholds, (ii) variability of catch and average catch associated with the selection of harvest control rules, or (iii) rate of stock rebuilding and maintaining yield during the rebuilding period [42]. In the current study, the LRP for long-term yield (LTY) was set as >0.5 MSY as an additional MP selection criterion. In general, although most of the selected MPs for P. leopardus showed a good performance in maintaining biomass above the LRPs, only a few had a reasonably high probability of reaching LTY > 0.5 MSY.
The trade-off plot analysis suggests that only DBSRA and DBSRA4010 may be selected as management recommendations as they had the highest probabilities of achieving the biomass and yield targets. Nevertheless, the size limit and seasonal closure MPs may also be considered as management recommendations as they have a high probability of maintaining biomass above the limit reference point (LRP) and a high probability of maintaining a high yield. In certain fishery conditions (e.g., low stock biomass or spawning potential ratio), the fishery manager may consider implementing MPs with a high probability of keeping the stock biomass above its limit reference point and placing less weight on achieving the yield target, as an initial stage of fishery management.
The DBSRA methods assume long-term historical catch data from the beginning of the fishery are available [43,44], together with estimates of four key parameters: (1) the current depletion level, (2) the natural mortality rate (M), (3) the ratio of FMSY to natural mortality (FMSY/M), and (4) the biomass at MSY relative to the unfished biomass (BMSY/B0) [19]. The four key parameters used in this study were derived from a previous study on the P. leopardus stock in Saleh Bay [26] that relies on very short historical catch data (2016–2017), which may result in high uncertainty in the parameter estimation. The current study also used relatively short historical catch data, i.e., 2009–2021 for total catch and 2016–2021 for catch-at-length composition. In addition, the 2009–2021 historical total catch data were derived from the provincial fisheries statistics, and the 2016–2021 catch-at-length composition was derived from the fish landing monitoring program. The limited catch data and differences in sources for the historical catch data will also produce uncertainty in the simulation results. Although the available data are limited and may have high uncertainty, these data are the only available data for describing the historical condition of P. leopardus stocks and fishery in the study area.
Stock depletion (D) in this study is defined as the ratio between current and unfished biomass [19]. However, stock depletion is very difficult to estimate, especially in data-limited fisheries [45]. Historical catch data in Saleh Bay are available from 2009 to 2015 (fisheries statistics data) and 2016 to 2021 (FLM program data). Given no adequate long-term historical catch data (e.g., 30 years or more) are available for Saleh Bay, estimating the stock depletion using the available catch data (13 years) is problematic. Prior estimation of stock depletion using MERA’s stock determination mode produces an estimated depletion value of 0.52 (spawning stock biomass; SSB = 0.52 B0). This estimation result was not chosen based on two considerations: (1) the estimation is based on relatively short historical catch data, and (2) this value is too optimistic when referring to Amorim et al. [1], where SSB > 40% is a non-fully exploited stock, which is contradictory to the results of the previous studies in Saleh Bay [14,16].
Based on the above consideration, the current stock depletion value provided to MERA for model conditioning was estimated based on the current SPR (spawning potential ratio) value of P. leopardus in Saleh Bay, using the equilibrium MSY and SPR (spawning potential ratio) relationship [34] and the general equilibrium model for the biomass−MSY relationship (e.g., [35]). Based on the D value set by the user in MERA, for example, DBSRA generally estimates TAC based on the estimated value of FMSY multiplied by the current estimate of abundance (B0 × D). The DBSRA models have been used by the Pacific Fishery Management Council to set and evaluate the Overfishing Limit (OFL) and Acceptable Biological Catch (ABC) for data-limited mackerel (Scombridae), butterfish (Stromateidae), snapper (Lutjanidae), porgy (Sparidae), sole (Pleuronectidae), and a wide range of rockfish (Sebastidae) species [19,43,46].
In practice, it is difficult to accurately estimate the exact value of the total allowable catch for P. leopardus based on the DBSRA methods. The TAC calculation for the DBSRA models relies on the assumed fishing mortality at MSY (FMSY) and the estimation of the current stock biomass (virgin biomass multiplied by the estimated depletion rate). In addition, the current annual catch data are considered under-reported (it is estimated that only ~50% of the actual annual catch is recorded in the regular catch monitoring; where catch monitoring is only conducted at maximum 15 days per month), giving an even more challenging TAC estimation.
The custom MPs based on reducing catch proportionally, extended seasonal closures, and size limits were developed and tested to explore alternative MPs to those based on TAC. The closed-loop simulation results for the custom MPs suggest that reducing annual catch to 10 to 40% will maintain the biomass but with a relatively low probability of achieving LTY. On the other hand, reducing fishing effort through a seasonal fishing closure of 3 to 4 months suggests a better trade-off between LTY and stock biomass. In addition, setting a catch size limit at 40 cm for P. leopardus also showed a good yield–biomass trade-off. However, the feasibility of implementing a 3 to 4 month fishing closure and setting a minimum catch size of 40 cm, 8 cm above the current size limit, is not likely to gain the approval from stakeholders needed to be implemented effectively. Nevertheless, reducing the fishing effort through a seasonal closure consistently showed the best yield–biomass trade-off. These findings are consistent with a study by Williams and Shertzer [47], where controlling fishing mortality is likely more effective than gear selectivity in sustaining harvest and maximizing yield for species with low natural mortality, such as the P. leopardus. In addition, the current agreed size limit is about 7 cm below the estimated L50 of 38.8 cm (nearly 20% smaller than L50); thus, exploring possible accepted larger size limit is worthwhile.
The “cost of uncertainty” calculation helps to understand which areas of current knowledge of the fisheries system need further investigation and the level of uncertainty that might occur when management advice is implemented [24]. For example, fishing effort variation, hyperstability, and estimation of von Bertalanffy’s k and length-at-maturity are among the highest sources of uncertainty for the majority of the tested MPs; hence, these are the areas in the fishery system that need further study in Saleh Bay. The length-at-maturity is particularly important to help set accepted size limits that are likely to have considerable effects on the spawning stock and may be used to rebuild the spawning potential ratio [6]. Understanding the source of uncertainties also helps fisheries managers be aware of uncertainties (% of variability) in expected management outcomes (i.e., yield) when a particular management procedure is implemented.

4.3. Identification of Recommended Management Procedures

MSE simulations favor TAC-based management for the P. leopardus fishery in Saleh Bay over size limits and seasonal closures in reaching the target biomass reference point (TRP). However, the actual TAC number should be carefully defined based on the current annual catch, prior to implementation. This requires a better estimate of the current annual catch for setting an accurate TAC since the current estimate might not reflect the actual annual catch.
Learning from the application of MSE using data-limited methods (DLMs) for some key fisheries (e.g., barred sand bass, southern California halibut, southern red sea urchin, and warty sea cucumber in California [22]), this approach helped the authority and stakeholders evaluate and identify a range of acceptable management procedures specific for each fishery (e.g., effort control for barred sand bass, and output control for the southern California halibut) with a high probability of performing well over a range of stock and fishery system uncertainties. The MSE approach also helped identify the need for additional information to improve data collection and research programs, for example, the estimation of natural mortality rate of the warty sea cucumber [22]. The MERA application provides a generic DLM tool that is accessible online for wide use of MSE, with the potential for progression to tailored and more inclusion of data-rich methods. Furthermore, when needed, the MSE approach can also be used with customized DLM methods for specific fisheries. Carruthers [21] showed good examples of creating customized DLM methods specifically to meet the applicability to some Canadian data-limited fisheries (arrowtooth flounder, canary rockfish, and rougheye rockfish). There were 55 custom DLM tools developed for these fisheries that cover a wide range of functions, e.g., stock assessment, stochastic model for historical data reconstruction, and graphing tool to summarize simulation result [21].
Fisheries managers and stakeholders in Saleh Bay should understand the limitations of MERA, including the risk (cost of uncertainties) and behavior of each management procedure (MP). For example, the knowledge on species’ maximum age (longevity) contributes the highest uncertainty to the estimation of long-term yield (LTY) for the depletion-based stock reduction analysis (DBSRA) MPs, while knowledge about catch selectivity contributes the highest uncertainty to the size limit MPs. Furthermore, the effectiveness of implementing size limit MPs varies among species with different reproductive strategies and lengths-at-maturity, but MERA implements the same treatment in the simulation regardless of the species’ reproductive strategies [48]. Plectropomus leopardus is a protogynous hermaphrodite and a large, fecund species, and the size limit is probably more effective in protecting males and gives juveniles a greater chance of reaching reproductive age [49] compared to other species. In addition, a significant challenge in stock assessment (i.e., using MSY as a performance indicator) is the reliance on a single metric to describe fish population dynamics and their life histories. Furthermore, stock assessment methods are often built on simplified assumptions that fail to capture the inherent ecosystem variability, which creates uncertainties. When considering the distribution tails of population characteristics, the effects of these simplifications become clear, where the selection of distribution tails of population characteristics can significantly impact the robustness of the models used in the simulation. Thus, such limitations in MERA’s operating model should also be acknowledged.
There have been many efforts to manage small-scale and data-limited fisheries, including through catch size limits, spawning seasonal closures, mesh size regulation, and marine protected area designation (e.g., [6,8]). Since 2018, the West Nusa Tenggara (WNT) government has also implemented grouper and snapper fisheries regulations for Saleh Bay in the form of size limits, fishing gear specifications, and marine protected area (MPA) management through Governor Regulation No. 32/2018 [15]. The effectiveness of limiting catch (TAC) and fishing effort (TAE) management approaches for snapper and grouper in Saleh Bay has not been specifically evaluated. The application of TAC and TAE is not currently considered feasible due to a lack of supporting regulations and management tools for implementing these measures and ensuring compliance with them.
Applying the TAC approach (e.g., by a quota system) requires developing additional supporting systems, such as a catch reporting mechanism for fishers and fish collectors. In addition, it is very important to have the best estimate of the real annual catch of the species, to ensure an accurate TAC setting. Thus, for the initial step, applying a TAC in Saleh Bay can only be initiated when: (i) the actual annual catch can be estimated accurately, and (ii) strong data collection and catch reporting mechanisms are in place. However, ensuring the fishers and fish collectors fully comply with the TAC (i.e., to halt fishing activities when the TAC is reached) is a very challenging task given the dynamic and complexity of the fisheries. Potential mechanisms for making TAC measures feasible in this region include: (i) designing and implementing a surveillance and enforcement mechanism to ensure TAC compliance and/or (ii) implementing an inclusive management policy by ensuring the full participation of fishers and fisheries businesses (particularly processors) in monitoring, evaluation, and management decision making.
Reducing fishing effort through seasonal closures is also challenging and is unlikely to be accepted by stakeholders, especially if the closure is implemented over a relatively long period of time (e.g., 2–4 months). Another challenge in reducing fishing effort in small-scale fisheries is the limited alternative livelihood options for fishers [8]. However, more targeted seasonal closures can be implemented in relation to the spawning season for specific species. For example, implementing spatial and temporal fishing restrictions at spawning aggregation sites during the spawning season will significantly reduce pressure on grouper populations [50,51]. In addition, banning sales of vulnerable grouper species during the closed season may also be an option to amplify the effectiveness of fishing pressure reduction [3]. However, implementing seasonal closures will likely cause fishers to change their target species, which may shift pressure to other fish populations. This phenomenon was reported by Chavarro et al. [52], where a four-month closure of grouper spawning aggregation sites during the spawning season in Palau led to potentially overfishing on bluespine unicornfish (Naso unicornis) by the spear fishery. Therefore, the feasibility of implementing seasonal closures needs to be carefully studied and evaluated.
Since 2021, the government of Indonesia has been implementing a new fishery policy called “perikanan terukur” (measurable fisheries), which includes implementing a catch quota system. This policy provides both an opportunity and a challenge for how the government can provide regulations and develop a system that allows the implementation of a quota system for industrial-scale and small-scale fisheries. Ensuring compliance with the quota system in small-scale fishery is undoubtedly more challenging than for large-scale/industrial fisheries because of (1) the dynamic characteristics of the SSF, (2) SSF do not have a vessel licensing system, (3) the majority of catches from SSF are not landed at official fishing ports, and (4) the logbook system to record catch and effort has not been applied to SSF in Indonesia (see also [53,54,55]).
An earlier study conducted on the stock status of P. leopardus in Saleh Bay [5] revealed that the spawning potential ratio (SPR) for this species is notably low, falling below the reference point threshold (SPR < 0.2). However, a recent assessment of fisheries management in Saleh Bay has indicated an improvement in the stock status, with SPR values exceeding 0.2 [16,33]. This improvement can plausibly be attributed to the enforcement of fishing regulations enacted in 2018. Nevertheless, this study implies that the size limit regulation and the existing no-take areas within the marine protected area (MPA) in Saleh Bay may not be effectively accomplishing the targeted biomass reference points. The relatively low compliance with the size-limit regulation (also consistent with Effendi et al. [14]), and the very small proportion of MPA’s no-take area compared to the total fishing ground areas in Saleh Bay [40], is likely to contribute to the poor performances of these MPs. There are several approaches that can be taken to improve fishers’ compliance with regulations, including (1) strengthening the control to fishing effort and unsustainable fishing practices (e.g., [8]), (2) enforcing rules through stricter sanctions (e.g., [53]), (3) improving fishers’ understanding by involving them in catch monitoring activities (e.g., [6,56]), and (4) strengthening the participation of fishing communities in fisheries planning and management (e.g., [57]).
Numerous studies have shown that marine protected areas are effective in protecting highly fecund fish, such as P. leopardus, in maintaining their reproductive outputs [58], reducing fishing pressure [59], and protecting important habitats for different stages in the life cycle such as nursery, feeding, and spawning grounds [60]. A study by Williamson et al. [61] found that P. leopardus juveniles could spread as far as 250 km from their natal area. This indicates that the role of MPA is very important to protect the reproductive cycle of this species. If managed effectively, MPAs will provide spill-over effects, increasing fish biomass in surrounding waters [61,62]. Conversely, MPA management solely is unlikely to be effective in sustaining fisheries stock [62]; hence, a combination with market-based management approaches and property rights systems is recommended as a complement to conventional fisheries management through limiting catch and effort [8,63].
The MPA’s no-take areas in Saleh Bay were established based on considerations of coral reef health and reef fish abundance and biomass [36,37], and were not specifically designed to maintain specific fisheries stocks. Furthermore, limiting fishing efforts through increasing the size of spatial closures (MPA) in Saleh Bay is unlikely to improve in the near future, since the existing marine spatial plan of West Nusa Tenggara (Provincial Regulation No. 12 of 2017) does not allocate areas for establishing new MPAs in Saleh Bay, in addition to the existing two MPAs. Nevertheless, the expansion of no-take areas within the existing MPAs may also be recommended and implemented in the future during the regular five-year MPA zoning plan evaluation. In addition, the effectiveness of surveillance and law enforcement to ensure compliance with the existing MPA no-take areas in Saleh Bay remains uncertain (see [40]); this is the area where the management authority should prioritize their management efforts. Thus, appropriate zoning design combined with enduring enforcement and compliance will generate effective MPAs to achieve conservation and fisheries management goals [64].
Although the size limit and spatial closure MPs have poor performances in achieving the desired biomass target, these MPs show good performances in maintaining biomass above the limit reference point. In addition, these MPs also show a very good performance in maintaining a stable long-term yield equal to today’s yield. Given that the TAC management procedures are still difficult to implement, implementing size limits and spatial closures through MPA management remains the best option in the current management capacity and fisheries condition in Saleh Bay. However, it is still important for the West Nusa Tenggara government to continue to improve the implementation of the existing fisheries management plan in Saleh Bay while simultaneously developing the necessary supporting management instruments (i.e., policy, regulations, and mechanisms) toward implementing TAC and effort control measures if the rebuilding stock policy for P. leopardus is implemented. Overall, the results from this study are not the final advice to management, as they need to be discussed with a wide range of stakeholders before being translated into management policy.
The application of the MERA tool to evaluate management procedures in this study is built on knowledge of stock conditions based on historical catches and biological characteristics of the species studied. However, from an ecosystem dynamics point of view, stock abundance will also be influenced by habitat changes (e.g., nursery capacity) caused by dynamic interactions between biotic and environmental components (e.g., [65]), which is outside the scope of this study. Further study to understand the interactions between stocks and the habitat and environmental changes will be critical to reducing uncertainty in future stock estimates and improving adaptive fisheries management in Saleh Bay.

5. Conclusions

This study has demonstrated how the Method Evaluation and Risk Assessment platform can be used to evaluate currently implemented management procedures and how likely they are to achieve desired management objectives. Although the simulation results showed that, if implemented and rigorously enforced, the current management procedures (minimum catch size and spatial closure) in Saleh Bay are capable of keeping the stock biomass of P. leopardus above the limit reference point, the management authority needs to explore at least three options in order to achieve the management objective of increasing the biomass of this species to B/BMSY > 1. These are (1) reducing the current fishing pressure through the implementation of TAC and seasonal closure, (2) improving the management effectiveness (monitoring and enforcement) of the currently implemented management procedures, and (3) improving management plans of existing MPAs to support fisheries management objectives.

Supplementary Materials

The following supporting information can be downloaded at: https://www.mdpi.com/article/10.3390/fishes8100498/s1, Table S1: Data input to MERA for Plectropomus leopardus; Table S2: Fishery data matrix for operational model conditioning; Table S3: The 20 MERA default management procedures (MPs) simulated in this study; Script S4: R-scripts for custom management procedures.

Author Contributions

Conceptualization, B.W., J.R.T., S.H.W., N.R.L. and Y.H.; methodology, A.H., N.R.L. and Y.H.; formal analysis, I.Y., M.N., S.A. and Y.H.; investigation, A.H. and N.R.L.; data curation, I.Y., M.N., S.A. and Y.H.; writing—original draft preparation, Y.H.; writing—review and editing, A.H., B.W., J.R.T., N.R.L. and Y.H.; visualization, N.R.L. and Y.H; supervision, A.H., B.W., J.R.T., S.H.W. and N.R.L.; funding acquisition, I.Y., N.R.L. and Y.H. All authors have read and agreed to the published version of the manuscript.

Funding

This study was supported by funding from the Ocean Stewardship Fund, Murdoch University, and the Wildlife Conservation Society on behalf of the KfW Development Bank and the Clive Marsh Conservation Scholarship.

Data Availability Statement

Data will be made available on reasonable request.

Acknowledgments

Representatives from the Marine and Fisheries Agency of West Nusa Tenggara Province, Wildlife Conservation Society Indonesia Program, Faculty of Fisheries of Mataram University, and the scientific forum for fisheries management of West Nusa Tenggara (FIP2B) for their contribution during the MERA workshop and data verification; Thomas Carruthers for guidance and technical supports on MERA analysis; Intan Hartati, Isnaini Marliana, and Jessica Pingkan for fishery data and map preparation.

Conflicts of Interest

The authors declare no conflict of interest. The funders had no role in the study design; in the collection, analyses, or interpretation of data; in the writing of the manuscript; or in the decision to publish the results.

References

  1. Amorim, P.; Sousa, P.; Jardim, E.; Menezes, G.M. Sustainability Status of Data-Limited Fisheries: Global Challenges for Snapper and Grouper. Front. Mar. Sci. 2019, 6, 654. [Google Scholar] [CrossRef]
  2. Amorim, P.; Westmeyer, M. Snapper and Grouper: SFP Fisheries Sustainability Overview 2015; Sustainable Fisheries Partnership: Honolulu, HI, USA, 2015; Available online: http://sfpcms.sustainablefish.org.s3.amazonaws.com/2016/03/07/SFP_Sectoral_Report_Snappers_Groupers_Final-99f93c03-d0ade6ae.pdf (accessed on 12 January 2023).
  3. Sadovy de Mitcheson, Y.J.; Linardich, C.; Barreiros, J.P.; Ralph, G.M.; Aguilar-Perera, A.; Afonso, P.; Erisman, B.E.; Pollard, D.A.; Fennessy, S.T.; Bertoncini, A.A.; et al. Valuable but Vulnerable: Over-Fishing and Under-Management Continue to Threaten Groupers so What Now? Mar. Policy 2020, 116, 103909. [Google Scholar] [CrossRef]
  4. FAO. Food and Agriculture Organization of the United Nations Fishery and Aquaculture Statistics; Global Capture Production 1950–2013; Updated 2022. Available online: https://www.fao.org/fishery/statistics-query/en/global_production/global_production_quantity (accessed on 22 March 2023).
  5. Halim, A.; Loneragan, N.R.; Wiryawan, B.; Hordyk, A.R.; Sondita, M.F.A.; Yulianto, I. Evaluating Data-Limited Fisheries for Grouper (Serranidae) and Snapper (Lutjanidae) in the Coral Triangle, Eastern Indonesia. Reg. Stud. Mar. Sci. 2020, 38, 101388. [Google Scholar] [CrossRef]
  6. Prince, J.; Victor, S.; Kloulchad, V.; Hordyk, A. Length Based SPR Assessment of Eleven Indo-Pacific Coral Reef Fish Populations in Palau. Fish. Res. 2015, 171, 42–58. [Google Scholar] [CrossRef]
  7. Mudjirahayu; Bawole, R.; Rembet, U.N.W.J.; Ananta, A.S.; Runtuboi, F.; Sala, R. Growth, Mortality and Exploitation Rate of Plectropomus maculatus and P. oligocanthus (Groupers, Serranidae) on Cenderawasih Bay National Park, Indonesia. Egypt. J. Aquat. Res. 2017, 43, 213–218. [Google Scholar] [CrossRef]
  8. Frisch, A.J.; Cameron, D.S.; Pratchett, M.S.; Williamson, D.H.; Williams, A.J.; Reynolds, A.D.; Hoey, A.S.; Rizzari, J.R.; Evans, L.; Kerrigan, B.; et al. Key Aspects of the Biology, Fisheries and Management of Coral Grouper. Rev. Fish Biol. Fish. 2016, 26, 303–325. [Google Scholar] [CrossRef]
  9. Andamari, R.; Moria, S.B.; Permana, G.N. Aspects of Leopard Coral Grouper (Plectropomus leopardus). Indones. Aquac. J. 2007, 2, 51–57. [Google Scholar]
  10. Craig, M.T.; de Mitcheson, Y.S.; Heemstra, P.C. Groupers of the World: A Field and Market Guide; CRC Press: Boca Raton, FL, USA, 2011; ISBN 978-1-920033-11-8. [Google Scholar]
  11. Herdiana, Y.; Agustina, S.; Hartati, I.D.; Utami, A.; de la Rosa, E.; Yulianto, I. Fisheries Management for the Leopard Coral Grouper (Plectropomus leopardus) in Saleh Bay, West Nusa Tenggara, Indonesia. In Proceedings from Workshops on Management Strategy Evaluation of Data-Limited Fisheries: Towards Sustainability—Applying the Method Evaluation and Risk Assessment Tool to Seven Indonesian Fisheries; Murdoch University: Perth, WA, Australia; IPB University: Bogor, Indonesia, 2021; pp. 129–150. ISBN 978-0-646-82951-7. [Google Scholar]
  12. Ministry of Marine Affairs and Fisheries. Pusat Data Statistik dan Informasi (Pusdatin) Data Produksi Perikanan 2023. Available online: https://statistik.kkp.go.id/home.php (accessed on 12 August 2022).
  13. Yulianto, I.; Kartawijaya, T.; Rafandi, M.T.; Agustina, S.; Pingkan, J.; Aminollah; Nurjamil; Sabariyono; Widodo; Ramadhan, S.; et al. Profil Perikanan Tangkap di Teluk Saleh dan Teluk Cempi Provinsi Nusa Tenggara Barat; Wildlife Conservation Society: Bogor, Indonesia, 2016. [Google Scholar]
  14. Efendi, D.S.; Adrianto, L.; Yonvitner; Wardiatno, Y. An Evaluation of Grouper and Snapper Fisheries Management Policy in Saleh Bay, Indonesia. IOP Conf. Ser. Earth Environ. Sci. 2021, 744, 012013. [Google Scholar] [CrossRef]
  15. Retnoningtyas, H.; Yulianto, I.; Soemodinoto, A.; Herdiana, Y.; Kartawijaya, T.; Natsir, M.; Haryanto, J.T. Stakeholder Participation in Management Planning for Grouper and Snapper Fisheries in West Nusa Tenggara Province, Indonesia. Mar. Policy 2021, 128, 104452. [Google Scholar] [CrossRef]
  16. Agustina, S.; Natsir, M.; Gigentika, S.; Marliana, I.; Anas, A.; Rafandi, M.T.; Hernawati; Kartawijaya, T.; Prasetia, R. Telaah Ilmiah Pengelolaan Perikanan Kerapu Dan Kakap Berkelanjutan Di Nusa Tenggara Barat 2023; Forum Ilmiah Pengelolaan Perikanan Berkelanjutan (FIP2B Provinsi Nusa Tenggara Barat): Mataram, Indonesia, 2023. [Google Scholar]
  17. Fisheries Improvement Program. Saleh Bay Snapper and Grouper—Bottom Longline and Handline. Available online: https://fisheryprogress.org/fip-profile/indonesia-saleh-bay-snapper-and-grouper-bottom-longline-and-handline (accessed on 22 March 2023).
  18. Punt, A.E.; Butterworth, D.S.; de Moor, C.L.; De Oliveira, J.A.A.; Haddon, M. Management Strategy Evaluation: Best Practices. Fish Fish. 2016, 17, 303–334. [Google Scholar] [CrossRef]
  19. Carruthers, T.R.; Punt, A.E.; Walters, C.J.; MacCall, A.; McAllister, M.K.; Dick, E.J.; Cope, J. Evaluating Methods for Setting Catch Limits in Data-Limited Fisheries. Fish. Res. 2014, 153, 48–68. [Google Scholar] [CrossRef]
  20. Goethel, D.R.; Lucey, S.M.; Berger, A.M.; Gaichas, S.K.; Karp, M.A.; Lynch, P.D.; Walter, J.F. Recent Advances in Management Strategy Evaluation: Introduction to the Special Issue “Under Pressure: Addressing Fisheries Challenges with Management Strategy Evaluation”. Can. J. Fish. Aquat. Sci. 2019, 76, 1689–1696. [Google Scholar] [CrossRef]
  21. Carruthers, T.R. Customizing DLMtool for Canadian Fisheries; Technical Report for Fisheries and Oceans Canada; Fisheries and Oceans Canada: Vancouver, BC, Canada, 2017; Available online: https://www.datalimitedtoolkit.org/wp-content/uploads/2017/09/Customizing-DLMtool-for-Canadian-Fisheries-WEB.pdf (accessed on 25 March 2023).
  22. Hordyk, A.; Newman, D.; Carruthers, T.R.; Suatoni, L. Applying Management Strategy Evaluation to California Fisheries: Case Studies and Recommendations. 2017. Available online: https://www.datalimitedtoolkit.org/wp-content/uploads/2017/07/Applying-MSE-to-CA-Fisheries-Case-Studies-Recommendations.pdf (accessed on 25 March 2023).
  23. Loneragan, N.; Wiryawan, B.; Hordyk, A.; Halim, A.; Proctor, C.; Satria, F.; Yulianto, I. Proceedings from Workshops on Management Strategy Evaluation of Data-Limited Fisheries: Towards Sustainability—Applying the Method Evaluation and Risk Assessment Tool to Seven Indonesian Fisheries; Murdoch University: Perth, WA, Australia; IPB University: Bogor, Indonesia, 2021; ISBN 978-0-646-82951-7. [Google Scholar]
  24. Carruthers, T.R.; Huynh, Q.C.; Hordyk, A.R.; Newman, D.; Smith, A.D.M.; Sainsbury, K.J.; Stokes, K.; Morison, A.; Agnew, D.; Parma, A.; et al. Method Evaluation and Risk Assessment: A Framework for Evaluating Management Strategies for Data-limited Fisheries. Fish Fish. 2023, 24, 279–296. [Google Scholar] [CrossRef]
  25. Hordyk, A.R.; Carruthers, T.R. A Quantitative Evaluation of a Qualitative Risk Assessment Framework: Examining the Assumptions and Predictions of the Productivity Susceptibility Analysis (PSA). PloS ONE 2018, 13, e0198298. [Google Scholar] [CrossRef] [PubMed]
  26. Agustina, S.; Panggabean, A.S.; Natsir, M.; Retroningtyas, H.; Yulianto, I. Yield-per-Recruit Modeling as Biological Reference Points to Provide Fisheries Management of Leopard Coral Grouper (Plectropomus leopardus) in Saleh Bay, West Nusa Tenggara. IOP Conf. Ser. Earth Environ. Sci. 2019, 278, 012005. [Google Scholar] [CrossRef]
  27. Yulius, Y.; Ramdhan, M.; Ardiansyah, A. Characteristic of Saleh Bay Coastline. Segara 2018, 14, 117. [Google Scholar] [CrossRef]
  28. Khasanah, M.; Nurdin, N.; Sadovy de Mitcheson, Y.; Jompa, J. Management of the Grouper Export Trade in Indonesia. Rev. Fish. Sci. Aquac. 2020, 28, 1–15. [Google Scholar] [CrossRef]
  29. Khasanah, M.; Kadir, N.N.; Jompa, J. Reproductive Biology of Three Important Threatened/Near-Threatened Groupers (Plectropomus leopardus, Epinephelus polyphekadion and Plectropomus areolatus) in Eastern Indonesia and Implications for Management. Animals 2019, 9, 643. [Google Scholar] [CrossRef]
  30. Ebisawa, A. Life History Traits of Leopard Coralgrouper Plectropomus leopardus in the Okinawa Islands, Southwestern Japan. Fish. Sci. 2013, 79, 911–921. [Google Scholar] [CrossRef]
  31. Mathews, C.P.; Samuel, M. Growth, Mortality and Assessment for Groupers from Kuwait. Kuwait Bull. Mar. Sci. 1997, 9, 173–191. [Google Scholar]
  32. Efendi, D.S.; Daud, A.R.; Utomo, D.S.; Muawanah, U.; Adrianto, L. Dampak kebijakan perikanan kerapu dan kakap terhadap keberlanjutan stok sumber daya di Teluk Saleh. In Prosiding Seminar Nasional Riset dan Kebijakan Sosial Ekonomi Kalautan dan Perikanan Tahun 2020; AMAFRAD Press: Jakarta, Indonesia, 2020; pp. 153–162. ISBN 978-623-7651-68-0. [Google Scholar]
  33. Agustina, S.; Natsir, M.; Panggabean, A.S.; Hartati, I.D.; Rosdiana, A.; Qonita, Y.; Rafandi, M.T.; Hernawati; Yulianto, I. Laporan Teknis: Evaluasi Implementasi Rencana Aksi Pengelolaan Perikanan Kerapu dan Kakap Berkelanjutan (P2K2B) Provinsi Nusa Tenggara Barat Tahun ke-2 2021; Wildlife Conservation Society: Bogor, Indonesia, 2022. [Google Scholar]
  34. Goethel, D.R.; Smith, M.W.; Cass-Calay, S.L.; Porch, C.E. Establishing Stock Status Determination Criteria for Fisheries with High Discards and Uncertain Recruitment. N. Am. J. Fish. Manag. 2018, 38, 120–139. [Google Scholar] [CrossRef]
  35. Hoshino, E.; Pascoe, S.; Hutton, T.; Kompas, T.; Yamazaki, S. Estimating Maximum Economic Yield in Multispecies Fisheries: A Review. Rev. Fish. Biol. Fish. 2018, 28, 261–276. [Google Scholar] [CrossRef]
  36. DKP. Dinas Kelautan dan Perikanan. Rencana Pengelolaan dan Zonasi Kawasan Konservasi Perairan, Suaka Alam Perairan Pulau Lipan dan Pulau Rakit Kabupaten Sumbawa, Provinsi Nusa Tenggara Barat 2018; Dinas Kelautan dan Perikanan Provinsi Nusa Tenggara Barat: Mataram, Indonesia, 2018. [Google Scholar]
  37. DKP. Dinas Kelautan dan Perikanan. Rencana Pengelolaaan dan Zonasi Taman Wisata Perairan Pulau Liang dan Pulau Ngali 2018–2038; Dinas Kelautan dan Perikanan Provinsi Nusa Tenggara Barat: Mataram, Indonesia, 2018. [Google Scholar]
  38. Matley, J.; Heupel, M.; Simpfendorfer, C. Depth and Space Use of Leopard Coralgrouper Plectropomus leopardus Using Passive Acoustic Tracking. Mar. Ecol. Prog. Ser. 2015, 521, 201–216. [Google Scholar] [CrossRef]
  39. Zeller, D. Home Range and Activity Patterns of the Coral Trout Plectropomus leopardus (Serranidae). Mar. Ecol. Prog. Ser. 1997, 154, 65–77. [Google Scholar] [CrossRef]
  40. Natsir, M.; Ruchimat, T.; Agustina, S.; Yulianto, I. Application of Global Positioning System Tracker to Detect the Fishing Ground Location and Effective Effort in Artisanal Fishery. Sens. Mater. 2019, 31, 803. [Google Scholar] [CrossRef]
  41. Dowling, N.A.; Dichmont, C.M.; Venables, W.; Smith, A.D.M.; Smith, D.C.; Power, D.; Galeano, D. From Low- to High-Value Fisheries: Is It Possible to Quantify the Trade-off between Management Cost, Risk and Catch? Mar. Policy 2013, 40, 41–52. [Google Scholar] [CrossRef]
  42. Punt, A.E. Strategic Management Decision-Making in a Complex World: Quantifying, Understanding, and Using Trade-Offs. ICES J. Mar. Sci. 2017, 74, 499–510. [Google Scholar] [CrossRef]
  43. Dick, E.J.; MacCall, A.D. Depletion-Based Stock Reduction Analysis: A Catch-Based Method for Determining Sustainable Yields for Data-Poor Fish Stocks. Fish. Res. 2011, 110, 331–341. [Google Scholar] [CrossRef]
  44. Carruthers, T.R.; Huynh, Q.; Hordyk, A. Data-Limited Methods Reference (DLMtool Functions 6.0.6). 2022. Available online: https://dlmtool.openmse.com/ (accessed on 15 July 2023).
  45. Zhou, S.; Punt, A.E.; Ye, Y.; Ellis, N.; Dichmont, C.M.; Haddon, M.; Smith, D.C.; Smith, A.D. Estimating Stock Depletion Level from Patterns of Catch History. Fish Fish. 2017, 18, 742–751. [Google Scholar] [CrossRef]
  46. Pacific Fishery Management Council. Pacific Coast Groundfish Fishery Management Plan for the California, Oregon, and Washington Groundfish Fishery; Pacific Fishery Management Council: Portland, OR, USA, 2022; Available online: https://www.pcouncil.org/documents/2022/08/pacific-coast-groundfish-fishery-management-plan.pdf/ (accessed on 15 July 2023).
  47. Williams, E.H.; Shertzer, K.W. Implications of Life-History Invariants for Biological Reference Points Used in Fishery Management. Can. J. Fish. Aquat. Sci. 2003, 60, 11. [Google Scholar] [CrossRef]
  48. Carruthers, T.R.; Hordyk, A.R. The Data-Limited Methods Toolkit (DLM Tool): An R Package for Informing Management of Data-limited Populations. Methods Ecol. Evol. 2018, 9, 2388–2395. [Google Scholar] [CrossRef]
  49. Sadovy De Mitcheson, Y.; Craig, M.T.; Bertoncini, A.A.; Carpenter, K.E.; Cheung, W.W.L.; Choat, J.H.; Cornish, A.S.; Fennessy, S.T.; Ferreira, B.P.; Heemstra, P.C.; et al. Fishing Groupers Towards Extinction: A Global Assessment of Threats and Extinction Risks in a Billion Dollar Fishery. Fish Fish. 2013, 14, 119–136. [Google Scholar] [CrossRef]
  50. Sadovy De Mitcheson, Y.; Colin, P.L.; Lindfield, S.J.; Bukurrou, A. A Decade of Monitoring an Indo-Pacific Grouper Spawning Aggregation: Benefits of Protection and Importance of Survey Design. Front. Mar. Sci. 2020, 7, 571878. [Google Scholar] [CrossRef]
  51. Erisman, B.; Heyman, W.; Kobara, S.; Ezer, T.; Pittman, S.; Aburto-Oropeza, O.; Nemeth, R.S. Fish Spawning Aggregations: Where Well-placed Management Actions Can Yield Big Benefits for Fisheries and Conservation. Fish Fish. 2017, 18, 128–144. [Google Scholar] [CrossRef]
  52. Bejarano Chavarro, S.; Mumby, P.J.; Golbuu, Y. Changes in the Spear Fishery of Herbivores Associated with Closed Grouper Season in Palau, Micronesia: Spear Fishery of Herbivores during Closed Grouper Season. Anim. Conserv. 2014, 17, 133–143. [Google Scholar] [CrossRef]
  53. Lindley, J. Fishing Non-Compliance and Culture. Mar. Policy 2023, 152, 105581. [Google Scholar] [CrossRef]
  54. Halim, A.; Wiryawan, B.; Loneragan, N.R.; Hordyk, A.; Sondita, M.F.A.; White, A.T.; Koeshendrajana, S.; Ruchimat, T.; Pomeroy, R.S.; Yuni, C. Developing a Functional Definition of Small-Scale Fisheries in Support of Marine Capture Fisheries Management in Indonesia. Mar. Policy 2019, 100, 238–248. [Google Scholar] [CrossRef]
  55. Oyanedel, R.; Gelcich, S.; Milner-Gulland, E.J. Motivations for (Non-)Compliance with Conservation Rules by Small-scale Resource Users. Conserv. Lett. 2020, 13, 1120–1134. [Google Scholar] [CrossRef]
  56. Prince, J.; Creech, S.; Madduppa, H.; Hordyk, A. Length Based Assessment of Spawning Potential Ratio in Data-Poor Fisheries for Blue Swimming Crab (Portunus spp.) in Sri Lanka and Indonesia: Implications for Sustainable Management. Reg. Stud. Mar. Sci. 2020, 36, 101309. [Google Scholar] [CrossRef]
  57. Oyanedel, R.; Gelcich, S.; Milner-Gulland, E.J. A Synthesis of (Non-)Compliance Theories with Applications to Small-scale Fisheries Research and Practice. Fish Fish. 2020, 21, 1120–1134. [Google Scholar] [CrossRef]
  58. Marshall, D.J.; Gaines, S.; Warner, R.; Barneche, D.R.; Bode, M. Underestimating the Benefits of Marine Protected Areas for the Replenishment of Fished Populations. Front. Ecol. Env. 2019, 17, 407–413. [Google Scholar] [CrossRef]
  59. Hall, A.; Cameron, D.; Kingsford, M. Prohibiting Spearfishing Boosts Conservation Outcomes for Partially Protected Areas. Biol. Conserv. 2022, 272, 109662. [Google Scholar] [CrossRef]
  60. Balbar, A.C.; Metaxas, A. The Current Application of Ecological Connectivity in the Design of Marine Protected Areas. Glob. Ecol. Conserv. 2019, 17, e00569. [Google Scholar] [CrossRef]
  61. Williamson, D.H.; Harrison, H.B.; Almany, G.R.; Berumen, M.L.; Bode, M.; Bonin, M.C.; Choukroun, S.; Doherty, P.J.; Frisch, A.J.; Saenz-Agudelo, P.; et al. Large-scale, Multidirectional Larval Connectivity among Coral Reef Fish Populations in the Great Barrier Reef Marine Park. Mol. Ecol. 2016, 25, 6039–6054. [Google Scholar] [CrossRef] [PubMed]
  62. Hilborn, R.; Micheli, F.; De Leo, G.A. Integrating Marine Protected Areas with Catch Regulation. Can. J. Fish. Aquat. Sci. 2006, 63, 642–649. [Google Scholar] [CrossRef]
  63. Halim, A.; Loneragan, N.R.; Wiryawan, B.; Fujita, R.; Adhuri, D.S.; Hordyk, A.R.; Sondita, M.F.A. Transforming Traditional Management into Contemporary Territorial-Based Fisheries Management Rights for Small-Scale Fisheries in Indonesia. Mar. Policy 2020, 116, 103923. [Google Scholar] [CrossRef]
  64. Edgar, G.J.; Stuart-Smith, R.D.; Willis, T.J.; Kininmonth, S.; Baker, S.C.; Banks, S.; Barrett, N.S.; Becerro, M.A.; Bernard, A.T.F.; Berkhout, J.; et al. Global Conservation Outcomes Depend on Marine Protected Areas with Five Key Features. Nature 2014, 506, 216–220. [Google Scholar] [CrossRef]
  65. Kininmonth, S.; Blenckner, T.; Niiranen, S.; Watson, J.; Orio, A.; Casini, M.; Neuenfeldt, S.; Bartolino, V.; Hansson, M. Is Diversity the Missing Link in Coastal Fisheries Management? Diversity 2022, 14, 90. [Google Scholar] [CrossRef]
Figure 1. Map of Saleh Bay and four main fish landing monitoring (FLM) sites (yellow circles) around the bay in Sumbawa, West Nusa Tenggara (WNT), Indonesia. Basemap source: Indonesian Geospatial Information Agency (BIG) and the Wildlife Conservation Society (WCS) Indonesia Program. Red boxes on insets show location of Saleh Bay in Indonesia and WNT province.
Fishes 08 00498 g001
Figure 2. The flow of the MERA simulation performed in this study including data inputs, three modes of closed-loop simulation (default, rebuilding stock, and custom simulations) that result in projected biomass stocks and yields and a yield–biomass trade-off plot, and selection of MPs to inform management of P. leopardus in Saleh Bay. Dashed rectangles enclose the default and custom MERA simulations. Adapted with permission from Carruthers et al. [24].
Fishes 08 00498 g002
Figure 3. The long-term yield–biomass trade-off of the selected management procedures for P. leopardus in Saleh Bay, West Nusa Tenggara showing the probabilities of achieving (a) the limit reference biomass (B > 0.5BMSY) and (b) the target reference biomass (B > BMSY). The y-axis is the probability of obtaining more than half the reference (Ref.) yield (i.e., 0.5 BMSY). Input MPs (size limits, total allowable effort, or spatial closures) = green lettering; output MPs (total allowable catch) = gold lettering. Blue shades show probability thresholds between 0–0.2 and 0–0.8. The top-right region represents better performance, and the bottom-left represents worse performance. Descriptions of MPs are given in Table 2 and Supplementary Material S3.
Fishes 08 00498 g003
Figure 4. Biomass projection (B/BMSY) relative to the target (B/BMSY = 1) and limit reference points (B/BMSY = 0.5) for P. leopardus in Saleh Bay, West Nusa Tenggara, Indonesia. Light blue = 90% probability interval, dark blue = 50% probability interval, white line = median estimate, and two dark blue lines = example simulations. The two horizontal grey lines represent BMSY as the target reference point and 0.5 BMSY as the limit reference point. DBSRA = depletion-based stock reduction analysis; DBSRA4010 = depletion-based stock reduction analysis with 40–10 rule; SC_2 to SC_4 = two to four months seasonal closure; SL_32 to SL-40 = size limit at 32 to 40 cm. Descriptions of MPs are given in Table 2 and Supplementary Material S3.
Fishes 08 00498 g004
Figure 5. Short-term (20 years) biomass projection under a stock rebuilding scenario (started from the stock condition at 30 to 50% BMSY) relative to the target and limit reference points (B/BMSY) for the P. leopardus. The light blue represents a 90% probability interval, the dark blue represents a 50% probability interval, the white line is the median estimate, and the two dark blue lines are example simulations. The two horizontal grey lines represent target and limit reference points. DBSRA = depletion-based stock reduction analysis; DBSRA4010 = depletion-based stock reduction analysis with 40–10 rule; SC_2 to SC_4 = two to four months seasonal closure; SL_32 to SL-40 = size limit at 32 to 40 cm; NFref = no-fishing reference. Descriptions of MPs are given in Table 2 and Supplementary Material S3.
Fishes 08 00498 g005
Figure 6. Long-term (50 years) biomass projection under a stock rebuilding scenario (started from the stock condition at 30 to 50% BMSY) relative to the target and limit reference points (B/BMSY) for the P. leopardus. The light blue represents a 90% probability interval, the dark blue represents a 50% probability interval, the white line is the median estimate, and the two dark blue lines are example simulations. The two horizontal grey lines represent target and limit reference points. DBSRA = depletion-based stock reduction analysis; DBSRA4010 = depletion-based stock reduction analysis with 40–10 rule; SC_2 to SC_4 = two to four months seasonal closure; SL_32 to SL-40 = size limit at 32 to 40 cm; NFref = no-fishing reference. Descriptions of MPs are given in Table 2 and Supplementary Material S3.
Fishes 08 00498 g006
Figure 7. Yield projection relative to the current yield for the P. leopardus over a 50-year period. The light blue represents a 90% probability interval, the dark blue represents a 50% probability interval, the white line is the median estimate, and the two dark blue lines are example simulations. The horizontal grey lines represent the Yt/Ycurr = 1. DBSRA = depletion-based stock reduction analysis; DBSRA4010 = depletion-based stock reduction analysis with 40–10 rule; SC_2 to SC_4 = two to four months seasonal closure; SL_32 to SL_40 = size limit at 32 to 40 cm. Descriptions of MPs are given in Table 2 and Supplementary Material S3.
Fishes 08 00498 g007
Figure 8. Source of uncertainties of 10 selected management procedures (MPs) for projections of the long-term yield for P. leopardus in Saleh Bay, West Nusa Tenggara, Indonesia, sourced from the answers to the MERA questionnaire. Some abbreviated variables: Effort Var. = effort variation; Size Lim Var. = size limit variation; Cat. Rep. Bias. = catch reporting bias; Post. Rel. Mort. = post-release mortality; Initial Dep. = initial depletion; Rec. Var. = recruitment variability; Hist. catchability = historical fishing efficiency. Descriptions of MPs are given in Table 2 and Supplementary Material S3.
Fishes 08 00498 g008
Figure 9. Source of uncertainties of the two default management procedures for projections of the long-term yield of P. leopardus in Saleh Bay, West Nusa Tenggara, Indonesia, from the fishery data matrix. Some abbreviated variables: VB. K. Bias = bias in von Bertalanffy’s k variable estimation; Len. Mat. Bias = length maturity bias; Depletion Err. = depletion error; VB. Linf Bias = bias in von Bertalanffy’s Linf variable; catch Err. = historical catch error; FMSY_M bias = bias in FMSY/M estimation. Descriptions of MPs are given in Table 2 and Supplementary Material S3. DBSRA = Depletion-based stock reduction analysis.
Fishes 08 00498 g009
Table 2. MERA’s default and custom management procedures (MPs) are simulated in this study. Descriptions of the default MPs are from DLM Tool Documentation 6.0.6 by T. Carruthers, Q Huynh, and A. Hordyk (https://dlmtool.openmse.com/reference/index.html; accessed on 2 August 2023). Full descriptions of MPs are given in Supplementary Material S3.
Management ProceduresProcedures Evaluated
MERA’s Default MPs (n = 20)
Total Allowable Catch (TAC, 13)DBSRA (Depletion-Based Stock Reduction Analysis)
DBSRA_40 (Depletion-Based Stock Reduction Analysis 40)
DBSRA4010 (Depletion-Based Stock Reduction Analysis 4010)
DCAC (Depletion Corrected Average Catch)
DCAC_40 (Depletion Corrected Average Catch 40)
DD (Delay-Difference Stock Assessment)
DD4010 (Delay-Difference Stock Assessment 4010)
MCD (Mean Catch Depletion)
MCD4010 (Mean Catch Depletion 4010)
Fratio (F and M ratio)
HDAAC (Hybrid Depletion Adjusted Average Catch)
IT10 (Iterative Index Target 10%)
IT5 (Iterative Index Target 5%)
Total Allowable Effort (TAE, 3)DDe (Effort-based Delay-Difference Stock Assessment)
DDe75 (Effort-based Delay-Difference Stock Assessment 75%)
ITe10 (Index Target Effort-Based 10%)
Size Limit (2)Matlenlim (Size limit at length-at-maturity)
Matlenlim2 (Size limit at 110% length-at-maturity)
Spatial Closure/Marine Protected Area (2)MRnoreal (Spatial closure—no reallocation of effort)
MRreal (Spatial closure—with reallocation of effort)
Custom MPs (n = 19)
Total Allowable Catch (TAC; 4)Index_10_TAC (Reduction of 10% from current catch)
Index_15_TAC (Reduction of 15% from current catch)
Index_20_TAC (Reduction of 20% from current catch)
Index_25_TAC (Reduction of 25% from current catch)
Total Allowable Effort (TAE; 4)Index_10_Eff (Reduction of 10% from current effort)
Index_15_Eff (Reduction of 15% from current effort)
Index_20_Eff (Reduction of 20% from current effort)
Index_25_Eff (Reduction of 25% from current effort)
Size Limit (8)SL_25 (set catch size limit at 25 cm)
SL_28 to SL_40 (set catch size limit at between 28 to 40 cm, with 2 cm increment)
Seasonal closure (3)SC_2 (no fishing for 2 month)
SC_3 (no fishing for 3 month)
SC_4 (no fishing for 4 month)
Table 3. Selected default and custom management procedures (MPs) based on the selection criteria for P. leopardus in Saleh Bay, West Nusa Tenggara, Indonesia (* are the main considerations in MP selection).
MPMP TypeMP
Group
Simulation for Current Fishery ConditionSimulation for Stock Rebuilding Scenario
Mean Prob. Biomass > 50%BMSY (Year 1–10)Mean Prob. Biomass > BMSY
(Year 1–10)
Achieve B/BMSY > 1 in year 46–50 (1 = Yes; 0 = No) * Achieve Yt/Ycurr = 1 in Year 46–50 (1 = Yes; 0 = No) * Achieve B/BMSY > 1 in year 1–10 or short-term HCR (1 = Yes; 0 = No) Achieve B/BMSY > 1 in year 46–50 or long-term HCR (1 = Yes; 0 = No) *
DBSRA4010TACDefault98.727.11111
DD4010TACDefault98.728.41111
MCD4010TACDefault98.730.11111
DBSRATACDefault98.620.31111
DCAC_40TACDefault98.622.21111
DCACTACDefault98.622.81111
MCDTACDefault98.626.51111
HDAACTACDefault98.627.11111
DDTACDefault97.811.01101
DBSRA_40TACDefault97.411.41101
SC_4TAECustom94.593.531100
SC_3TAECustom91.362.811100
SC_2TAECustom89.482.41100
SL_40SzLimCustom91.053.221100
SL_38SzLimCustom88.763.011100
SL_36SzLimCustom88.252.811100
SL_34SzLimCustom86.352.71100
SL_32SzLimCustom85.532.21100
Table 4. Probabilities of the 10 selected management procedures (MP) achieving the limit reference point of biomass (B > 0.5 BMSY) for P. leopardus in Saleh Bay Indonesia over 10 years of simulation (2024–2033). Probabilities > 90% = green shaded, 50–90% = orange shaded. MP type denotes the class of MP according to the type of advice it provides: Total Allowable Catch (TAC), Total Allowable Effort (TAE), and Size Limit (SzLim). Full descriptions of MPs are given in Supplementary Material S3.
MPMP
Type
MP
Group
Year
2024202520262027202820292030203120322033
DBSRATACDefault95.897.997.997.9100100100100100100
DBSRA4010TACDefault95.897.99999100100100100100100
SC_2TAECustom95.894.894.895.892.792.792.792.792.791.7
SC_3TAECustom95.894.894.895.894.895.895.895.895.894.8
SC_4TAECustom95.895.895.896.995.896.996.997.996.995.8
SL_32SzLimCustom95.894.894.894.893.890.691.789.689.687.5
SL_34SzLimCustom95.894.894.894.893.890.691.789.689.689.6
SL_36SzLimCustom95.894.894.894.893.891.791.791.790.690.6
SL_38SzLimCustom95.894.894.894.893.893.892.792.791.791.7
SL_40SzLimCustom95.894.894.894.894.893.894.893.892.791.7
Table 5. Probabilities of 10 selected management procedures (MP) achieving the target reference point of biomass (B > BMSY) for P. leopardus in Saleh Bay Indonesia over 10 years of simulation (2024–2033). Probabilities > 75% = green shaded, 50–75% = orange shaded, and ≤50% = red shaded. MP type denotes the class of MP according to the type of advice it provides: Total Allowable Catch (TAC), Total Allowable Effort (TAE), and Size Limit (SzLim). Full descriptions of MPs are given in Supplementary Material S3.
MPMP TypeMP
Group
Year
2024202520262027202820292030203120322033
DBSRATACDefault32.336.546.956.258.366.767.77480.284.4
DBSRA4010TACDefault32.336.54957.362.568.872.979.286.586.5
SC_2TAECustom32.333.335.436.538.543.846.947.946.944.8
SC_3TAECustom32.333.335.438.542.746.9495052.158.3
SC_4TAECustom32.334.438.542.75154.255.254.260.461.5
SL_32SzLimCustom32.334.433.337.536.538.540.642.743.844.8
SL_34SzLimCustom32.334.434.437.536.540.640.643.843.844.8
SL_36SzLimCustom32.335.436.537.539.643.844.843.845.846.9
SL_38SzLimCustom32.335.437.538.541.744.845.845.846.949
SL_40SzLimCustom32.335.437.538.542.747.947.945.84947.9
Disclaimer/Publisher’s Note: The statements, opinions and data contained in all publications are solely those of the individual author(s) and contributor(s) and not of MDPI and/or the editor(s). MDPI and/or the editor(s) disclaim responsibility for any injury to people or property resulting from any ideas, methods, instructions or products referred to in the content.

