Article

Assessment of Growth-Related Parameters, Immune-Biochemical Profile, and Expression of Selected Genes of Red Tilapia Fed with Roselle Calyces (Hibiscus sabdariffa) Extract

1
Department of Aquaculture, Faculty of Aquatic and Fisheries Sciences, Kafrelsheikh University, Kafrelsheikh 33516, Egypt
2
Department of Physiology, Faculty of Veterinary Medicine, Kafrelsheikh University, Kafrelsheikh 33516, Egypt
3
Department of Forensic Medicine and Toxicology, Faculty of Veterinary Medicine, Benha University, Toukh 13736, Egypt
4
Department of Clinical Sciences, College of Medicine, Princess Nourah bint Abdulrahman University, P.O. Box 84428, Riyadh 11671, Saudi Arabia
5
Department of Biology and Plant Protection, Faculty of Agriculture, University of Life Sciences “King Michael I” from Timișoara, 300645 Timisoara, Romania
6
Department of Animal Histology and Anatomy, School of Veterinary Medicine, Badr University in Cairo (BUC), Badr City 32897, Egypt
7
Department of Anatomy and Embryology, Faculty of Veterinary Medicine, University of Sadat City, Sadat City 32897, Egypt
*
Authors to whom correspondence should be addressed.
Fishes 2023, 8(4), 172; https://doi.org/10.3390/fishes8040172
Submission received: 5 February 2023 / Revised: 14 March 2023 / Accepted: 20 March 2023 / Published: 24 March 2023
(This article belongs to the Special Issue Welfare and Sustainability in Aquaculture)

Abstract

:
The purpose of this research was to determine whether or not supplementing a diet with ethanolic roselle calyces extract (ER) had any effect on the rate of growth, intestinal morphometry, total carotene in skin and muscle, blood profile, immunity status, and the expression response of red tilapia. The ER was added to four experimental diets at 0% (0 g kg−1), 0.5% (5 g kg−1), 1% (10 g kg−1), and 2% (20 g kg−1), which were designated as ER0 (control group), ER0.5, ER1, and ER2, respectively. The results show that ER1 induced higher weights (final weight, weight gain, specific growth rate, and weight gain rate) and all ER groups had considerably (p < 0.05) decreased feed conversion rates (FCR) compared with the control diet. Histomorphometric examination of the intestinal villi absorptive capacity showed fish given ER, specifically ER1, had increased villus length, width, and goblet cells (p < 0.05). The best hematological and biochemical parameters (the antioxidant enzyme activity of superoxide dismutase and catalase, lysozyme activity, and WBCs count) were observed for 5 g kg−1 ER. In addition, diets supplemented with different levels of ER stimulated phagocytic activity (p < 0.05). Additionally, the highest total carotene content in skin and muscle was observed in ER0.5. The 0.5, 1, and 2% roselle extract diets induced upregulation of IGF-1, GHr, SOD, TNF-α, and LPL, whereas MSTN, HSP 70, and FAS were downregulated. In conclusion, dietary ER supplementations are advantageous for red tilapia because they improve immunological and growth-related parameters.
Key Contribution: Dietary enrichment of ER at 0.5% and 1% concentrations could improve the growth performance of red tilapia Dietary enrichment of ER improved the red tilapia immunity and the antioxidant activity.

1. Introduction

Aquaculture is the most rapidly expanding food industry, with a significant contribution to supplying the world with high-quality and affordable animal-source protein and making up a substantial proportion (52%) of total fish supply [1]. Fish farming involves certain types of intervention in the growth process to improve production, such as consistent feeding [2], stocking [3], and protection from predators [4]. Unfortunately, there are several problems in the rearing process, one of which is stress, which contributes to various conditions: poor utilization and digestion of food [5,6] and poor quality of fish flesh [7]. Moreover, cultured fish are vulnerable to a wide range of pathogens [8], for instance, viruses, fungi, parasites, and bacteria [9,10], which sometimes cause mortalities [11]. Fish farmers have used antibiotics to prevent and treat stress-related diseases for years, but unregulated antibiotics usage has many negative repercussions, particularly for human health [12,13]. Consequently, many countries have strict rules concerning the use of antibiotics in aquaculture, whereas others seek a full ban [14,15]. Alternative control measures, including immunostimulants, have been implemented to combat disease outbreaks in aquaculture that promote fish resistance to various infections by improving specific and non-specific immune response mechanisms [16].
Roselle (Hibiscus sabdariffa) is a popular flowering plant grown worldwide. Hibiscus sabdariffa extracts have been reported to be an immune-stimulating agent in animals and humans [17]. In addition, Hibiscus sabdariffa has been used as a stress relief agent, anti-inflammatory agent, immune-stimulator, antioxidant, and growth promoter in Rainbow trout [18,19], Nile tilapia [20], and Common carp [21]. Red tilapia is a genetically enhanced strain of tilapia that is much preferred over other tilapia hybrids [22,23] because of its rapid growth rate, attractive color, increased marketability, tolerance of high densities, and good flesh quality [24]. Roselle calyces ethanol extract (ER) was tested for its potential health benefits when incorporated into a regular diet at levels of 0, 0.5, 1, and 2% kg−1 diet. The growth efficiency, morphometric assessment of the intestine, haemato-biochemical profile, immune response, oxidative status, and expression of selected growth, immune, Red tilapia genes involved in oxidative stress were determined.

2. Materials and Methods

2.1. Ethical Validation

This study was authorized by the Institutional Aquatic Animal Care and Use Committee of the Faculty of Aquatic and Fisheries Sciences at Kafr El-Sheikh University in Egypt (approval number: IAACUC-KSU-149-2022).

2.2. Roselle Calyx Collection and Chemical Extraction

Roselle calyx samples were collected from a local market and identified as Hibiscus sabdariffa; they were cleaned with fresh tap water before being dried in the shade. Afterward, a mechanical grinder was employed to extract the beneficial compounds from the dried Roselle. Bioactive compounds of H. sabdariffa were extracted following the method of [25]. Specifically, 500 g of air-dried H. sabdariffa samples were soaked in the solvent (1:5, v/v) for 72 h at room temperature (25 °C–30 °C) while the incubator was shaking at 150 rpm. The resulting extract was filtered through Whatman filter paper (6 µm pore size) and then evaporated in a rotary evaporator at 30 °C in a vacuum to produce ethanol alcohol, which was then chilled to 4 °C [8].

2.3. (GC-MS) Analysis of AME Extract

The powdered AME extract (26 mg) was analyzed at Nawah Scientific, Cairo, Egypt, using the GC-MS system (Thermo Scientific, Austin, TX, USA) with a direct capillary column TG–5MS (30 m × 0.25 mm × 0.25 µm film thickness). We maintained a carrier gas flow rate of 1 mL/min with helium. The auto sampler AS1300 paired with GC/MS in the split mode was used to automatically inject 1 µL diluted samples with a solvent delay of 4 min. At ionization, energies of 70 eV, EI mass spectra were acquired in full scan mode spanning the m/z range of 50–650. A temperature of 200 °C was selected for the ion source. Comparing the mass spectra of the components to those in the WILEY 09 and NIST 14 databases allowed for their identification [26].

2.4. Experiment Design

A batch of 180 healthy hybrid red tilapia fries (O. niloticus × O. mossambicus) were acquired from a private fish hatchery in Kafr El-Sheikh, Egypt (4.83 ± 0.04 g, initial weight ±SE). The fish were transported to the aquaculture department’s laboratory at Kafr El-Sheikh University where they were acclimated to temperatures (28.40 ± 0.54 °C) for two weeks while fed the basal diet, as shown in (Table 1). After the fish had adapted, they were placed in 12 glass aquariums (80 cm × 40 cm × 95 cm) with 15 fish per aquarium and allocated to 4 treatments with each group receiving either 0 (control), 0.5 (ER0.5), 1 (ER1), or 2 (ER2) g kg−1 ER in their base diet.
The feed materials for the test diets were combined in a manual pelleting machine to create pellets of the appropriate diameter for the fish. Feed with ER addition was sprayed with a sprayer while being mixed and then left in a designated room for a day so that the alcohol could evaporate. The fish were fed at a rate of 3% of body weight twice daily (9 a.m. and 2 p.m.) for the first two weeks of the experiment and then at a rate of 2% of body weight from week three until the end of the trial, with feeding rates varied every two weeks based on the biomass of each aquarium. The photoperiod had 12 h of darkness and 12 h of light. The water quality was monitored throughout the experiment and maintained at levels suitable for red tilapia. Dissolved oxygen (6.40 ± 0.12 mg/L), temperature (28.40 ± 0.54 °C), and pH (8.0 ± 0.05) were all measured with a multiparameter probe meter (HI9829-03042-HANNA® instruments) and expressed as mean ± SE. A handheld colorimeter estimated total ammonia nitrogen at 0.04 ± 0.003 mg/L (Martini MI 405).

2.5. Growth Parameters

After the end of the experimental period, six fish were randomly sampled from each tank (18 fish per treatment) and then anesthetized using tricaine methane sulfonate (MS222) 25 mg/L (Argent Laboratories, Redmond, WA, USA).
Every fish was individually weighed to determine its final body weight. The following equations were used to derive the growth assessment variables:
Body weight gain (BWG) = final body weight (W1) − initial body weight (W0).
Weight gain rate (WG%) = (W1 − W0)/W0 × 100.
Specific growth rate (SGR % /day) =100 × (lnW1 − lnW0)/t.
Feed conversion ratio (FCR) = feed intake (g)/BWG (g).
The formula used to determine the hepato-somatic index (HSI) was 100 × (liver weight/W1). To assess the visceral-somatic index (VSI), we multiplied the viscera weight by the body weight by a factor of 100.
The spleen-somatic index (SSI) was estimated as 100 × (Spleen weight/W1).
Survival rate (SR%) = 100 [final fish count/starting fish count].
In these calculations, t is the length of the experiment in days, W0 is the starting weight in grams, and W1 is the finished weight in grams.

2.6. Morphometric Assessment of Intestine

The intestinal tissues were taken (9 fish/treatment) and placed in 10% neutral-buffered formalin for three days. Afterward, the samples were dehydrated, washed multiple times in absolute alcohol, and finally embedded in paraffin. We used a Leica RM 2145 rotary microtome (Leica Microsystems, Wetzlar, Germany) to obtain 5 μm longitudinal slices, which were then mounted on glass slides and stained with hematoxylin and eosin (H&E) [27].
A Leica microscope adapted with a Leica camera was used. We took 15 images and measured 20 villi for each image. Image J analysis software was used for the histomorphometric study (National Institutes of Health, Bethesda, MD, USA). Image J analysis software was used to quantify the villus height (from the villus tip to the villus-crypt junction) and villus breadth (from the villus midpoint). The number of goblet cells divided by total area yielded the density of goblet cells (mm2) [28].

2.7. Blood Sampling

Blood was collected from the caudal vein of 6 fish in each tank using EDTA anticoagulant coated syringes (Nipro 27 gauge × 11/2-inch needle). The collected blood serum was centrifuged at 300 rpm for 15 min at 4 °C in plain tubes free of anticoagulants. The serum was stored at −20 °C until needed [29].

2.8. Haemato-Biochemical Analyses

The blood was assessed using an automatic blood cell counter [30]. Total proteins were assessed following [31], and serum albumins following [32] at wavelengths of 540 nm and 550 nm, respectively. Colorimetric analysis at 540 nm measured alanine aminotransferase (ALT) and aspartate aminotransferase (AST) activity, respectively [33]. The calorimetric method was used to quantify creatinine in the serum [34]. In addition, urea estimation was performed following [35]. The GPO-PAP and CHOD-PAP commercial clinical kit methods were used to measure serum triglycerides and total cholesterol, according to the manufacturer’s instructions [36]. Glucose enzymatic PAP kits were purchased from Bio-Merieux, France, and were used to measure glucose concentration following Trinder [33]. Lipase and amylase activity were tested following the protocols outlined in [37].

2.9. Immune and Oxidative Stress Activities

Superoxide dismutase (SOD) and catalase (CAT) activities were measured at 450 nm using an ELISA kit (Inova Biotechnology, China) according to the manufacturer’s procedures [38]. Prepared whole blood smears were examined for phagocytic activity and phagocytic index as specified in [39]. The phagocytic activity (PA) and index (PI) were assessed as PA = macrophages containing yeast/total number of macrophages ×100. PI = the number of cells phagocytized/number of phagocytic cells. Serum lysozyme activity was assessed following [40] utilizing a microplate ELISA reader at 450 nm.

2.10. Total Carotene Measurement

The carotenoids were extracted using Torissen and Naevdal’s techniques [41]. First, 300 mg samples of fish skin and muscle were weighed, added to a test tube, and individually homogenized well. The extraction was performed with acetone and anhydrous sodium sulfate. Equal parts of anhydrous sodium sulfate were added to the homogenized samples. The carotenoids were extracted in 25 mL of acetone at 4 °C for three days in the dark. The samples were homogenized and centrifuged for five minutes at 5000 rpm. The extract absorbance was measured at 480 nm in a UV-VIS Spectrophotometer. The computational formula used to calculate total carotene content (TCC) was: TCC (μg·g−1) = A. λ = 480 × K × V/(E × G), where A λ = 480 nm is the absorbance value at λ = 480 nm, G is the sample mass (g), K is a constant (104), V is the volume of the extracting solution (mL), and E is the coefficient (1900).

2.11. QRT-PCR

Following the manufacturer’s protocol, total RNA was extracted using the TRIzol reagent (Life Technologies, Gaithersburg, MD, USA). cDNA was synthesized immediately with a MultiScribe RT enzyme kit (Applied Biosystems, Foster City, CA, USA). The resultant cDNA was run using real-time PCR in triplicate. Power SYBR Green PCR Master Mix (Applied Biosystems, Life Technologies, CA, USA) was used in a 7500 real-time PCR system for PCR amplification (Applied Biosystems, Foster City, CA, USA). Compared with the control, gene mRNA fold changes were assessed. β-actin, a housekeeping gene, was utilized to standardize gene mRNA fold changes using the 2−∆∆Ct method [42]. The gene accession numbers and primer sequences are listed in Table 2. (see the Figure S1: RNA transcription levels of candidate reference genes (absolute Cq values) representing the abundance of studied genes in four-time running).

2.12. Statistical Analysis

GraphPad Prism 6.01 was used for statistical analyses after assessing the data for normality and homogeneity. A one-way analysis of variance (ANOVA) was performed followed by Tukey’s post hoc test for significant differences between the tested groups. Total carotene data were also analyzed using a T-test for comparison. When the p-value < 0.05, differences were considered statistically significant. Data are presented as the mean ± SE. p < 0.05 (*), p < 0.01 (**), p < 0.001 (***), and p < 0.0001 (****) [8,50].

3. Results

3.1. The GCMs Analysis of Roselle Ethyl Extract

Ethanolic roselle extract showed a total of 69 peaks, with approximately ten major phytochemical components identified by molecular formula, peak number, compound name after derivatization, retention time (min), molecular weight (m/z), peak area (%), and chemical structure (Table 3). Figure 1 shows a typical chromatogram of ER. The significant compounds included cyclopentane carboxylic acids (21.82%), ethyl palmitate (18.35%), linoleic acid (16.51%), linolelaidic acid (14.1%) and cyclohexane carboxylic acid (11.83%). These compounds belong to many chemical classes, and the majority of them have been documented to have critical biological functions in humans and a variety of animals.

3.2. Growth Parameters

In terms of growth performance (final weight, weight gain, SGR, and weight gain rate), there were no statistically significant differences (p > 0.05) between the experimental groups receiving 0.5 and 1% ER, compared with the control group (Table 4), while fish fed 2% ER in the diet showed a significant decrease (p < 0.05) in the final weight, weight gain, SGR, and weight gain rate, compared with the non-enriched control group. However, supplementation of 0.5, 1, and 2% roselle extract to the fish basal diets significantly decreased FCR compared with the non-supplied control. The somatic index parameters (HIS, VSI, and SSI) and survival recorded non-significant differences (p > 0.05) between all Roselle groups matched to the non-enriched control group.

3.3. Whole Intestinal Morphometry

Table 5 and Figure 2 show the intestinal morphometry of red tilapia that were fed experimental diets for 60 days. The length of intestinal villi in all three intestine segments was altered in the extract groups compared with the control group after dietary supplementation with Roselle extract (p < 0.05). The maximum length of intestinal villi was significantly increased (p < 0.05) in 1% ER in the three intestinal regions, compared with ER0. However, when comparing the experimental groups to the non-enriched control group, there was no difference in the diameter of the intestinal villi throughout the various intestinal portions. The number of goblet cells in the anterior and middle intestines of fish fed ER1, and ER2 increased significantly (p < 0.05), compared with the control group. Goblet cell proliferation in the terminal region was most significant in the ER2 group (p < 0.05) relative to the control group. When compared with the control group, ER0.5 did not significantly alter (p > 0.05) any of the measurable characteristics of the intestine (villi length, villi width, or goblet cells) outside of villi length in the middle part, where it was considerably increased (p < 0.05).

3.4. Blood and Biochemical Parameters

Dietary supplementation of red tilapia with roselle extract did not significantly affect any measured blood parameter (p > 0.05; Table 6). The highest PVC % and Hb level were recorded in ER0.5 compared with the control group. Given various concentrations of an ethanolic roselle extract for 60 days, red tilapia had biochemical indices within normal limits (Table 6). All the evaluated parameters except for triglycerides and glucose were significantly different (p < 0.05) when ER was added to the diet of red tilapia. Fish fed 0.5% ER had the highest TP, albumin, amylase, lipase, and glucose levels and the lowest levels of ALT, AST, cholesterol, creatinine, and urea.

3.5. Immune Assay

Compared with the control group, phagocytic and lysozyme activity were considerably greater (p ˂ 0.05) in ER0.5-fed fish (Table 7). The ER1 and ER2 groups had higher phagocytic activity than ER0, and the difference was statistically significant (p ˂ 0.05). However, there were no statistically significant differences (p > 0.05) between the groups for the phagocytic index and the white blood cell count, with the 0.5% ER group showing the highest activity levels. Both neutrophils and monocytes were reduced in fish given 0.5, 1, and 2% ER compared with the control group. While fish fed 0.5% ER had considerably more lymphocytes than the non-enriched controls, the difference was insignificant (p > 0.05).

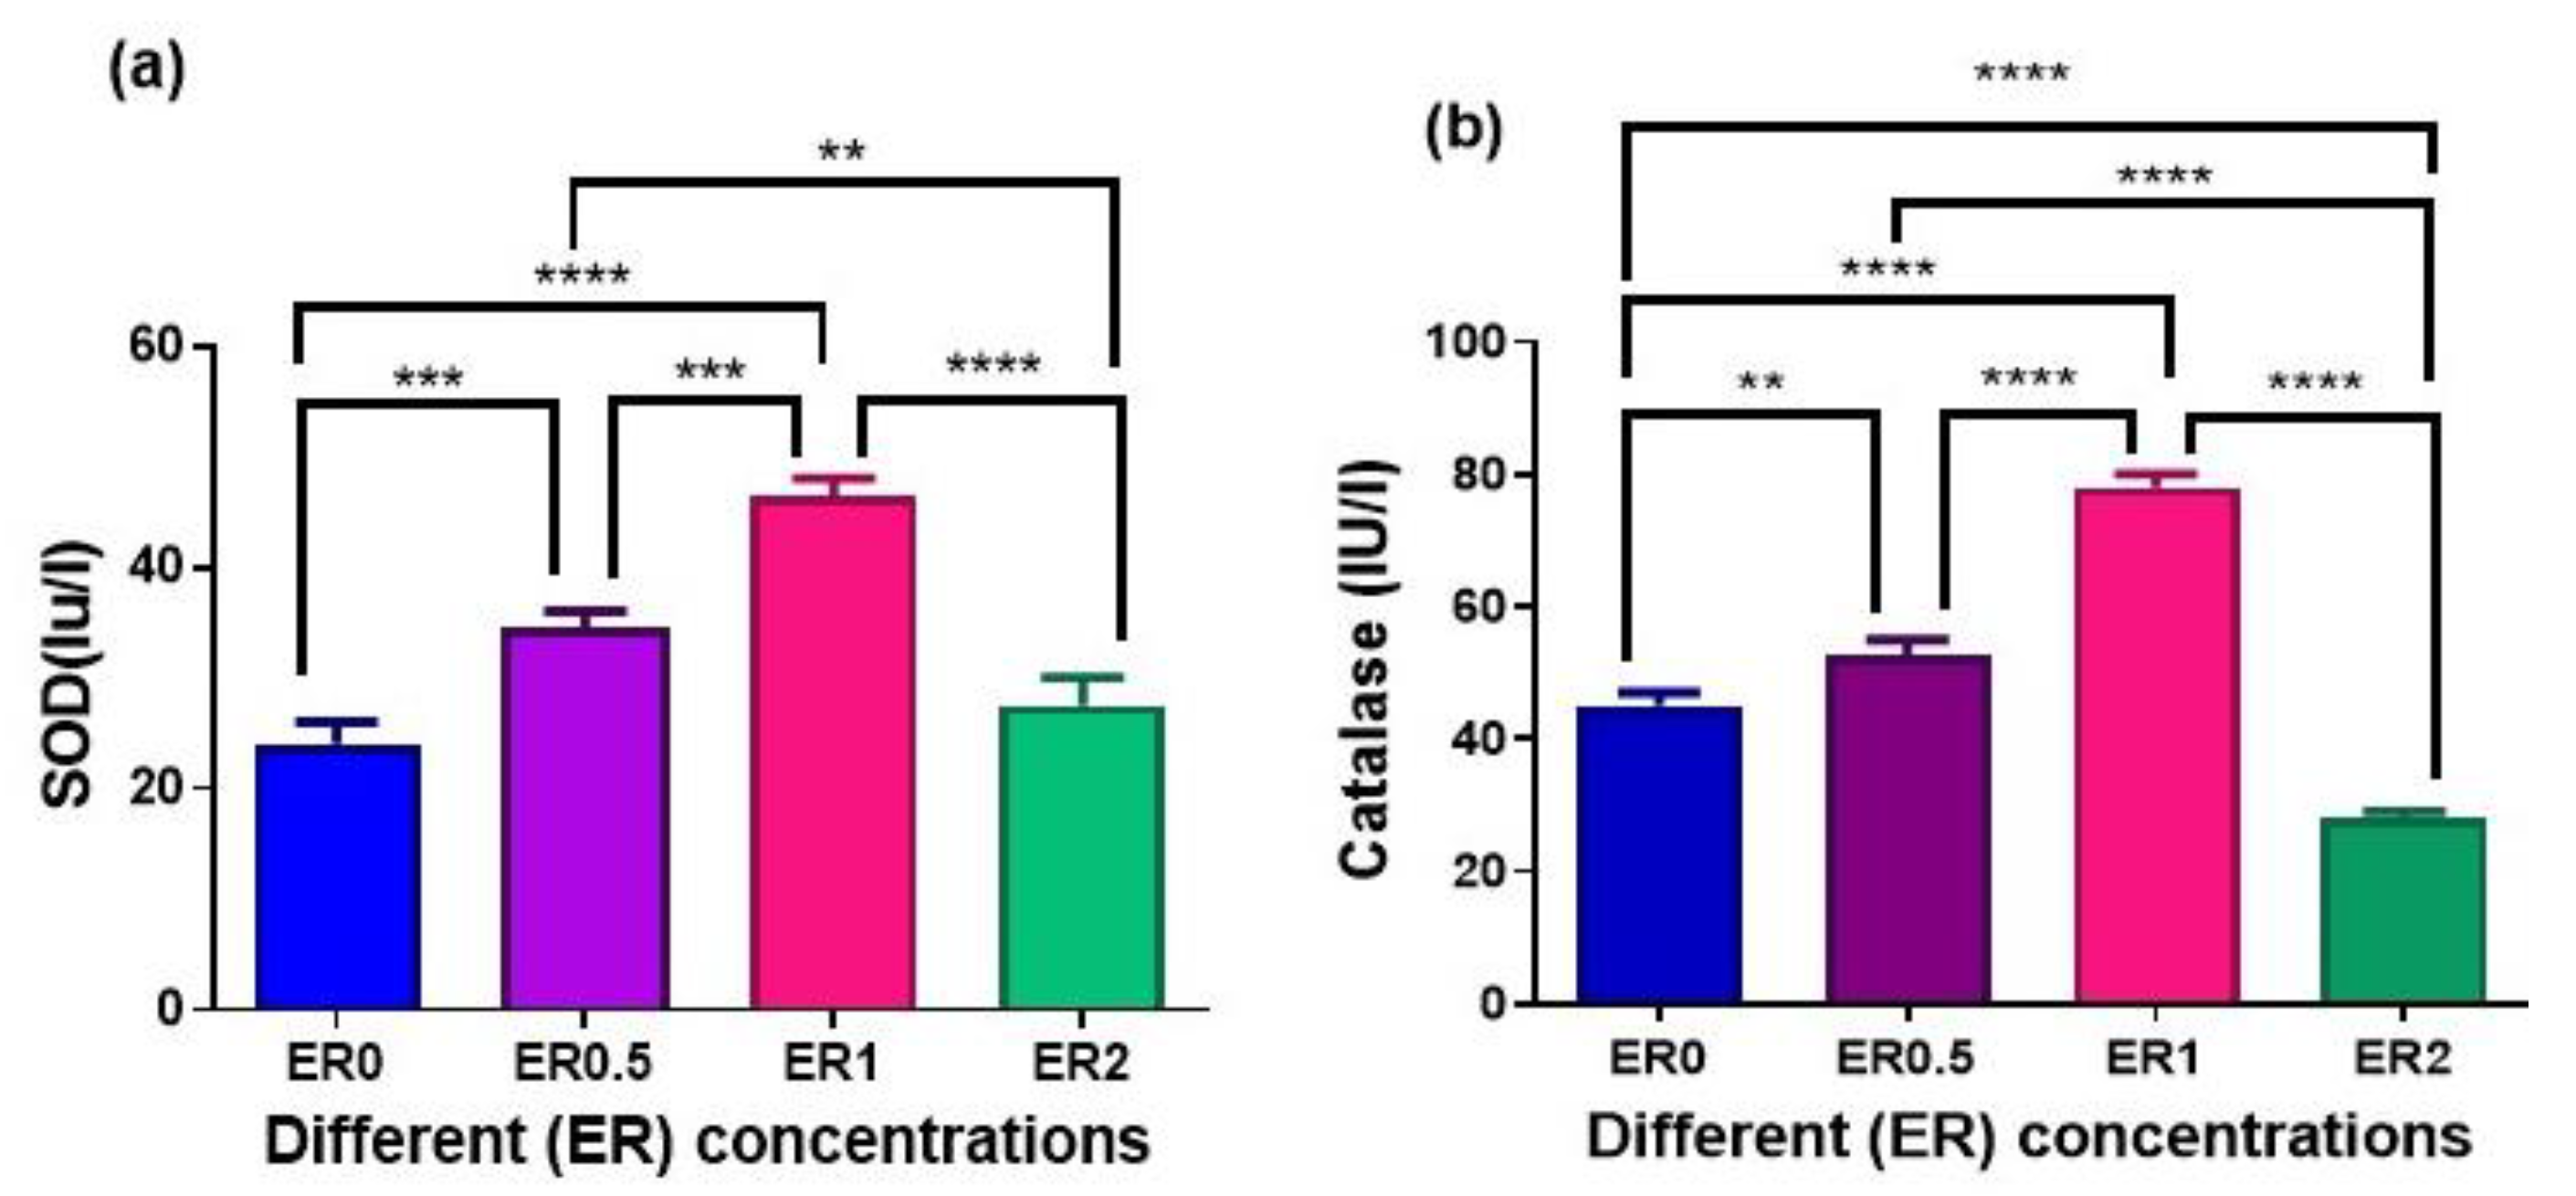
3.6. Activity of Antioxidant Enzymes

Figure 3 shows the outcomes of testing the antioxidant enzyme activity of Red tilapia fish serum, which included the enzymes SOD and CAT. Fish fed ER0.5 and ER1 had considerably increased SOD and CAT activity compared with control basal-fed fish (p < 0.05). Fish fed a diet consisting of 1% ER showed the most activity.

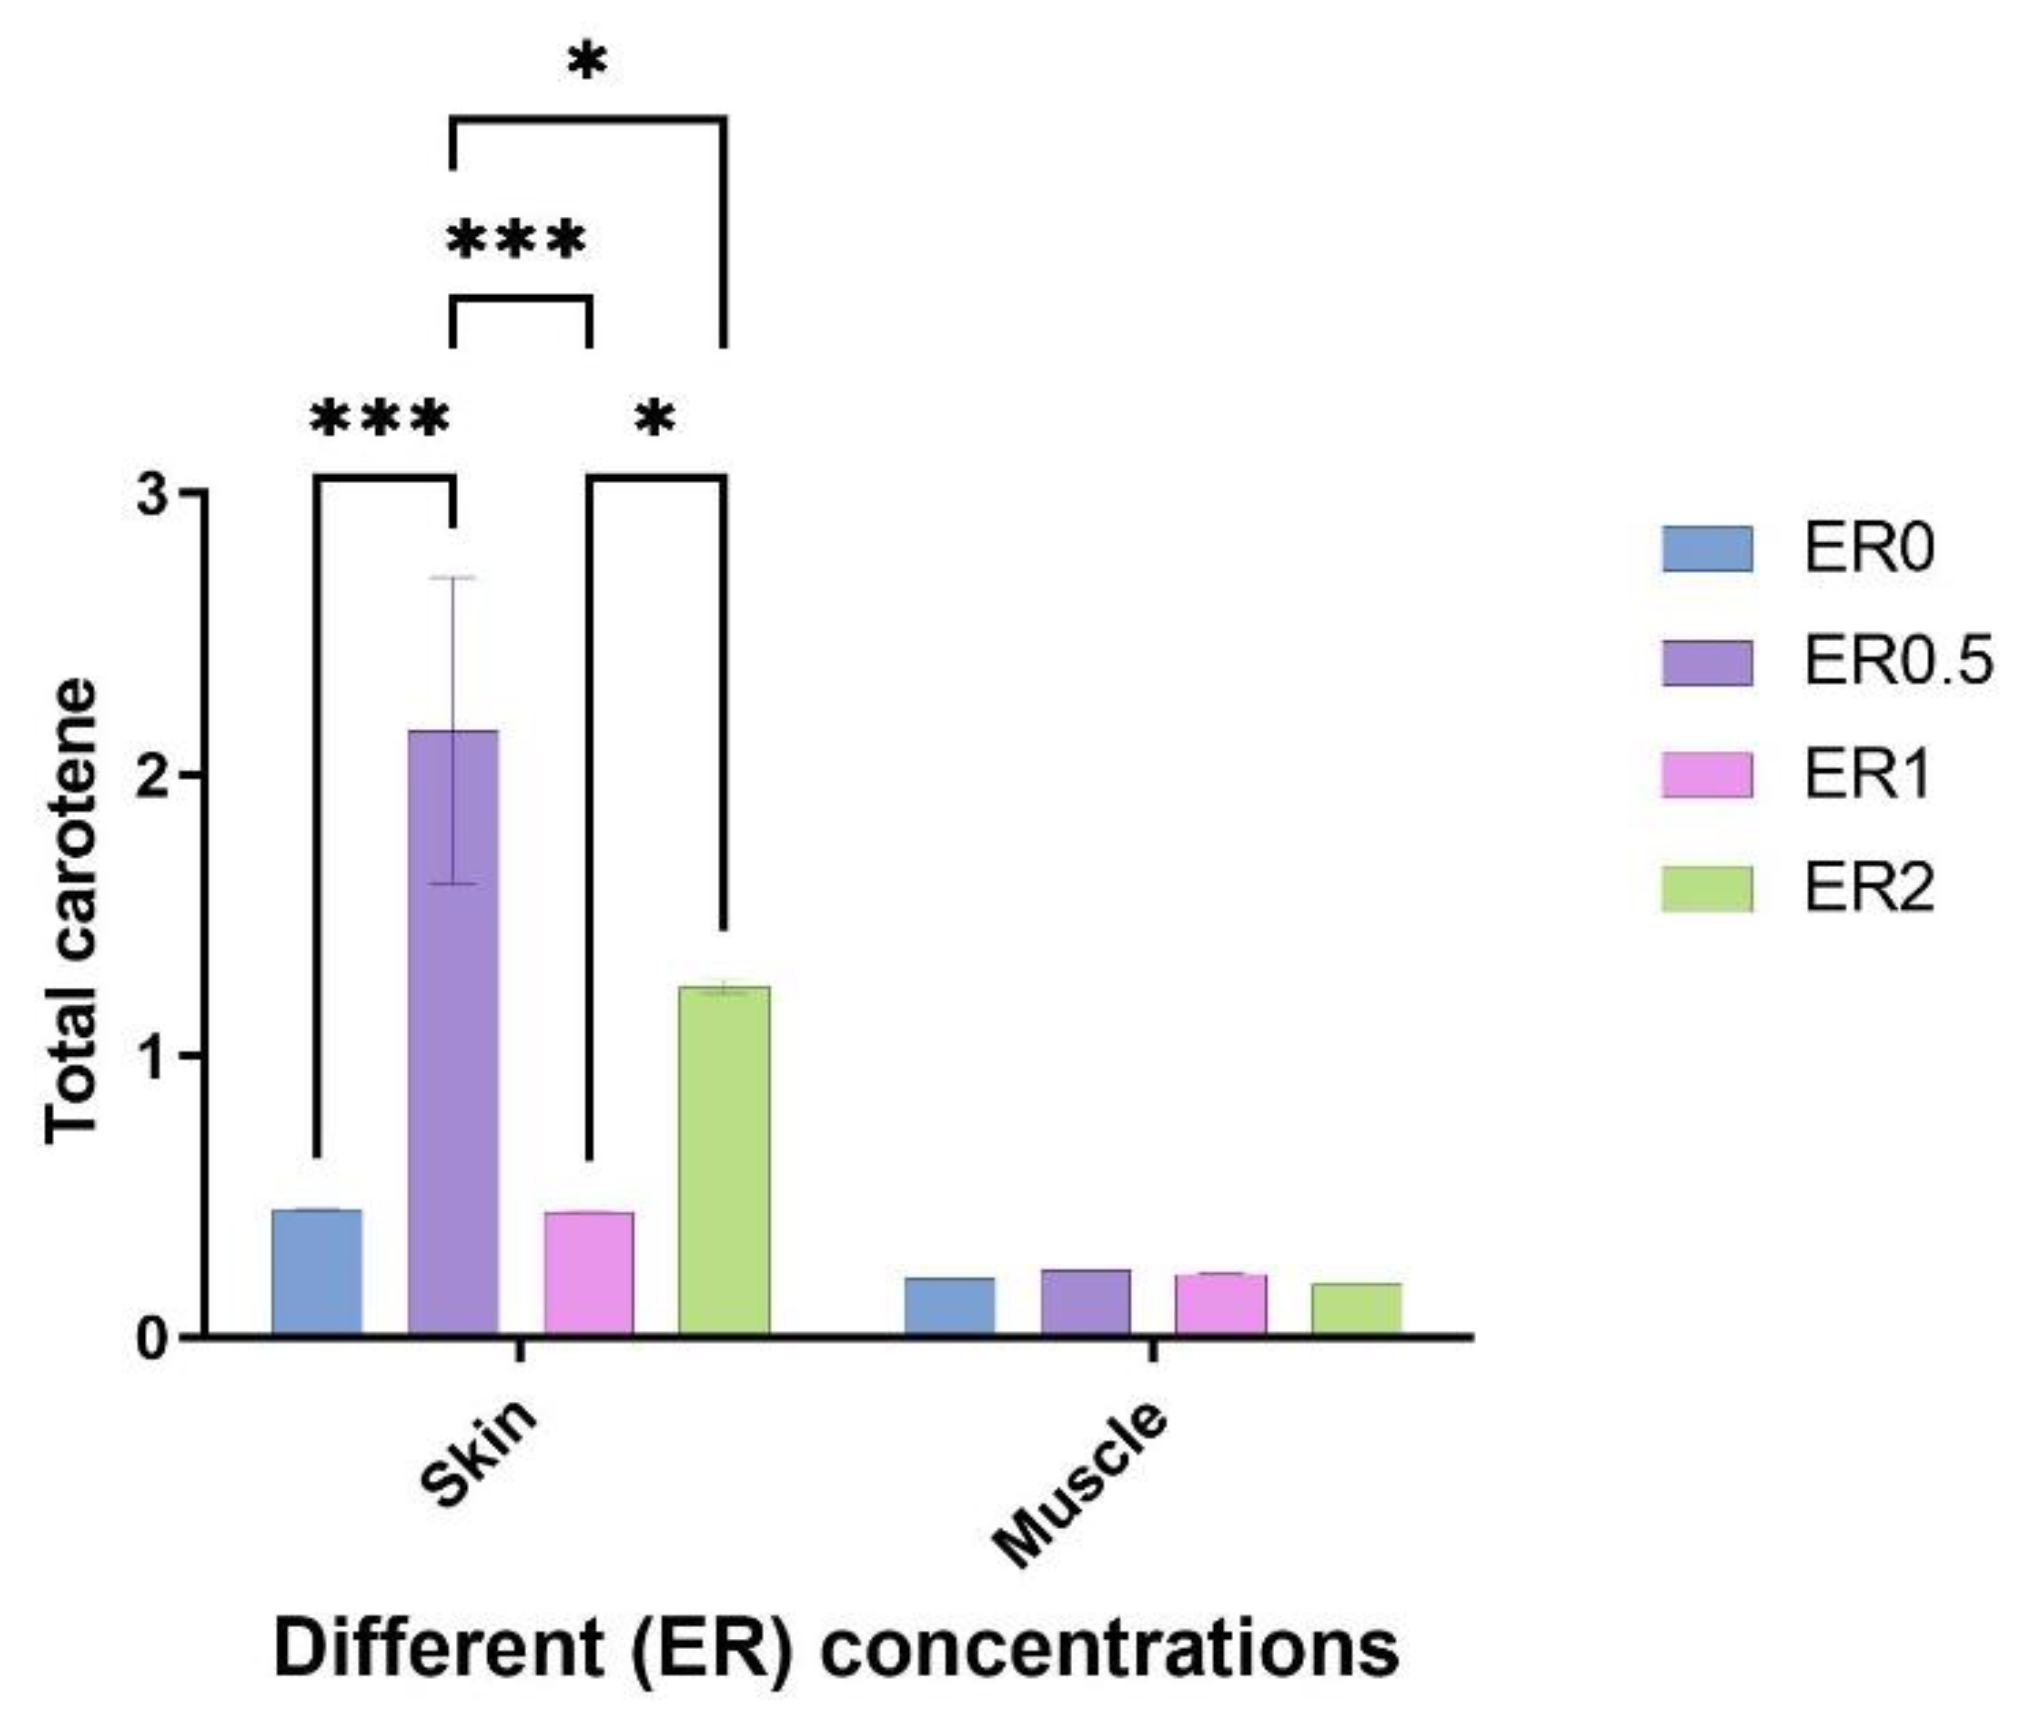
3.7. Total Carotene Measurement

Figure 4 shows that considerably higher (p < 0.001) skin total carotene was detected in the fish fed with 0.5% ER compared with the control group. The total carotene levels in the muscles, on the other hand, did not differ significantly across the different treatment groups.

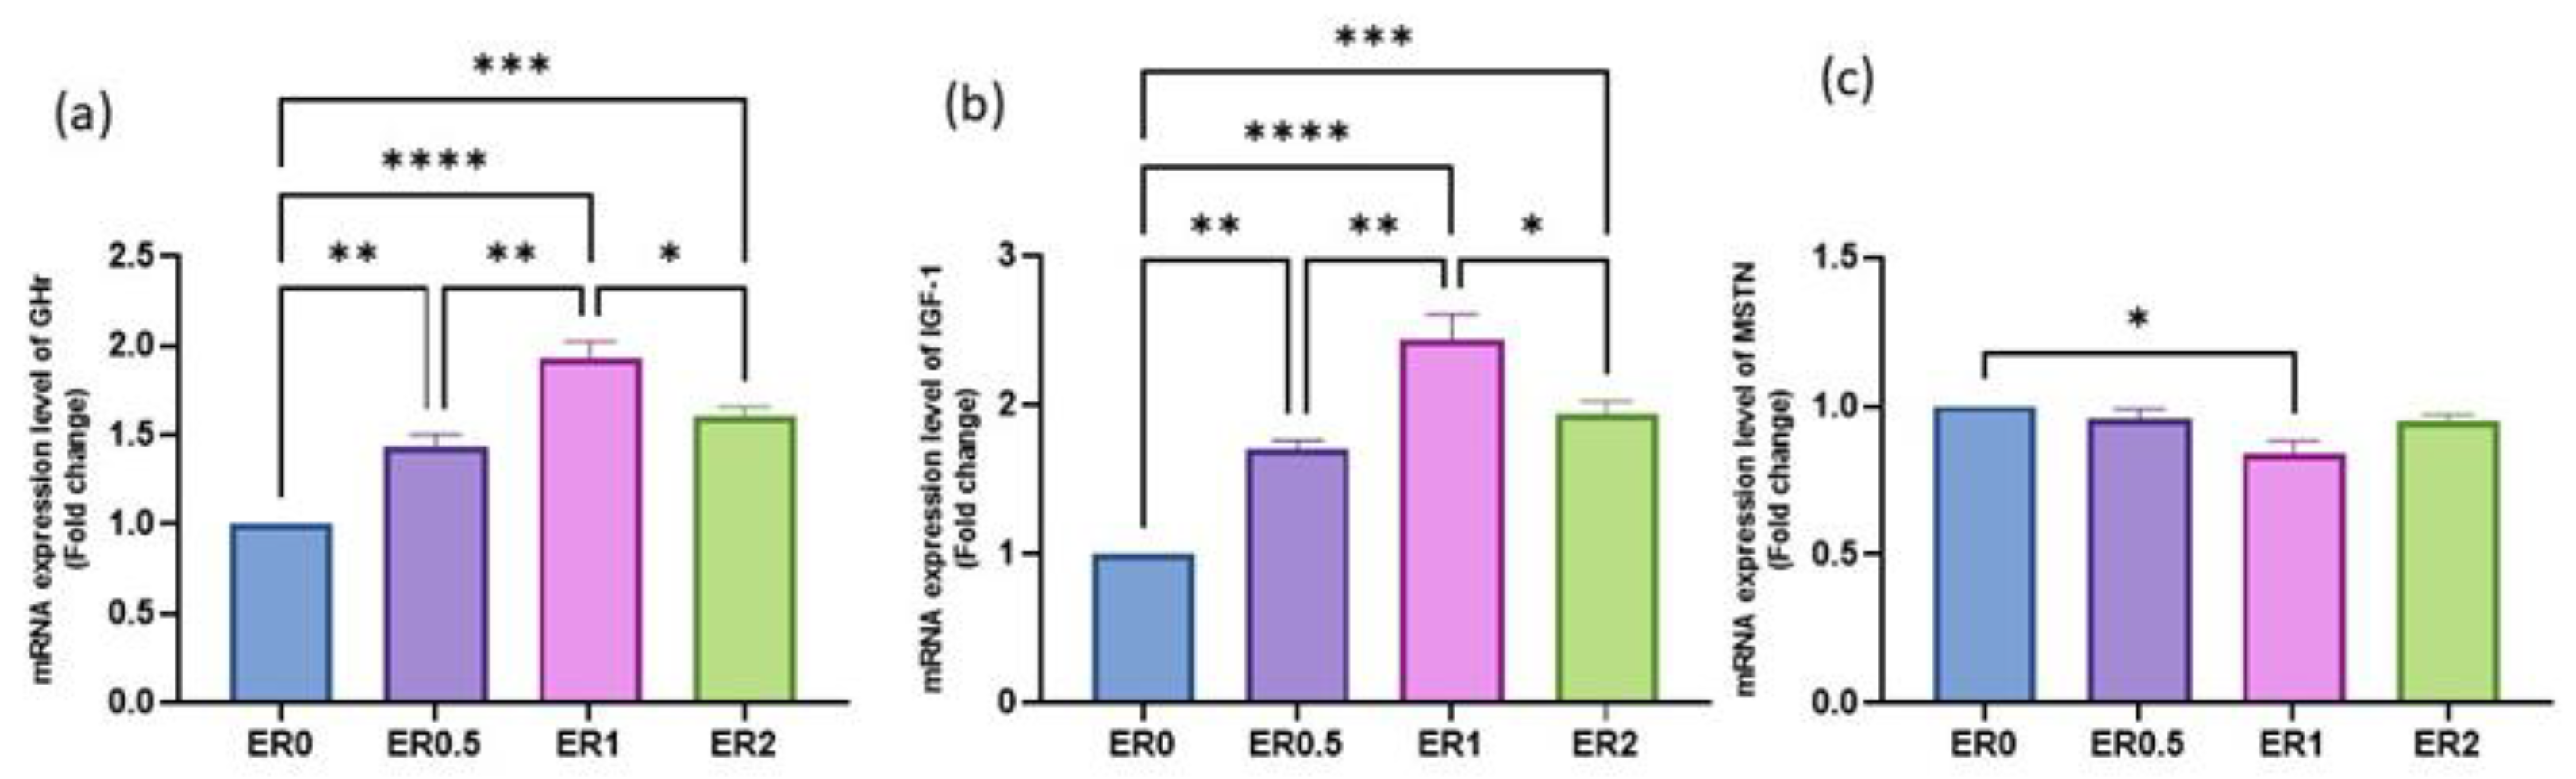
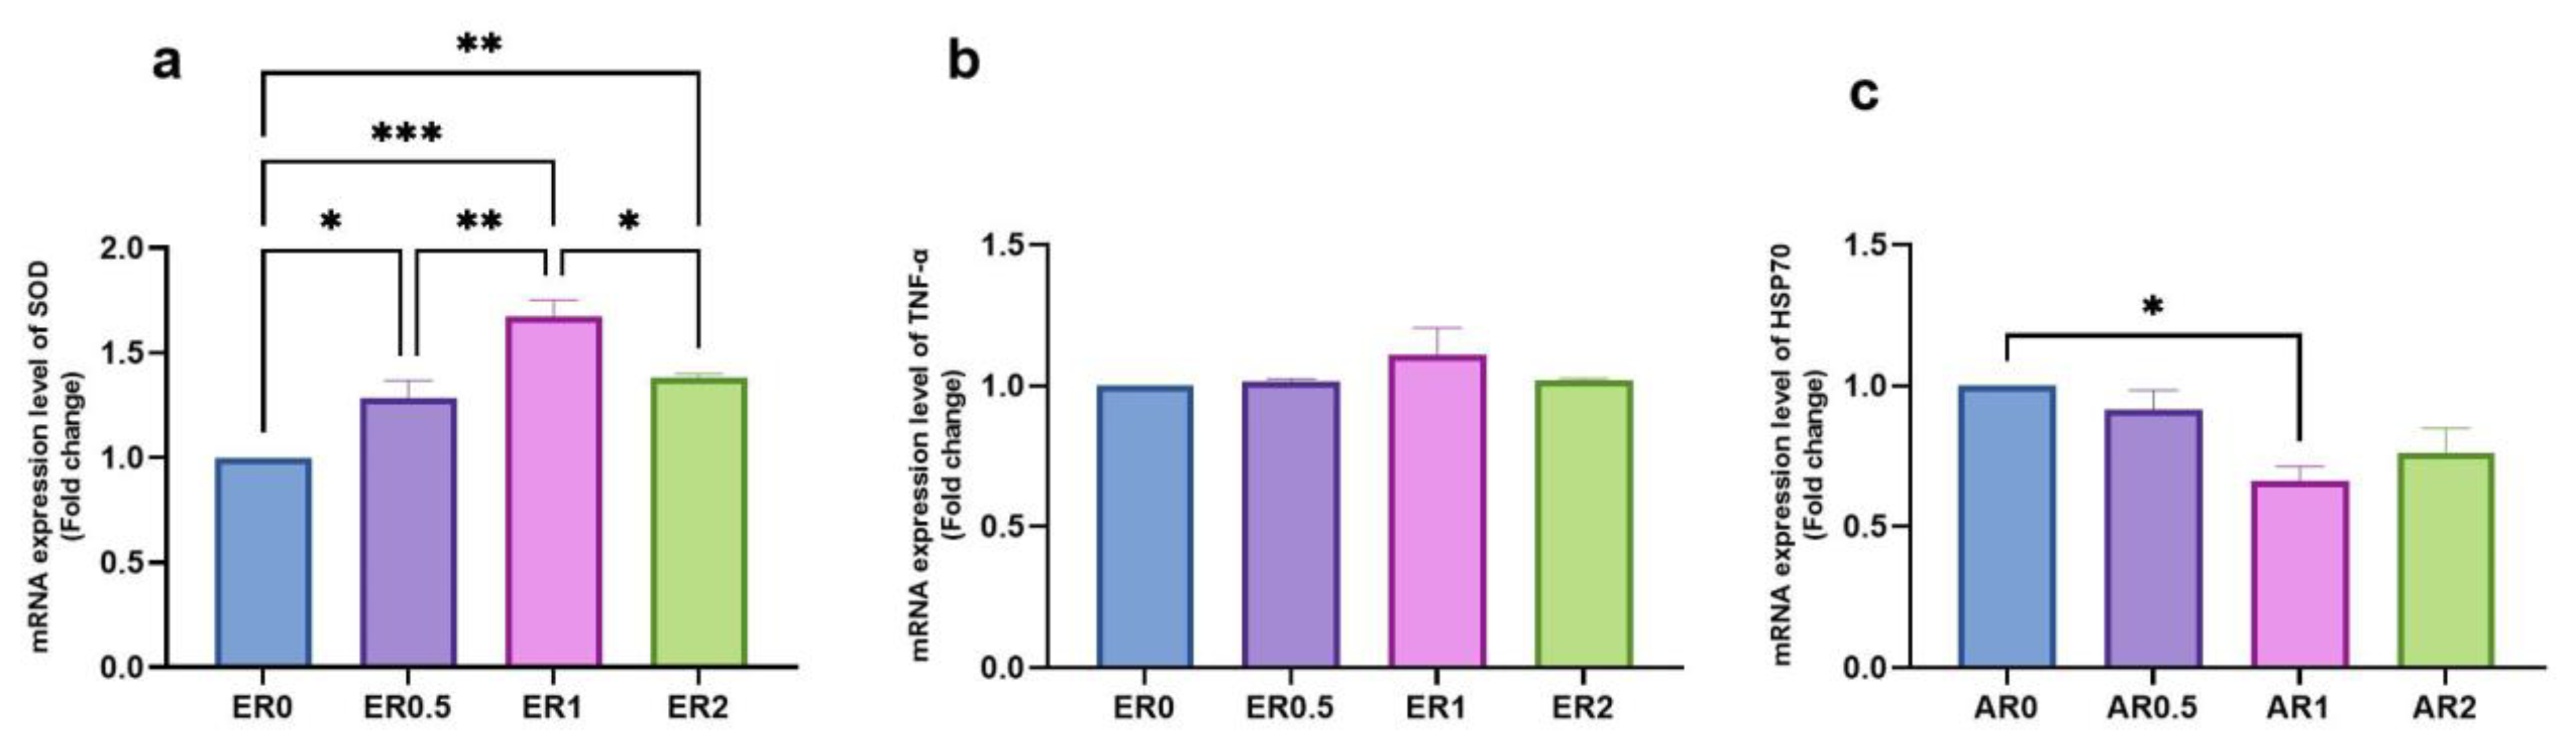
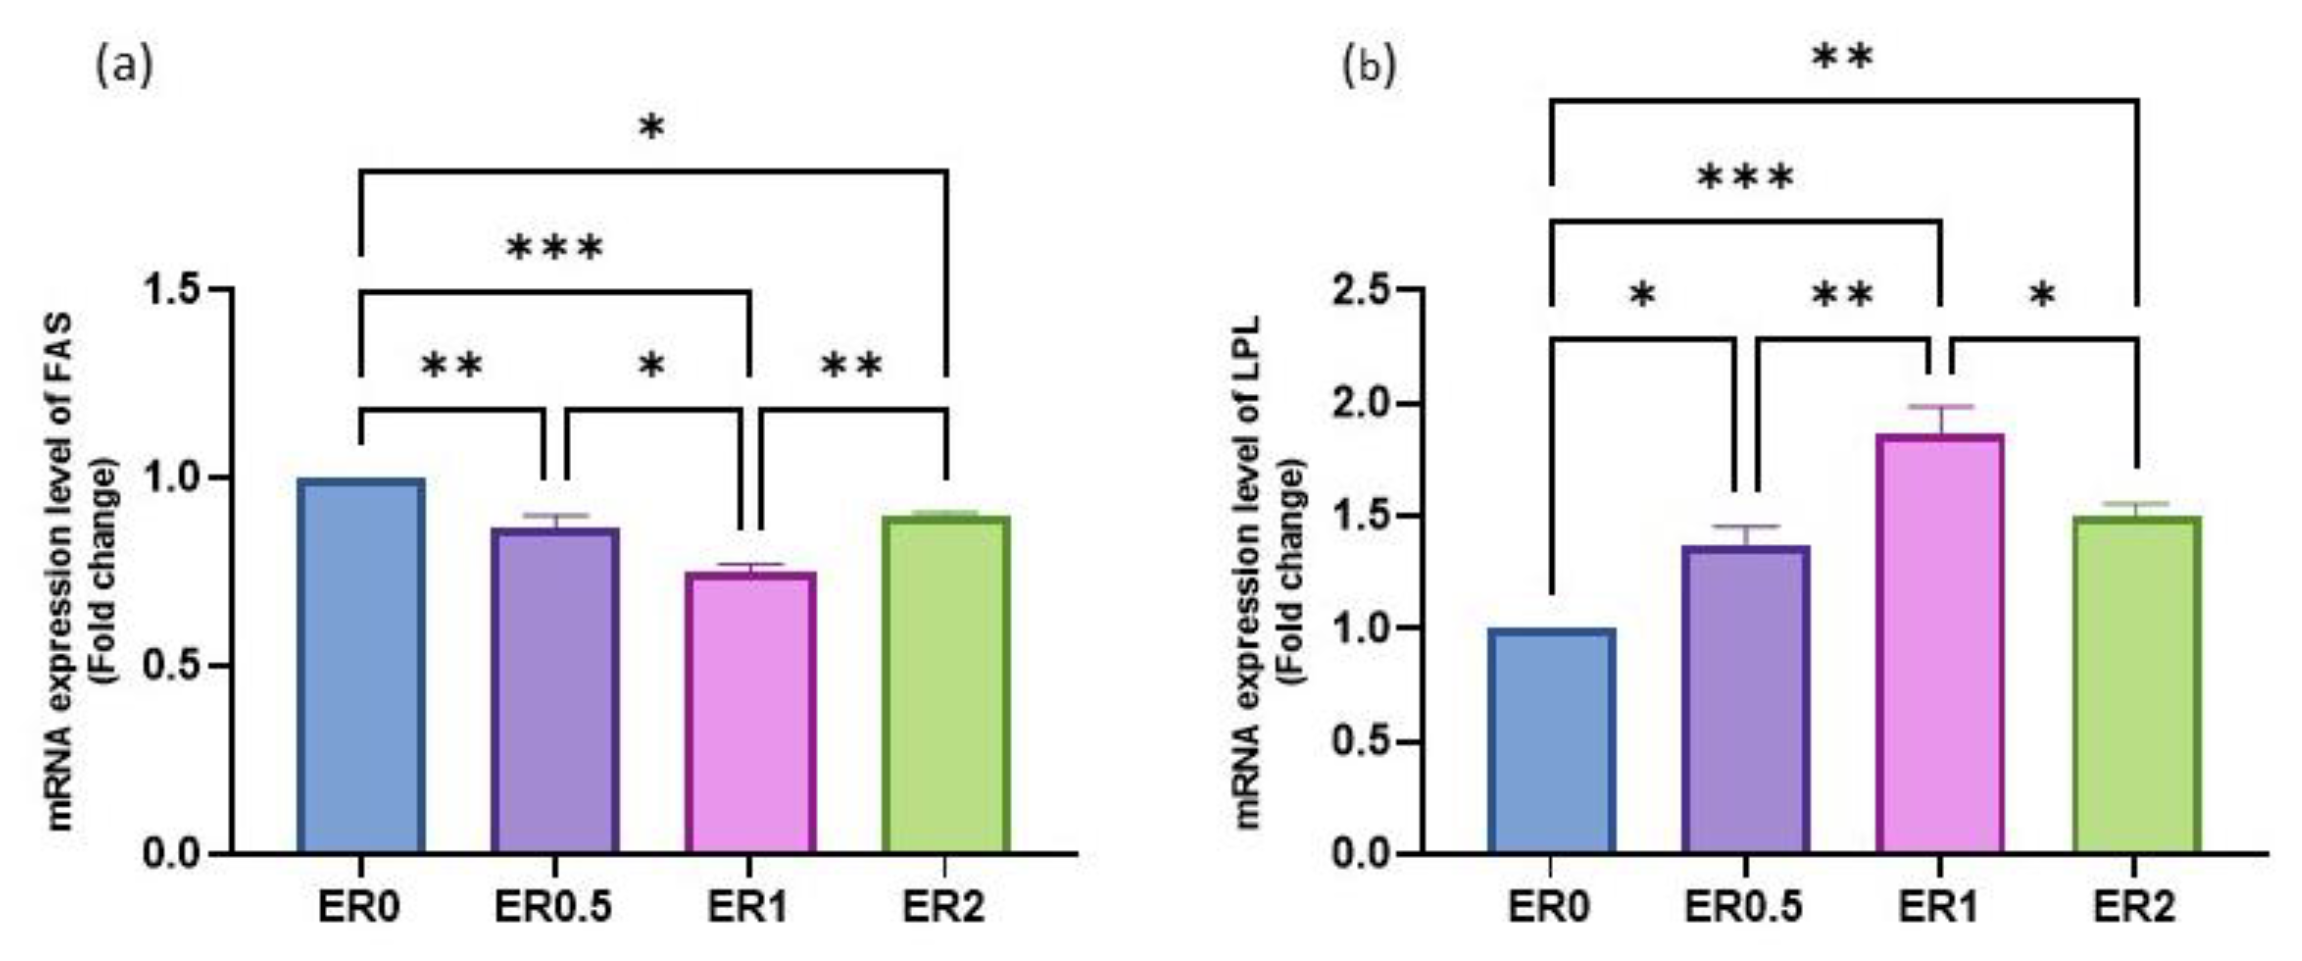
3.8. Time-Series Expression of Studied Genes in Response to Roselle Extract

Roselle extract-enriched diets significantly altered the expression of IGF-1, GHr, and MSTN genes, as shown by the analysis of relative mRNA expression of growth-related genes (Figure 5). Increases in IGF-1 and GHr gene expression in the kidney were shown to be caused by dietary enrichment with ER0.5 (p < 0.01), ER1 (p < 0.001), and ER2 (p < 0.001), with the most significant increase in expression seen in fish consuming a basal diet supplemented with 1% ER. There was a 1.2- and 0.9-fold increase for IGF-1 and GHr genes, respectively, compared with the non-enriched control diets. Interestingly, enrichment with Roselle extract did not upregulate the expression levels of the MSTN gene, compared with the non-enriched control diets, and ER1 induced a significant (p < 0.05) downregulation of expression (0.2-fold decrease).
The analysis of immune and antioxidant-related genes expression revealed a significant up-regulatory effect of enrichment with 1% ER (p < 0.01) and 2% ER (p < 0.05) (a 0.5- and 0.3-fold increase, respectively) on expression levels of the SOD gene in the kidney of red tilapia, as shown in Figure 6. Moreover, supplementation of ER1 to the fish basal diets induced a 0.1-fold rise in the expression levels of the TNF-α gene in comparison with the non-supplied control groups, whereas enrichment with 1 and 2% Roselle extract considerably decreased (p < 0.05) the expression levels of the HSP70 gene (0.4- and 0.3-fold decrease), respectively, compared with the basal diet.
Lipogenesis-related gene (LPL and FAS) relative mRNA expression analysis showed a striking difference in diets supplemented with Roselle extract (Figure 7). With enrichment of the fish basal diets with ER0.5 (p < 0.05), ER1 (p < 0.001), and ER2 (p < 0.01), the expression levels of the LPL gene in the kidney were significantly increased by 0.3-fold, 0.8-fold, and 0.4-fold, respectively, in comparison with the non-supplied control groups. In contrast, enrichment of fish-fed basal diets with ER0.5 (p < 0.01), ER1 (p < 0.001), and ER2 (p < 0.05) significantly down-regulated the expression level of the FAS gene (by 0.2-fold, 0.3-fold, and 0.1-fold, respectively) compared with the non-enriched control groups.

4. Discussion

Using medicinal herbs in aquaculture is one of the most exciting methods [51] because these dietary feed additives, mainly herbal extracts, can potentially enhance growth performance, blood health and immunity in marine and freshwater fish [52]. Several studies have examined how adding plant extracts to farmed fish staple diets affects productivity. Still, the authors of this study were particularly interested to learn more about the response of feeding ethyl extract of roselle calyces to Red tilapia. The growth performance measures and somatic parameters of red tilapia all improved marginally after the ethyl roselle extract dietary inclusion. The ER1 group had an excellent feed conversion ratio, SGR, SGR, and ultimate body weight. Additionally, ER2 generated the highest levels of HSI and VSI, but all ER-enriched meals resulted in lower levels of SSI activity relative to the ER0 control.
The results are consistent with earlier research showing that the inclusion of roselle spp. in the fish feed had no influence on growth rates. The authors of [18] found that nutritional supplementation with 0.5, 1, and 1.5% Roselle calyx (H. sabdariffa) for eight weeks had a non-significant effect on Rainbow trout (O. mykiss) growth performance parameters. Comparable data were recorded in broiler chickens [53]. Moreover, Roselle had no significant effect on somatic index parameters in sharp tooth catfish (C. gariepinus), according to [54], indicating that Roselle did not induce any organ abnormalities in the fish, and our results agree with these findings. The positive findings for growth performance parameters could be attributed to the presence of polyphenolic bioactive substances such as cyclohexane carboxylic acid, fluconazole, glycopyranoside, and benzoxyquinone that were validated by the present study’s GC-MS profile at the measured values of 11.83%, 4.93%, 0.97%, and 0.97% respectively. Fish metabolism has been observed to be improved by these bioactive substances, resulting in improved health and growth [55]. Furthermore [56], reported that fluconazole (C13H12F2N6O) could significantly increase the hepatosomatic index (HSI).
Polyphenols have the opposite effect, dose-dependently reducing body weight and feeding efficiency by inhibiting digestive enzyme secretion, increasing protein secretion, and decreasing protein and amino acid digestibility. This is because polyphenols are probably too hydrophilic to penetrate the gut wall by passive diffusion [57], and our results agree with these findings. Similarly, the anti-nutritional effects of high doses of polyphenol-rich macroalgae extract hampered growth performance and nutrient utilization efficiency [58]. On the other hand, [59] reported significant rises in growth markers (final weight, specific rate, weight gain, and relative growth rate) in C. gariepinus fed Roselle-supplemented diets compared with controls. After an eight-week trial period, goldfish fed Roselle extract significantly improved their growth rate and feed efficiency [60]. These different findings could be attributed to using various sources of Roselle spp. with differing chemical compositions, and other fish species [61].
The fish’s vital digestive organ is the intestine which plays a crucial function in maintaining its health. Digestion and absorption in fish are directly affected by factors such as villi height, villi width, and goblet cell density [62]. In addition, goblet cells produce mucus to shield the mucosal barrier from dehydration, injury, and dangerous bacteria in the gastrointestinal tract [63]. Feed utilization is enhanced by a healthy intestinal morphometric structure, significantly predicting fish health [64]. This study’s histomorphometric assessment of intestinal villi absorptive capacity demonstrated an increase in villi length, width, and goblet cell populations in fish fed 0.5, 1, and 2% ER, with the highest results in fish provided 1% ER. These results matched the fish performance research. Likewise [53], roselle (H. sabdariffa) extract improved broiler chicken intestinal histomorphology (100 mg kg−1). Roselle lowers blood pressure, prevents cancer, and improves digestion [65]. Roselle extract’s polyphenolic content improves gut architecture and nutritional absorption in monogastric animals [66]. Hematological indicators show how nutritional therapies affect the animal’s feed consumption, quality, and availability to meet biochemical, physiological, and metabolic needs [20]. Dietary inclusion of ethyl roselle extract stimulated non-significant improvements in PCV and Hb in fish fed with 5 g kg−1, compared with the control diet, illustrating the capacity of ER to promote health status [67] and the immune response of fish [68].
The results obtained here were comparable with [69], who reported no significant changes in red blood cell indices (mean corpuscular volume, mean corpuscular hemoglobin concentration, and mean corpuscular hemoglobin) of C. gariepinus juveniles fed varying inclusion levels of Roselle (H. sabdariffa) and ginger (z. officinale) as feed additives. Dietary Roselle extract did not influence hematological parameters [53]. Similar findings were recorded in birds [70] and broiler chickens [71]. However, Roselle prompted a significant increase in PCV, RBCs, and Hb in Nile tilapia (O. niloticus) [20], Rainbow trout (O. mykiss) [18,60], and albino rats [72]. Furthermore, the nutritional and health status of fish can be determined by analyzing their blood biochemistry [72]. The measured biochemical parameters (TP, albumin, ALT, AST, cholesterol, triglycerides, urea, and glucose) were around the normal values for Red tilapia [73], especially when the basal fish diet was supplemented with 5 g kg−1 roselle extract.
A diet with Roselle extract had no significant effects on Rainbow trout’s total protein or albumin [18]. According to [74], H. sabdariffa calyx extract did not affect broiler chicken ALT, glucose, or AST. In African sharp tooth catfish (C. gariepinus), a high (4%) dietary Roselle supplementation significantly increased ALT and ALP circulating levels [75]. These results may be due to the presence of Linoleic acid (peak area % = 16.51%) in ER that was reported to influence several enzymatic activities involved in intermediary liver metabolism [76]. Fluconazole (peak area % = 4.93%) may also be responsible for the significant alterations in AST, ALT, and albumin [56].
Roselle extract was found to act against liver disease, atherosclerosis, and other metabolic syndromes based on lipid profile results [77] and lipid metabolism efficiency [78]. According to cholesterol and triglyceride levels studies, Roselle extract has been shown to have anti-liver disease and anti-atherosclerosis effects as well as effects against other metabolic syndromes [53]. These effects could be due to phenolic acids such as cyclopentane carboxylic acids (21.82%) that have been reported to play essential roles in the secretion of bile and the reduction of lipids and cholesterol levels [79]. Additionally, the maintenance of serum urea and creatinine levels demonstrates that the addition of dietary roselle extract, particularly ER0.5, did not have any adverse effects on the kidney of the animals [80,81]. The results for digestive enzymes (amylase and lipase) in ethyl Roselle extract enriched meals, notably, ER0.5, suggest a similar significance for ER in nutrient digestion and the nutritional state of the intestine in aquatic animals [82,83].
These findings demonstrate that similar to litopenaeus vannamei, succinic acid (peak area % = 4.93%) increased amylase and lipase activity in the hepatopancreas of Red tilapia at higher dosages [76]. The hematological and biochemical results indicate that ER had no harmful effects on fish health [20], at the ER0.5 level in particular. Phagocytic activity, phagocytic index, lysozyme activity, and white blood cell (WBC) count are common ways to evaluate a fish’s immune response [84]. Higher lysozyme activity, phagocytic activity, and white blood cell (WBC) count in fish fed 5 g kg−1 ER compared with fish fed a control diet suggested an improvement in fish immune capabilities [85]. Consistent results were also seen by [20]. Bioactive substances may contribute to ER’s potent immunostimulant characteristics. These include phenolics such as cyclopentane carboxylic acids, (peak area % = 21.82%) [86], succinic acid (peak area % = 4.93%) [76], and fluconazole (peak area % = 4.93%) [56], which made up the bulk of the GC-MS experiments here. These findings corroborate the results of [18], who did not detect any discernible shifts in the percentages of white blood cells, lymphocytes, or monocytes in Rainbow trout (O. mykiss). High doses of H. sabdariffa Roselle extract, rich in the antioxidant anthocyanins, considerably increased lysozyme levels in the blood [53]. A combination of yogurt as a probiotic food with 4% Roselle (H. sabdariffa) extract has been shown to enhance the number of phagocytic macrophages in the body [87].
Fish fed ER had more significant increases in SOD and CAT compared with fish that were fed a control diet, suggesting that ER helps maintain high antioxidant levels in the body [8]. Comparable results were observed by [60], who reported that dietary Roselle at 0.5% significantly improved hepatic antioxidant parameters (SOD and CAT enzymes) in Rainbow trout (O. mykiss). It has also been shown that oral Roselle administration mitigates oxidative stress and improves antioxidant capacities in rats and pigs [88,89]. Comparable results were recorded in broiler chickens [53] and Common carp (C. carpio) [60,90]. There is a possibility that the antibacterial and antioxidant properties shown here are due to the presence of polyphenols and soluble polysaccharides [91]. Hemolysis that is induced by oxidative damage to red blood cells is a symptom of an impaired antioxidant defense system [92]. Because of this, the fish’s development and immune power are stunted. Thus, feed additives with antioxidant and anti-stress qualities help enhance fish health and growth.
Protecting cells from oxidative damage, carotenoids are a non-enzymatic part of the antioxidant system [93]. Furthermore, carotenoids may play a role in skin pigmentation and in other tissues [94]. Carotenoids are essential for fish health, but fish cannot make them themselves [95]. In the current study, total carotene levels in the skin of Red tilapia were shown to increase significantly by more than 1.5 μg/g in fish fed with 0.5% ER. Fish fed at a rate of 0.5% ER had a modest increase in total carotene content in their muscles but a decrease was observed in ER2. Total carotenoid was increased by 26.10% when Roselle plants were inoculated with a bio-fertilizer [96].
In terms of total carotene, including -carotene, -cryptoxanthin, -carotene, lycopene, lutein, and zeaxanthin, roselle is rich source [97]. However, higher concentrations of ER (as in ER1 and ER2) have been shown to reduce the bioavailability and absorption of carotenoids, which may explain why some populations have lower total carotene activity [98,99]. Moreover, ref. [100] argued that fat-soluble substances diminish carotenoids’ bioavailability and that interactions between carotenoids may have a similar effect. The expression of specific immunological, antioxidant, and growth-related genes in Red tilapia was characterized and measured using qPCR assays.
Important growth indicators such as growth hormone receptors, insulin-like growth factor-1, and muscle-specific tyrosine kinase n are influenced by fish feeding [8,101]. Supplementing the diet with ER increased GHr and IGF-1 expression while decreasing MSTN expression. Ethyl Roselle extracts generated more significant increases in the expression of GHr and IGF-1 genes at higher dosages (ER1 and ER2) than at lower doses (ER0.5). At the same time, ER1 showed the lowest expression levels of the MSTN gene. These results are consistent with those seen in [8], which demonstrated that feeding Nile tilapia on Ulva fasciata methyl extract for 90 days at 50 mg kg−1, 100 mg kg−1, and 150 mg kg−1 resulted in upregulated expression of GH and IGF-1. The authors of [102] reported lower expression of the MSTN gene. Skeletal muscle telomerase mRNA (MSTN) is a highly conserved, destructive regulator of skeletal muscle growth across vertebrate species. This suggests an essential role for MSTN in regulating growth and muscle development [103,104]. Different possible reasons may be ascribed to these findings. Firstly, linoleic acid (Peak area% = 16.51%) [76] promotes fish growth via increased food consumption [105,106]. Secondly, polyphenols such as cyclohexane carboxylic acid, fluconazole, glycopyranoside, and benzoxyquinone can cause adverse metabolic effects at higher doses, including increased protein secretion, inhibition of digestive enzyme secretion, and decreased protein and amino acid digestibility [107,108]. Finally, the long-chain fatty acids ethyl palmitate (18.35%) and linolelaidic acid (14.1%) are beneficial in many ways, especially to human development and growth [109].
There is a correlation between the levels of TNF-α, HSP70, and SOD gene expression and the health of the immune system [110,111], physiological status [112,113], and oxidative status [114] of fish. Gene expression levels for HSP70 and the proinflammatory cytokine tumor necrosis factor-alpha (TNF-α) were downregulated in the ER groups compared with the control fish group. At the same time, those for superoxide dismutase were upregulated. These findings mirror those of [115]. They found that a meal high in beta-carotene and phycocyanin derived from Spirulina platensis reduced HSP70 gene expression in Nile tilapia (Oreochromis niloticus). These researchers also found remarkably similar outcomes [115]. In addition, there was no difference between 0.5ER, 1ER, and 1.5ER treatments and the control treatment regarding TNF-α gene expression in the liver [18]. In addition, 1% of G. gracilis powder added to feed revealed a moderate rise in SOD gene expression [116]. Roselle’s phenolic compounds, which give the plant its antioxidant, anti-inflammatory, and immune-stimulatory effects, may be to blame [79], and polyphenolic contents can cause oxidative stress and induce inflammation [117]. Furthermore, fluconazole (peak area % = 4.93%) is reportedly more active. It has a decisive modulatory role in fish, especially in the secretion of the inflammatory cytokine TNF-α, as demonstrated by [118]. Moreover, 0.50% (w/w) of succinic acid in the diet was the best dosage for increasing SOD gene expression [76]. The primary component, succinic acid, was reported in our investigation (peak area % = 4.93%).
Inhibiting fatty acid synthase (FAS) decreases lipid accumulation while being an essential enzyme in creating long-chain fatty acids [119,120]. Moreover, lipoprotein lipase (LPL) is the critical enzyme for lipid storage and metabolism [121]. Fatty acid synthase (FAS) expression was lower, and lipoprotein lipase (LPL) expression was higher in the adipose tissue of Roselle-supplemented fish compared with control fish. This suggests that FAS and LPL work together to raise circulating fatty acid levels [122] and that ER acts as an inhibitor of lipogenesis. Enhanced LPL activity also promotes the conversion of circulating triglycerides into free fatty acids, which are then taken up by cells in the liver and skeletal muscle [123].
Furthermore, our results were consistent with [124], who discovered that feeding Nile tilapia (Oreochromis niloticus) clenbuterol resulted in increased lipolysis by upregulating the gene encoding lipoprotein lipase (LPL). Atlantic salmon have shown the same patterns [125], as well as Turbot [126], and Rainbow trout [127]. In addition, our findings were consistent with [123], who noted that elevated GHr expression corresponds to high GH activity, which promotes lipolysis via increased hepatic LPL expression and enhanced triglyceride absorption. Roselle extracts such as ethyl palmitate, linoleic acid, linolenic acid, and linoleic acid chloride were found to alter the levels of n-6 and n-3 polyunsaturated fatty acids in the diets of female silver pomfret (P. argenteus) breeding stock, leading to lower tissue FAS and higher LPL activities and mRNA expression levels [128]. Hepatic FAS activities and mRNA expression levels were significantly attenuated by high dietary n-3 LC-PUFAs levels, whereas LPL activities and mRNA expression levels were dramatically elevated [129]. Upregulation of the FAS gene and downregulation of LPL gene expression have been linked to increased n-6 PUFA levels, which can have detrimental effects on various cellular functions [130,131].
Consequently, this explains why 20 g kg−1 ER exhibited distinct actions. Other researchers also found remarkably similar outcomes [132,133]. Significant elevation of FAS expression was seen in the 100% soybean oil group, suggesting that high dietary n-6 PUFA levels upregulated FAS in Turbot [126]. More research is needed to determine the effect of ER as an immunomodulator in the diet of Red tilapia challenged with bacterial infections. More studies are required to confirm the many roles and significance of ER in Red tilapia.

5. Conclusions and Prospects

In summary, the findings of this work demonstrate that dietary enrichment of ER at 0.5 and 1% concentrations could improve the growth, intestine histomorphology, haemato-biochemical performances, immune-oxidative index, and total carotene content of Red tilapia skin; furthermore, improvements were observed in terms of gene expression. Therefore, ER can be combined with conventional Red tilapia feed to improve fish health, welfare, and color.

Supplementary Materials

The following supplementary materials are available for download at: https://www.mdpi.com/article/10.3390/fishes8040172/s1, Figure S1: RNA transcription levels of candidate reference genes (absolute Cq values) representing the abundance of studied genes in four-time running.

Author Contributions

Conceptualization, E.E.E., A.M.D., M.H.A.-R. and M.S.; methodology, A.A., S.F.I., L.F. and M.M.K.; software, E.E.E.; validation, A.M.D., M.S. and A.A.; investigation, S.F.I., L.F. and M.A.; data curation, M.M.K.; writing—original draft preparation, M.H.A.-R. and M.M.K.; writing—review and editing, E.E.E. and A.M.D.; visualization, A.A., S.F.I., L.F. and M.M.K.; supervision, A.M.D.; project administration, E.E.E. and A.M.D.; funding acquisition, A.A., S.F.I., L.F. All authors have read and agreed to the published version of the manuscript.

Funding

This work was funded by The Princess Nourah bint Abdulrahman University Researchers Supporting Project number (PNURSP2023R127), Princess Nourah bint Abdulrahman University, Riyadh, Saudi Arabia. Moreover, this paper is published from the project 6PFE of the University of Life Sciences “King Mihai I” from Timisoara and Research Institute for Biosecurity and Bioengineering from Timisoara.

Institutional Review Board Statement

The experimental methods, procedure, and fish rearing were approved by the Faculty of Aquatic and Fisheries Sciences, Kafrelsheikh University, Egypt.

Data Availability Statement

Data are available upon request.

Acknowledgments

The authors would like to thank the Department of Aquaculture, Faculty of Aquatic and Fisheries Sciences, Kafrelsheikh University, Egypt, for providing facilities to carry out this experiment. We also appreciate the resources provided by the Princess Nourah bint Abdulrahman University Researchers Supporting Project number (PNURSP2023R127), Princess Nourah bint Abdulrahman University, Riyadh, Saudi Arabia. Moreover, this paper is published from the project 6PFE of the University of Life Sciences “King Mihai I” from Timisoara and Research Institute for Biosecurity and Bioengineering from Timisoara.

Conflicts of Interest

The authors declare no conflict of interest.

References

  1. FAO. The State of World Fisheries and Aquaculture 2020: Sustainability in Action; FAO: Rome, Italy, 2020. [Google Scholar]
  2. Antonucci, F.; Costa, C. Precision aquaculture: A short review on engineering innovations. Aquac. Int. 2020, 28, 41–57. [Google Scholar] [CrossRef]
  3. Pirozzi, I.; Booth, M.A.; Pankhurst, P.M. The effect of stocking density and repeated handling on the growth of juvenile mulloway, Argyrosomus japonicus (Temminck & Schlegel 1843). Aquac. Int. 2009, 17, 199–205. [Google Scholar]
  4. Tosun, D.D. Crocodile farming and its present state in global aquaculture. J. Fish. Sci. 2013, 7, 43. [Google Scholar] [CrossRef]
  5. Pankhurst, N.; Ludke, S.; King, H.; Peter, R. The relationship between acute stress, food intake, endocrine status and life history stage in juvenile farmed Atlantic salmon, Salmo salar. Aquaculture 2008, 275, 311–318. [Google Scholar] [CrossRef] [Green Version]
  6. Santos, G.; Schrama, J.; Mamauag, R.; Rombout, J.; Verreth, J. Chronic stress impairs performance, energy metabolism and welfare indicators in European seabass (Dicentrarchus labrax): The combined effects of fish crowding and water quality deterioration. Aquaculture 2010, 299, 73–80. [Google Scholar] [CrossRef]
  7. Jittinandana, S.; Kenney, P.; Slider, S.; Mazik, P.; Bebak-Williams, J.; Hankins, J. Effect of fish attributes and handling stress on quality of smoked arctic char fillets. J. Food Sci. 2003, 68, 57–63. [Google Scholar] [CrossRef]
  8. Abo-Raya, M.H.; Alshehri, K.M.; Abdelhameed, R.F.; Elbialy, Z.I.; Elhady, S.S.; Mohamed, R.A. Assessment of growth-related parameters and immune-biochemical profile of nile tilapia (oreochromis niloticus) fed dietary ulva fasciata extract. Aquac. Res. 2021, 52, 3233–3246. [Google Scholar] [CrossRef]
  9. Austin, B.; Austin, D. Bacterial Fish Pathogens: Diseases of Farmed and Wild Fish; Springer-Praxis: Godalming, UK, 2007. [Google Scholar]
  10. Moustafa, E.M.; Farrag, F.A.; Dawood, M.A.; Shahin, K.; Hamza, A.; Decamp, O.; Mohamed, R.; Elsabagh, M.; Eltholth, M.; Omar, A.A. Efficacy of Bacillus probiotic mixture on the immunological responses and histopathological changes of Nile tilapia (Oreochromis niloticus, L) challenged with Streptococcus iniae. Aquac. Res. 2021, 52, 2205–2219. [Google Scholar] [CrossRef]
  11. Akinrotimi, A.; Gabriel, U.; Anyanwu, P.; Anyanwu, A. Influence of sex, acclimation methods and period on Haematology of Sarotherodon melanotheron (Cichilidae). Res. J. Biol. Sci. 2007, 2, 248–352. [Google Scholar]
  12. Batista, S.; Ramos, M.; Cunha, S.; Barros, R.; Cristóvão, B.; Rema, P.; Pires, M.; Valente, L.; Ozório, R. Immune responses and gut morphology of Senegalese sole (Solea senegalensis, K aup 1858) fed monospecies and multispecies probiotics. Aquac. Nutr. 2015, 21, 625–634. [Google Scholar] [CrossRef]
  13. Wu, Y.-R.; Gong, Q.-F.; Fang, H.; Liang, W.-W.; Chen, M.; He, R.-J. Effect of Sophora flavescens on non-specific immune response of tilapia (GIFT Oreochromis niloticus) and disease resistance against Streptococcus agalactiae. Fish Shellfish Immunol. 2013, 34, 220–227. [Google Scholar] [CrossRef] [PubMed]
  14. Zhao, Y.; Yang, Q.E.; Zhou, X.; Wang, F.-H.; Muurinen, J.; Virta, M.P.; Brandt, K.K.; Zhu, Y.-G. Antibiotic resistome in the livestock and aquaculture industries: Status and solutions. Crit. Rev. Environ. Sci. Technol. 2020, 51, 2159–2196. [Google Scholar] [CrossRef]
  15. Lulijwa, R.; Rupia, E.J.; Alfaro, A.C. Antibiotic use in aquaculture, policies and regulation, health and environmental risks: A review of the top 15 major producers. Rev. Aquac. 2020, 12, 640–663. [Google Scholar] [CrossRef]
  16. Maqsood, S.; Singh, P.; Samoon, M.H.; Munir, K. Emerging role of immunostimulants in combating the disease outbreak in aquaculture. Int. Aquat. Res. 2011, 3, 147–163. [Google Scholar]
  17. Portillo-Torres, L.A.; Bernardino-Nicanor, A.; Mercado-Monroy, J.; Gómez-Aldapa, C.A.; González-Cruz, L.; Rangel-Vargas, E.; Castro-Rosas, J. Antimicrobial Effects of Aqueous Extract from Calyces of Hibiscus sabdariffa in CD-1 Mice Infected with Multidrug-Resistant Enterohemorrhagic Escherichia coli and Salmonella Typhimurium. J. Med. Food 2021, 25, 902–909. [Google Scholar] [CrossRef] [PubMed]
  18. Jomeh, R.; Chitsaz, H.; Akrami, R. Effect of anthocyanin extract from Roselle, Hibiscus sabdariffa, calyx on haematological, biochemical and immunological parameters of rainbow trout, Oncorhynchus mykiss. Aquac. Res. 2021, 52, 3736–3744. [Google Scholar] [CrossRef]
  19. Yousefi, M.; Vatnikov, Y.A.; Kulikov, E.V.; Ahmadifar, E.; Mirghaed, A.T.; Hoseinifar, S.H.; Van Doan, H. Effects of dietary Hibiscus sabdariffa supplementation on biochemical responses and inflammatory-related genes expression of rainbow trout, Oncorhynchus mykiss, to ammonia toxicity. Aquaculture 2021, 533, 736095. [Google Scholar] [CrossRef]
  20. El Mesallamy, A.M.; Ahmad, M.H.; Souleman, A.M.; El Morsy, A.T.; Abd El-Naby, A.S. Effects of Roselle calyx (Hibiscus sabdariffa L.)-supplemented diets on growth and disease (Aeromonas hydrophila) resistance in Nile tilapia (Oreochromis niloticus L.). Egypt. Pharm. J. 2016, 15, 78. [Google Scholar]
  21. Yin, G.; Cao, L.; Xu, P.; Jeney, G.; Nakao, M. Hepatoprotective and antioxidant effects of Hibiscus sabdariffa extract against carbon tetrachloride-induced hepatocyte damage in Cyprinus carpio. Vitr. Cell. Dev. Biol. Anim. 2011, 47, 10–15. [Google Scholar] [CrossRef]
  22. Siddiqui, A.Q.; Al-Harbi, A.H. Evaluation of three species of tilapia, red tilapia and a hybrid tilapia as culture species in Saudi Arabia. Aquaculture 1995, 138, 145–157. [Google Scholar] [CrossRef]
  23. Haque, M.R.; Islam, M.A.; Wahab, M.A.; Hoq, M.E.; Rahman, M.M.; Azim, M.E. Evaluation of production performance and profitability of hybrid red tilapia and genetically improved farmed tilapia (GIFT) strains in the carbon/nitrogen controlled periphyton-based (C/N-CP) on-farm prawn culture system in Bangladesh. Aquac. Rep. 2016, 4, 101–111. [Google Scholar] [CrossRef] [Green Version]
  24. Aly, H.; Abdel-Rahim, M.; Lotfy, A.; Abdelaty, B. Impact of different colors of artificial light on pigmentation and growth performance of hybrid Red Tilapia (Oreochromis mosambicus × O. hornorum) reared in saline well water. J. Mar. Sci. Res. Dev. 2017, 7, 229. [Google Scholar]
  25. Tayel, A.A.; Bahnasy, A.G.; Mazrou, K.E.; Alasmari, A.; El Rabey, H.A.; Elboghashy, S.A.; Diab, A.M. Biopreservation and quality enhancement of fish surimi using colorant plant extracts. J. Food Qual. 2021, 2021, 6624565. [Google Scholar] [CrossRef]
  26. Abd El-Kareem, M.S.; Rabbih, M.A.E.F.; Selim, E.T.M.; Elsherbiny, E.A.E.-m.; El-Khateeb, A.Y. Application of GC/EIMS in combination with semi-empirical calculations for identification and investigation of some volatile components in basil essential oil. Int. J. Anal. Mass Spectrom. Chromatogr. 2016, 4, 14–25. [Google Scholar] [CrossRef] [Green Version]
  27. Bancroft, J.; Layton, C. The hematoxylins and eosin. In Bancroft’s Theory and Practice of Histological Techniques; Elsevier: Amsterdam, The Netherlands, 2013; pp. 173–186. [Google Scholar]
  28. Al-Deriny, S.H.; Dawood, M.A.; Abou Zaid, A.A.; Wael, F.; Paray, B.A.; Van Doan, H.; Mohamed, R.A. The synergistic effects of Spirulina platensis and Bacillus amyloliquefaciens on the growth performance, intestinal histomorphology, and immune response of Nile tilapia (Oreochromis niloticus). Aquac. Rep. 2020, 17, 100390. [Google Scholar] [CrossRef]
  29. Feldman, B.; Zinkl, J.; Jain, N. Schalm’s Veterinary Hematology; Lippincott Williams & Wilkins: Baltimore, PA, USA, 2000. [Google Scholar]
  30. Thrall, M.; Baker, D.; Lassen, E. Veterinary Haematology and Clinical Chemistry; Lippincott Williams & Wilkins: Baltimore, PA, USA, 2004. [Google Scholar]
  31. Doumas, B.T.; Bayse, D.D.; Carter, R.J.; Peters, T., Jr.; Schaffer, R. A candidate reference method for determination of total protein in serum. I. Development and validation. Clin. Chem. 1981, 27, 1642–1650. [Google Scholar] [CrossRef]
  32. Doumas, B.T.; Watson, W.A.; Biggs, H.G. Albumin standards and the measurement of serum albumin with bromcresol green. Clin. Chim. Acta 1971, 31, 87–96. [Google Scholar] [CrossRef]
  33. Reitman, S.; Frankel, S. A colorimetric method for the determination of serum glutamic oxalacetic and glutamic pyruvic transaminases. Am. J. Clin. Pathol. 1957, 28, 56–63. [Google Scholar] [CrossRef]
  34. Heinegård, D.; Tiderström, G. Determination of serum creatinine by a direct colorimetric method. Clin. Chim. Acta 1973, 43, 305–310. [Google Scholar] [CrossRef]
  35. Coulombe, J.; Favreau, L. A new simple semimicro method for colorimetric determination of urea. Clin. Chem. 1963, 9, 102–108. [Google Scholar] [CrossRef]
  36. Fynn-Aikins, K.; Hung, S.S.; Liu, W.; Li, H. Growth, lipogenesis and liver composition of juvenile white sturgeon fed different levels of D-glucose. Aquaculture 1992, 105, 61–72. [Google Scholar] [CrossRef]
  37. Abdel-Tawwab, M.; Samir, F.; Abd El-Naby, A.S.; Monier, M.N. Antioxidative and immunostimulatory effect of dietary cinnamon nanoparticles on the performance of Nile tilapia, Oreochromis niloticus (L.) and its susceptibility to hypoxia stress and Aeromonas hydrophila infection. Fish Shellfish Immunol. 2018, 74, 19–25. [Google Scholar] [CrossRef] [PubMed]
  38. Hao, K.; Ullah, H.; Jarwar, A.R.; Nong, X.; Tu, X.; Zhang, Z. Functional identification of an FMRFamide-related peptide gene on diapause induction of the migratory locust, Locusta migratoria L. Genomics 2020, 112, 1821–1828. [Google Scholar] [CrossRef]
  39. Kawahara, E.; Ueda, T.; Nomura, S. In vitro phagocytic activity of white-spotted char blood cells after injection with Aeromonas salmonicida extracellular products. Fish Pathol. 1991, 26, 213–214. [Google Scholar] [CrossRef]
  40. Demers, N.E.; Bayne, C.J. The immediate effects of stress on hormones and plasma lysozyme in rainbow trout. Dev. Comp. Immunol. 1997, 21, 363–373. [Google Scholar] [CrossRef]
  41. Torrissen, O.J.; Naevdal, G. Pigmentation of salmonids—Genetical variation in carotenoid deposition in rainbow trout. Aquaculture 1984, 38, 59–66. [Google Scholar] [CrossRef]
  42. Livak, K.J.; Schmittgen, T.D. Analysis of relative gene expression data using real-time quantitative PCR and the 2−ΔΔCT method. Methods 2001, 25, 402–408. [Google Scholar] [CrossRef]
  43. Qiang, J.; He, J.; Yang, H.; Wang, H.; Kpundeh, M.; Xu, P.; Zhu, Z. Temperature modulates hepatic carbohydrate metabolic enzyme activity and gene expression in juvenile GIFT tilapia (Oreochromis niloticus) fed a carbohydrate-enriched diet. J. Therm. Biol. 2014, 40, 25–31. [Google Scholar] [CrossRef]
  44. Tian, J.; Wu, F.; Yang, C.-G.; Jiang, M.; Liu, W.; Wen, H. Dietary lipid levels impact lipoprotein lipase, hormone-sensitive lipase, and fatty acid synthetase gene expression in three tissues of adult GIFT strain of Nile tilapia, Oreochromis niloticus. Fish Physiol. Biochem. 2015, 41, 1–18. [Google Scholar] [CrossRef]
  45. Elkatatny, N.A.; Elbialy, Z.I.; El-Nahas, A.F.; Mahmoud, S. Characterization of Myostatin Gene in Nile Tilapia (Oreochromis niloticus), the Possible Association of BsmI-exon 2 Polymorphism with Its Growth. Am. J. Life Sci. 2016, 4, 82–86. [Google Scholar] [CrossRef]
  46. Costa, L.S.; Rosa, P.V.; Fortes-Silva, R.; Sánchez-Vázquez, F.J.; López-Olmeda, J.F. Daily rhythms of the expression of genes from the somatotropic axis: The influence on tilapia (Oreochromis niloticus) of feeding and growth hormone administration at different times. Comp. Biochem. Physiol. Part C Toxicol. Pharmacol. 2016, 181, 27–34. [Google Scholar] [CrossRef]
  47. Aanyu, M.; Betancor, M.B.; Monroig, O. Effects of dietary limonene and thymol on the growth and nutritional physiology of Nile tilapia (Oreochromis niloticus). Aquaculture 2018, 488, 217–226. [Google Scholar] [CrossRef]
  48. Han, C.Y.; Zheng, Q.M.; Sun, Z.T. Gene expression and activities of antioxidant enzymes in liver of hybrid Tilapia, Oreochromis niloticus × Oreochromis aureus, under acute pH stress. J. World Aquac. Soc. 2016, 47, 260–267. [Google Scholar] [CrossRef]
  49. Qiang, J.; He, J.; Yang, H.; Xu, P.; Habte-Tsion, H.M.; Ma, X.; Zhu, Z. The changes in cortisol and expression of immune genes of GIFT tilapia Oreochromis niloticus (L.) at different rearing densities under Streptococcus iniae infection. Aquac. Int. 2016, 24, 1365–1378. [Google Scholar] [CrossRef]
  50. Salah, A.S.; El Nahas, A.F.; Mahmoud, S. Modulatory effect of different doses of β-1, 3/1, 6-glucan on the expression of antioxidant, inflammatory, stress and immune-related genes of Oreochromis niloticus challenged with Streptococcus iniae. Fish Shellfish Immunol. 2017, 70, 204–213. [Google Scholar] [CrossRef] [PubMed]
  51. Assefa, A.; Abunna, F. Maintenance of fish health in aquaculture: Review of epidemiological approaches for prevention and control of infectious disease of fish. Vet. Med. Int. 2018, 2018, 5432497. [Google Scholar] [CrossRef]
  52. Ahmadifar, E.; Pourmohammadi Fallah, H.; Yousefi, M.; Dawood, M.A.; Hoseinifar, S.H.; Adineh, H.; Yilmaz, S.; Paolucci, M.; Doan, H.V. The gene regulatory roles of herbal extracts on the growth, immune system, and reproduction of fish. Animals 2021, 11, 2167. [Google Scholar] [CrossRef]
  53. Amer, S.A.; Al-Khalaifah, H.S.; Gouda, A.; Osman, A.; Goda, N.I.; Mohammed, H.A.; Darwish, M.I.; Hassan, A.M.; Mohamed, S.K.A. Potential Effects of Anthocyanin-Rich Roselle (Hibiscus sabdariffa L.) Extract on the Growth, Intestinal Histomorphology, Blood Biochemical Parameters, and the Immune Status of Broiler Chickens. Antioxidants 2022, 11, 544. [Google Scholar] [CrossRef]
  54. Adewole, A. Organosomatic indices and histopathological response of Clarias gariepinus fed Roselle (Hibiscus sabdariffa) meal diets. Niger. J. Anim. Prod. 2018, 45, 199–206. [Google Scholar] [CrossRef]
  55. Van Hai, N.; Fotedar, R. Comparison of the effects of the prebiotics (Bio-Mos® and β-1, 3-D-glucan) and the customised probiotics (Pseudomonas synxantha and P. aeruginosa) on the culture of juvenile western king prawns (Penaeus latisulcatus Kishinouye, 1896). Aquaculture 2009, 289, 310–316. [Google Scholar] [CrossRef]
  56. Imran, S.M.; Ali, A.H.; Najim, S.M. Effect of Dietary Prebiotic Safmannan and Bio-antibiotic Fluconazole on some Growth and Haemato-immunological Parameters of Common Carp Cyprinus carpio Linnaeus. Basrah J. Agric. Sci. 2019, 32, 176–192. [Google Scholar] [CrossRef]
  57. Makarewicz, M.; Drożdż, I.; Tarko, T.; Duda-Chodak, A. The Interactions between polyphenols and microorganisms, especially gut microbiota. Antioxidants 2021, 10, 188. [Google Scholar] [CrossRef]
  58. Naiel, M.A.; Alagawany, M.; Patra, A.K.; El-Kholy, A.I.; Amer, M.S.; Abd El-Hack, M.E. Beneficial impacts and health benefits of macroalgae phenolic molecules on fish production. Aquaculture 2021, 534, 736186. [Google Scholar] [CrossRef]
  59. Adewole, A.M. Effects of roselle as dietary additive on growth performance and production economy of Clarias gariepinus. J. Emerg. Trends Eng. Appl. Sci. 2014, 5, 1–8. [Google Scholar]
  60. Hoseini, S.M.; Hoseinifar, S.H.; Van Doan, H. Growth performance and hematological and antioxidant characteristics of rainbow trout, Oncorhynchus mykiss, fed diets supplemented with Roselle, Hibiscus sabdariffa. Aquaculture 2021, 530, 735827. [Google Scholar] [CrossRef]
  61. Akbary, P.; Aminikhoei, Z. Effect of water-soluble polysaccharide extract from the green alga Ulva rigida on growth performance, antioxidant enzyme activity, and immune stimulation of grey mullet Mugil cephalus. J. Appl. Phycol. 2018, 30, 1345–1353. [Google Scholar] [CrossRef]
  62. Elsabagh, M.; Mohamed, R.; Moustafa, E.M.; Hamza, A.; Farrag, F.; Decamp, O.; Dawood, M.A.; Eltholth, M. Assessing the impact of Bacillus strains mixture probiotic on water quality, growth performance, blood profile and intestinal morphology of Nile tilapia, Oreochromis niloticus. Aquac. Nutr. 2018, 24, 1613–1622. [Google Scholar] [CrossRef]
  63. Lauriano, E.; Pergolizzi, S.; Capillo, G.; Kuciel, M.; Alesci, A.; Faggio, C. Immunohistochemical characterization of Toll-like receptor 2 in gut epithelial cells and macrophages of goldfish Carassius auratus fed with a high-cholesterol diet. Fish Shellfish Immunol. 2016, 59, 250–255. [Google Scholar] [CrossRef]
  64. Banan Khojasteh, S.M. The morphology of the post-gastric alimentary canal in teleost fishes: A brief review. Int. J. Aquat. Sci. 2012, 3, 71–88. [Google Scholar]
  65. Dan, T.M.; Shakib, A. Jus hibiscus bukan sekadar minuman biasa [Malaysia]. Dewan Ekon. 1995, 2, 12–13. [Google Scholar]
  66. Kamboh, A.; Arain, M.A.; Mughal, M.J.; Zaman, A.; Arain, Z.; Soomro, A. Flavonoids: Health promoting phytochemicals for animal production-a review. J. Anim. Health Prod 2015, 3, 6–13. [Google Scholar] [CrossRef] [Green Version]
  67. Adel, M.; Yeganeh, S.; Dadar, M.; Sakai, M.; Dawood, M.A. Effects of dietary Spirulina platensis on growth performance, humoral and mucosal immune responses and disease resistance in juvenile great sturgeon (Huso huso Linnaeus, 1754). Fish Shellfish Immunol. 2016, 56, 436–444. [Google Scholar] [CrossRef]
  68. Carbone, D.; Faggio, C. Importance of prebiotics in aquaculture as immunostimulants. Effects on immune system of Sparus aurata and Dicentrarchus labrax. Fish Shellfish Immunol. 2016, 54, 172–178. [Google Scholar] [CrossRef]
  69. Ogueji, E.; Iheanacho, S.; Dada, A.; Yaji, A.; Ifejimalu, A.; Ibrahim, B.; Mbah, E.; Okafor, E.; Nnatuanya, I. Effect of Roselle (Hibiscus sabdariffa) and ginger (Zingiber officinale) as feed additives, on growth and haematology of Clarias gariepinus Juvenile. Afr. J. Biotechnol. 2017, 16, 2242–2247. [Google Scholar] [CrossRef] [Green Version]
  70. Lie, Ø.; Syed, M.; Solbu, H. Improved agar plate assays of bovine lysozyme and haemolytic complement activity. Acta Vet. Scand. 1986, 27, 23–32. [Google Scholar] [CrossRef] [PubMed]
  71. Asaniyan, E.; Akinduro, V. Haematology and serum biochemistry of broiler chickens offered extracts of dried roselle plant (Hibiscus sabdariffa) calyx in drinking water. Ife J. Sci. 2020, 22, 149–157. [Google Scholar] [CrossRef]
  72. Yahaya, T.; Okpuzor, J.; Ajayi, T. The prophylactic efficacy of roselle [H. sabdariffa], moringa [Moringa oleifera], ginger [Z. officinale] and ugwu [T. occidentalis] on the hematology and serum protein of albino rats [Rattus norvegicus] exposed to cement dust. Res. J. Med. Plant 2012, 6, 189–196. [Google Scholar] [CrossRef] [Green Version]
  73. Sewaka, M.; Trullas, C.; Chotiko, A.; Rodkhum, C.; Chansue, N.; Boonanuntanasarn, S.; Pirarat, N. Efficacy of synbiotic Jerusalem artichoke and Lactobacillus rhamnosus GG-supplemented diets on growth performance, serum biochemical parameters, intestinal morphology, immune parameters and protection against Aeromonas veronii in juvenile red tilapia (Oreochromis spp.). Fish Shellfish Immunol. 2019, 86, 260–268. [Google Scholar]
  74. Ugwu, D.; Jiwuba, P.; Ubogu, V.; Akazue, R. Phytochemical properties of Hibiscus sabdariffa Calyx and the effects of its aqueous extract supplementation on haematological and serum biochemical indices of broiler birds. Niger. J. Anim. Sci. 2020, 22, 165–172. [Google Scholar]
  75. Iheanacho, S.; Ogueji, E.; Yaji, A.; Dada, O.; Mbah, C.; Ifejimalu, A.; Ibrahim, B.-U. Effects of herbal plants (Zingiber officinale and Hibiscus sabdariffa) as dietary additives on serum biochemistry and some metabolites in Clarias gariepinus (Burchell, 1822). J. Coast. Life Med. 2017, 5, 516–520. [Google Scholar] [CrossRef]
  76. Halliwell, B.; Clement, M.V.; Long, L.H. Hydrogen peroxide in the human body. FEBS Lett. 2000, 486, 10–13. [Google Scholar] [CrossRef] [PubMed] [Green Version]
  77. Lin, H.-H.; Chen, J.-H.; Wang, C.-J. Chemopreventive properties and molecular mechanisms of the bioactive compounds in Hibiscus sabdariffa Linne. Curr. Med. Chem. 2011, 18, 1245–1254. [Google Scholar] [CrossRef]
  78. Li, X.; Cui, K.; Fang, W.; Chen, Q.; Xu, D.; Mai, K.; Zhang, Y.; Ai, Q. High level of dietary olive oil decreased growth, increased liver lipid deposition and induced inflammation by activating the p38 MAPK and JNK pathways in large yellow croaker (Larimichthys crocea). Fish Shellfish Immunol. 2019, 94, 157–165. [Google Scholar] [CrossRef] [PubMed]
  79. Glass, C.K.; Witztum, J.L. Atherosclerosis: The road ahead. Cell 2001, 104, 503–516. [Google Scholar] [CrossRef] [PubMed] [Green Version]
  80. Ajeniyi, S.; Solomon, R. Urea and creatinine of Clarias gariepinus in three different commercial ponds. Nat. Sci. 2014, 12, 124–138. [Google Scholar]
  81. Dacie, J.V.; Lewis, S.M. Practical Haematology; Churchill Livingstone: London, UK, 1995; p. 609. [Google Scholar]
  82. Bilen, S.; Filogh, A.M.; Ali, A.B.; Kenanoğlu, O.N.; Zoral, M.A. Effect of common mallow (Malva sylvestris) dietary supplementation on growth performance, digestive enzyme activities, haemotological and immune responses of common carp (Cyprinus carpio). Aquac. Int. 2020, 28, 73–84. [Google Scholar] [CrossRef]
  83. Xu, A.; Shang-Guan, J.; Li, Z.; Gao, Z.; Huang, Y.C.; Chen, Q. Effects of dietary Chinese herbal medicines mixture on feeding attraction activity, growth performance, nonspecific immunity and digestive enzyme activity of Japanese seabass (Lateolabrax japonicus). Aquac. Rep. 2020, 17, 100304. [Google Scholar] [CrossRef]
  84. Ghiasi, F.; Mirzargar, S.; Badakhshan, H.; Shamsi, S. Lysozyme in Serum, Leukocyte Count and Phagocytic Index in Cyprinus carpio under the Wintering Conditions. J. Fish. Aquat. Sci. 2010, 5, 113–119. [Google Scholar]
  85. Khanjani, M.H.; Ghaedi, G.; Sharifinia, M. Effects of diets containing β-glucan on survival, growth performance, haematological, immunity and biochemical parameters of rainbow trout (Oncorhynchus mykiss) fingerlings. Aquac. Res. 2022, 53, 1842–1850. [Google Scholar] [CrossRef]
  86. Coulter, A.; Lombardini, J.; Sufrin, J.R.; Talalay, P. Structural and Conformational Analogues of L-Methionine as Inhibitors of the Enzymatic Synthesis of S-Adenosyl-L-methionine: III. Carbocyclic and Heterocyclic Amino Acids. Mol. Pharmacol. 1974, 10, 319–334. [Google Scholar]
  87. Mahfudh, N.; Hadi, A.; Solechan, R. Immunomodulatory activity of yogurt fortified with roselle (Hibiscus sabdariffa L.) extract. Int. Food Res. J. 2021, 28, 255–261. [Google Scholar] [CrossRef]
  88. Hirunpanich, V.; Utaipat, A.; Morales, N.P.; Bunyapraphatsara, N.; Sato, H.; Herunsale, A.; Suthisisang, C. Hypocholesterolemic and antioxidant effects of aqueous extracts from the dried calyx of Hibiscus sabdariffa L. in hypercholesterolemic rats. J. Ethnopharmacol. 2006, 103, 252–260. [Google Scholar] [CrossRef] [PubMed]
  89. Aphirakchatsakun, W.; Angkanaporn, K.; Kijparkorn, S. The Effect of Roselle (Hibicus sabdariffa Linn.) Calyx as antioxidant and acidifier on growth performance in postweaning pigs. Asian-Australas. J. Anim. Sci. 2008, 21, 574–581. [Google Scholar] [CrossRef]
  90. Yin, G.; Cao, L.; Xu, P.; Jeney, G.; Nakao, M.; Lu, C. Hepatoprotective and antioxidant effects of Glycyrrhiza glabra extract against carbon tetrachloride (CCl4)-induced hepatocyte damage in common carp (Cyprinus carpio). Fish Physiol. Biochem. 2011, 37, 209–216. [Google Scholar] [CrossRef]
  91. Gomaa, M.; Hifney, A.F.; Fawzy, M.A.; Abdel-Gawad, K.M. Use of seaweed and filamentous fungus derived polysaccharides in the development of alginate-chitosan edible films containing fucoidan: Study of moisture sorption, polyphenol release and antioxidant properties. Food Hydrocoll. 2018, 82, 239–247. [Google Scholar] [CrossRef]
  92. Hoseini, S.M.; Mirghaed, A.T.; Iri, Y.; Ghelichpour, M. Effects of dietary cineole administration on growth performance, hematological and biochemical parameters of rainbow trout (Oncorhynchus mykiss). Aquaculture 2018, 495, 766–772. [Google Scholar] [CrossRef]
  93. Wang, Y.-J.; Chien, Y.-H.; Pan, C.-H. Effects of dietary supplementation of carotenoids on survival, growth, pigmentation, and antioxidant capacity of characins, Hyphessobrycon callistus. Aquaculture 2006, 261, 641–648. [Google Scholar] [CrossRef]
  94. Bendich, A.; Olson, J.A. Biological actions of carotenoids 1. FASEB J. 1989, 3, 1927–1932. [Google Scholar] [CrossRef]
  95. Christiansen, R.; Glette, J.; Lie, Ø.; Torrissen, O.; Waagbø, R. Antioxidant status and immunity in Atlantic salmon, Salmo salar L., fed semi-purified diets with and without astaxanthin supplementation. J. Fish Dis. 1995, 18, 317–328. [Google Scholar] [CrossRef]
  96. Al-Sayed, H.M.; Hegab, S.A.; Youssef, M.A.; Khalafalla, M.Y.; Almaroai, Y.A.; Ding, Z.; Eissa, M.A. Evaluation of quality and growth of roselle (Hibiscus sabdariffa L.) as affected by bio-fertilizers. J. Plant Nutr. 2020, 43, 1025–1035. [Google Scholar] [CrossRef]
  97. Wong, P.K.; Yusof, S.; Ghazali, H.; Man, Y.C. Physico-chemical characteristics of roselle (Hibiscus sabdariffa L.). Nutr. Food Sci. 2002, 32, 68–73. [Google Scholar] [CrossRef]
  98. Hu, X.; Jandacek, R.J.; White, W.S. Intestinal absorption of β-carotene ingested with a meal rich in sunflower oil or beef tallow: Postprandial appearance in triacylglycerol-rich lipoproteins in women. Am. J. Clin. Nutr. 2000, 71, 1170–1180. [Google Scholar] [CrossRef] [Green Version]
  99. Zeb, A. Effects of β-carotene on the thermal oxidation of fatty acids. Afr. J. Biotechnol. 2011, 10, 15346–15352. [Google Scholar] [CrossRef] [Green Version]
  100. van het Hof, K.H.; West, C.E.; Weststrate, J.A.; Hautvast, J.G. Dietary factors that affect the bioavailability of carotenoids. J. Nutr. 2000, 130, 503–506. [Google Scholar] [CrossRef] [Green Version]
  101. Mitrofanova, O.; Dementeva, N.; Krutikova, A.; Yurchenko, O.; Vakhrameev, A.; Terletskiy, V. Association of polymorphic variants in MSTN, PRL, and DRD2 genes with intensity of young animal growth in Pushkin breed chickens. Cytol. Genet. 2017, 51, 179–184. [Google Scholar] [CrossRef]
  102. Elbialy, Z.I.; Salah, A.S.; Elsheshtawy, A.; Rizk, M.; Abualreesh, M.H.; Abdel-Daim, M.M.; Salem, S.M.R.; Askary, A.E.; Assar, D.H. Exploring the Multimodal Role of Yucca schidigera Extract in Protection against Chronic Ammonia Exposure Targeting: Growth, Metabolic, Stress and Inflammatory Responses in Nile Tilapia (Oreochromis niloticus L.). Animals 2021, 11, 2072. [Google Scholar] [CrossRef] [PubMed]
  103. Kang, J.-D.; Kim, S.; Zhu, H.-Y.; Jin, L.; Guo, Q.; Li, X.-C.; Zhang, Y.-C.; Xing, X.-X.; Xuan, M.-F.; Zhang, G.-L. Generation of cloned adult muscular pigs with myostatin gene mutation by genetic engineering. RSC Adv. 2017, 7, 12541–12549. [Google Scholar] [CrossRef] [Green Version]
  104. Lv, Q.; Yuan, L.; Deng, J.; Chen, M.; Wang, Y.; Zeng, J.; Li, Z.; Lai, L. Efficient generation of myostatin gene mutated rabbit by CRISPR/Cas9. Sci. Rep. 2016, 6, 25029. [Google Scholar] [CrossRef] [Green Version]
  105. Abdel-Latif, S.; El-Yamany, A.; Edaly, E.A. Evaluation of using different levels and sources of medicinal herbs in growing Japanese quail diets. Egypt. J. Nutr. Feed. 2004, 7, 69–81. [Google Scholar]
  106. Murray, R.; Granner, D.; Mayes, P.; Rodwell, V. The Text Book of Harper’s Biochemistry; Appleton and Large: Norwalk, CT, USA; Las Altos, CA, USA, 1991. [Google Scholar]
  107. Chamorro, S.; Viveros, A.; Centeno, C.; Romero, C.; Arija, I.; Brenes, A. Effects of dietary grape seed extract on growth performance, amino acid digestibility and plasma lipids and mineral content in broiler chicks. Animal 2013, 7, 555–561. [Google Scholar] [CrossRef] [Green Version]
  108. Brenes, A.; Montoro, A.V.; Cambrodón, I.G.; Centeno, C.; Calixto, F.S.; Arija, I. Effect grape seed extract on growth performance, protein and polyphenol digestibilities, and antioxidant activity in chickens. Span. J. Agric. Res. 2010, 8, 326–333. [Google Scholar] [CrossRef] [Green Version]
  109. Lopez-Huertas, E. Health effects of oleic acid and long chain omega-3 fatty acids (EPA and DHA) enriched milks. A review of intervention studies. Pharmacol. Res. 2010, 61, 200–207. [Google Scholar] [CrossRef] [PubMed]
  110. Vraskou, Y.; Roher, N.; Díaz, M.; Antonescu, C.N.; MacKenzie, S.A.; Planas, J.V. Direct involvement of tumor necrosis factor-α in the regulation of glucose uptake in rainbow trout muscle cells. Am. J. Physiol. Regul. Integr. Comp. Physiol. 2011, 300, R716–R723. [Google Scholar] [CrossRef] [Green Version]
  111. Elbahnaswy, S.; Elshopakey, G.E. Differential gene expression and immune response of Nile tilapia (Oreochromis niloticus) challenged intraperitoneally with Photobacterium damselae and Aeromonas hydrophila demonstrating immunosuppression. Aquaculture 2020, 526, 735364. [Google Scholar] [CrossRef]
  112. Tavaria, M.; Gabriele, T.; Kola, I.; Anderson, R.L. A hitchhiker’s guide to the human Hsp70 family. Cell Stress Chaperones 1996, 1, 23. [Google Scholar] [CrossRef] [PubMed]
  113. Morano, K.A. New tricks for an old dog: The evolving world of Hsp70. Ann. N. Y. Acad. Sci. 2007, 1113, 1–14. [Google Scholar] [CrossRef]
  114. Ečimović, S.; Velki, M.; Vuković, R.; Čamagajevac, I.Š.; Petek, A.; Bošnjaković, R.; Grgić, M.; Engelmann, P.; Bodó, K.; Filipović-Marijić, V. Acute toxicity of selenate and selenite and their impacts on oxidative status, efflux pump activity, cellular and genetic parameters in earthworm Eisenia andrei. Chemosphere 2018, 212, 307–318. [Google Scholar] [CrossRef]
  115. Hassaan, M.S.; Mohammady, E.Y.; Soaudy, M.R.; Sabae, S.A.; Mahmoud, A.M.; El-Haroun, E.R. Comparative study on the effect of dietary β-carotene and phycocyanin extracted from Spirulina platensis on immune-oxidative stress biomarkers, genes expression and intestinal enzymes, serum biochemical in Nile tilapia, Oreochromis niloticus. Fish Shellfish Immunol. 2021, 108, 63–72. [Google Scholar] [CrossRef]
  116. Hoseinifar, S.H.; Yousefi, S.; Capillo, G.; Paknejad, H.; Khalili, M.; Tabarraei, A.; Van Doan, H.; Spanò, N.; Faggio, C. Mucosal immune parameters, immune and antioxidant defence related genes expression and growth performance of zebrafish (Danio rerio) fed on Gracilaria gracilis powder. Fish Shellfish Immunol. 2018, 83, 232–237. [Google Scholar] [CrossRef]
  117. Hussain, T.; Tan, B.; Yin, Y.; Blachier, F.; Tossou, M.C.; Rahu, N. Oxidative stress and inflammation: What polyphenols can do for us? Oxidative Med. Cell. Longev. 2016, 2016, 7432797. [Google Scholar] [CrossRef] [Green Version]
  118. Ren, X.; Liu, W.; Liu, Y. Effects of fluconazole on the clinical outcome and immune response in fungal co-infected tuberculosis patients. Microb. Pathog. 2018, 117, 148–152. [Google Scholar] [CrossRef]
  119. Damon, M.; Louveau, I.; Lefaucheur, L.; Lebret, B.; Vincent, A.; Leroy, P.; Sanchez, M.P.; Herpin, P.; Gondret, F. Number of intramuscular adipocytes and fatty acid binding protein-4 content are significant indicators of intramuscular fat level in crossbred Large White× Duroc pigs. J. Anim. Sci. 2006, 84, 1083–1092. [Google Scholar] [CrossRef]
  120. Mobbs, C.V.; Makimura, H. Block the FAS, lose the fat. Nat. Med. 2002, 8, 335–336. [Google Scholar] [CrossRef]
  121. Albalat, A.; Saera-Vila, A.; Capilla, E.; Gutiérrez, J.; Pérez-Sánchez, J.; Navarro, I. Insulin regulation of lipoprotein lipase (LPL) activity and expression in gilthead sea bream (Sparus aurata). Comp. Biochem. Physiol. Part B Biochem. Mol. Biol. 2007, 148, 151–159. [Google Scholar] [CrossRef] [PubMed]
  122. Carroll, R.G.; Zasłona, Z.; Galván-Peña, S.; Koppe, E.L.; Sévin, D.C.; Angiari, S.; Triantafilou, M.; Triantafilou, K.; Modis, L.K.; O’Neill, L.A. An unexpected link between fatty acid synthase and cholesterol synthesis in proinflammatory macrophage activation. J. Biol. Chem. 2018, 293, 5509–5521. [Google Scholar] [CrossRef] [Green Version]
  123. Vijayakumar, A.; Novosyadlyy, R.; Wu, Y.; Yakar, S.; LeRoith, D. Biological effects of growth hormone on carbohydrate and lipid metabolism. Growth Horm. IGF Res. 2010, 20, 1–7. [Google Scholar] [CrossRef] [PubMed] [Green Version]
  124. Mohamed, R.A.; Elbialy, Z.I.; Abd El Latif, A.S.; Shukry, M.; Assar, D.H.; El Nokrashy, A.M.; Elsheshtawy, A.; Dawood, M.A.; Paray, B.A.; Van Doan, H. Dietary clenbuterol modifies the expression of genes involved in the regulation of lipid metabolism and growth in the liver, skeletal muscle, and adipose tissue of Nile tilapia (Oreochromis niloticus). Aquac. Rep. 2020, 17, 100319. [Google Scholar] [CrossRef]
  125. Kim-Kang, H.; Bova, A.; Crouch, L.S.; Wislocki, P.G.; Robinson, R.A.; Wu, J. Tissue distribution, metabolism, and residue depletion study in Atlantic salmon following oral administration of [3H] emamectin benzoate. J. Agric. Food Chem. 2004, 52, 2108–2118. [Google Scholar] [CrossRef]
  126. Peng, M.; Xu, W.; Mai, K.; Zhou, H.; Zhang, Y.; Liufu, Z.; Zhang, K.; Ai, Q. Growth performance, lipid deposition and hepatic lipid metabolism related gene expression in juvenile turbot (Scophthalmus maximus L.) fed diets with various fish oil substitution levels by soybean oil. Aquaculture 2014, 433, 442–449. [Google Scholar] [CrossRef]
  127. Alvarez, M.; Diez, A.; Lopez-Bote, C.; Gallego, M.; Bautista, J. Short-term modulation of lipogenesis by macronutrients in rainbow trout (Oncorhynchus mykiss) hepatocytes. Br. J. Nutr. 2000, 84, 619–628. [Google Scholar] [CrossRef] [Green Version]
  128. Peng, S.; Shi, Z.; Gao, Q.; Zhang, C.; Wang, J. Dietary n-3 LC-PUFA s affect lipoprotein lipase (LPL) and fatty acid synthase (FAS) activities and mRNA expression during vitellogenesis and ovarian fatty acid composition of female silver pomfret (Pampus argenteus) broodstock. Aquac. Nutr. 2017, 23, 692–701. [Google Scholar] [CrossRef]
  129. Kim, H.-K.; Choi, S.; Choi, H. Suppression of hepatic fatty acid synthase by feeding α-linolenic acid rich perilla oil lowers plasma triacylglycerol level in rats. J. Nutr. Biochem. 2004, 15, 485–492. [Google Scholar] [CrossRef] [PubMed]
  130. Richard, N.; Mourente, G.; Kaushik, S.; Corraze, G. Replacement of a large portion of fish oil by vegetable oils does not affect lipogenesis, lipid transport and tissue lipid uptake in European seabass (Dicentrarchus labrax L.). Aquaculture 2006, 261, 1077–1087. [Google Scholar] [CrossRef]
  131. Richard, N.; Kaushik, S.; Larroquet, L.; Panserat, S.; Corraze, G. Replacing dietary fish oil by vegetable oils has little effect on lipogenesis, lipid transport and tissue lipid uptake in rainbow trout (Oncorhynchus mykiss). Br. J. Nutr. 2006, 96, 299–309. [Google Scholar] [CrossRef] [Green Version]
  132. Hudgins, L.C.; Baday, A.; Hellerstein, M.K.; Parker, T.S.; Levine, D.M.; Seidman, C.E.; Neese, R.A.; Tremaroli, J.D.; Hirsch, J. The effect of dietary carbohydrate on genes for fatty acid synthase and inflammatory cytokines in adipose tissues from lean and obese subjects. J. Nutr. Biochem. 2008, 19, 237–245. [Google Scholar] [CrossRef] [Green Version]
  133. Wang, A.; Han, G.; Qi, Z.; Lv, F.; Yu, Y.; Huang, J.; Wang, T.; Xu, P. Cloning of lipoprotein lipase (LPL) and the effects of dietary lipid levels on LPL expression in GIFT tilapia (Oreochromis niloticus). Aquac. Int. 2013, 21, 1219–1232. [Google Scholar] [CrossRef]
Figure 1. GC-GC-MS spectrum of Roselle ethanolic extract. Three major peaks were identified: a cyclopentane carboxylic acid peak at 6.92 min, an ethyl palmitate peak at 21.72 min, and a linoleic acid peak at 24.35 min.
Fishes 08 00172 g001
Figure 2. Photomicrographs of Red tilapia intestines fed different dietary levels of ER. (a) anterior part: scale bar is 100 μm; (b) middle part: scale bar is 100 μm; and (c) terminal part: scale bar is 100 μm. (d) Intestinal villi length. Means with different letters are significantly different (p < 0.05).
Fishes 08 00172 g002
Figure 3. Antioxidant enzyme activity (a) SOD, and (b) catalase of red tilapia fed different dietary levels of ER. Values are expressed as mean ± SE from triplicate groups with p values of one-way ANOVA followed Tukey’s post hoc test for significant differences. p < 0.01 (**), p < 0.001 (***), and p < 0.0001 (****) between different groups.
Fishes 08 00172 g003
Figure 4. Total carotene in skin and muscle of Red tilapia fed on different experimental diets. Values are expressed as mean ± SE from triplicate groups. p values of one-way ANOVA followed by Tukey’s post hoc test for significant differences. p < 0.05 (*), and p < 0.001 (***), between different groups.
Fishes 08 00172 g004
Figure 5. Gene expression profiles of ILGF-1 (a), GHr (b), and MSTN (c) in Red tilapia exposed to varying doses of ER in their diets. Asterisks on the data bars indicate statistically significant deviations when comparing the experimental and control groups. Values are expressed as mean ± SE from triplicate groups. p values of one-way ANOVA followed Tukey’s post hoc test for significant differences. p < 0.05 (*), p < 0.01 (**), p < 0.001 (***), and p < 0.0001 (****).
Fishes 08 00172 g005
Figure 6. The relative expression profile of SOD (a), TNF-α (b), and HSP70 (c) genes of Red tilapia fed different dietary levels of ER. Values are expressed as mean ± SE from triplicate groups. p values of one-way ANOVA followed Tukey’s post hoc test for significant differences. p < 0.05 (*), p < 0.01 (**), and p < 0.001 (***) between different treated groups.
Fishes 08 00172 g006
Figure 7. The relative expression profile of fatty acid synthase (FAS) (a) and lipoprotein lipase (LPL) (b) genes of Red tilapia fed different dietary levels of ER. Values are expressed as mean ± SE from triplicate groups. p values of one-way ANOVA followed by Tukey’s post hoc test for significant differences between the experimental groups and their control are indicated by asterisks on the data bars when p < 0.05 (*), p < 0.01 (**), and p < 0.001 (***).
Fishes 08 00172 g007
Table 1. Chemical composition of the diets.
ER Dietary Level (%)
ER0ER0.5ER1ER2
Feed Ingredients (%)
Fish meal (72% CP)2.52.52.52.5
Soybean meal41414141
Yellow corn19191919
Wheat middling12121212
Rice bran10101010
Gluten 605555
Linseed meal3.63.63.63.6
Meat meal4444
Choline chloride0.10.10.10.1
Soya oil1111
Calcium carbonate0.60.60.60.6
Sod. Bicarbonate0.10.10.10.1
Lysine0.50.50.50.5
Methionine0.30.30.30.3
Vitam. and min. mix.10.10.10.10.1
Anti-mycosis0.10.10.10.1
Vit. C0.10.10.10.1
Dietary ER (g/kg)00.512
Proximate composition
Dry matter (%)88.8488.6588.9389.02
Crude protein (%)30.8730.9430.6430.20
Ether extract (%)6.386.817.587.34
Crude fiber (%)5.186.015.905.67
Ash (%)6.169.288.969.18
NFE (%)51.4146.9646.9247.61
Growth energy2 (kcal/kg)4516.564373.364427.494409.07
Each kilogram contained the following amounts of vitamins and minerals: vitamin A (4.8 IU), vitamin D2 (0.8 IU), vitamin E (4.0 g), vitamin K (0.8 g), vitamin B (0.49), vitamin B2 (1.6 g), vitamin B6 (0.6 g), vitamin B12 (4 mg), folic acid (400 mg), biotin (20 mg), choline chloride (200 mg), copper (4.0 g), iodine (0.4 g), and iron (12 mg). Manga 2 Protein yielded 5.65 Kcal, fat 9.45 Kcal, and carbohydrates 4.22 Kcal per gram when used in the growth energy equation. Nitrogen free extract (NFE) = 100 − (protein + lipid + ash + fiber) [8].
Table 2. Gene primer used for qRT-PCR amplification.
No.GenePrimer Sequence (5’-3’)Accession NumberReference
1β-actinF: CCACACAGTGCCCATCTACGA
R: CCACGCTCTGTCAGGATCTTCA
XM_003455949.2[43]
2FASF: TGAAACTGAAGCCTTGTGTGCC
R: TCCCTGTGAGCGGAGGTGATTA
GU433188[44]
3LPLF: TGCTAATGTGATTGTGGTGGAC
R: GCTGATTTTGTGGTTGGTAAGG
FJ623077[44]
4MSTNF: GCATCTGTCTCAGATCGTGCT
R: TGCCATCATTACAATTGTCTCCG
XM_003458832[45]
5IGF-1F: TCCTGTAGCCACACCCTCTC
R: ACAGCTTTGGAAGCAGCACT
XM_00344805[46]
6GHR-1F: CAGACTTCTACGCTCAGGTC
R: CTGGATTCTGAGTTGCTGTC
AY973232.1[47]
7SODF: CCACGCTCTGTCAGGATCTTCA
R: CATGCCTTCGGAGACAACAC
AY491056.1[48]
8TNF-αF: ACCTTCTCGTGGATCACCAT
R: GGAAGCAGCTCCACTCTGATGA
JF957373.1[49]
9HSP-70F: CATCGCCTACGGTCTGGACAA
R: TGCCGTCTTCAATGGTCAGGAT
FJ207463.1[49]
FAS, fatty acid synthase. LPL, lipoprotein lipase. MSTN, myostatin. IGF-1, insulin growth factor -1. GHR-1, growth hormone receptor-1. SOD, superoxide dismutase. TNF-α, tumor necrosis factor-alpha. HSP-70, heat shock protein-70.
Table 3. GC-MS-MS profile of Roselle ethyl extract.
n.Post-Derivatization Component NamingMolecular FormulaRt (min)Molecular Weight (m/z) Peak Area (%)Prior to Derivatization Compound Name
1Cyclopentane carboxylic acid, 2-oxo-, ethyl esterC8H12O36.9115621.82Cyclopentane carboxylic acids
2Hexadecanoic acid, ethyl esterC18H36O221.7228418.35Ethyl palmitate
39,12-Octadecadienoic acid (Z,Z)-C18H32O224.3528016.51Linoleic acid
49,12-Octadecadienoic acid, ethyl esterC20H36O224.2630814.10Linolelaidic acid
5Cyclohexane carboxylic acid, 2-ethylcyclohexyl esterC15H26O28.6023811.83Cyclohexane carboxylic acid
62-(2,4-difluorophenyl)-1,3-bis(1,2,4-triazol-1-yl)propan-2-olC13H12F2N6O16.843064.93Fluconazole
7Butanedioic acid, 3-hydroxy-2,2-dimethyl-, diethyl esterC10H18O516.842184.93Succinic acid
89,12-Octadecadienoyl chloride, (Z,Z)-C18H31ClO23.352983.06Linoleic acid chloride
94,6-O-Ethylidene-D-glucopyranoseC8H14O617.87206.190.97Glycopyranoside
108-Benzoyloxy quinolineC16H11NO217.872490.97Benzoxyquinone
Table 4. Growth parameters and survival of Red tilapia fed various dietary levels of ER.
ParametersER Dietary Level (%)p-Value
ER0ER0.5ER1ER2
Initial weight (g)4.850 ± 0.0174.817 ± 0.0494.783 ± 0.0834.883 ± 0.0170.556
Final weight (g)33.67 ± 0.333 a33.67 ± 0.333 a34.67 ± 0.166 a31.20 ± 0.057 b<0.0001
Weight gain (g)28.82 ± 0.317 a28.85 ± 0.356 a29.88 ± 0.249 a26.32 ± 0.055 b<0.0001
Weight gain rate (%)594.1 ± 4.631 a599.2 ± 11.96 a625.3 ± 16.35 a538.9 ± 2.289 b0.002
SGR (%/day)3.229 ± 0.011 a3.241 ± 0.028 a3.302 ± 0.037 a3.091 ± 0.005 b0.001
FCR1.430 ± 0.022 a1.286 ± 0.014 b1.156 ± 0.001 c1.330 ± 0.002 b<0.0001
HSI (%)2.579 ± 0.253 a,b2.406 ± 0.024 a,b1.817 ± 0.008 b2.798 ± 0.244 a0.022
VSI (%)2.487 ± 0.21502.704 ± 0.027042.654 ± 0.025152.788 ± 0.18820.540
SSI (%)0.584 ± 0.0170.484 ± 0.0520.458 ± 0.0770.371 ± 0.0380.100
Survival (%)95.56 ± 2.222100.0 ± 0.000100.0 ± 0.000100.0 ± 0.0000.051
Data are presented as mean ± SE. p values of one-way ANOVA followed Tukey’s post hoc test for significant differences. The means that share no superscripts (a,b,c) within each row are significantly different at p < 0.05. SGR: specific growth rate, FCR: feed conversion ratio, HSI: hepato-somatic index, VSI: visceral-somatic index, SSI: spleen-somatic index.
Table 5. Analysis of the intestinal morphology of Red tilapia exposed to varying levels of ER in their diets.
Intestinal SegmentVariableER Dietary Level (%)p Values
ER0ER0.5ER1ER2
Anterior partVilli length (μm)153.2 ± 14.110 b205.2 ± 17.140 b531.3 ± 16.550 a471.4 ± 18.940 a<0.0001
Villi width (μm)92.28 ± 5.64079.61 ± 5.97876.64 ± 5.94780.19 ± 10.1100.469
Goblet cell (no/mm2)20.67 ± 1.453 b27.67 ± 2.404 a,b33.00 ± 1.732 a28.33 ± 0.881 a,b0.006
Middle partVilli length (μm)319.20 ± 11.10 d464.0 ± 29.860 c815.9 ± 32.250 a683.0 ± 14.260 b<0.0001
Villi width (μm)64.22 ± 4.77269.96 ± 7.69483.16 ± 6.25277.69 ± 6.0200.229
Goblet cell (no/mm2)30.00 ± 1.732 c36.00 ± 1.155 b,c51.33 ± 4.631 a48.33 ± 2.028 a,b0.001
Terminal partVilli length (μm)79.63 ± 0.910 c123.2 ± 4.300 c380.3 ± 24.180 a290.3 ± 16.920 b<0.0001
Villi width (μm)120.6 ± 10.520104.7 ± 6.425132.6 ± 25.440123.5 ± 20.8800.731
Goblet cell (no/mm2)8.0 ± 0.577 b12.33 ± 1.856 b20.33 ± 1.453 a23.33 ± 1.453 a0.0002
Data are presented as mean ± SE. p values of one-way ANOVA followed by Tukey’s post hoc test for significant differences. Means within each row that do not have common superscripts (a,b,c) differ significantly at p < 0.05.
Table 6. Haemato-biochemical profile of Red tilapia fed different dietary levels of ER.
ER Dietary Level (%)p-Value
ER0ER0.5ER1ER2
PCV (%)24.05 ± 0.54825.45 ± 2.91623.90 ± 1.79022.20 ± 0.9230.661
RBCs (×10/mm3)1.985 ± 0.0491.975 ± 0.0891.975 ± 0.0891.850 ± 0.0280.500
Hb (g/100 mL)8.450 ± 0.0289.550 ± 0.8948.750 ± 0.3758.650 ± 0.0280.445
TP (g/dL)6.350 ± 0.721 a7.450 ± 0.548 a2.900 ± 0.115 b2.650 ± 0.490 b0.0003
Albumin (g/dL)3.650 ± 0.664 a3.200 ± 0.808 a,b1.500 ± 0.173 a,b0.850 ± 0.028 b0.016
ALT (U/L)87.50 ± 7.217 a13.50 ± 0.866 b29.50 ± 1.443 b75.00 ± 14.430 a0.0005
AST (U/L)283.0 ± 52.540 a,b73.00 ± 9.815 c186.0 ± 8.083 b,c389.0 ± 69.860 a0.005
Creatinine (mg/dL)0.320 ± 0.103 b0.110 ± 0.017 b0.400 ± 0.057 b2.150 ± 0.606 a0.005
Urea (mg/dL)21.50 ± 0.866 a9.200 ± 0.173 b15.40 ± 3.522 a,b22.85 ± 2.800 a0.010
Cholesterol (mg/dL)279.5 ± 86.310 a53.50 ± 4.907 b110.0 ± 5.774 a,b255.0 ± 2.887 a0.015
Triglycerides (mg/dL)127.0 ± 9.815217.0 ± 1.732259.0 ± 99.880347.5 ± 153.90.443
Glucose (mg/dL)83.50 ± 26.85088.00 ± 36.95044.00 ± 6.92833.50 ± 2.5980.307
Amylase (U/L)41.60 ± 4.850 b82.05 ± 2.281 a72.00 ± 4.041 a24.45 ± 4.705 b<0.0001
Lipase (U/L)91.00 ± 2.887 a118.0 ± 12.120 a89.00 ± 0.577 a38.00 ± 4.041 b0.0002
Data are presented as mean ± SE. p values of one-way ANOVA followed by Tukey’s post hoc test for significant differences. Means within each row without shared superscripts (a,b,c) are significantly different at p < 0.05.
Table 7. The immune response of Red tilapia fed different dietary levels of ER.
ER Dietary Level (%)p-Value
ER0ER0.5ER1ER2
Phagocytic activity (μg Ml−1)5.500 ± 0.692 b12.05 ± 0.490 a10.95 ± 0.317 a10.65 ± 0.721 a0.0002
Phagocytic index1.040 ± 0.0341.315 ± 0.1641.200 ± 0.0001.010 ± 0.0630.131
Lysozyme activity (μg mL−1)0.985 ± 0.002 b1.015 ± 0.002 a0.880 ± 0.005 c0.550 ± 0.005 d<0.0001
WBCs (×103/mm3)43.10 ± 1.04246.71 ± 6.52139.40 ± 2.93035.95 ± 1.2990.264
Neutrophils (%)1.800 ± 0.057 a0.850 ± 0.086 b1.250 ± 0.202 b1.000 ± 0.000 b0.001
Lymphocytes (%)91.65 ± 0.433 b93.55 ± 0.144 a92.95 ± 0.375 a,b92.70 ± 0.173 a,b0.014
Monocytes (%)6.450 ± 0.3175.600 ± 0.0575.800 ± 0.1736.300 ± 0.1730.053
Data are presented as mean ± SE. p values of one-way ANOVA followed by Tukey’s post hoc test for significant differences. Means within each row without shared superscripts (a,b,c) are significantly different at p < 0.05.
Disclaimer/Publisher’s Note: The statements, opinions and data contained in all publications are solely those of the individual author(s) and contributor(s) and not of MDPI and/or the editor(s). MDPI and/or the editor(s) disclaim responsibility for any injury to people or property resulting from any ideas, methods, instructions or products referred to in the content.

