1. Introduction
Observed negative impacts on aquatic systems from grass (
Ctenopharyngodon idella), bighead (
Hypophthalmichthys nobilis), and silver carp (
Hypophthalmichthys molitrix), collectively termed “invasive carp” in North America, have made the management of populations of these fishes an important concern for resource managers [
1,
2]. Grass carp are native to large rivers and lakes ranging from southern Russia southward to northern Vietnam [
3]. Grass carp are primarily grazers that forage selectively upon aquatic vegetation [
4], and they have been introduced into many countries for aquacultural production and the control of nuisance aquatic plants [
5,
6]. Grass carp have been present in United States waterways since 1966, and a combination of repeated intentional introductions and occasional accidental escapes has led to the occurrence of grass carp in 49 countries in Europe and 45 states within the United States [
3,
7,
8]. Grass carp pose a significant ecological risk in the United States due to rapid population establishment, the availability of suitable environmental conditions, their ability to alter ecosystems by removing aquatic vegetation, and their role as a host for numerous diseases and parasites [
9]. Bighead and silver carp are native to eastern Asia [
10]. Both are primarily generalist-tending filter-feeders and show minimal selectivity during foraging [
11]. Bighead and silver carp were introduced to the United States to control plankton in aquaculture ponds, but they were found in adjacent waterways in 1994 and 1973, respectively [
12]. The invasion of bighead and silver carp into North American waters is of concern due to their negative impact on ecosystems by directly competing with native species for resources; this competition can cause a reduction in native fish diversity [
2]. A variety of research has been conducted on food additives and compounds such as food cues (e.g., amino acids), pheromones, and alarm-eliciting compounds that could be used to attract and aggregate invasive carp for easier removal by managers [
13,
14,
15]. This research is intended to inform the management of invasive carp control activities by the United States Fish and Wildlife Service, the Army Corps of Engineers, and multiple state agencies.
The olfactory and gustatory systems of various fish species are sensitive to a variety of chemical stimuli, including amino acids [
16,
17]. The olfactory range of EOG-measured responses to amino acids is generally similar across fish species, and L-enantiomers (as opposed to the “mirror image” molecules of R-enantiomers) of amino acids are generally the most effective olfactory stimuli [
16,
17]. In koi (
Cyprinus rubrofuscus “koi”), a member of the same order as invasive carps, Cypriniformes (cypriniform), selection for food with added L-alanine was greater than selection for food with additions of L-arginine, L-lysine, or L-methionine [
18]. For grass carp, L-alanine, L-arginine, and L-aspartic acid are three amino acids that cover the range of magnitudes of olfactory responses observed for that species [
19]. Previous EOG studies on grass carp and other cypriniforms include lysine, cysteine, and tyrosine [
19,
20,
21]; these amino acids tend to elicit response values of a magnitude similar to the values observed for L-alanine, L-arginine, and L-aspartic acid. L-arginine elicits a relatively large response in goldfish (
Carassius auratus) and in grass carp [
19,
20,
21]. Although L-asparagine has not received attention in cypriniforms from other EOG studies [
19,
20,
21], these studies demonstrate that a wide range of amino acids can be detected by cypriniforms. A concentration of 10
−4 molar (M) is one of the predominant concentrations of amino acids tested in EOG studies of fishes [
19,
22,
23]. Based on this understanding of fish olfactory systems, we used 10
−4 M concentrations of amino acids in this study.
Measuring the olfactory response to chemical stimuli can be accomplished using EOG [
19,
24]. This method provides a quantitative measure of physiological response to chemical stimuli by measuring the summed electrical output of excited olfactory receptors and associated channels located on olfactory dendrites of the olfactory epithelium. In teleost fishes, paired olfactory organs are located on the dorsal side of the head; water enters each anterior naris, passes over the olfactory epithelium, and leaves through the posterior naris as the fish swims [
16,
17]. Initial exposure to chemical stimuli causes the reversible binding of a stimulus molecule to a sensory neuron on the surface of the olfactory epithelium. The number of olfactory sensory neurons on the surface of the olfactory epithelium of grass carp is roughly 51,000 cell mm
−2 [
25]. The sensory neurons’ response to chemical stimuli produces electrical signals that can then be measured using EOG [
16,
17]. Determining if amino acids can trigger an EOG-measured response in the nervous system of fish in a laboratory environment can provide an initial step in determining if these compounds could produce behavioral changes in the wild. Understanding more about this signal/behavior interaction can then help inform which compounds could be useful for the management of invasive populations. In grass carp, some amino acids that cause an EOG response produce changes in feeding behavior, either causing a fish to bite a bait ball frequently for some amino acids or actively avoiding biting the bait ball for others [
26]. This type of information could prove useful in the design of baits to selectively catch grass carp or chemical repellants to prevent their spread.
Common carp, fathead minnow (
Pimephales promelas), goldfish, grass carp, and koi are among the cypriniform species that have been studied using EOG methods [
18,
19,
21,
22]. To the best of our knowledge, aside from grass carp [
19], minimal research has been conducted on the chemoresponse of the members of the family Xenocyprinidae, the family that contains grass, bighead, and silver carp [
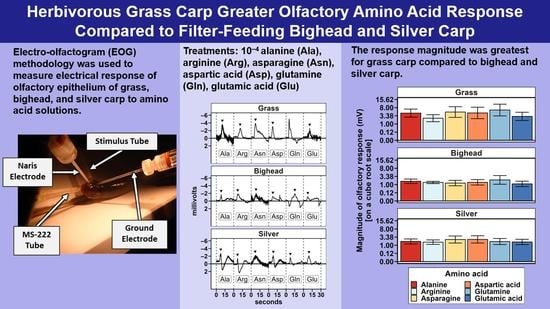
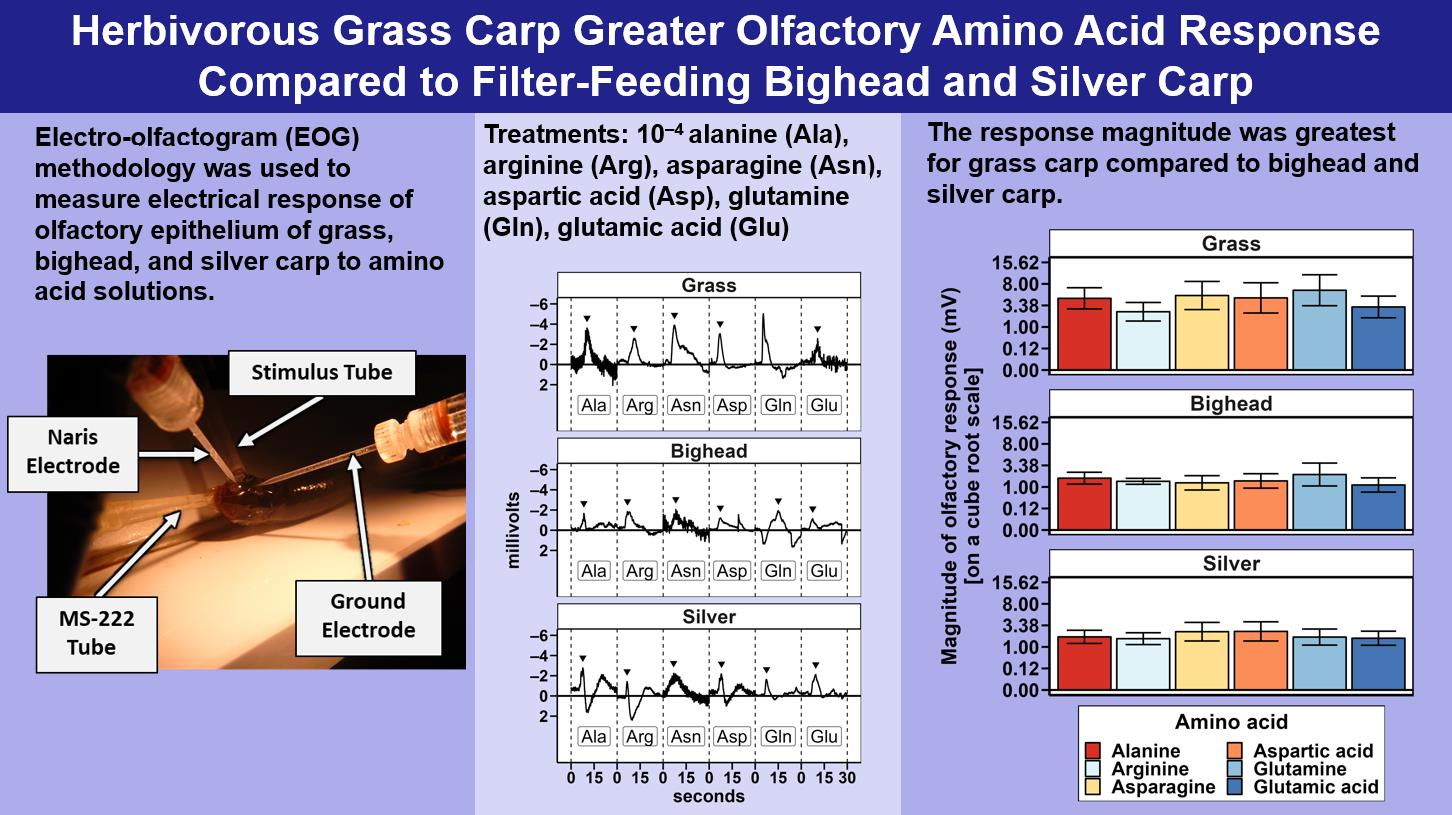
27]. Using juvenile grass, bighead, and silver carp, we tested the following two hypotheses: (1) Grass carp, a selective grazer, would demonstrate a greater electro-olfactory response, measured as a greater magnitude of peak EOG response, to amino acid stimuli than bighead and silver carp, which filter feed and often show more general food selection for phytoplankton versus zooplankton [
28] compared to grass carp selecting for specific plant species [
29]. (2) Among the six amino acids tested in this study, grass carp would exhibit differing EOG-measured responses, as has been previously demonstrated in this species [
19], while less selective bighead and silver carp would not. Separate from the hypotheses themselves, an overall goal of the study design was to provide an assessment more applicable to the level of variation in EOG-measured response found between species in the natural environment.
2. Materials and Methods
2.1. Study Organisms
Juvenile silver carp were collected in 2019 from Eagle Bluffs Conservation Area, Columbia, MO, USA, adjacent to the Missouri River, and held in well water at the U.S. Geological Survey Columbia Environmental Science Center (CERC; Columbia, MI, USA) for a minimum of 3 months before electro-olfactogram (EOG) trials. For the other fish species used in this study, grass carp were spawned at CERC in June 2018 and bighead carp were spawned in two different years, 2019 and 2020. These juvenile fish were kept on an approximate 12 h:12 h light:dark cycle and were maintained at CERC until the time of the experimental trials. The number of individuals, along with the mean ± one standard deviation of mass and total length at the time of trials, is as follows: grass carp:
n = 21; mass = 7.40 ± 2.76 g, length = 81.2 ± 11.1 mm; bighead carp:
n = 21, mass = 3.6 ± 1.0 g, length = 75.0 ± 12.7 mm; silver carp:
n = 22; mass = 13.3 ± 2.9 g, length = 107.4 ± 9.1 mm. Based on CERC best culture practices, bighead and silver carp diets consisted of a liquid algae mix (50/50 ratio of
Spirulina and
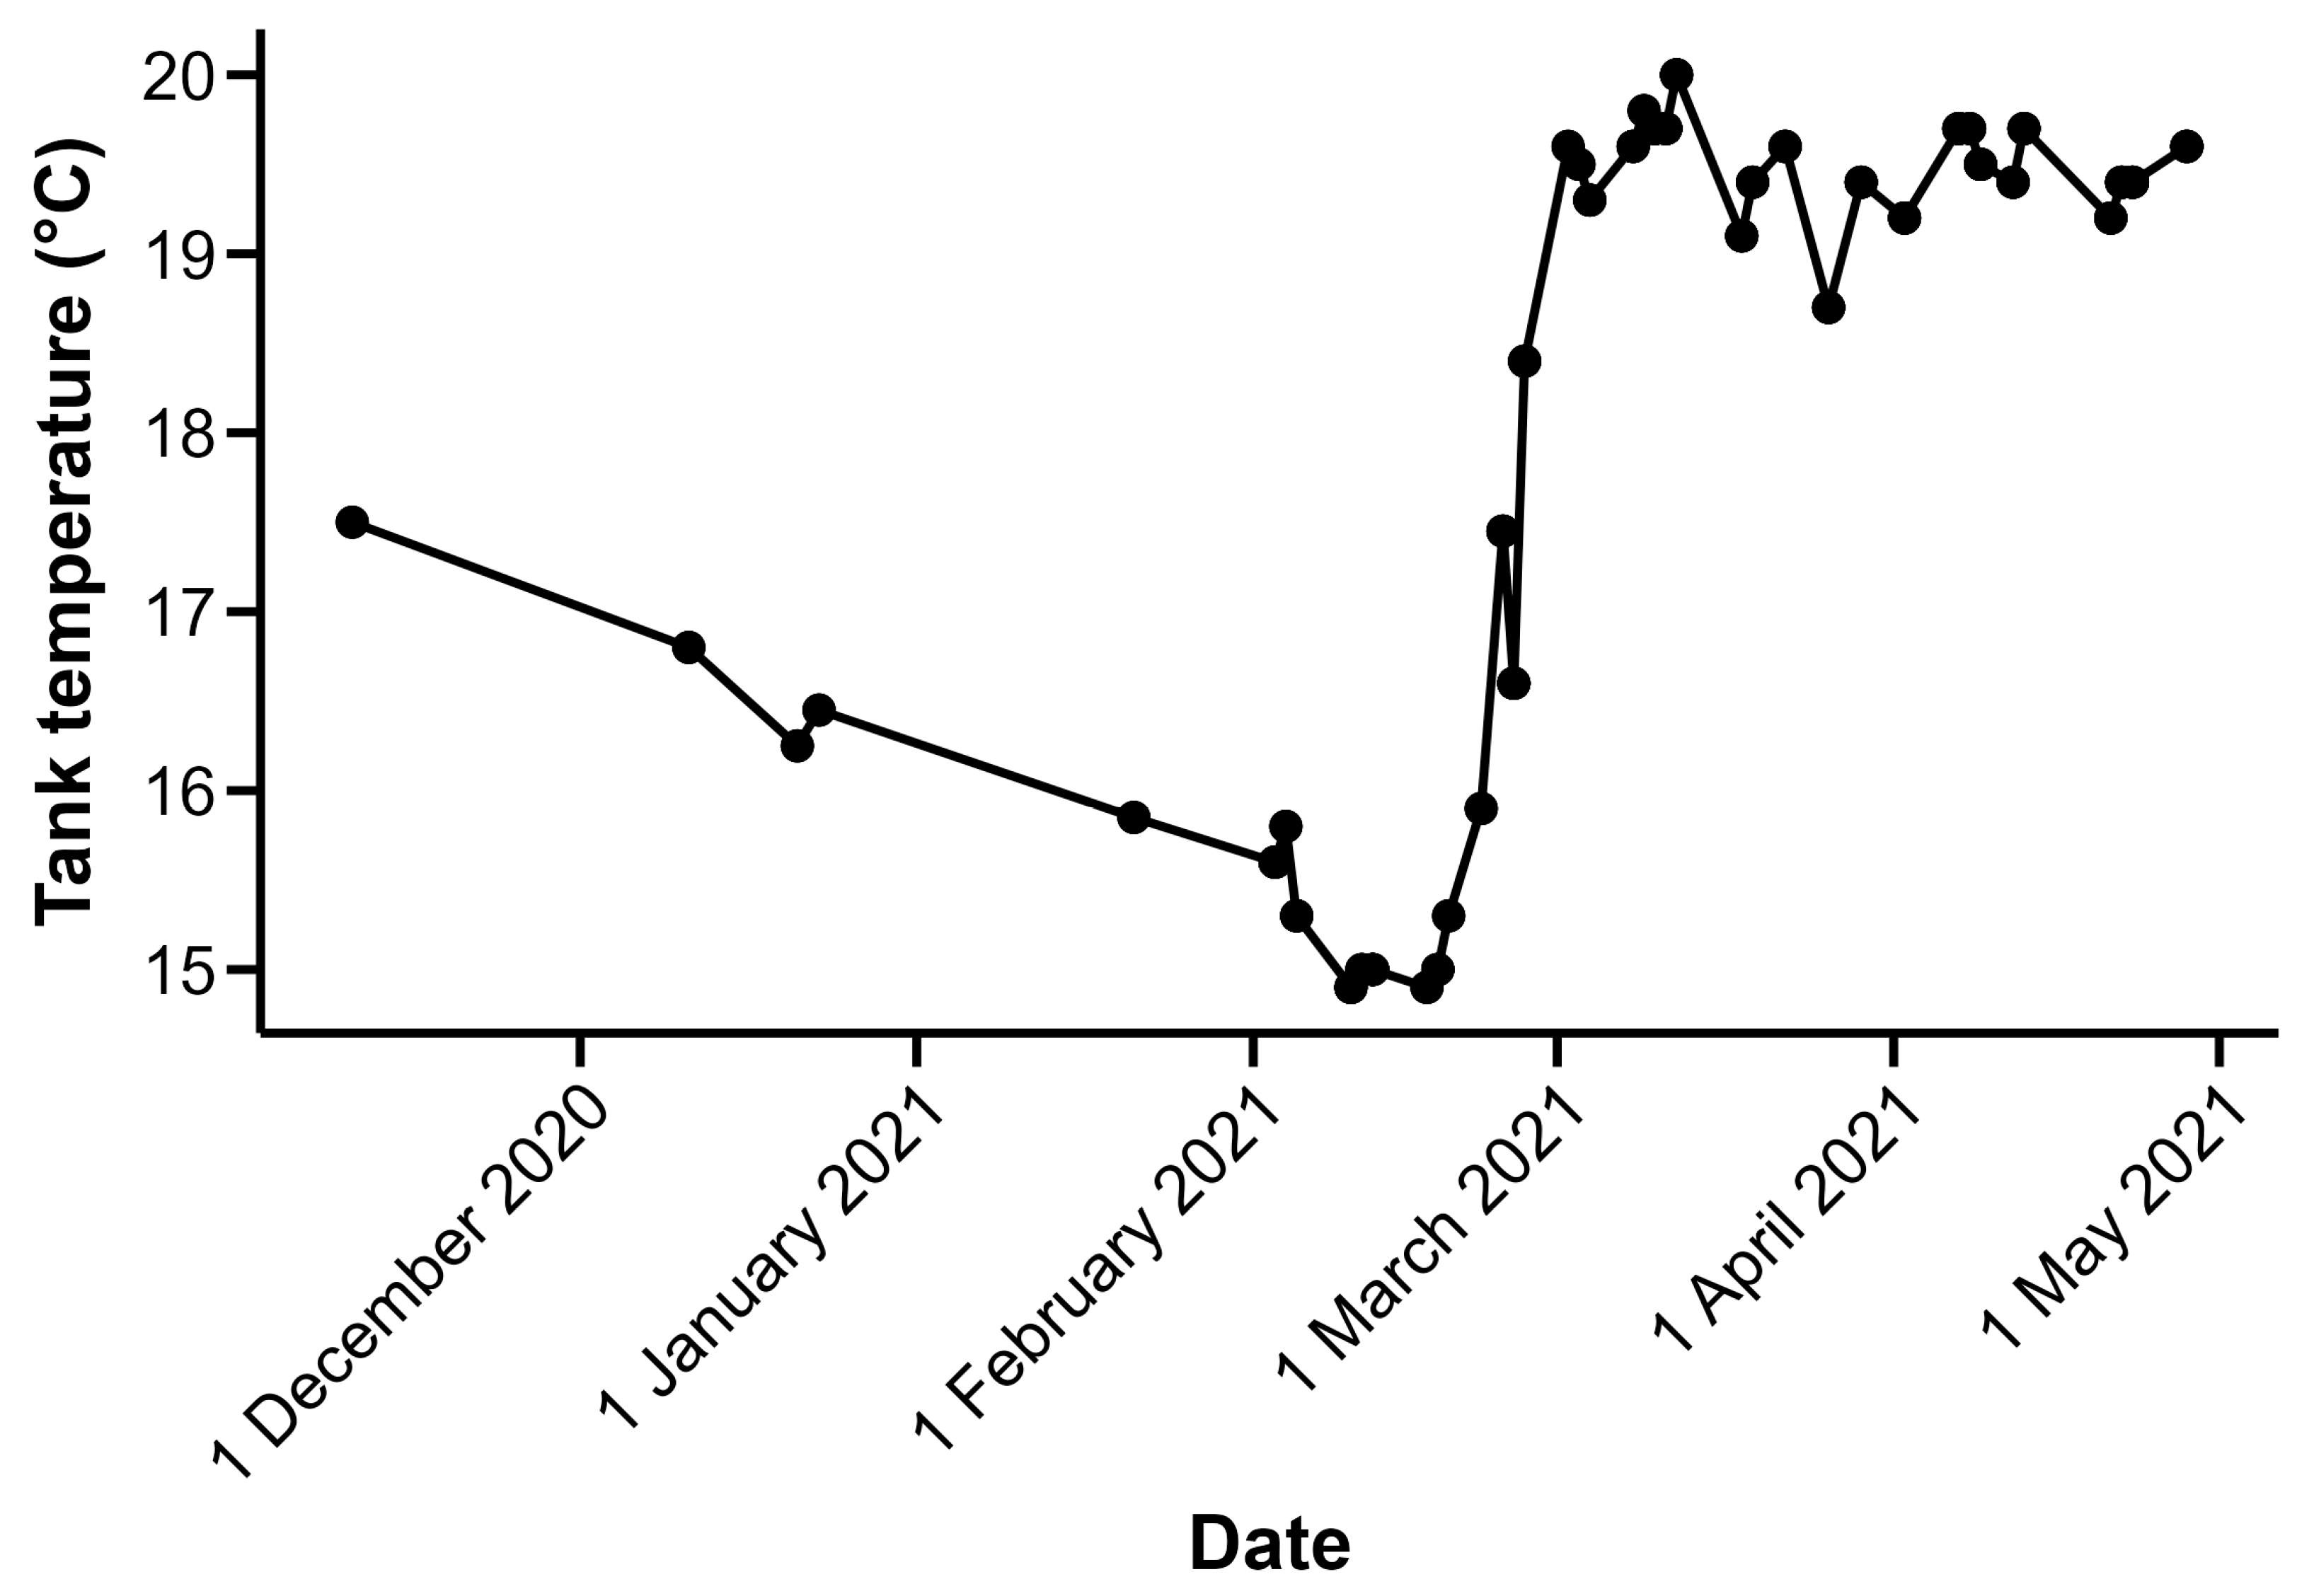
Chlorella) and a flake food mixture consisting of the following: flake food, freeze-dried Arctic copepods, freeze-dried rotifers, freeze-dried krill powder, and freeze-dried brine shrimp. Again, based on CERC best culture practices, grass carp diets consisted of the same flake food mixture and 1.6 mm pellets (450 EXTR floating pellets, Rangen, Buhl, Idaho). The holding tank temperature was recorded daily and ranged from 14.9 to 20.0 °C as a result of seasonal well water temperatures and variation in the water control system (
Figure 1). Trials conducted prior to 26 February 2021 were conducted when holding tank temperatures were between 14.9 and 17.5 °C; holding tank temperatures for trials conducted on or after that date were between 18.4 and 20.0 °C (
Figure 1). The range of holding tank temperatures during the period when EOG trials were conducted created the opportunity for us to assess the potential effects of temperature, specifically the water temperature of the fish’s environment prior to trials, on EOG-measured response.
2.2. Experimental Design
The amino acids L-alanine, L-arginine, L-aspartic acid, L-asparagine, L-glutamine, and L-glutamic acid were tested on grass, bighead, and silver carp to provide a comparison among the responses to amino acids both within and among species. These amino acids were chosen primarily based on the range of responses reported in the literature noted earlier, along with the addition of previously untested L-glutamine and L-glutamic acid as additional amino acids to see if they have potential for eliciting an attraction response in grass carp. Comparing relative responses to amino acids, that is, controlling for non-biological differences between trials by dividing the measured response to an amino acid by the measured response to a reference amino acid tested on the same individual during the same trial, is the standard for EOG studies [
19,
21,
24]. Following previous work on grass carp [
19], we used L-alanine as our reference amino acid; we included L-alanine in every trial.
To directly compare the L-alanine response with the other amino acids tested and assess differences between species, we also analyzed the magnitude of the measured millivolt response (MMR; i.e., not adjusted for alanine). This use of the MMR was possible due to the randomized order of species and amino acids tested. Our trial randomization procedure follows: Trials were conducted in groups of three. Each group of trials contained one fish of each species tested, and each trial used one individual fish. The three fish were tested in a randomly selected order; an example order of trials in a group could be (1) bighead, (2) silver, and (3) grass carp. For each group, three non-alanine amino acids were selected. An example selection could be L-arginine, L-asparagine, and L-glutamic acid. After selection, these amino acids and L-alanine, the reference amino acid, were randomly ordered for the group. An example order could be (a) L-glutamic acid, (b) L-arginine, (c) L-alanine, and (d) L-asparagine. This same ordering of amino acids was applied to each fish in a group. The total number of times each fish species was exposed to each amino acid is listed in
Table 1.
2.3. Materials, Equipment, and EOG Trials
The EOG procedure used in this study was modified from an EOG study on fathead minnows [
22] to accommodate differences in the laboratory system utilized and the gelatin-softening effects of warmer water temperatures on the electrodes. Electrodes were created from 1.0 mm diameter, 76-mm-long glass micropipettes (World Precision Instruments, 175 Sarasota Center Boulevard, Sarasota, FL, USA) in a micropipette puller (Microdata Instrument PMP 102; MicroData Instrument, Inc., S. Plainfield, NJ, USA). Electrodes were filled with 0.09 g L sodium chloride (NaCl) and 0.6 g L gelatin and kept in a 3 M potassium chloride (KCl) solution at between 8 °C and 10 °C. Electrodes were used within 1 to 30 days of preparation. Prior to use, filled electrodes were examined with a microscope to check for quality. Broken electrodes or ones with large gaps or bubbles in the gelatin solution were discarded. A differential amplifier (Dagan EX1 Differential Amplifier with a 4001 Dagan Headstage) was used to collect the data (Dagan Corporation, 2855 Park Ave., Minneapolis, MN, USA). Software was used to record data (LabChart 8 software; ADI Instruments PowerLab 4/35 1994–2019, v8.1.16, Dunedin, New Zealand, 12 December 2019). The flow rate of water and stimulus solutions was held between 6 and 8 s mL
−1 to control for potential effects of flow on the millivolt response measured.
Amino acid compounds were mixed once a month with well water at a concentration of 10−4 M. Mixed solutions were stored in a fridge kept between 8 °C and 10 °C, then brought to room temperature (19 to 20 °C) prior to testing. The water used to culture the fish (i.e., well water) was used as a negative control. Ultrapure deionized (UDI) water (derived from well water) was used to help identify the appropriate placement of the electrode on the olfactory rosette of the fish using the criteria described below. Parameters for well water were calcium ions (Ca2+) = 81.0 to 84.2 milligrams per liter (mg L−1), sodium ions (Na+) = 24.8 to 27.6 mg L−1, magnesium ions (Mg2+) = 24.4 to 26.9 mg L−1, dissolved organic carbon ≤ 1.5 mg L−1, hardness = 316 mg L−1 as calcium carbonate (CaCO3), alkalinity = 252 mg L−1 as CaCO3, pH = 7.93. For UDI water, parameters were: Ca2+ < 0.1 mg L−1, Na+ < 0.1 mg L−1, Mg2+ < 0.1 mg L−1, dissolved organic carbon = 0.6 mg L−1, hardness = 0 to 8 mg L−1 as CaCO3, alkalinity = 8 to 35 mg L−1 as CaCO3, pH = 6.0 to 7.0.
Grass, bighead, and silver carp trials involving amino acids at 10−4 M concentration were conducted between 10 November 2020 and 13 April 2021 to assess differences in EOG-measured response depending on species and amino acid identity. Fish were collected from their holding tank and held in 1 L beakers with 500 mL of culture water for approximately one hour before a trial began to allow for acclimation to any temperature changes or stress caused by handling. Fish were briefly anesthetized with buffered tricaine mesylate (MS-222, 300 mg L−1) solution, and the nasal septum was removed to expose the right olfactory rosette.
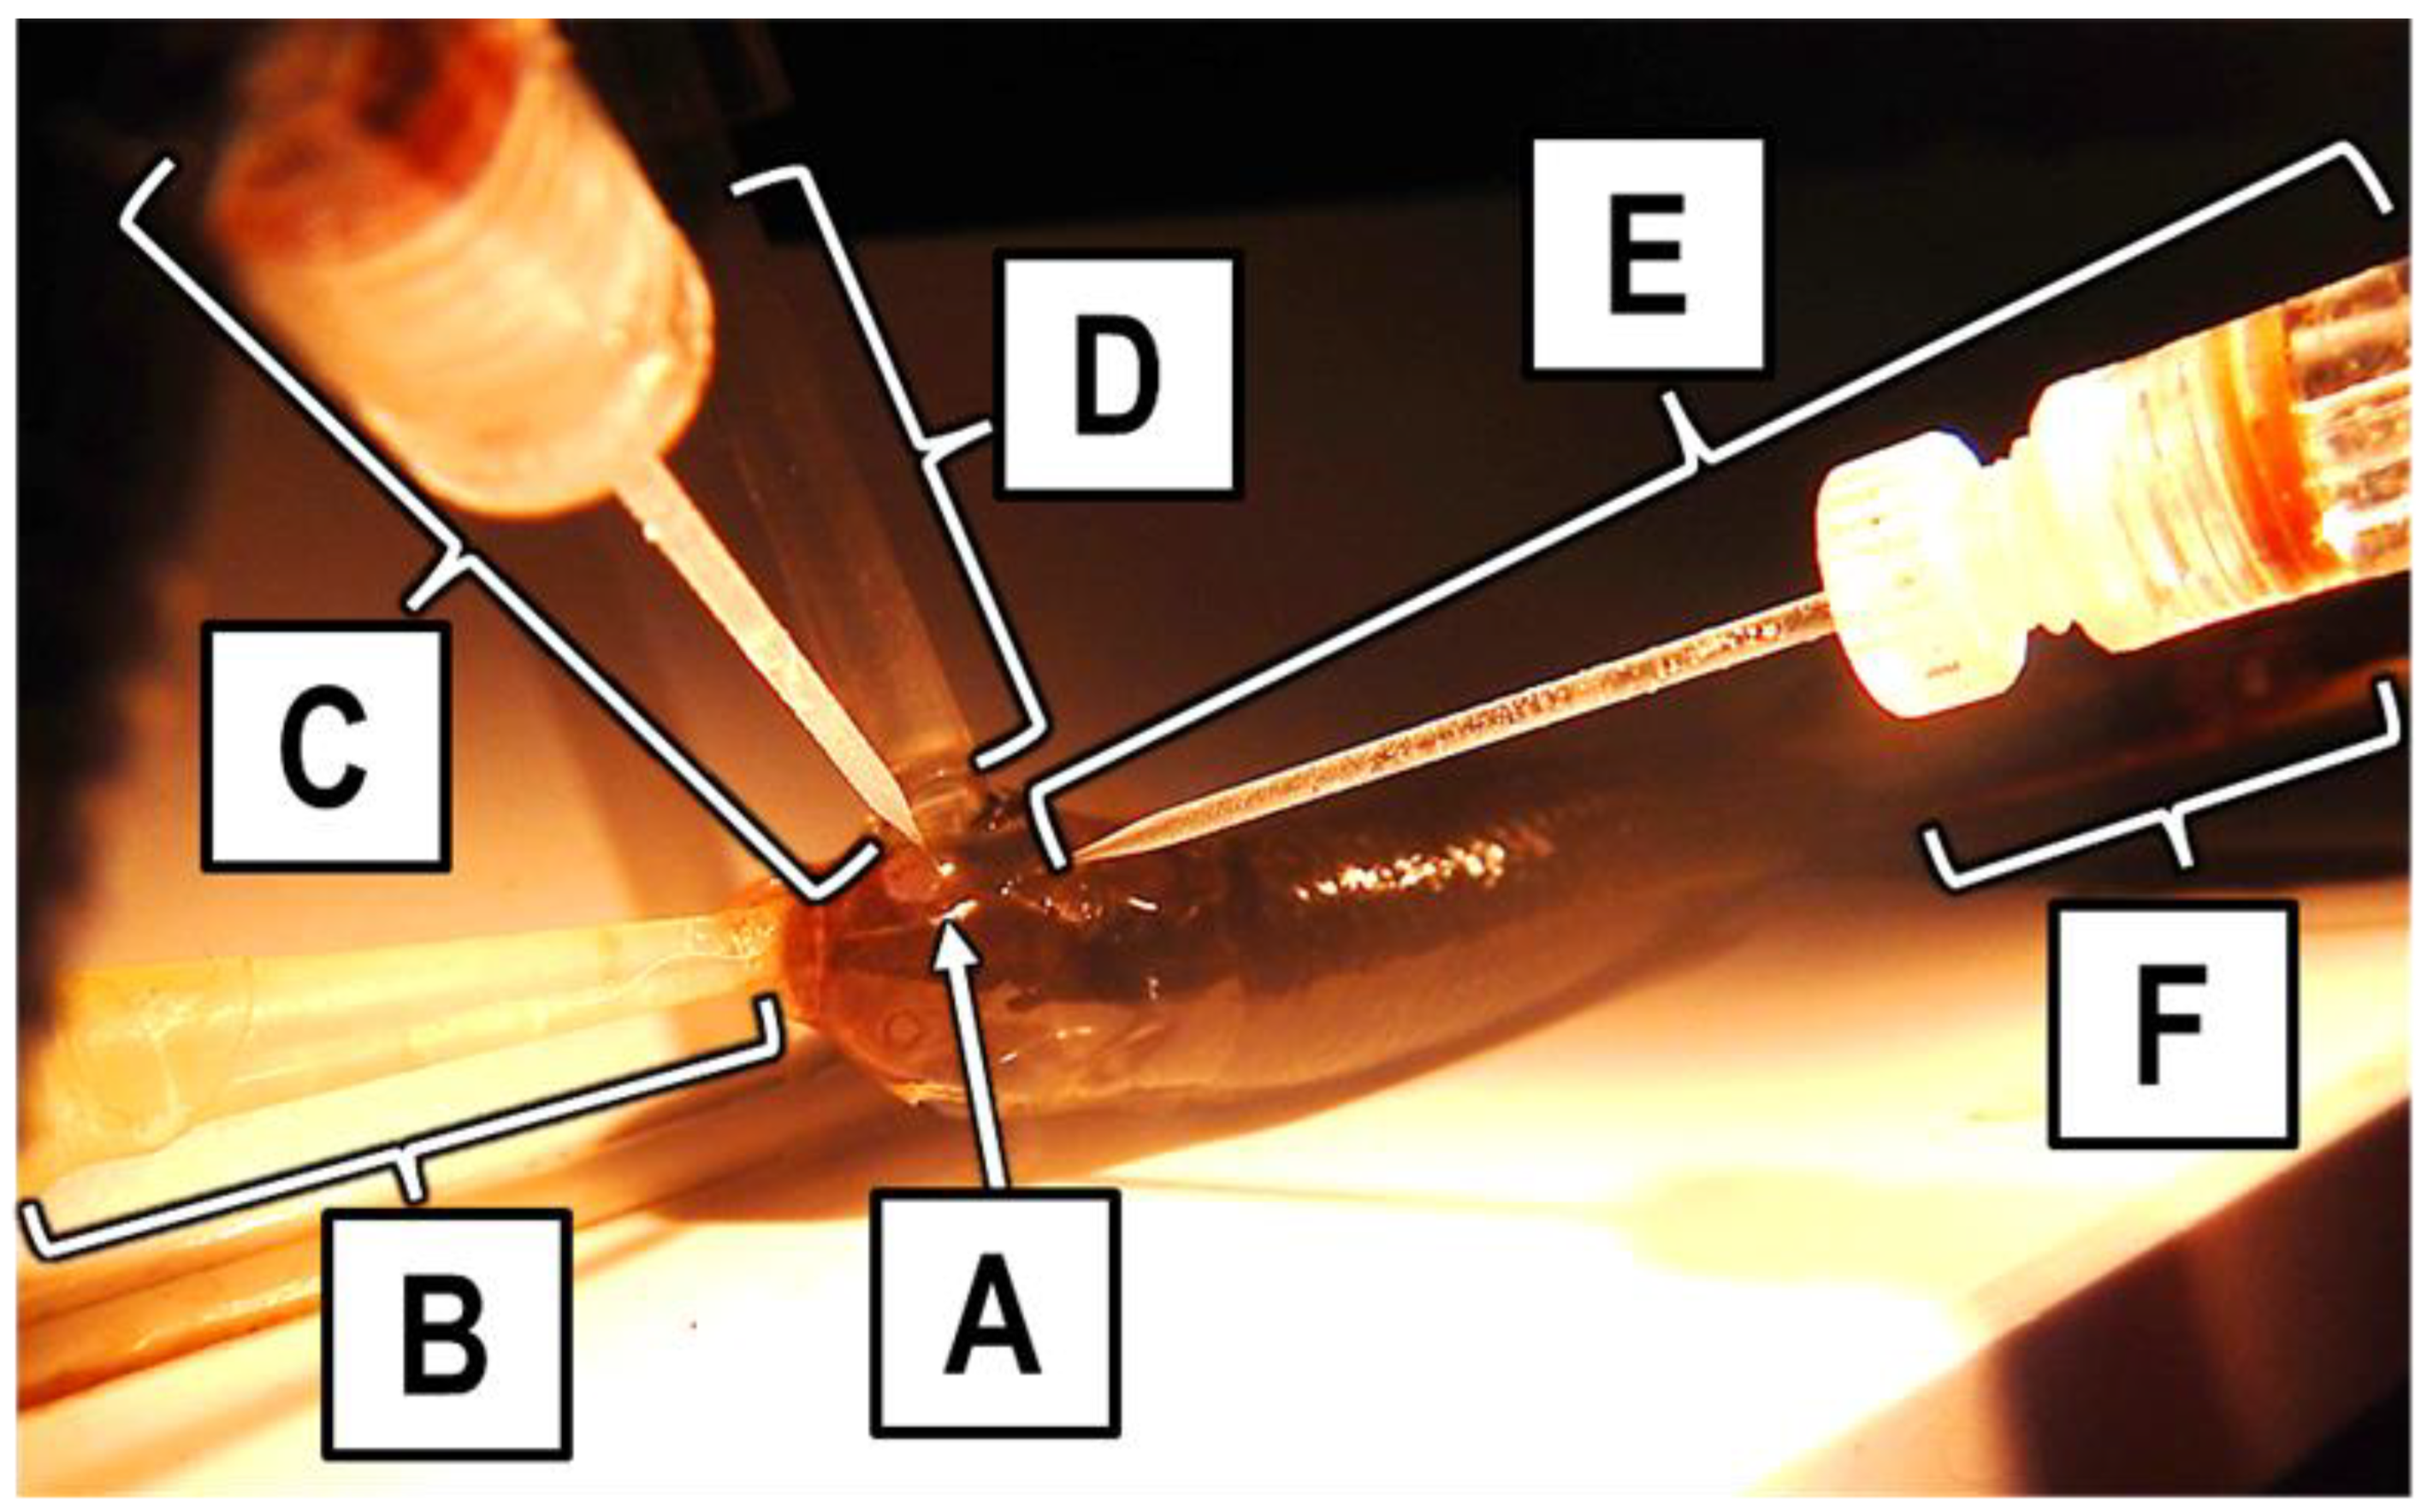
For each trial, an anesthetized fish was placed in a PVC holding tray (
Figure 2). Using a tube inserted into its mouth, it was given a continuous flow of well water containing 100 mg L
−1 MS-222 perfused through its gills to maintain an anesthetized state for the duration of the trial and to provide oxygen. A second tube, termed the “stimulus tube”, was placed over the right naris of the fish. One of three solution types—well water, UDI water, or an amino acid solution—always flowed through the stimulus tube and over the right naris of the fish throughout a trial. One of the two electrodes was placed into the exposed right naris to make slight contact with the olfactory rosette and then backed off slightly so it was not touching the olfactory rosette while still being close enough to measure any electrical response of the rosette; this electrode was referred to as the naris electrode. The other electrode was placed on the exterior of the fish, roughly 1 mm from the exposed naris; this electrode was referred to as the ground electrode. A copper grounding wire soldered to an alligator clip was attached down the center of the caudal fin or perpendicular to the lateral line, across the caudal peduncle. This wire was grounded to the building. The fish was covered with a wet paper towel during a trial to prevent desiccation, leaving only the head and tail exposed.
Following a previous study [
19], the exposed olfactory chamber underwent an initial conditioning period where it was acclimated to well water from the stimulus tube for a minimum of 5 min before a trial began. After this initial 5 min period, well water was continuously applied through the stimulus tube so that the olfactory chamber remained conditioned to well water. A continuously stable, flat EOG signal for a minimum of 60 s with limited noise in the signal was required prior to the application of a stimulus to provide a 60-s negative control signal for comparison. A stimulus delivery (“exposure”) of 3 s delivering approximately 1 mL of a stimulus, either amino acid solution or UDI water, was achieved using a gravity-fed delivery through the stimulus tube. A minimum of 2.5 min of well water exposure was allotted between stimulus exposures to allow for naris recovery. In between stimulus exposures, the olfactory chamber was irrigated with well water. Flow rate was recorded at least once per run; the median value for flow rate was 0.16 mL/s (range = 0.13–0.20 mL s
−1) to ensure comparability among species and amino acid combinations. This flow rate was similar to the ~0.12 mL/s rate used by a previous EOG study of grass carp [
19]; we determined with empirical testing that our EOG setup required a slightly higher flow rate to obtain a consistent signal.
A trial comprised a single fish with (1) initial exposure(s) to UDI water, (2) exposures to up to four amino acid solutions, and (3) exposure to UDI water at the end. Though other studies average EOG responses from three exposures to one amino acid across an individual fish [
19,
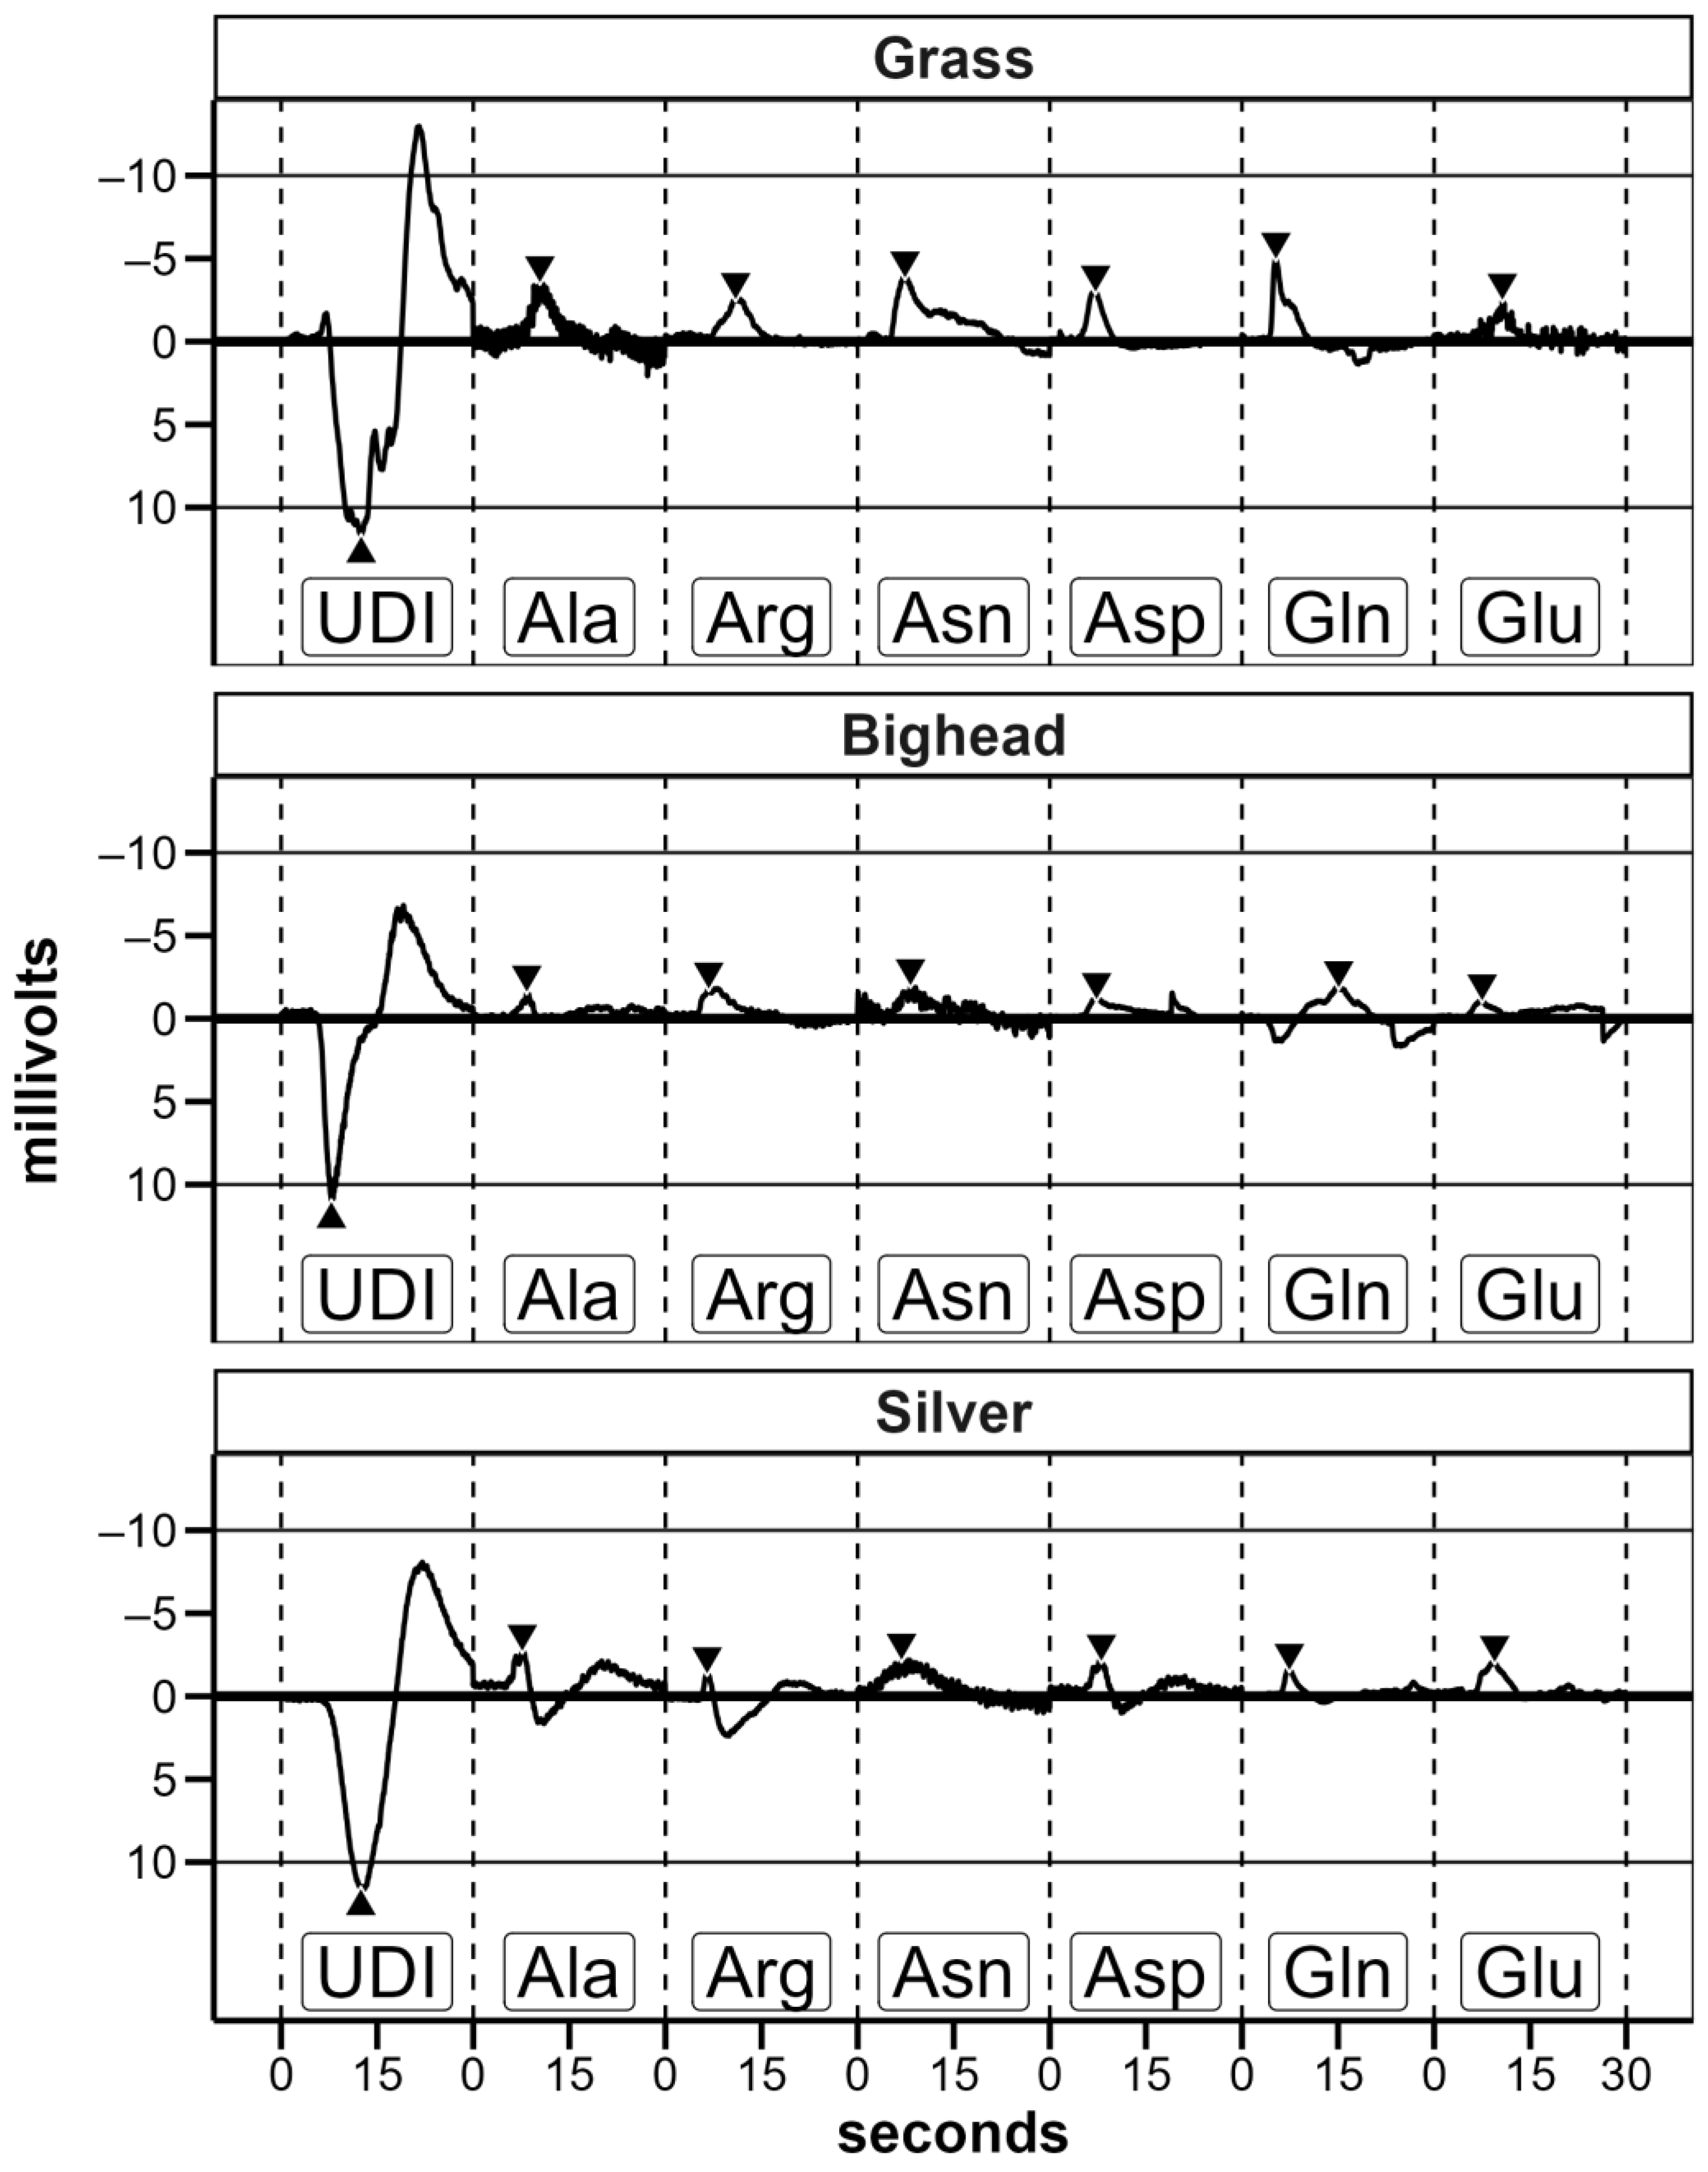
22], we exposed each fish to each amino acid once to emulate the initial response of fish when an amino acid stimulus is first introduced into its environment as opposed to an averaged response after multiple exposures. Preliminary trials indicated that, after conditioning with well water, exposure to UDI water elicited a strong electrical response (
Figure 3); this follows previous research on the response of common carp sensory neurons to distilled water [
30]. Based on this known response, we used the first UDI exposure to test for proper electrode positioning and conductivity and inferred that the electrode placement for an individual fish was comparable to that of the other fish tested. If the magnitude of the measured response to the first UDI water exposure was less than 4 millivolts (mV), electrodes were readjusted or replaced. By assessing electrode placement in this way, the expectation was that any response to amino acid exposure would be comparable across fish without abnormally high or low recorded responses while only exposing each fish to each amino acid once. Before transitioning from the initial UDI water exposure(s) to the amino acid exposures, two criteria needed to be met: (1) a minimum of 180 s after the previous exposure and (2) at least 1 min of stable baseline without excessive signal noise immediately prior to the amino acid exposure. Under the rare circumstance where a stable baseline could not be obtained between exposures in an otherwise viable trial of 64 total trials, we either readjusted electrode positioning (
n = 4 trials) or altered flow rate slightly (
n = 3 trials).
After a trial was completed, the fish was revived to ensure it had been alive throughout the duration of the test (
Table 1). The fish was then euthanized using buffered MS-222, and its length and weight were recorded. Buffered MS-222 solution, 3 M potassium chloride (KCl) electrode holding solution, and MS-222 gill perfusion solution were prepared once a month.
2.4. Data Processing and Filtering
To calculate a gross EOG response in mV, we identified the maximum absolute value within 10 s following the estimated delivery time of the solution noted on the data plot. The baseline response before and after an exposure was calculated as the mean recorded millivolt response to well water for the 60 s prior to the estimated delivery time of the solution. The MMR was calculated as the gross response minus this baseline.
After initial processing, the data were assessed manually for quality, that is, usable EOG recordings, using visual inspection of data plots. Data were included in analyses if all of the following criteria were met: (1) there was no noise unrelated to the signal response (e.g., no bubbles in the solution delivered for an exposure, no change in electrode connectivity or conductivity), (2) there was a prior UDI response with an absolute value greater than 4 mV, (3) the amino acid exposure was the first or only exposure to that amino acid within a trial (i.e., not a repeat), and (4) the fish was alive at the end of the trial.
If there was a high-quality recorded alanine response in a trial (63 of 64 trials), processed data were used to calculate responses relative to alanine within trials. If electrodes were moved during a trial, relative responses were only calculated if the electrode placement of an exposure matched that of the alanine exposure. After this filtering for the presence of a comparable alanine response, analyses of relative response included 181 of the total 188 non-alanine amino acid exposures across trials (
Table 1). Alanine responses were excluded from the relative response dataset because all such values were equal to 1 and provided no additional information on relative responses.
Prior to all analyses, to address normality and constancy of variance issues associated with the original response data, we used a cube root transformation on all MMRs and relative responses to amino acid solutions. A cube root provided a compromise between improving normality and maintaining variability within the data. The normality and constancy of variance issues were identified and reassessed post-transformation using residual plots.
2.5. Data Analysis
The primary goals of our data analyses were to (1) test for differences in EOG responses between species in multi-species models; (2) assess possible differences in EOG responses across amino acids for invasive carp as a group within a multi-species model; (3) examine potential differences in EOG responses across amino acids for individual carp species in single-species models; and (4) determine the necessary sample size needed to observe statistically significant differences across amino acids. To account for additional variability within each model and examine secondary factors related to EOG responses, we considered up to two continuous covariates per model. For single-species models, fish mass was used as a proxy for developmental stage, a factor that influences the morphology of the olfactory rosette of cypriniforms [
31] (
Table 2). The fish mass covariate was not used in multispecies models due to differences in size between species and potentially different developmental rates relative to size between species. All models considered holding tank temperature as a covariate.
Unless otherwise noted, our models were a priori linear models containing a combination of categorical main effects and continuous covariates (
Table 2). These models were created using statistical software (“lm” function in the “stats” R package [
31]). Main effects within models were assessed using Type III analysis of covariance (ANCOVA; “Anova” function of the “car” R package [
32]). To plot data and to do pairwise comparisons within significant main effects, we used pairwise comparisons of estimated marginal means (EMM) with a Tukey method
p-value adjustment (“emmeans” function of the “emmeans” package followed by the “cld” function of the “multcomp” package in R) [
33,
34]. A value of α = 0.05 was used for all models unless otherwise noted. For multispecies models, we assessed the relative contribution of the species term to the explanation of model variability by calculating r
2 for that term (the sum of squares of the term interest divided by the total sums of squares).
To test for differences in response among the three species of invasive carp to amino acid stimuli, we created two multispecies models that compared responses across all species to amino acids; one model used relative response, and the other used MMR. These models had the main effects of species and amino acids and a covariate of holding tank temperature.
We used several models to test for differences in the strength of the EOG response between amino acids. To test for an effect across species, we assessed the significance of the amino acid factor in the two multispecies models. To test for an amino acid effect within species, we assessed the significance of the amino acid factor in six additional single-species models. The single-species models used response variables of relative response (three models) and MMR (three models). These six single-species models contained a main effect of amino acids and two covariates: fish mass and holding tank temperature (
Table 2). Additionally, we used 15 single-sample
t-tests comparing mean relative responses of single non-alanine amino acids to a value of 1.00, i.e., alanine, to test for differences; every combination of non-alanine amino acids and species had its own test. Means were calculated for each species. A Bonferroni-type adjustment of (0.05)/(number of non-alanine amino acids in a grouping) was made to the α threshold for these
t-tests to adjust for multiple testing (
Table 3).
Following the ANCOVA tests, we conducted power analyses to estimate the necessary sample size to find significant differences among amino acids (“power.anova.test” function in the R “stats” package [
31]). These analyses estimated the necessary group sample size to obtain a statistically significant result for a balanced study design. We set power to 0.8; significance level to 0.05; number of groups, that is, amino acids, to 6; between group variance to the sum of squares for the amino acid term in an ANCOVA; and among group variance to the error sum of squares for a given ANCOVA (
Table 2). Our experimental setup and sampling design necessarily resulted in an imbalanced number of samples per amino acid group. To convert initial results to results usable for an imbalanced design, we multiplied the unrounded within-group sample sizes estimated by the power analyses by the number of amino acids (6) to obtain the estimated total number of amino acid exposures needed among trials. We then calculated the necessary proportional increase from our recorded amino acid exposures by dividing the number of exposures estimated by each power test by the number of exposures we used in that ANCOVA. The number of exposures used in an ANCOVA can be obtained by adding 1 to the sum of degrees of freedom from all terms listed for an individual ANCOVA in
Table 2.
To check the assumption that there was no effect of amino acid holding time on EOG response, we did post-hoc correlation analyses of days between amino acid solution mixing and trial date versus magnitude of EOG-measured response. We performed 36 tests, one for each combination of amino acid, species, and temperature range (14.9 to 17.5 °C or 18.4 to 20.0 °C). Results were assessed using a Bonferroni-type adjustment of α of 0.05/6 (number of amino acids) = 0.0083.
4. Discussion
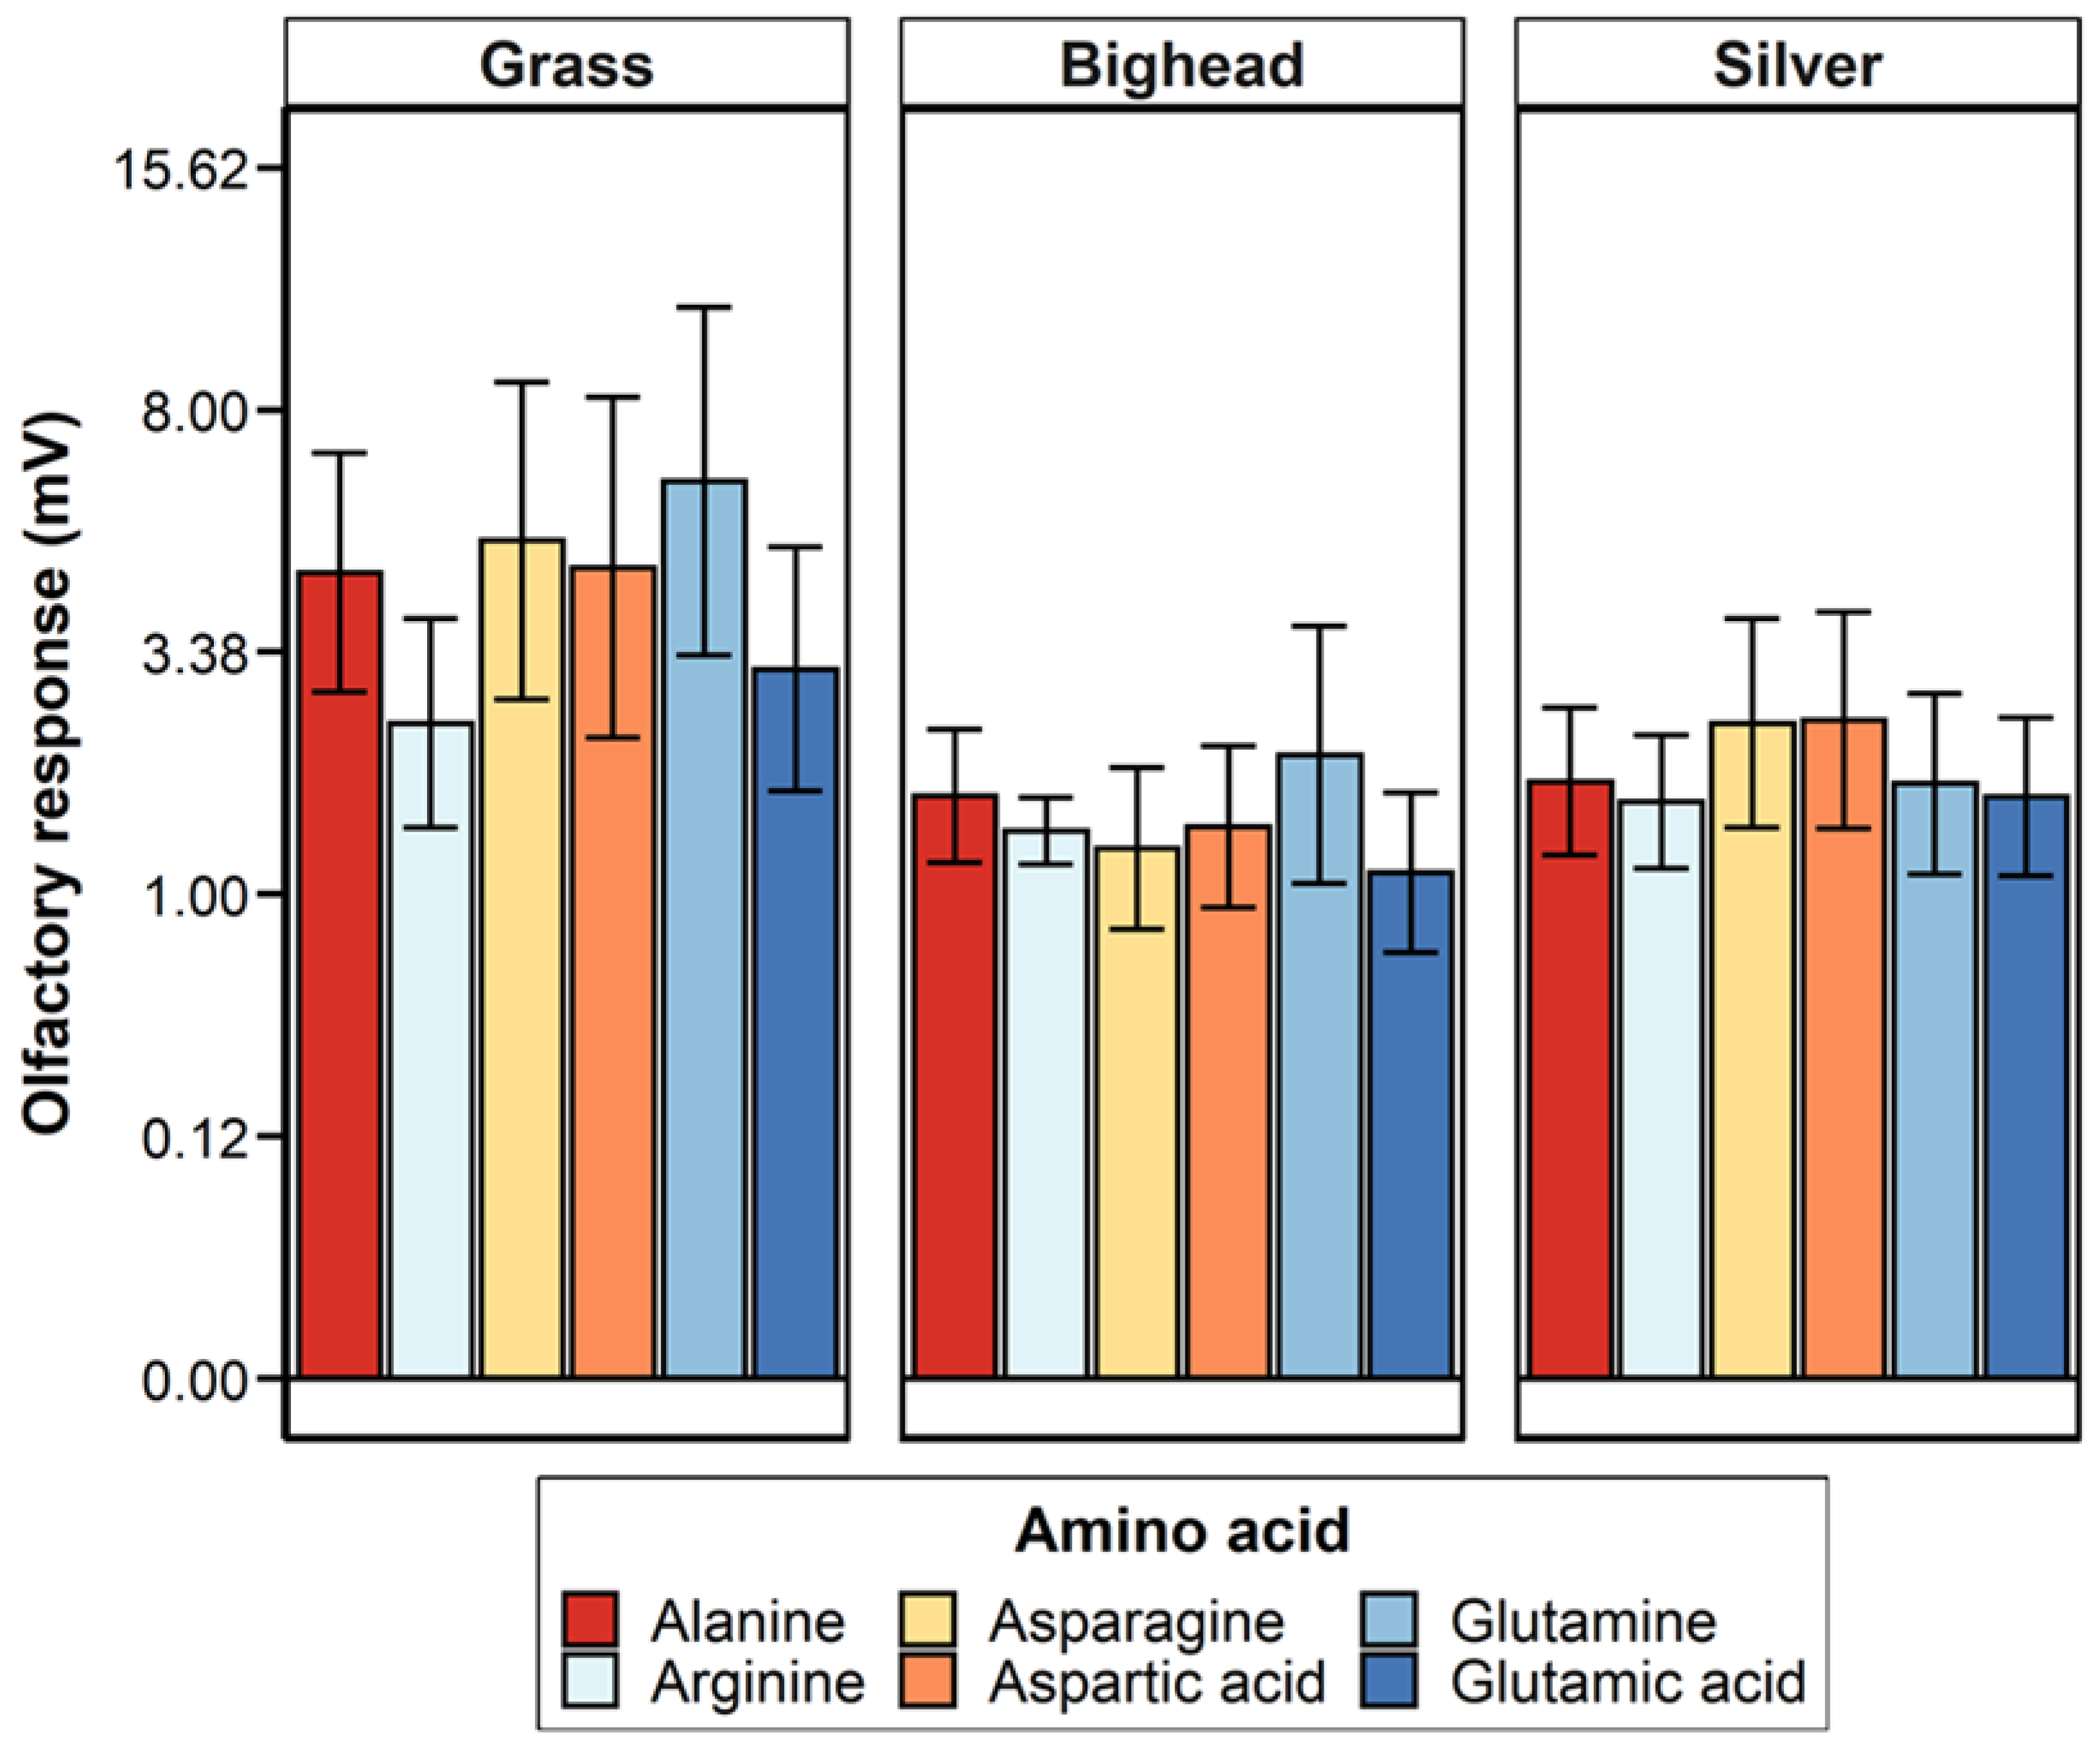
Two hypotheses were tested in this study: (1) grass carp would demonstrate a greater magnitude of electro-olfactogram-measured (EOG) response to amino acid stimuli than bighead and silver carp, and (2) the six amino acids tested in this study would elicit differences in the amplitude of the EOG-measured response for grass carp, but bighead and silver carp would not. For differences among species, the primary result observed was a significantly greater magnitude of measured millivolt response (MMR) in grass carp compared to bighead and silver carp, supporting our hypothesis of a greater response for the herbivorous grass carp. Though the relative response of silver carp was statistically higher than that of grass and bighead carp, the low r
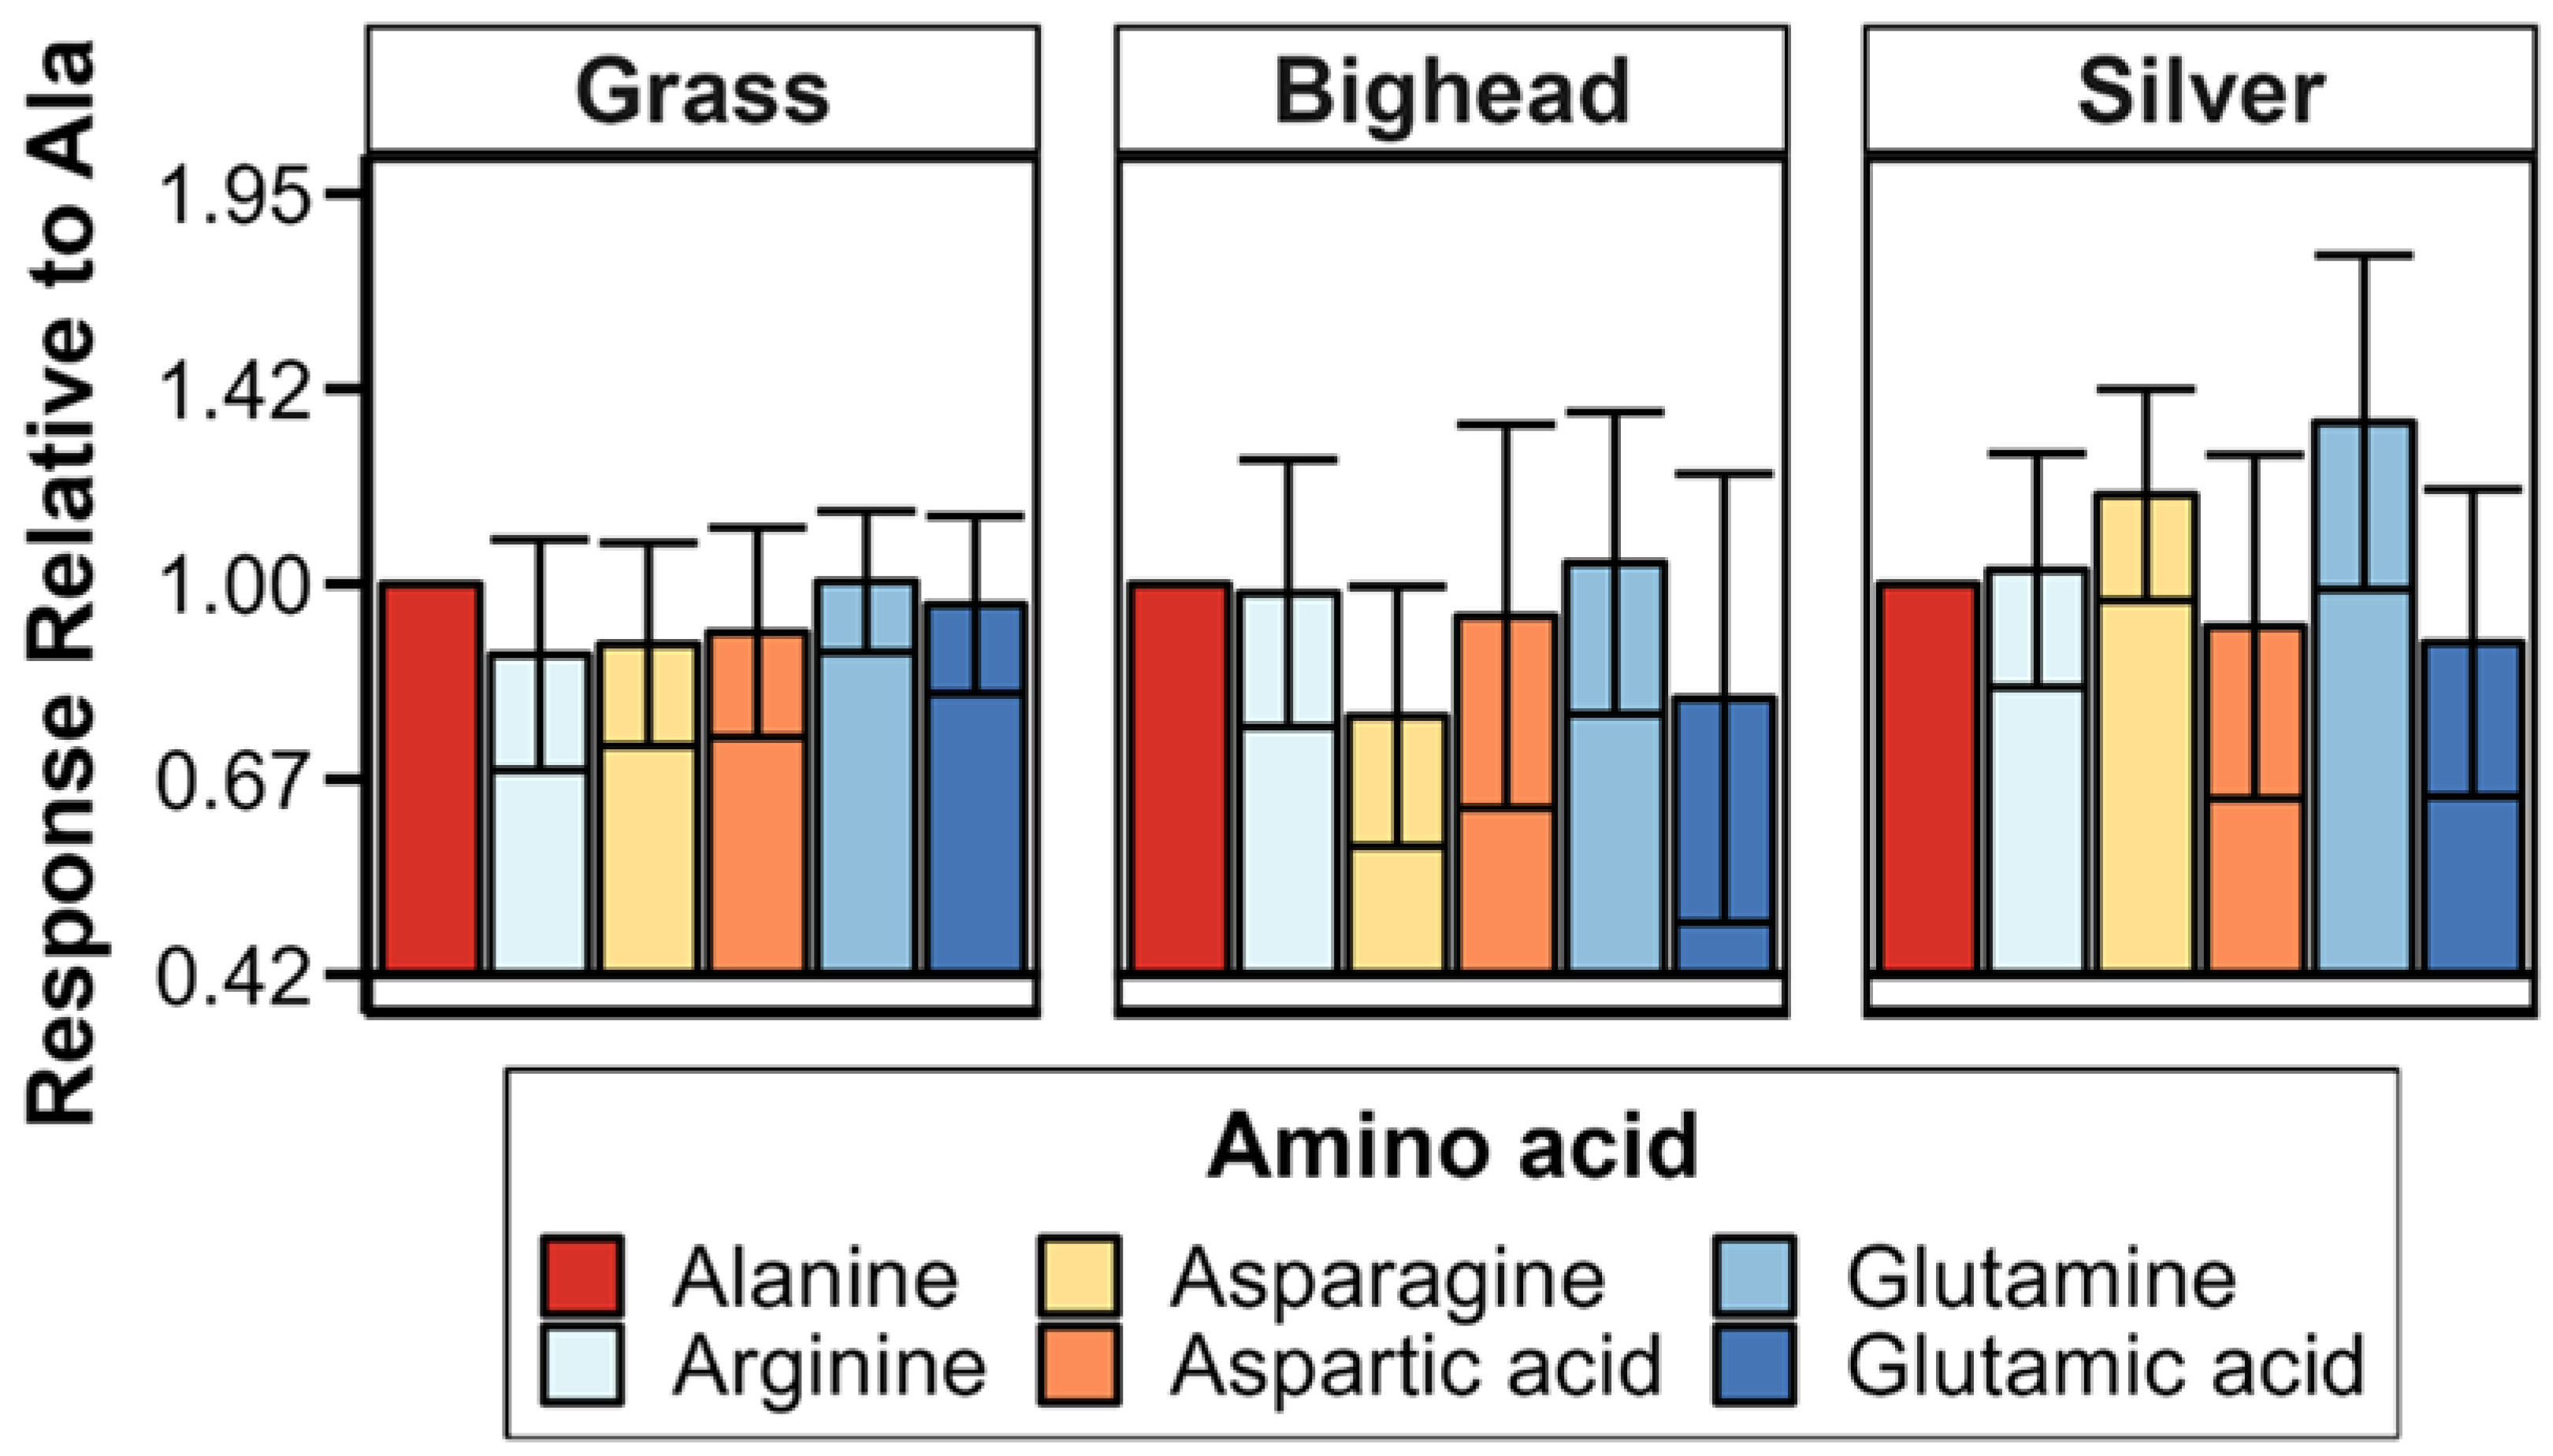
2 (0.04) for the species term in the multispecies relative response model, or otherwise the amount of variance accounted for by the species term in the model, suggests that this significant difference we observed was likely due only to the power of our statistical test as a result of the high number of observations we had to make the tests as opposed to a biologically meaningful difference. In all statistical tests we conducted, we found no significant differences in olfactory response to amino acids as a group or in paired comparisons. These results did not support our hypothesis of different EOG-measured responses to different amino acids, and they differ from EOG results previously reported for grass carp [
19] and another cypriniform fish, the goldfish [
21]. The power analyses estimated that to achieve a statistically significant response, we would need to more than double the number of amino acid exposures for any given test. This large increase and our original relatively large number of amino acid exposures, 252 across all species for MMR, strongly suggest that the number of trials conducted was sufficient to detect biologically meaningful differences among responses to amino acids.
The lack of significant differences in relative responses among the amino acids we tested contrasts with some, but not all, existing EOG studies on cypriniform fishes. In common carp, 10
−8 M L-glutamic acid, L-arginine, and L-glutamine solutions each elicit similar magnitudes of electrophysiological responses in the olfactory tract [
20]. These results are similar to our EOG results for grass, bighead, and silver carp. However, L-alanine and L-aspartic acid have both been found to elicit moderate electrical responses in common carp that are lower than those of a reference, which was L-glutamine at 10
−8 M [
20]. In goldfish exposed to different amino acids at 10
−3 M, L-arginine elicited the highest amplitude EOG response, low responses to L-aspartic acid and L-glutamine, and moderate responses to L-alanine and L-glutamic acid [
21], contrasting somewhat with the lack of difference we observed among these amino acids in the current study. A grass carp EOG study using larger individual fish and averaged responses to amino acids found differences among EOG responses that we did not observe [
19]. In terms of magnitude of peak EOG response, this previous grass carp work ranked amino acid responses relative to L-alanine as L-arginine = L-alanine > L-glutamic acid > L-aspartic acid. Compared to average responses assessed in other research [
19,
22], the intent of our study design, specifically using only initial responses to amino acids, was to assess the potential variability in the initial, short-term response of individual fish that one would expect after the sudden introduction of an amino acid into its environment, as might occur in management contexts. The focus on initial responses in our study is a likely reason we did not observe differences among EOG responses to amino acids that have been described in previous research on cypriniform fishes. A hypothetical consequence of the EOG results we observed is that behavioral responses to initial stimulation using amino acids could be more variable than previous EOG studies that have been based on average responses might indicate.
Another possible explanation for the lack of differences between amino acids that we observed compared to previous research may be the smaller size and likely age or ontogenetic stage of the grass carp we tested (4.1 to 16.0 g) compared to those tested previously (18 to 40 g; [
19]). The ontogenetic development theory is supported by previous work that has documented that olfactory rosettes in cypriniforms have multiple developmental stages that change with age [
35], and other fish species show changing responses to chemical stimuli through their ontogeny [
36]. In the closely related silver carp, the size and number of lamellae in the olfactory organ increase between young and older individuals [
35]. This increase likely also occurs in bighead carp and may increase their EOG-measured response, suggesting a possible explanation for the relationship between mass and MMR observed. The bighead carp tested included a wider range of masses (2.5 to 6.5 g), due mainly to the inclusion of both young-of-year fish and fish between one and two years of age. These results support the need for EOG tests across the ontogenetic development of a species. Regardless of the mechanism, in conducting the study as we did, our power analyses indicated the lack of a significant difference in response to the different amino acids tested was due to a lack of differences among responses and not a lack of statistical power.
Secondary, but still important, are the observations that increased water temperature was associated with significantly increased MMR in grass carp, and increased mass was associated with significantly increased MMR in bighead carp. Grass carp show depressed feeding responses at temperatures of 17 °C compared to warmer temperatures [
37]; it is possible that grass carp lose olfactory-measured responsiveness to food cues, e.g., amino acids, at lower water temperatures. There is some indication that grass carp “taste preference” for amino acids varies with temperature: at 20 °C, L-alanine, L-histidine, and L-cysteine are feeding stimulants, while L-histidine and L-valine are feeding stimulants at 13 °C [
18,
38]. We did not test for temperature EOG-measured response thresholds, but we did find an overall decrease in amino acid EOG-measured response with decreasing water temperature in grass carp. The lower EOG response of grass carp could correlate with a decreased behavioral response to amino acids at lower temperatures; this possible temperature effect is a potential direction for future research.
In general, the EOG signals that we observed were similar to what other studies have observed in response to amino acids. Both goldfish and grass carp exposed to a brief stimulus of 0.5 to 1.0 mL of dilute amino acid solution exhibit a right-skewed, peak-type electrical signal lasting for several seconds [
19,
21]. Fathead minnows exposed to an unknown volume of 10
−6 M L-arginine (3 s exposure) exhibit a similar response shape to grass carp and goldfish, but the response for fathead minnows had a longer recovery time than grass carp and goldfish [
19,
21,
23]. For goldfish exposed to 0.5 mL of 10
−3 M solutions of different amino acids, responses ranged from ~1 to ~4 mV [
20]. For grass carp, the peak height of the EOG response can vary among amino acid concentrations. In previous research on grass carp exposed to 1 mL of diluted L-methionine solution, responses ranged from ~3 to ~13 mV for L-methionine concentrations of 10
−7 to 10
−3 M [
19]; the mean response value of 5.92 mV for grass carp exposed to 10
−4 M amino acids in our study fell within this previously reported range.
Between 10
−9 and 10
−7 M is the approximate range of individual dissolved amino acid concentrations in the lower Mississippi River [
39], one of the North American waterways where grass, bighead, and silver carp are found [
3,
10]. Because we wanted to use a sufficiently high amino acid concentration to detect potential differences between species and responses to different amino acids, we did not test amino acid concentrations other than 10
−4 M. Other research shows that grass carp begin to have olfactory responses to amino acids between 10
−9 and 10
−7 M, and the magnitude of the EOG response to amino acids generally increases with concentration from 10
−7 to 10
−3 M [
19]. Further research is needed to determine if the electrical amplitude of the EOG response or the concentration of amino acids correspond to increases in behavioral responses, such as attraction or avoidance.
The results from this study can be used to hypothesize that all amino acids tested have the potential to elicit a behavioral response in all the species tested. Previous research indicates that a mixture of 18 L-amino acids increases buccal pumping in bighead and silver carp [
13]. Based on one replicate per compound for behavioral trials and three grass carp per compound for EOG trials in which any data that exhibited a 5% change in amplitude was discarded, it was found that L-arginine elicits a larger EOG response than L-alanine and L-glutamic acid at 10
−3 M, but that, behaviorally, grass carp bit bait balls formulated with L-alanine more frequently than those containing L-arginine and L-glutamic acid [
26]. Future research could test the hypothesis that there is a correlation between EOG response level and intensity of behavioral response, e.g., attraction or avoidance of an amino acid stimulus. Based on our results, such research could test for a more intense response to amino acids in grass carp compared to bighead and silver carp, or it could test for an increasing behavioral response to amino acids in grass carp with increasing water temperature. Though not likely given the high degree of difference in feeding ecology between grass carp and bighead and silver carp [
3,
4,
11,
28], there is a slight possibility of a conditioned response to the diet used to culture the fish in this study due to differences in diet and time in captivity. Grass carp were fed a flake food mixture for a longer period than the bighead and silver carp, and their diet contained pellets absent from the diets of the bighead and silver carp. Amino acid content analyses of the diets used in this study and/or studies of invasive carp raised on foods they normally consume in North American waterways would be needed to examine this possibility.
In natural environments, amino acids would likely be present as mixtures of multiple compounds with varying concentrations. Another way of more closely emulating the environment of invasive carps would be to test amino acid mixtures in addition to individual amino acids, as most, if not all, food items for these fish contain multiple amino acids. Such amino acid mixtures have been shown to elicit physiological responses in bighead and silver carp [
13]. Another area of future research before applying amino acids as a management tool is the feasibility of recreating laboratory concentrations of amino acids in field settings and the effects of introduced amino acids on aquatic ecosystems.
The detection of olfactory stimuli is important for foraging, predator avoidance, and reproduction in grass carp and other fish species. Olfactory stimuli can promote attraction to and consumption of food [
18]. Predator avoidance can also be triggered by the detection of compounds from predator species [
14] or alarm compounds from conspecifics or other prey fish [
40]. Many fish species also use olfactory signals in reproduction. For example, pheromones released by male herring (
Clupea harengus) may serve to facilitate the coordination of male reproductive behavior [
41].
Before the amino acids tested here can be used as a tool for modifying the behavior of any of these species to help control them, behavioral tests are needed. The goals of these tests would be to determine if the sensing of these compounds elicits a behavior, at what concentrations they elicit behavior, and whether any observed behaviors are ones of attraction or avoidance. If elicitation and direction of behavior are demonstrated, a key to the successful application of one of these amino acids as an effective tool may be the concentration needed to elicit the desired behavior. The 10
−4 M concentration used in this study and previous EOG studies (e.g., [
23]) is a concentration that might reasonably be attained in a natural system. Overall, the results from this work suggest that all three species tested sense the presence of the amino acids tested, with grass carp showing the greatest magnitude of EOG response. Understanding how the olfactory response of grass carp to compounds such as those studied here relates to behavioral responses may allow managers to employ attractants and/or repellants to aid in the management of invasive populations.

 ,
, 


