Article

Decomposition Rates of Suppression-Produced Fish Carcasses in a Large, Deep, High-Elevation Lake in North America

by
Hayley C. Glassic
1,*,
Christopher S. Guy
2,
Lusha M. Tronstad
3,
Michelle A. Briggs
4,
Lindsey K. Albertson
4,
Dominique R. Lujan
5 and
Todd M. Koel
6
1
U.S. Geological Survey, Northern Rocky Mountain Science Center, Formerly Montana Cooperative Fishery Research Unit, Department of Ecology, Montana State University, Bozeman, MT 59717, USA
2
U.S. Geological Survey, Montana Cooperative Fishery Research Unit, Department of Ecology, Montana State University, Bozeman, MT 59717, USA
3
Wyoming Natural Diversity Database, University of Wyoming, Laramie, WY 82071, USA
4
Department of Ecology, Montana State University, Bozeman, MT 59717, USA
5
Department of Zoology and Physiology, University of Wyoming, Laramie, WY 82071, USA
6
U.S. National Park Service, Yellowstone Center for Resources, Native Fish Conservation Program, Post Office Box 168, Yellowstone National Park, WY 82190, USA
*
Author to whom correspondence should be addressed.
Fishes 2023, 8(8), 385; https://doi.org/10.3390/fishes8080385
Submission received: 19 June 2023 / Accepted: 10 July 2023 / Published: 25 July 2023
(This article belongs to the Special Issue Advances in Ecology and Management of Aquatic Invasive Species)

Abstract

:
The decomposition of vertebrates in lake ecosystems has been largely understudied despite being a vital part of ecosystem processes. Invasive lake trout (Salvelinus namaycush) invaded Yellowstone Lake and caused a decline in the native Yellowstone cutthroat trout (Oncorhynchus clarkii bouvieri) population. To restore Yellowstone cutthroat trout, lake trout were suppressed by gillnetting annually since 1995 and has continued to present, with most carcasses deposited in the profundal zone (>70 m). As a part of suppression management, a fraction of carcasses from gillnetting were ground and placed on littoral spawning sites (causing lake trout embryo mortality via hypoxia). We conducted experiments (2018 and 2019) to determine how carcass state (i.e., whole vs. ground) and location of deposition (i.e., profundal or littoral) affected decomposition rates. Whole carcasses in the depths of Yellowstone Lake decomposed nine times slower (rate of decay, k = −0.0075 day−1; 95% CI = −0.0063–−0.0089) than ground carcasses in the littoral zone (k = −0.0679 day−1; 95% CI = −0.0590–−0.0768). Whole carcasses had a half-life of 91 days while ground carcasses had a half-life of 10 days. We showed that carcass state and location cause a differential decomposition for lake trout carcasses in Yellowstone Lake. Understanding carcass persistence in lakes can inform the management of suppression-produced carcasses in large lakes and provide insight into potential effects of carcass deposition from other sources, such as spawning events or fish kills, on nutrient cycling.
Key Contribution: We expand upon the knowledge surrounding the rate of decomposition for fish carcasses in lakes.

1. Introduction

Decomposition recycles organic nutrients and energy within ecosystems, making limiting nutrients available to microbes [1]. Plant detritus is often identified as the main decomposition pathway in aquatic ecosystems [2,3,4]. However, carrion is also an important decomposition pathway. Carrion, such as a whale carcass [5,6,7,8], can create concentrations of biological diversity, sometimes resulting in increased ecosystem heterogeneity. Mass die-offs of fish are an example of carrion that results in essential contributions of nutrients for aquatic and terrestrial ecosystems [9]. Contributions of fish carrion to decomposition pathways are well-studied, but most of the research focuses on lotic ecosystems while far fewer lentic studies exist [9,10].
Despite the fact that decomposition is well studied in the deep ocean [11,12,13], the rate of fish carcass decomposition at the sediment surface of lakes is poorly documented [14]. Studies conducted in the deep ocean are not applicable to lakes due to disparities in decomposer communities, temperature regimes, and water chemistry. Some research has been conducted regarding fish carcasses in lakes with [15] and without [14,16] massive fish mortality, concluding that fish carcasses can represent a substantial water-to-sediment flux of nutrients [14,15,16]. However, these studies [16] did not investigate the factors influencing the decomposition rates of carcasses and were limited to small (<0.2 km2) lakes [14,16]. Carcass decomposition in large lakes (>100 km2) is understudied.
Yellowstone Lake is a large (341 km2) freshwater ecosystem where an introduced species, lake trout Salvelinus namaycush, was discovered in 1994 [17]. The introduction of lake trout caused a trophic cascade by reducing the abundance of the native keystone species, Yellowstone cutthroat trout Oncorhynchus clarkii bouvieri, through predation [18,19,20,21]. The National Park Service (NPS) initiated a lake trout suppression program in 1995 [22] with the original objectives to reduce Yellowstone cutthroat trout predation through lake trout removal [20,22,23] and fatally gillnetted 4.5 million lake trout by October 2022 [24]. The swim bladders of gillnetted fish were deflated with an abdominal cut and carcasses were discarded throughout Yellowstone Lake at depths ≥70 m. Recently, ground lake trout carcass deposited on lake trout spawning substrates has been used as a complementary suppression strategy to cause lake trout embryo mortality via hypoxia [25,26]. Lake trout suppression in Yellowstone Lake resulted in two novel groups of fish carcasses: ground carcasses deposited on littoral spawning substrates from late August through October and whole carcasses discarded from May through October at depths ≥70 m. Ecosystem processes have largely been studied due to natural die offs and less is known about how sustained, massive die offs (from suppression) can affect ecosystems.
This study expands upon the information surrounding fish carcass decomposition in large (>100 km2) lakes. Additionally, we have the unique opportunity to study a lake without massive natural mortality events but has continuous massive mortality events due to invasive species suppression. The concentration of fish carcasses (i.e., profundal or littoral carcass management sites) in relation to invasive species suppression or by experimental manipulations has largely been understudied [15]. Understanding the implications of carcass management, or how carcasses are processed and deposited, can result in the most efficient use of carcasses in invasive species suppression programs. Here, we answer the question: how does the state of carcass material and location of deposition affect the decomposition rate? We predict that ground carcasses in the littoral zone will decompose faster than whole carcasses in the profundal zone due to warmer water temperatures and a higher carcass surface area.

2. Materials and Methods
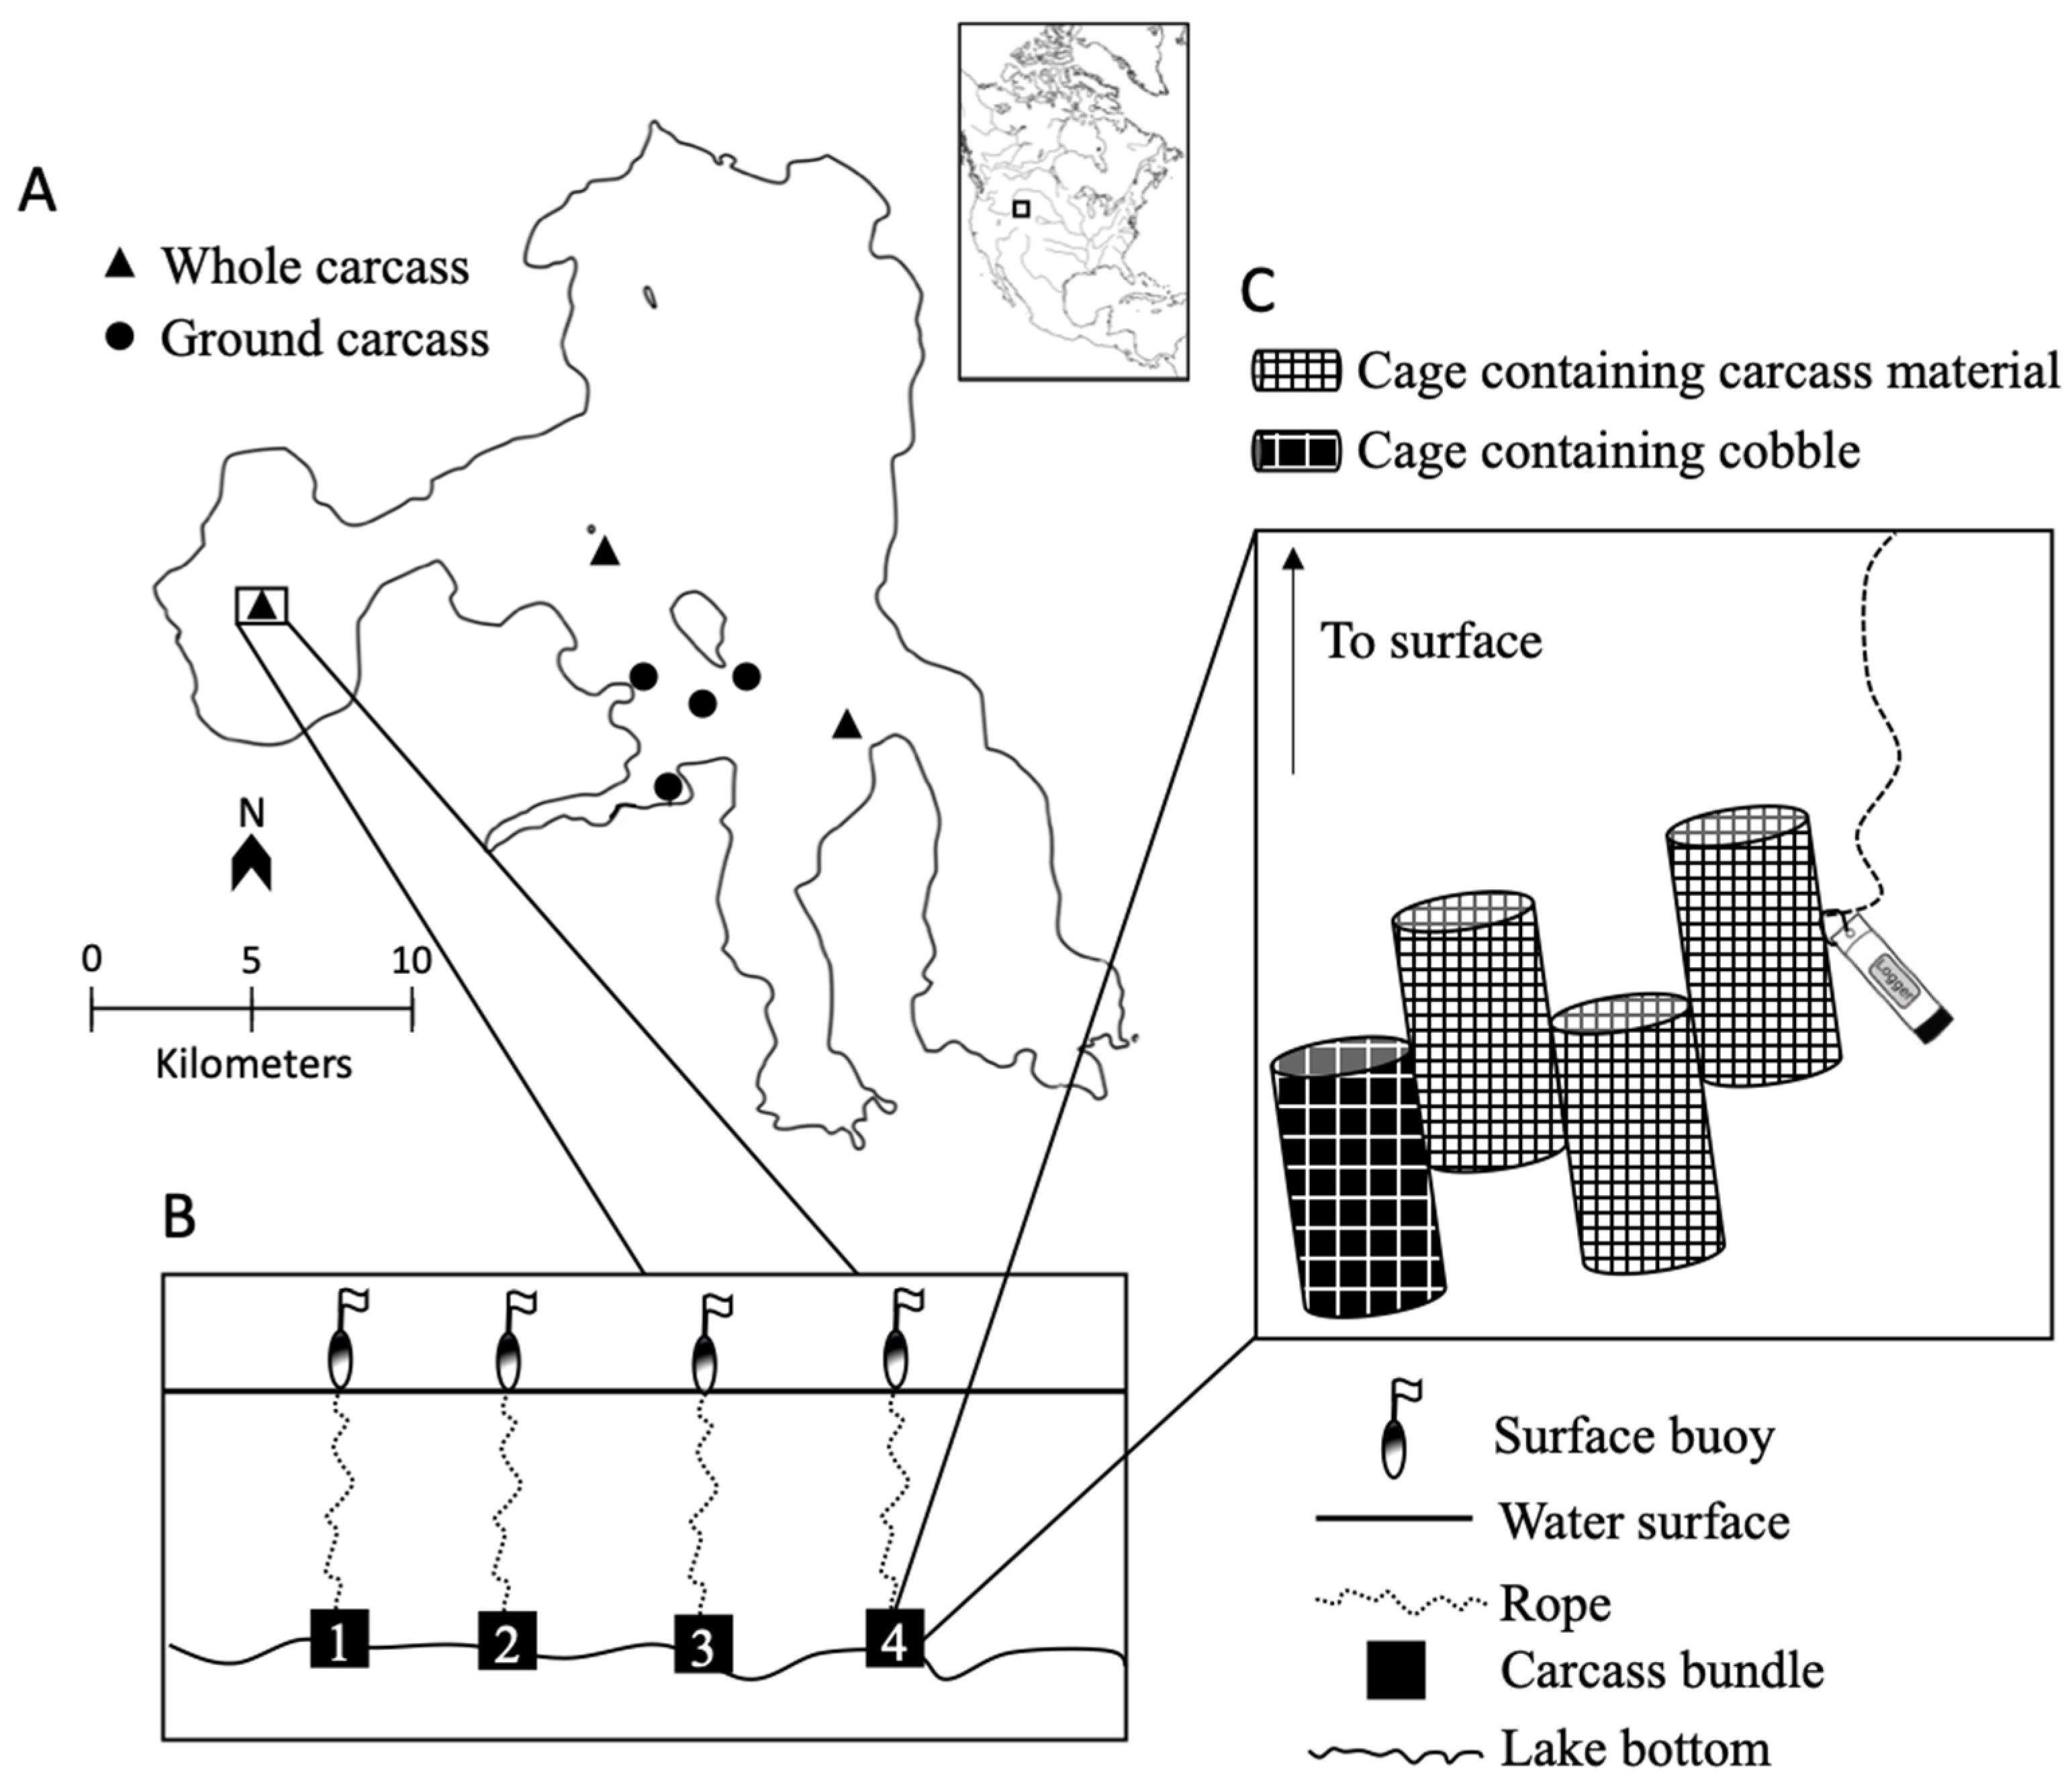
2.1. Study Site

Yellowstone Lake is the largest (341 km2) high-elevation (above 2000 m) lake in North America (Figure 1). Ice cover forms every winter, with ice melting in late May or early June. Yellowstone Lake is a mesotrophic [27], dimictic lake with an average monthly water temperature range from 9 to 18 °C during the open water season [28]. Twenty-three percent of the lake surface area is <20 m deep [29]. The mean depth of Yellowstone Lake is 43 m [30].

2.2. Experimental Setup and Sampling

We estimated the rate of decay in ground carcasses in the littoral zone and whole carcasses in the profundal zone. Contract gillnetters collected carcasses (adult lake trout in post-winter body condition and before spawning condition) from gillnetting events the day before whole or ground experiments were launched. Carcasses were weighed before placement into the steel woven wire-mesh cages (mesh size 1.27 cm; 1/2 in). We recorded initial carcass weights and inserted a label into each wire-mesh cage with the deployment weight to ensure correct comparison of change in weight from deployment to retrieval. One bundle of wire-mesh cages consisted of three cages with carcass material, and one cage of cobble to facilitate negative buoyancy (Figure 1). Each cage contained 2–5 kg wet mass of either whole or ground carcass material.
We deployed whole carcass bundles on the benthos at approximately 70 m below the lake surface. At each site, four bundles were deployed in June 2018 and 2019. During 2018, four sites were used for whole carcass experiments, and recovery periods were two, four, six, and eight weeks (Figure 1; Table 1). In 2019, three sites were used, and recovery periods were 4, 8, 12, and 16 weeks (Figure 1; Table 1). The last bundle retrieved over the experiment period included a MiniDOT logger (PME, Inc., Vista, CA, USA) attached to the wire mesh that recorded temperature and dissolved oxygen at 1 h intervals during the experiment. We pooled temperature and dissolved oxygen measurements among locations. The remaining carcass material during retrieval was collected and weighed as a wet weight. When retrieved, some carcasses cages had significant accumulation of bottom sediment and were removed from the final analysis (N = 5 cages).
Lake trout carcasses were ground using a CHP-H22 Piranha Bait Chopper (Yaquina Boat Equipment, Toledo, OH, USA) and added to carcass bundles in the littoral zone. We deployed ground carcass bundles on the benthos at approximately 10 m in depth. Four wire-mesh cage bundles were deployed at four sites for ground carcass decomposition monitoring in 2018 (Figure 1; Table 1). Wire-mesh bundles were retrieved after one, three, and five weeks. The last bundle to be retrieved included a MiniDOT logger (PME, Inc.) attached to record temperature and dissolved oxygen at 1 h intervals during the experiment, pooled among locations. The remaining carcass material at retrieval was collected and weighed for wet weight.

2.3. Dry Mass Corrections

We calculated the percentage of mass loss as the quotient of final weight and initial weight using wet weight. Dry mass (DM) was not collected at the field site due to safety concerns (attracting bears) and logistical constraints of using a furnace at the field site. We did not subsample experimental carcasses for dry mass corrections. Instead, we calculated DM using three replicates of whole carcasses deployed for four weeks and ground carcasses deployed for one, two, and four weeks, each with three replicates. Due to field logistical constraints, we could not deploy whole carcasses used for DM calculations for the same length of time as experimental carcasses. We used a previously published DM value for the two-week deployment [31] (Table 2). We made assumptions to calculate whole carcass DM for 6, 8, 12, and 16 weeks. We assumed DM for six and eight weeks would have the same percent wet mass as four weeks. We also assumed 12- and 16-week DM would be equivalent to the lower confidence interval for the 4-week percent wet mass (Table 2). Ground carcass DM at three weeks was assumed to be the average of the two- and four-week DMs, and five weeks was assumed to have the same DM as four weeks (Table 2).
We deployed three carcass replicates for each period above (i.e., one, two, and four weeks, where four weeks had ground and whole replicates). We dried the material in an oven at 90 °C. We measured the mass each day over a three-day period. Samples were considered dry if the mass was within 0.01 g of each measurement over the three-day period [31].

2.4. Constant Rate of Decay (k) and Half-Life

The constant rate of carcass material decomposition (k) was calculated for comparison to other fish:
ln x i = ln x 0 k t ,
where x i is the remaining mass (g) at time i (days), x0 is the initial mass (kg), t is the time in days, and k is the constant rate of decay (d−1) [14,32]. Half-life (t1/2) was calculated using the mean decay rate for the carcass state:
t1/2 = k−1 × ln(2),
which produced the number of days a lake trout carcass was in the lake and half the mass had decayed [33]. We performed all statistical analyses in R version 4.1.3 [34].

3. Results

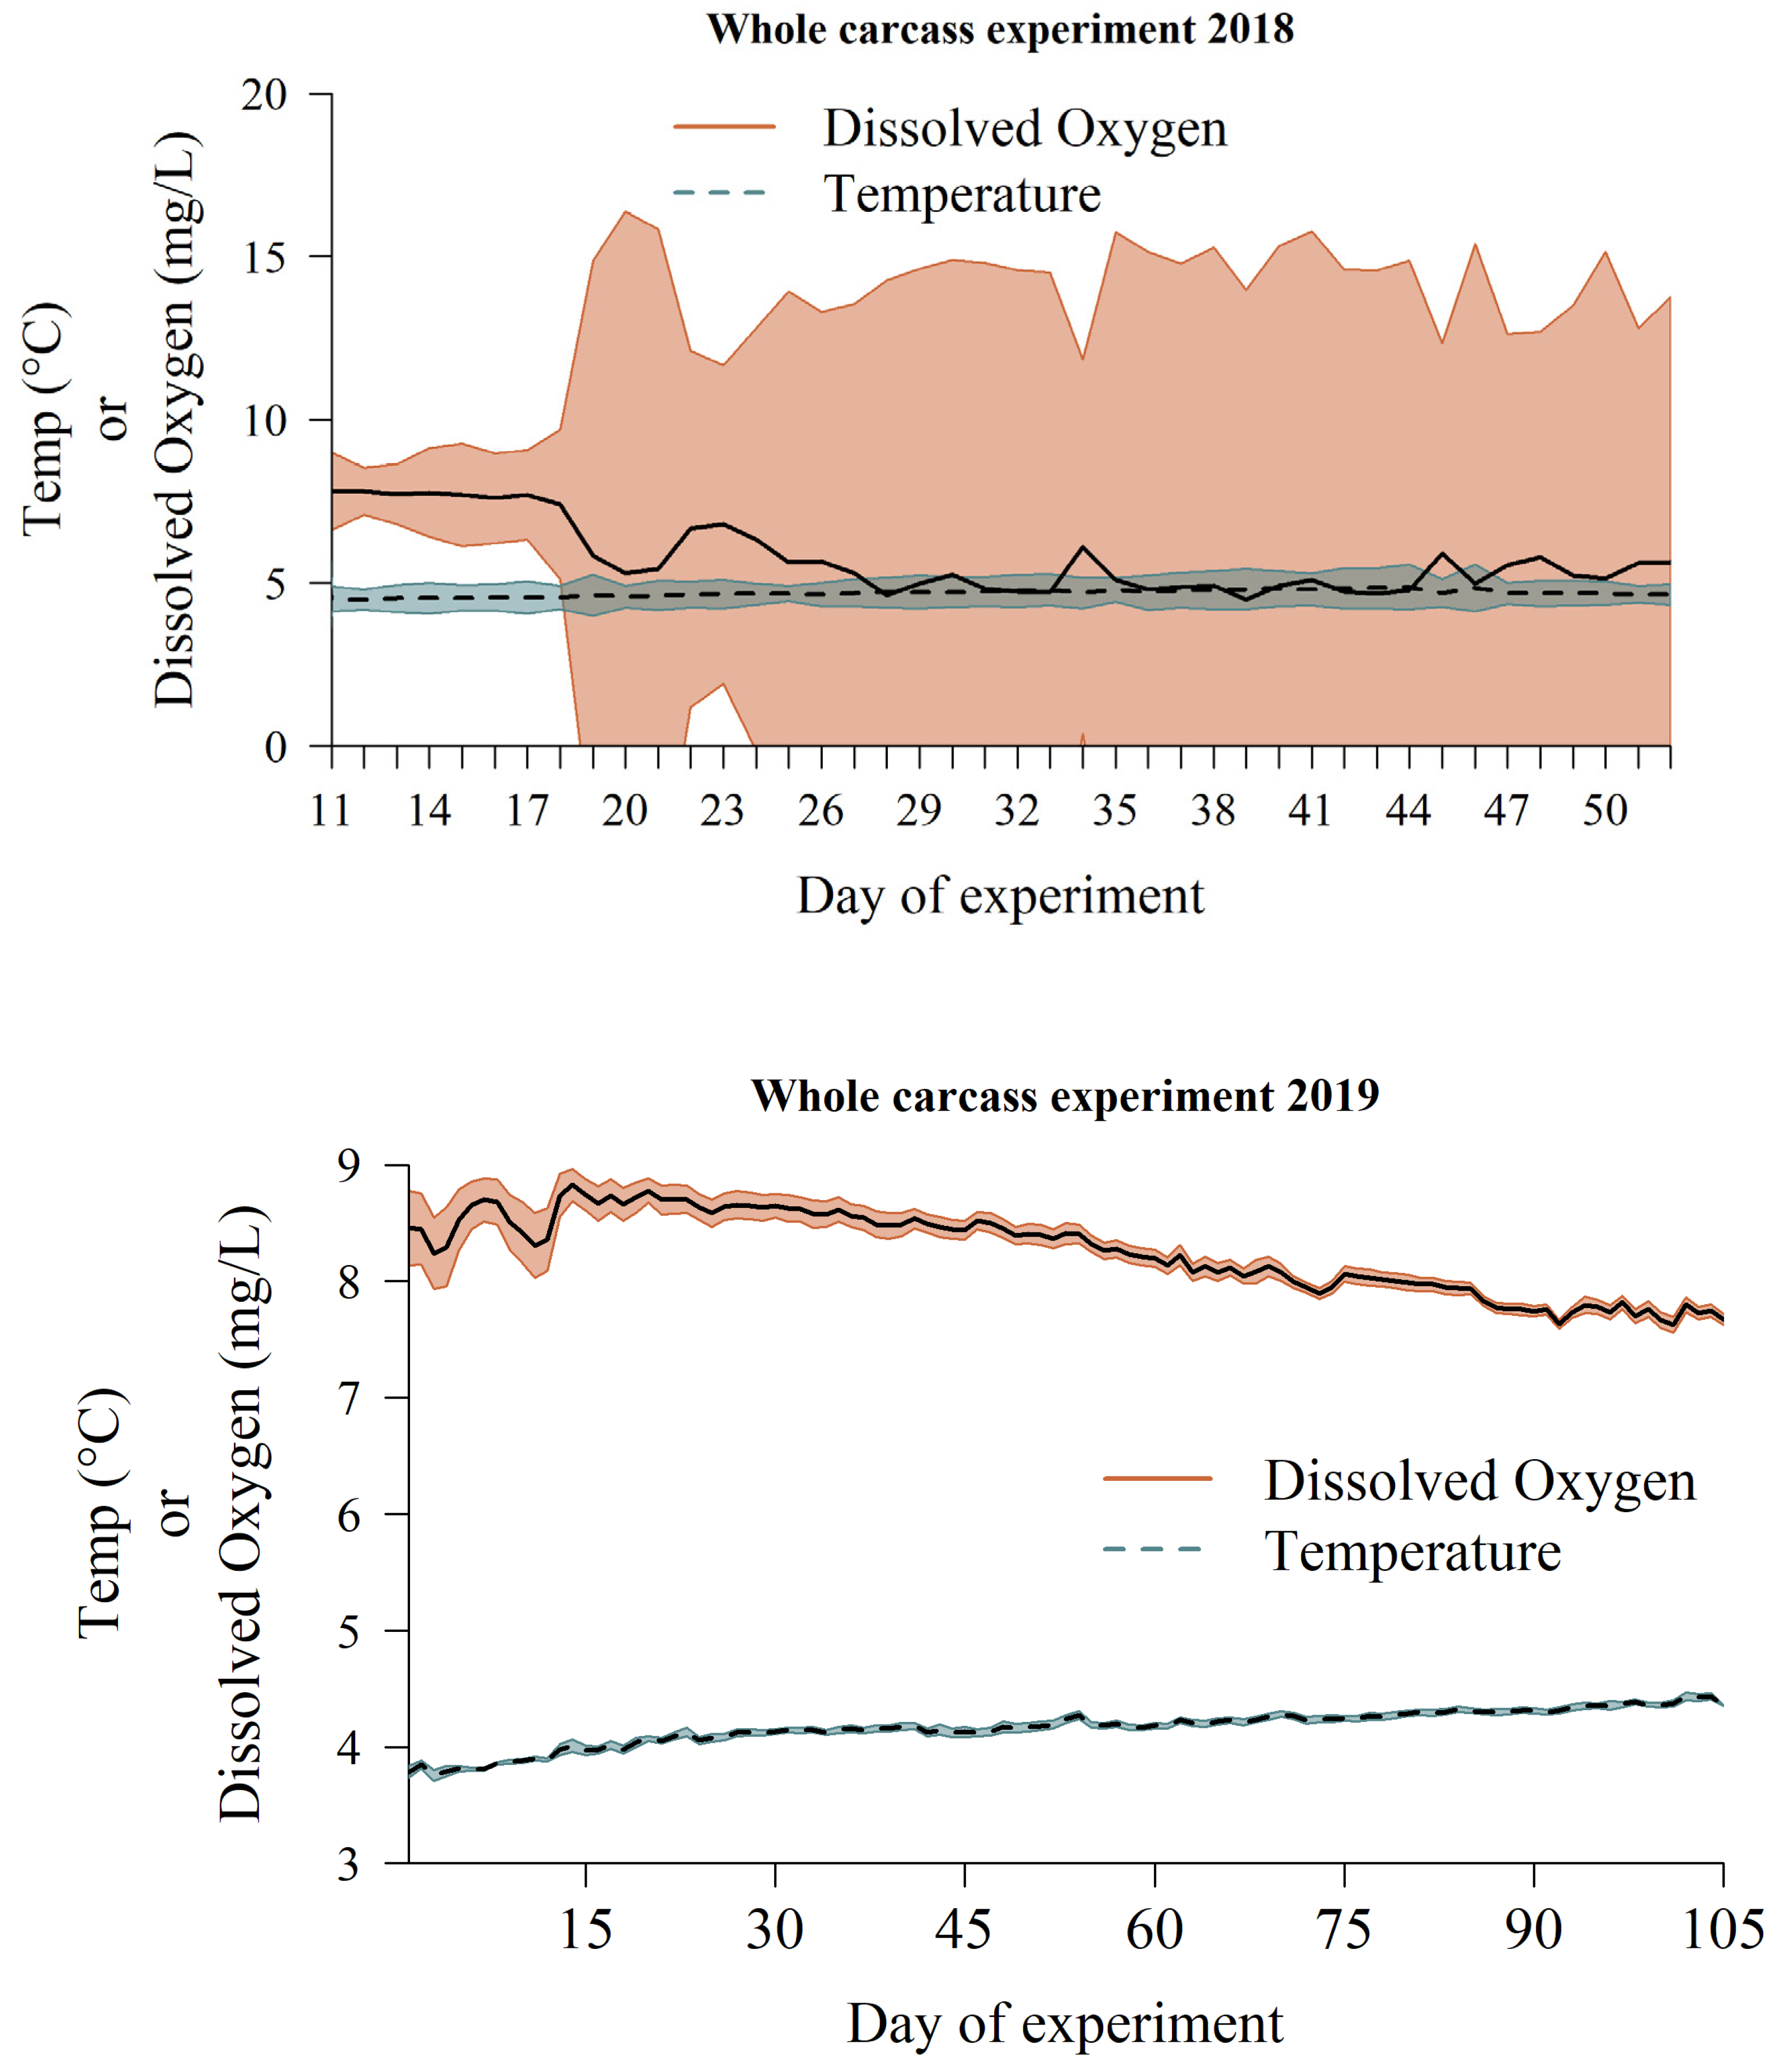
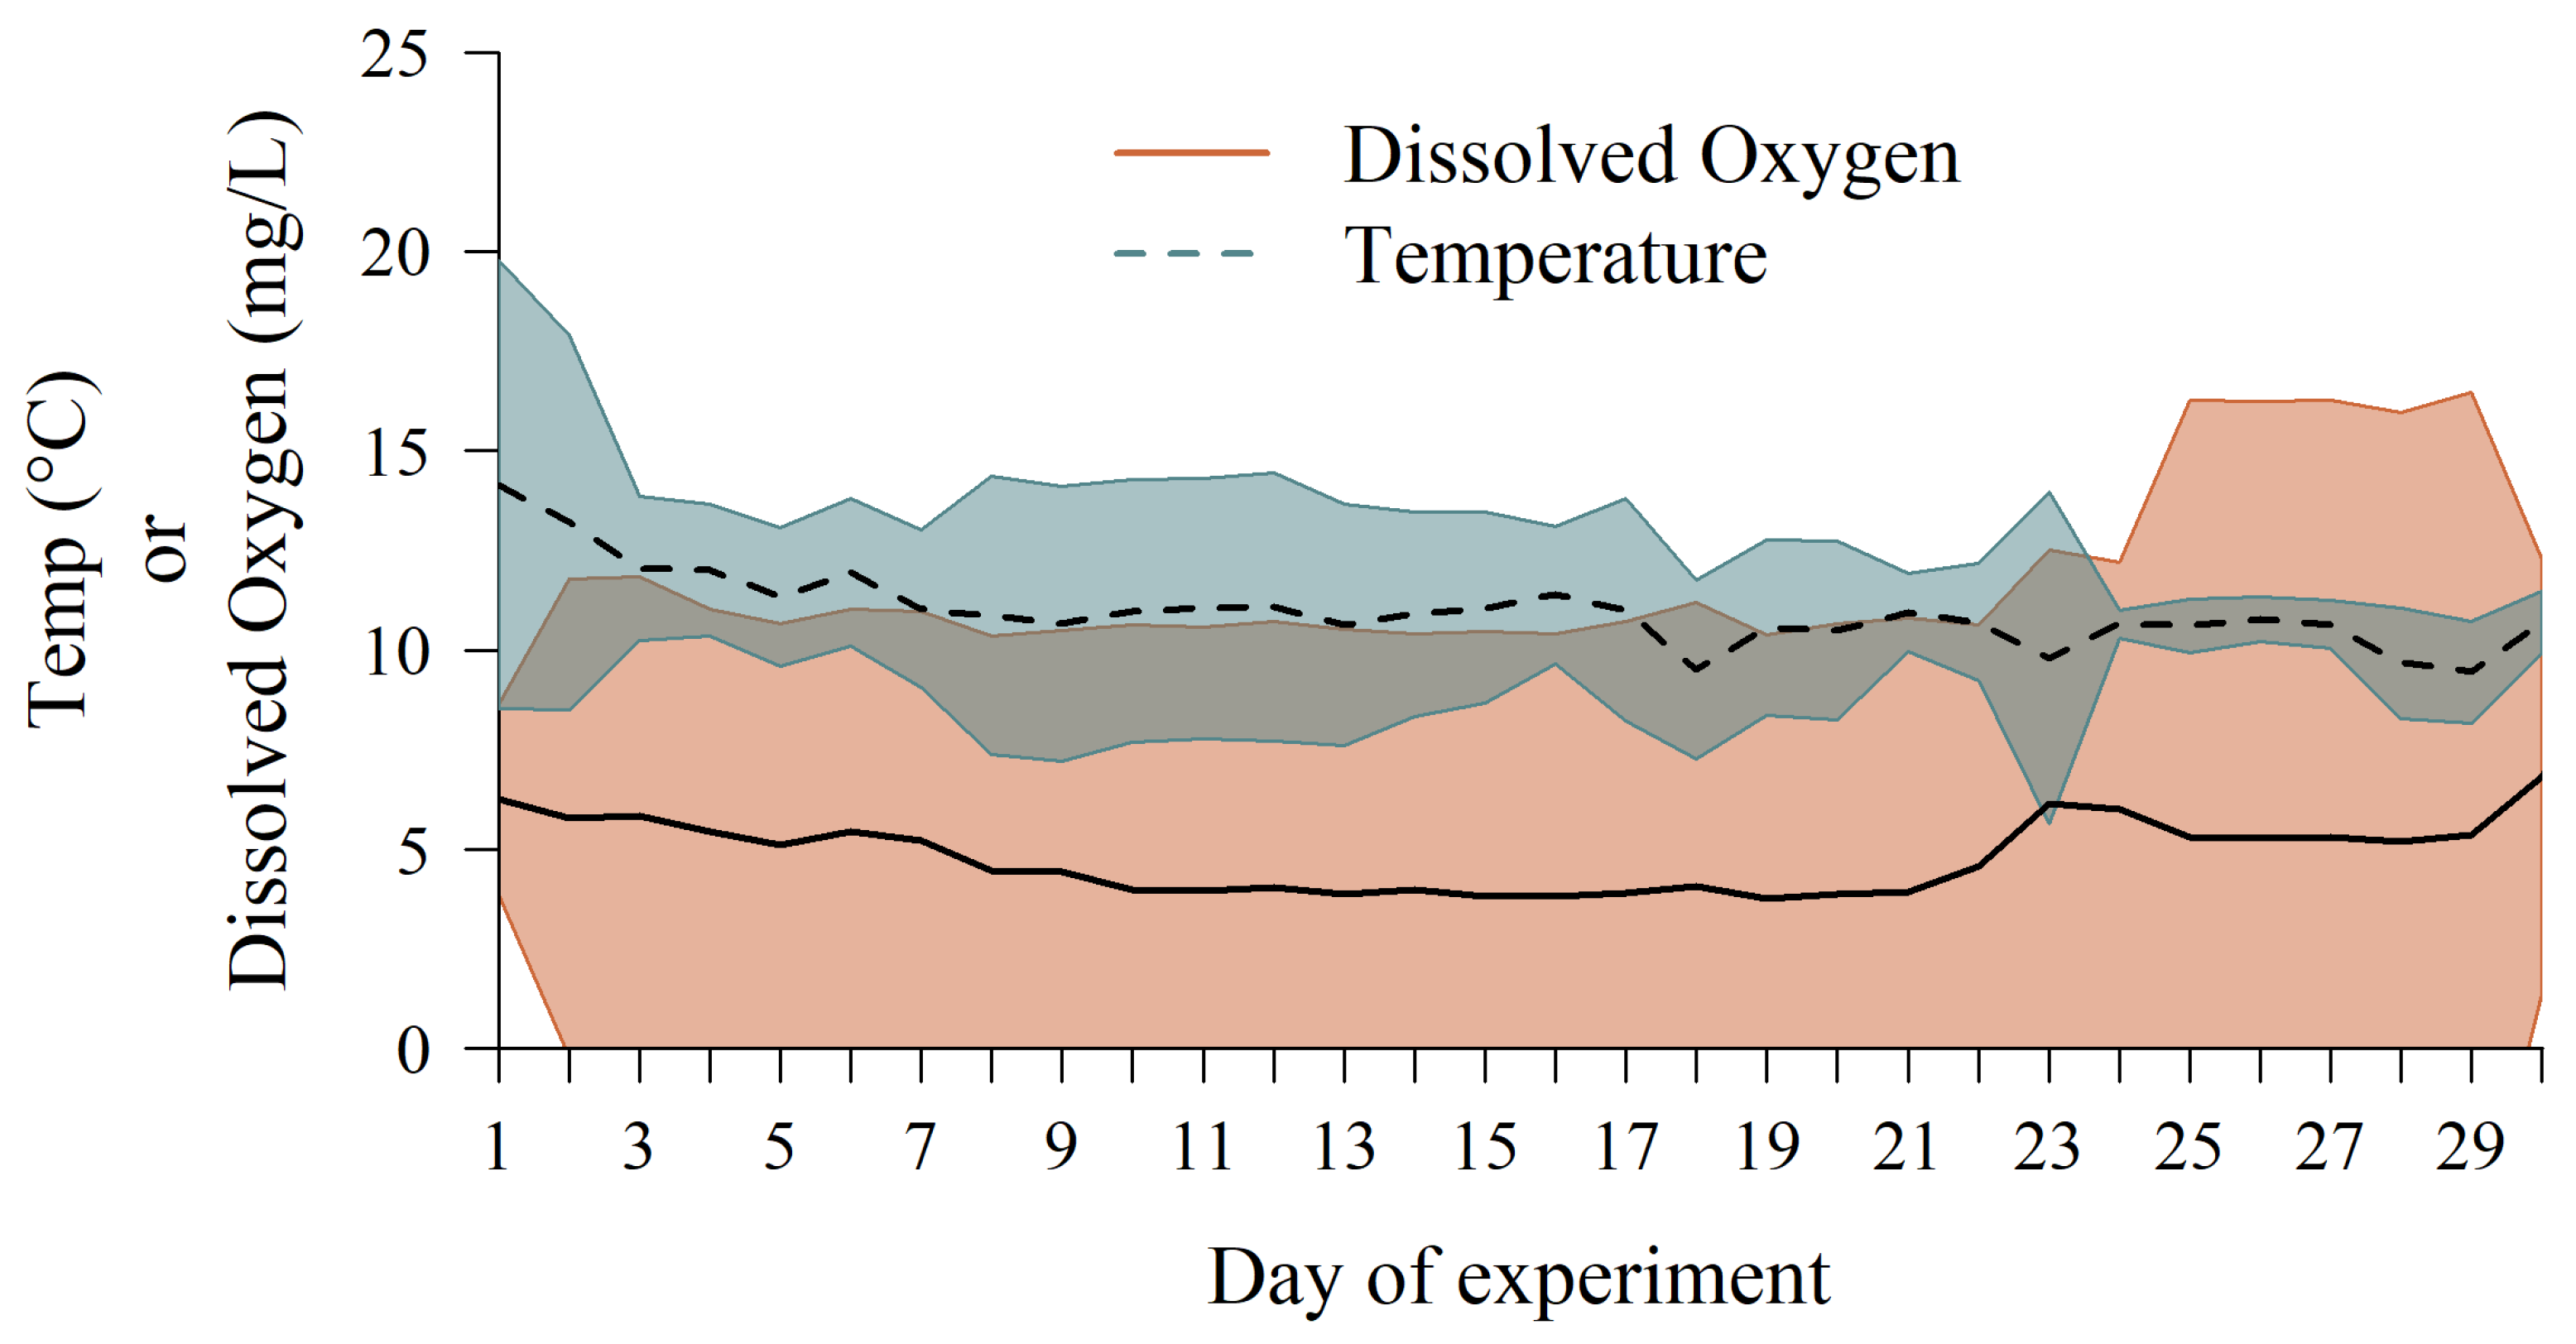
3.1. Temperature and Dissolved Oxygen

3.1.1. Whole Carcasses in the Profundal Zone

The mean daily water temperature for whole carcass experiments in the 2018 season was 44.7 °C (95% confidence interval; CI = 44.0–5.6 °C), and 44.2 °C in the 2019 season (CI = 33.7–44.5 °C; Figure A1). The mean daily dissolved oxygen for whole carcass experiments in 2018 pooled among locations was 6.0 mg L−1 (CI = 0–12.8 mg L−1). In 2019, the average daily dissolved oxygen was 8.1 mg L−1 (CI = 8.0–8.2 mg L−1; Figure A1). The larger confidence intervals for dissolved oxygen in 2018 were due to one site having extremely low (<1 mg L−1) measurements. However, the decreases in dissolved oxygen at that site were not consistent, making the conclusion that the logger was submerged in sediment or malfunctioning difficult. Therefore, we did not exclude those measurements. Thick fungus mycelial mats were observed on whole carcass experiments as early as week two of retrieval (Figure A2).

3.1.2. Ground Carcasses in the Littoral Zone

The average daily temperature for ground carcass experiments across the 2018 season was 11.0 °C (CI = 8.7–13.3 °C; Figure A3). The average daily dissolved oxygen for ground experiments was 4.9 mg L−1 (CI = 0–11.8 mg L−1).

3.2. Dry Mass Corrections

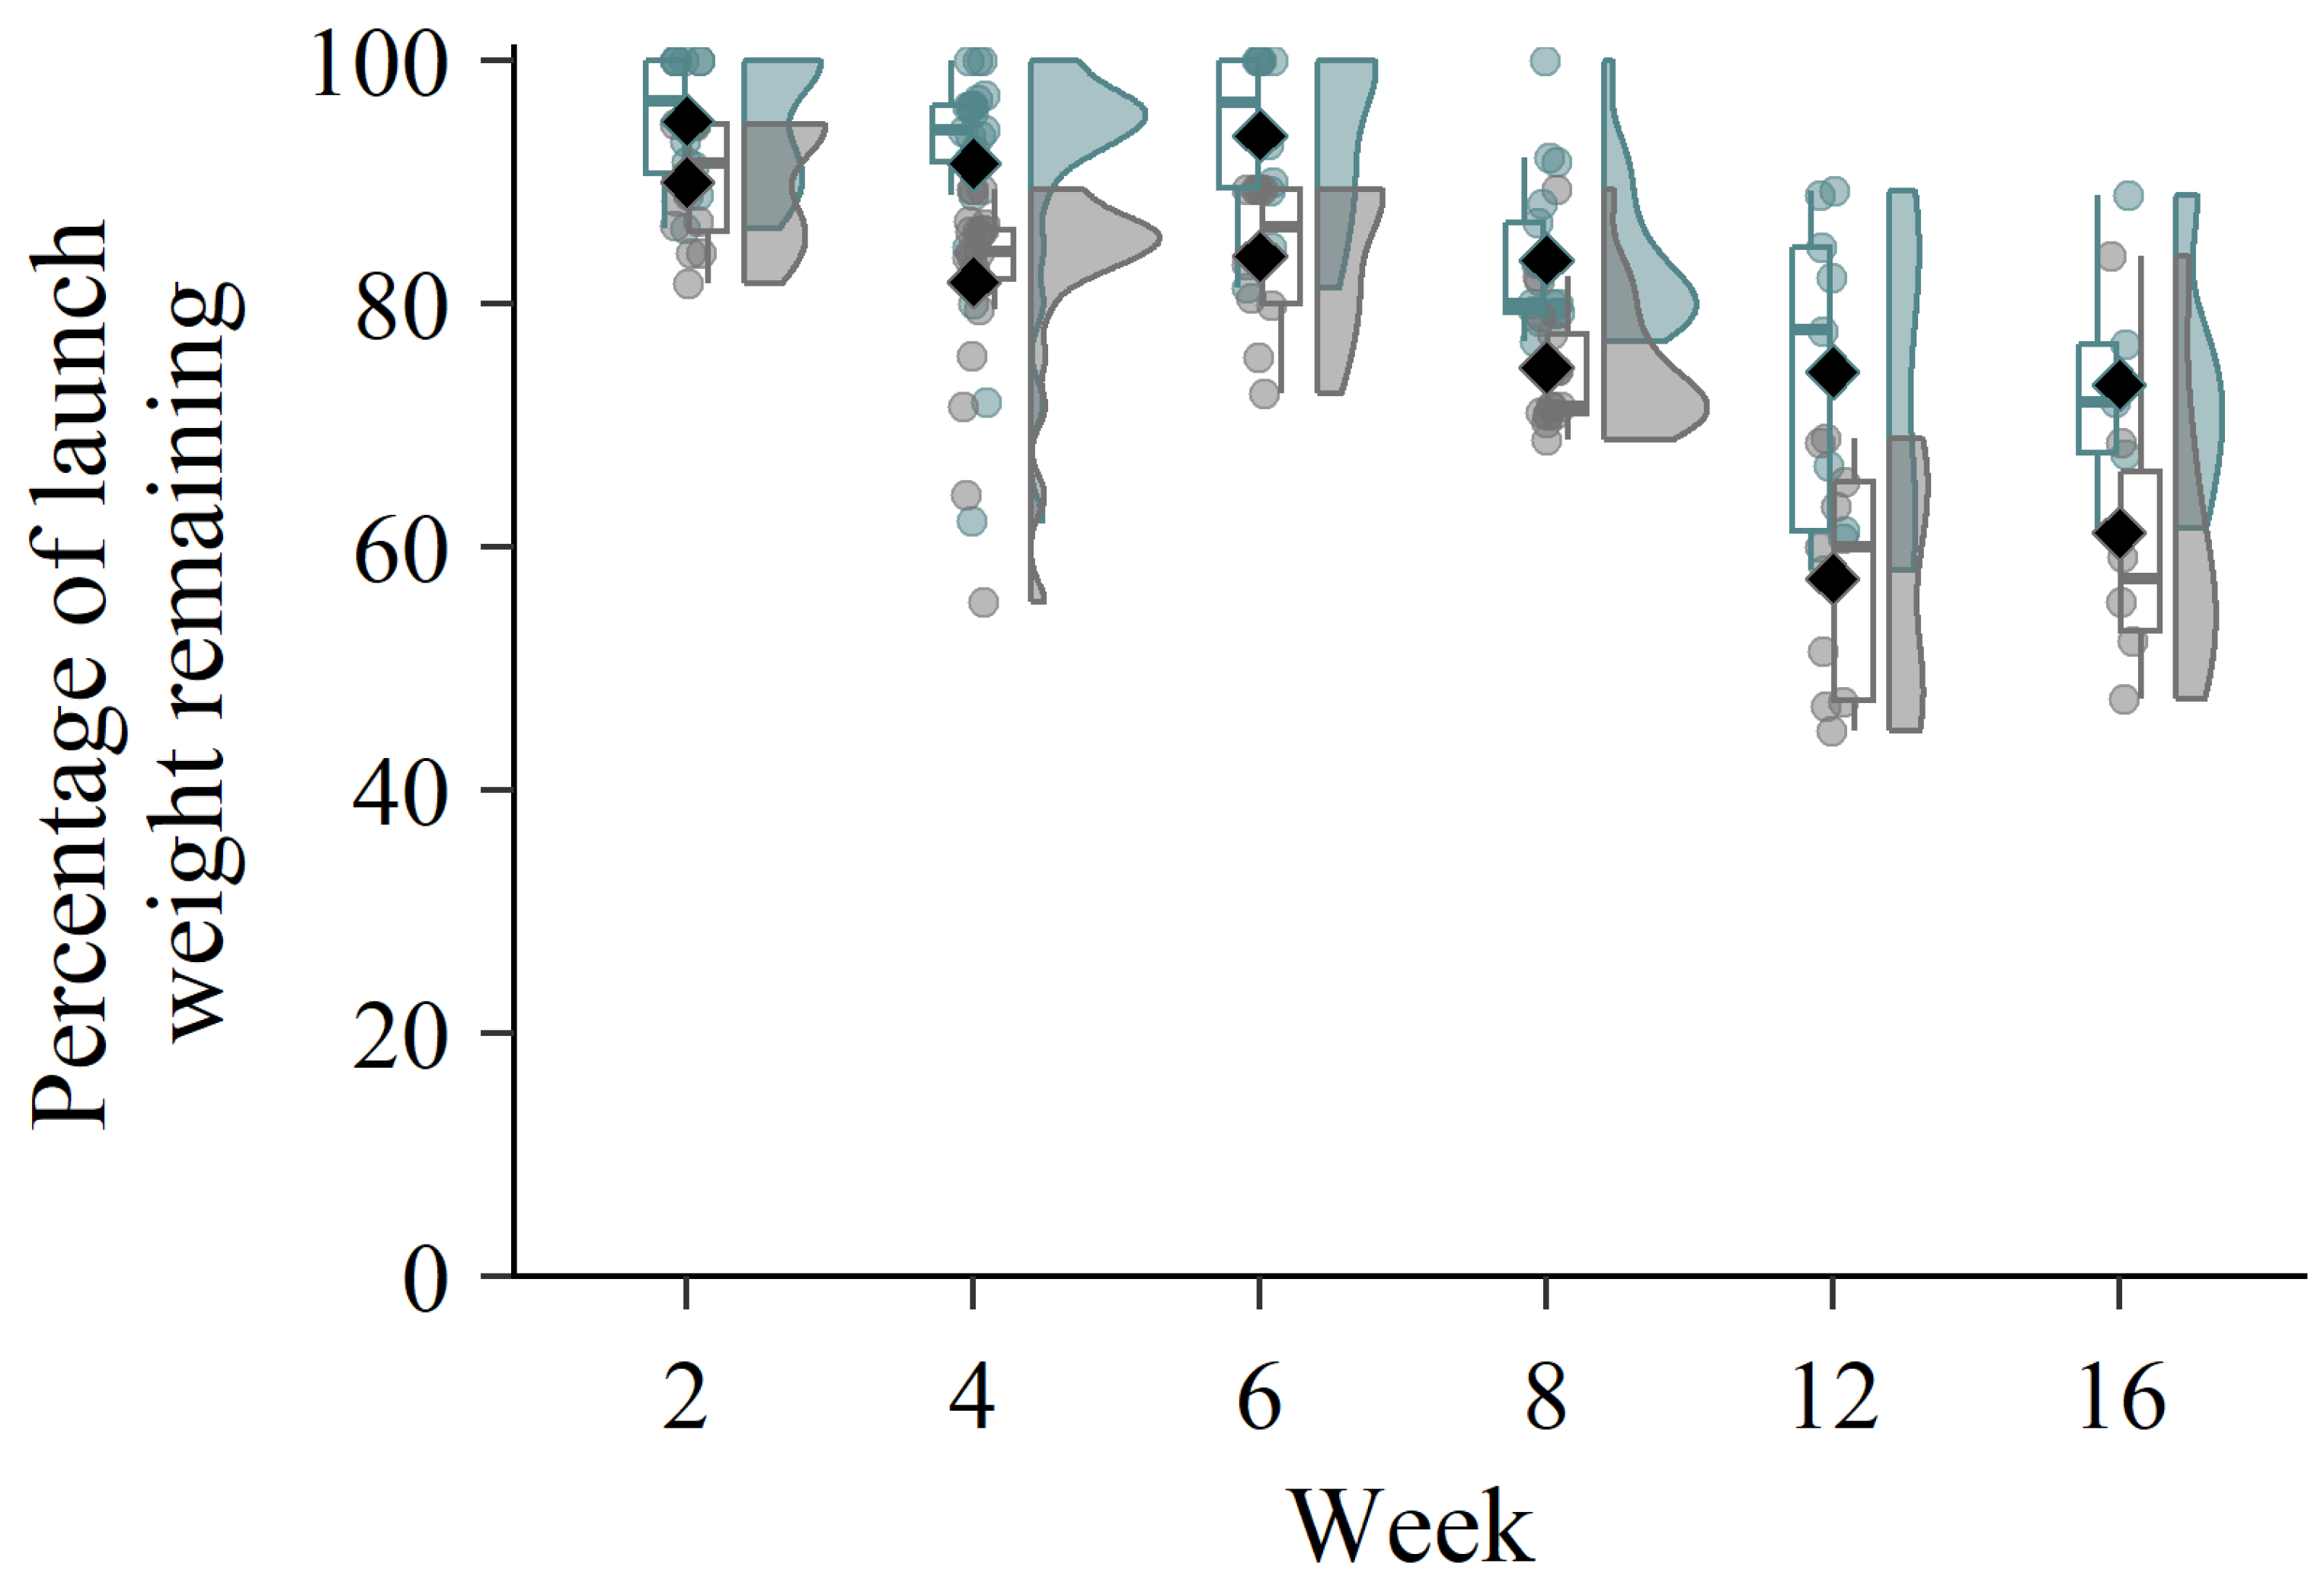
3.2.1. Whole Carcasses in the Profundal Zone

Dry mass calculations for whole carcasses were similar to the published values, where we reported DM here as a percent of wet mass (Table 1). The DM for four weeks (21.9%; 18.9–24.9% CI) was within the previously published confidence interval from Lantry and Gorman [31]. Accounting for DM resulted in similar trends as those observed for wet mass (Figure 2).

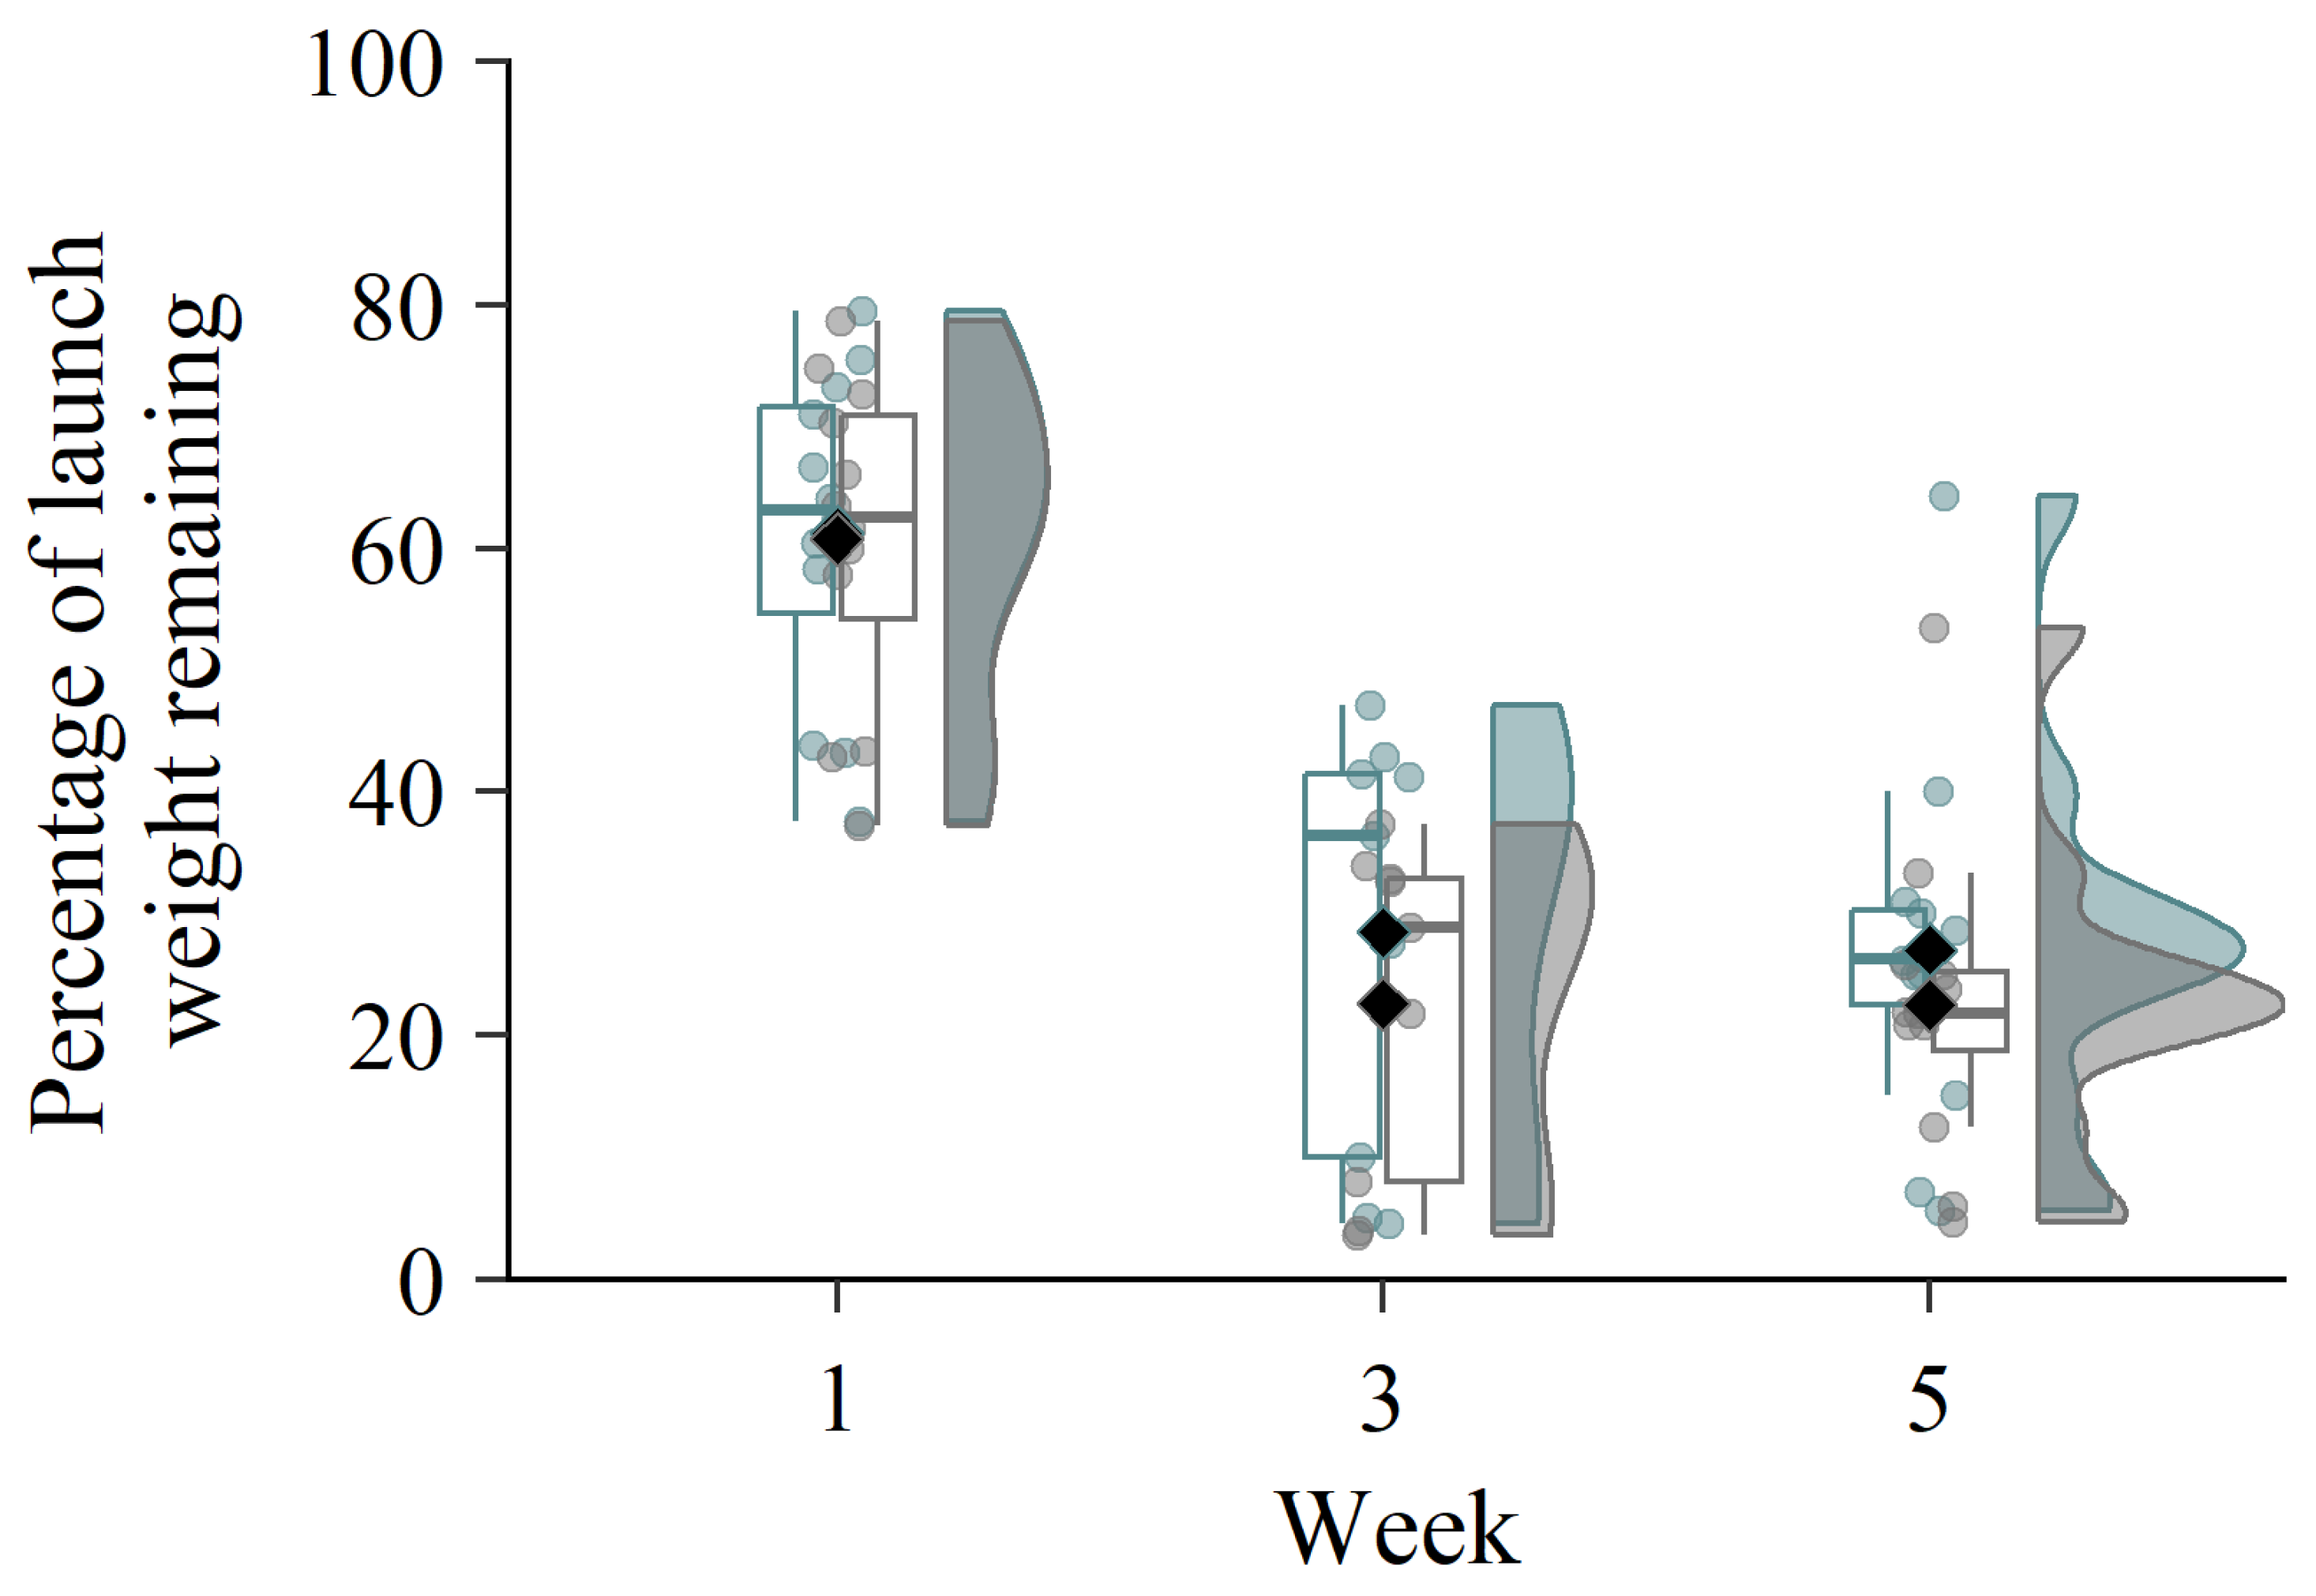
3.2.2. Ground Carcasses in Littoral Zone

Dry mass calculations for ground carcasses varied with deployment time, though confidence intervals overlapped for some DM calculations (Table 1). Accounting for DM resulted in similar trends as for wet mass (Figure 3).

3.3. Constant Rate of Decay (k) and Half-Life

The whole carcass decomposition in Yellowstone Lake had a mean decay (k) of −0.0075 day−1 (CI = −0.0063–−0.0089; Figure 4) and a half-life of 91 days (CI = 78–110). Ground carcass decomposition had a mean k value of −0.0679 day−1 (CI = −0.0590–−0.0768; Figure 4) and a half-life of 10 days (CI = 9–12).

4. Discussion

From 1995 to 2022, more than 4.3 million lake trout were caught in gill nets and returned to the profundal zone of Yellowstone Lake as carcasses [24]. These carcasses likely represent a large flux of nutrients recycled within the lake, especially as the number of lake trout caught increased over time. Additionally, another pool of carcass was created by using ground carcasses in littoral lake trout spawning areas as a complementary suppression strategy [25,26]. Given these two novel pools of carcasses in Yellowstone Lake, we wanted to know how much faster ground carcasses decay in the littoral zone than whole carcasses in the profundal zone. Not surprisingly, our results indicated that ground carcasses in the littoral zone decompose an order-of-magnitude faster than whole carcasses in the profundal zone. Differences in decomposition rate can be explained by differences in abiotic factors between the sites and the carcass state.
We tried to control for different factors in the field during this experiment, but limitations existed regarding this experiment that could affect the results presented above. We were limited in our ability to correct for dry mass using the same carcass material as deployed in the experiments and over the same time periods, so the corrections we made could be over or underestimating the dry mass corrections. However, accounting for dry mass resulted in similar trends in mass loss as wet mass. The whole carcass and ground carcass cages did not have the same mass at deployment. Especially for the whole carcass bundles, we did not want to start the decomposition process by cutting parts of fish to maintain specific deployment masses. The starting amount of mass within a cage could influence the decay rate. However, we reported mean decay rates and mean half-lives, along with confidence intervals, to show the error associated with these measurements and possibly account for the influence of starting weight on these results. Although not included as a main result in our study, we did include six whole carcass cages in shallow deployments as a relative control for carcass state in shallow water. The mean decay rate of whole carcasses in shallow water was −0.0220 day−1 and a mean half-life of 35 days. We did not deploy ground carcass in deep sites in the lake because this is not a carcass management strategy in the system. Having information about ground carcasses in the profundal zone would have made the experiment more robust and could provide information to biologists regarding ground carcass decomposition in the profundal zone if eventually used as a management strategy. Constant rates of decay were nine times slower for whole carcasses in the profundal zone compared to ground carcasses in the littoral zone, which is not surprising given the differential abiotic factors associated with the locations and characteristics of carcasses. Increased surface area [35] of the ground carcasses likely contributed to increased decomposition rates compared to whole carcasses. Water temperature alone can approximate decomposition rates in lakes [14], and water temperature was 6 °C warmer in the littoral zone compared to the profundal zone. Warmer water temperature, increased sunlight, higher ambient dissolved oxygen, and shallow water depth have been shown to increase fish carcass decomposition rates in other lakes [14], factors more likely to influence littoral ground carcasses compared to the profundal whole carcasses. In our experiments, ground carcass dissolved oxygen levels in the littoral zone were on average lower than in the profundal zone, which may be counterintuitive. However, the lower dissolved oxygen values in the littoral zone may be due to decomposition, rather than reflecting ambient dissolved oxygen levels. Wave action in the littoral zones may also have expedited the decomposition of ground carcasses because the shearing force of waves may further macerate ground carcasses or dislodge pieces [36], transporting them outside of the cage. This research can better inform biologists regarding the legacy of carcass deposition and expands upon the small body of research regarding fish carcass decomposition in lakes.
The rate of decay (k-values) for whole carcasses in Yellowstone Lake were affected by cool temperatures and the absence of light in the profundal zone (>70 m in depth). Carcass skin remained intact during the whole carcass experiment period in Yellowstone Lake, but muscle was visibly decomposed. We observed decomposition of whole carcasses from the body cavity outward to the skin, which is common in fish decomposition [37]. Average k-values for profundal, whole carcasses were much lower compared to most studies in streams and lakes [14,15,37,38,39]. Whole carcass rate of decay was slower than a study conducted in deep waters (below the thermocline) of smaller Canadian lakes with warmer temperatures (up to 20 °C) where the half-life of whole carcasses (72 days) was about 20 days shorter than our experiments [14].
Grinding carcass material promoted increased rates of decay. Ground carcass rates of decomposition were relatively high compared to other experiments where no macroscale scavengers had access to or were observed on the carcass material [15,40]. In some aquatic ecosystems, macroscale scavengers (e.g., crabs, fish) may “process” carcasses by opening cavities or shredding tissue, increasing the rate of decomposition [40], a concept also mirrored in terrestrial ecosystems [41]. Carcass grinding likely compensated for cooler water temperatures in Yellowstone Lake because the rate of decay was similar to experiments conducted with whole carcasses in waters up to 5.8 °C warmer [37,39]. The half-lives of ground carcasses in Yellowstone Lake were seven days longer than the half-lives of whole carcasses in shallow water experiments [14]. The decomposition rates of ground carcasses were comparable to other studies using whole carcasses in shallow waters with warmer temperatures [14,15,37,38,39].
We did not observe many invertebrate scavengers during our experiments, even though invertebrate scavengers (e.g., amphipods) are present in the lake [42,43]. We ensured cages had mesh large enough for colonization by invertebrates present in Yellowstone Lake (specifically amphipods); no macroinvertebrates in Yellowstone Lake are large enough to be limited by the 1.27 cm (0.5 in) mesh size. However, the retrieval process could have dislodged scavengers attached to the experiments; only annelids were observed upon retrieval (Figure A2). Although not visually observed on ground carcasses, our photographic documentation showed thick fungus mycelial mats (Figure A2) on whole carcasses that could have caused scavenger avoidance [15]. Microbe-colonized carrion may be four times less likely to be consumed by scavengers than fresh carrion due to unappealing fungal or bacterial chemical signals [44].

5. Conclusions

Understanding the decomposition rate of whole or ground fish carcasses is important for biologists implementing invasive species control programs. The small-scale deposition of ground carcass material is limited to lake trout spawning sites, which compose 0.03% of total lake surface area [22] and 0.12% of the littoral zone [45]. Different embryo suppression methods (i.e., ground carcass or carcass analog pellets), which occur in the littoral zones of Yellowstone Lake, have shown to have measurable but differential effects on periphyton biomass [46] and invertebrate mortality [42]. Our results suggest that the mass of ground carcass material at spawning sites approach zero by the next ice-off season, as the half-life of ground carcasses is 10 days. Given the size of spawning grounds in relation to the total lake area and half-life of ground carcasses, our findings further suggest that the influence of embryo suppression via carcass deposition will be limited spatially and temporally [42,46]. However, whole carcass decomposition is slow due to deposition in the profundal zone and may take years to be fully decomposed [40] due to the lack of carcass processing (i.e., grinding), colder temperatures, and lack of light. Fish are often viewed as sinks of nutrients [47,48], but the suppression of lake trout and deposition of their carcasses to profundal zones may have altered the timing of nutrient surges and algal blooms in Yellowstone Lake [49]. The decomposition dynamics we quantified have broad applications to the management of lakes with natural or suppression-induced mortality events and add to a needed body of knowledge surrounding fish decomposition in lentic ecosystems [14].

Author Contributions

Conceptualization, H.C.G. and C.S.G.; methodology H.C.G. and C.S.G.; formal analysis, H.C.G.; writing—original draft preparation, H.C.G.; writing—review and editing, C.S.G., L.M.T., M.A.B., L.K.A., D.R.L. and T.M.K.; supervision, C.S.G., L.M.T. and T.M.K.; funding acquisition, H.C.G., C.S.G. and T.M.K. All authors have read and agreed to the published version of the manuscript.

Funding

Funding was provided by Yellowstone Forever, Yellowstone National Park, and technician support was provided by the Montana Institute on Ecosystems. The Montana Cooperative Fishery Research Unit is jointly sponsored by Montana State University, Montana Fish, Wildlife and Parks, the U.S. Geological Survey, and the U.S. Fish and Wildlife Service. Any use of trade, firm, or product names is for descriptive purposes only and does not imply endorsement by the U.S. Government.

Institutional Review Board Statement

All fieldwork and lab work were conducted under Yellowstone National Park permit 8048. This study was performed under the auspices of Institutional Animal Care and Use Protocol 2018-72 at Montana State University.

Informed Consent Statement

Not applicable.

Data Availability Statement

Data are available with permission from the authors.

Acknowledgments

We thank P. Doepke, P. Bigelow, and D. MacDonald for guidance or assistance in field sampling; S. Driscoll for assistance in the field and the lab analyzing or prepping carcasses; and Hickey Bros Research for coordination and support.

Conflicts of Interest

The authors declare no conflict of interest.

Appendix A

Figure A1. Temperature and dissolved oxygen measurements for 2018 (top) and 2019 (bottom) whole carcass experiments in the profundal zone of Yellowstone Lake, Yellowstone National Park, Wyoming, U.S.A. Black (dashed) line is the mean measurement. Polygons are 95% confidence intervals.
Fishes 08 00385 g0a1
Figure A2. (A) Full whole carcass bundle experiment after 2 weeks of deployment; (B) opened whole carcass cage showing extensive fungus mycelial growth mat; (C) whole carcass cage with (D) annelids on outside of wire mesh.
Fishes 08 00385 g0a2
Figure A3. Temperature and dissolved oxygen measurements for 2018 ground carcass experiments in the littoral zone of Yellowstone Lake, Yellowstone National Park, Wyoming, U.S.A. Black (dashed) line is the mean measurement. Polygons are 95% confidence intervals.
Fishes 08 00385 g0a3

References

  1. Barton, P.S.; Evans, M.J.; Foster, C.N.; Pechal, J.L.; Bump, J.K.; Quaggiotto, M.-M.; Benbow, M.E. Towards Quantifying Carrion Biomass in Ecosystems. Trends Ecol. Evol. 2019, 34, 950–961. [Google Scholar] [CrossRef]
  2. Boyero, L.; Pearson, R.G.; Hui, C.; Gessner, M.O.; Pérez, J.; Alexandrou, M.A.; Graça, M.A.S.; Cardinale, B.J.; Albariño, R.J.; Arunachalam, M. Biotic and Abiotic Variables Influencing Plant Litter Breakdown in Streams: A Global Study. Proc. R. Soc. B Biol. Sci. 2016, 283, 20152664. [Google Scholar] [CrossRef]
  3. Vannote, R.L.; Minshall, G.W.; Cummins, K.W.; Sedell, J.R.; Cushing, C.E. The River Continuum Concept. Can. J. Fish. Aquat. Sci. 1980, 37, 130–137. [Google Scholar] [CrossRef]
  4. Webster, J.R.; Benfield, E.F. Vascular Plant Breakdown in Freshwater Ecosystems. Annu. Rev. Ecol. Syst. 1986, 17, 567–594. [Google Scholar] [CrossRef]
  5. Carter, D.O.; Yellowlees, D.; Tibbett, M. Cadaver Decomposition in Terrestrial Ecosystems. Naturwissenschaften 2007, 94, 12–24. [Google Scholar] [CrossRef] [Green Version]
  6. Smith, C.R.; Baco, A.R. Ecology of Whale Falls at the Deep-Sea FLoor. In Oceanography and Marine Biology, An Annual Review, Volume 41; CRC Press: Boca Raton, FL, USA, 2003; pp. 319–333. ISBN 0-429-21771-4. [Google Scholar]
  7. Towne, E.G. Prairie Vegetation and Soil Nutrient Responses to Ungulate Carcasses. Oecologia 2000, 122, 232–239. [Google Scholar] [CrossRef] [PubMed]
  8. Payne, L.X.; Moore, J.W. Mobile Scavengers Create Hotspots of Freshwater Productivity. Oikos 2006, 115, 69–80. [Google Scholar] [CrossRef]
  9. Cederholm, C.J.; Kunze, M.D.; Murota, T.; Sibatani, A. Pacific Salmon Carcasses: Essential Contributions of Nutrients and Energy for Aquatic and Terrestrial Ecosystems. Fisheries 1999, 24, 6–15. [Google Scholar] [CrossRef]
  10. Weaver, D.M.; Coghlan, S.M.; Zydlewski, J.; Hogg, R.S.; Canton, M. Decomposition of Sea Lamprey Petromyzon Marinus Carcasses: Temperature Effects, Nutrient Dynamics, and Implications for Stream Food Webs. Hydrobiologia 2015, 760, 57–67. [Google Scholar] [CrossRef]
  11. Premke, K.; Muyakshin, S.; Klages, M.; Wegner, J. Evidence for Long-Range Chemoreceptive Tracking of Food Odour in Deep-Sea Scavengers by Scanning Sonar Data. J. Exp. Mar. Biol. Ecol. 2003, 285, 283–294. [Google Scholar] [CrossRef]
  12. Ruxton, G.D.; Houston, D.C. Energetic Feasibility of an Obligate Marine Scavenger. Mar. Ecol. Prog. Ser. 2004, 266, 59–63. [Google Scholar] [CrossRef] [Green Version]
  13. Soltwedel, T.; von Juterzenka, K.; Premke, K.; Klages, M. What a Lucky Shot! Photographic Evidence for a Medium-Sized Natural Food-Fall at the Deep Seafloor. Oceanol. Acta 2003, 26, 623–628. [Google Scholar] [CrossRef] [Green Version]
  14. Chidami, S.; Amyot, M. Fish Decomposition in Boreal Lakes and Biogeochemical Implications. Limnol. Oceanogr. 2008, 53, 1988–1996. [Google Scholar] [CrossRef] [Green Version]
  15. Premke, K.; Fischer, P.; Hempel, M.; Rothhaupt, K.-O. Ecological Studies on the Decomposition Rate of Fish Carcasses by Benthic Organisms in the Littoral Zone of Lake Constance, Germany. Ann. De Limnol.-Int. J. Limnol. 2010, 46, 157–168. [Google Scholar] [CrossRef] [Green Version]
  16. Schneider, J.C. Fate of Dead Fish in a Small Lake. Am. Midl. Nat. 1998, 140, 192–196. [Google Scholar] [CrossRef]
  17. Kaeding, L.R.; Boltz, G.D.; Carty, D.G. Lake Trout Discovered in Yellowstone Lake Threaten Native Cutthroat Trout. Fisheries 1996, 21, 16–20. [Google Scholar] [CrossRef]
  18. Glassic, H.C.; Lujan, D.R.; Tronstad, L.M.; Briggs, M.A.; Albertson, L.K.; Koel, T.M. Diet Plasticity in an Invasive Predator Has Implications for Native Fish Conservation & Invasive Species Suppression. PLoS ONE 2023, 18, e0279099. [Google Scholar] [CrossRef]
  19. Koel, T.M.; Tronstad, L.M.; Arnold, J.L.; Gunther, K.A.; Smith, D.W.; Syslo, J.M.; White, P.J. Predatory Fish Invasion Induces within and across Ecosystem Effects in Yellowstone National Park. Sci. Adv. 2019, 5, eaav1139. [Google Scholar] [CrossRef] [Green Version]
  20. Ruzycki, J.R.; Beauchamp, D.A.; Yule, D.L. Effects of Introduced Lake Trout on Native Cutthroat Trout in Yellowstone Lake. Ecol. Appl. 2003, 13, 23–37. [Google Scholar] [CrossRef]
  21. Syslo, J.M.; Guy, C.S.; Koel, T.M. Feeding Ecology of Native and Nonnative Salmonids during the Expansion of a Nonnative Apex Predator in Yellowstone Lake, Yellowstone National Park. Trans. Am. Fish. Soc. 2016, 145, 476–492. [Google Scholar] [CrossRef]
  22. Koel, T.M.; Arnold, J.L.; Bigelow, P.E.; Brenden, T.O.; Davis, J.D.; Detjens, C.R.; Doepke, P.D.; Ertel, B.D.; Glassic, H.C.; Gresswell, R.E.; et al. Yellowstone Lake Ecosystem Restoration: A Case Study for Invasive Fish Management. Fishes 2020, 5, 18. [Google Scholar] [CrossRef]
  23. Varley, J.D.; Schullery, P. The Yellowstone Lake Crisis: Confronting a Lake Trout Invasion: A Report to the Director of the National Park Service; Yellowstone Center for Resources, National Park Service: Yellowstone National Park, WY, USA, 1995.
  24. Koel, T.M.; Bigelow, P.E.; Doepke, P.D.; Ertel, B.D.; MacDonald, D.J.; Puchany, A.R.; Vender, C.W. Native Fish Conservation Program, Yellowstone National Park, Report for 2022; National Park Service, Yellowstone Center for Resources: Yellowstone National Park, WY, USA, 2023.
  25. Poole, A.S.; Koel, T.M.; Thomas, N.A.; Zale, A.V. Benthic Suffocation of Invasive Lake Trout Embryos by Fish Carcasses and Sedimentation in Yellowstone Lake. N. Am. J. Fish. Manag. 2020, 40, 1077–1086. [Google Scholar] [CrossRef]
  26. Thomas, N.A.; Guy, C.S.; Koel, T.M.; Zale, A.V. In-Situ Evaluation of Benthic Suffocation Methods for Suppression of Invasive Lake Trout Embryos in Yellowstone Lake. N. Am. J. Fish. Manag. 2019, 39, 104–111. [Google Scholar] [CrossRef]
  27. Kilham, S.S.; Theriot, E.C.; Fritz, S.C. Linking Planktonic Diatoms and Climate Change in the Large Lakes of the Yellowstone Ecosystem Using Resource Theory. Limnol. Oceanogr. 1996, 41, 1052–1062. [Google Scholar] [CrossRef]
  28. Koel, T.; Arnold, J.; Bigelow, P.; Doepke, P.; Ertel, B.; Ruhl, M. Yellowstone Fisheries and Aquatic Sciences: Annual Report, 2006; National Park Service: Yellowstone National Park, WY, USA, 2007.
  29. Benson, N.G. Limnology of Yellowstone Lake in Relation to the Cutthroat Trout; US Fish and Wildlife Service: Bailey’s Crossroads, VA, USA, 1961.
  30. Kaplinski, M.A. Geomorphology and Geology of Yellowstone Lake, Yellowstone National Park, Wyoming; Northern Arizona University: Flagstaff, AZ, USA, 1991. [Google Scholar]
  31. Lantry, B.F.; O’Gorman, R. Drying Temperature Effects on Fish Dry Mass Measurements. J. Great Lakes Res. 2007, 33, 606–616. [Google Scholar] [CrossRef]
  32. Elliott, J.M. An Experimental Study on the Natural Removal of Dead Trout Fry in a Lake District Stream. J. Fish Biol. 1997, 50, 870–877. [Google Scholar] [CrossRef]
  33. Enriquez, S.; Duarte, C.M.; Sand-Jensen, K. Patterns in Decomposition Rates among Photosynthetic Organisms: The Importance of Detritus C:N:P Content; Springer: Berlin/Heidelberg, Germany, 1993; Volume 94. [Google Scholar]
  34. R Core Team. R: A Language and Environment for Statistical Computing; R Core Team: Vienna, Austria, 2022. [Google Scholar]
  35. Hargrave, B.T. Aerobic Decomposition of Sediment and Detritus as a Function of Particle Surface Area and Organic Content. Limnol. Oceanogr. 1972, 17, 583–586. [Google Scholar] [CrossRef]
  36. Pabst, S.; Scheifhacken, N.; Hesselschwerdt, J.; Wantzen, K.M. Leaf Litter Degradation in the Wave Impact Zone of a Pre-Alpine Lake. In Ecological Effects of Water-Level Fluctuations in Lakes; Springer: Berlin/Heidelberg, Germany, 2008; pp. 117–131. [Google Scholar]
  37. Minshall, G.W.; Hitchcock, E.; Barnes, J.R. Decomposition of Rainbow Trout Carcasses in a Forest Stream Ecosystem Inhabited Only by Nonanadromous Fish Populations. Can. J. Fish. Aquat. Sci. 1991, 48, 191–195. [Google Scholar] [CrossRef]
  38. Fenoglio, S.; Bo, T.; Agosta, P.; Cucco, M. Mass Loss and Macroinvertebrate Colonisation of Fish Carcasses in Riffles and Pools of a NW Italian Stream. Hydrobiologia 2005, 532, 111–112. [Google Scholar] [CrossRef]
  39. Parmenter, R.R.; Lamarra, V.A. Nutrient Cycling in a Freshwater Marsh: The Decomposition of Fish and Waterfowl Carrion. Limnol. Oceanogr. 1991, 36, 976–987. [Google Scholar] [CrossRef]
  40. Jannasch, H.W.; Wirsen, C.O. Alvin and the Sandwich. Oceanus 1972, 16, 20–22. [Google Scholar]
  41. Ogada, D.L.; Torchin, M.E.; Kinnaird, M.F.; Ezenwa, V.O. Effects of Vulture Declines on Facultative Scavengers and Potential Implications for Mammalian Disease Transmission. Conserv. Biol. 2012, 26, 453–460. [Google Scholar] [CrossRef]
  42. Briggs, M.; Albertson, L.; Lujan, D.; Tronstad, L.; Glassic, H.; Guy, C.; Koel, T. Carcass Deposition to Suppress Invasive Lake Trout Causes Differential Mortality of Two Common Benthic Invertebrates in Yellowstone Lake. Fundam. Appl. Limnol./Arch. Für Hydrobiol. 2020, 194, 285–295. [Google Scholar] [CrossRef]
  43. Wilmot, O.; Tronstad, L.; Hall, R.O.; Koel, T.; Arnold, J. Lake Trout–Induced Spatial Variation in the Benthic Invertebrates of Yellowstone Lake. Park Sci. 2016, 32, 25–35. [Google Scholar]
  44. Burkepile, D.E.; Parker, J.D.; Woodson, C.B.; Mills, H.J.; Kubanek, J.; Sobecky, P.A.; Hay, M.E. Chemically Mediated Competition between Microbes and Animals: Microbes as Consumers in Food Webs. Ecology 2006, 87, 2821–2831. [Google Scholar] [CrossRef] [PubMed]
  45. Bigelow, P.E. Predicting Areas of Lake Trout Spawning Habitat within Yellowstone Lake, Wyoming; University of Wyoming: Laramie, WY, USA, 2009; ISBN 1-109-53178-8. [Google Scholar]
  46. Lujan, D.R.; Tronstad, L.M.; Briggs, M.A.; Albertson, L.K.; Glassic, H.C.; Guy, C.S.; Koel, T.M. Response of Nutrient Limitation to Invasive Fish Suppression: How Carcasses and Analog Pellets Alter Periphyton. Freshw. Sci. 2022, 41, 88–99. [Google Scholar] [CrossRef]
  47. Griffiths, D. The Direct Contribution of Fish to Lake Phosphorus Cycles. Ecol. Freshw. Fish 2006, 15, 86–95. [Google Scholar] [CrossRef]
  48. Sereda, J.M.; Hudson, J.J.; Taylor, W.D.; Demers, E. Fish as Sources and Sinks of Nutrients in Lakes. Freshw. Biol. 2008, 53, 278–289. [Google Scholar]
  49. Lujan, D.R.; Tronstad, L.M.; Briggs, M.A.; Albertson, L.K.; Glassic, H.C.; Guy, C.S.; Koel, T.M. Suppressing an Invasive Apex Predator Minimally Alters Nitrogen Dynamics in Yellowstone Lake, Wyoming. Hydrobiologia, 2022; in review. [Google Scholar]
Figure 1. (A) The location of the experiment sites for whole (2018 and 2019) and ground (2018 only) carcass decomposition experiments within Yellowstone Lake, Wyoming, and the location of Yellowstone Lake in North America; (B) the arrangement of four experimental bundles at the site; and (C) the arrangement of bundles containing ground or whole carcass material or cobble (to facilitate negative buoyancy) and the dissolved oxygen logger attached to each bundle. (B,C) are not shown to scale.
Fishes 08 00385 g001
Figure 2. The percentage of launch weight remaining for whole carcass experiments in the profundal zone by week for 2018 and 2019 combined. Colored distributions represent the wet mass percentages of weight remaining relative to launch weight, and black distributions represent dry-mass-corrected percentages of weight remaining relative to launch weight. Diamonds are the mean values. Points are individual measurements.
Fishes 08 00385 g002
Figure 3. Percentage of launch weight remaining for ground carcass experiments in the littoral zone by week for 2018. Colored distributions represent the wet mass percentages of weight remaining relative to the launch weight, and black distributions represent dry-mass-corrected percentages of weight remaining relative to the launch weight. Diamonds are the mean values. Points are individual measurements.
Fishes 08 00385 g003
Figure 4. Calculated constant rates of decay (k) for ground carcass experiments in the littoral zone (blue) and whole carcass experiments in the profundal zone (orange). Black circles represent mean k.
Fishes 08 00385 g004
Table 1. Years, weeks (time deployed before bundle retrieval), and depth of each carcass state experiment was conducted. Total number of cages and bundles represent the number deployed of each (cage, bundle) at the beginning of the experiment period. Each bundle has three carcass cages.
Carcass StateYearExperiment WeeksDepthTotal Number Cages with CarcassTotal Number Bundles
Whole20182, 4, 6, 8>70 m4816
20194, 8, 12, 16>70 m3612
Ground20181, 3, 510 m3612
Table 2. Dry mass (DM) calculations with confidence intervals (CI) for whole and ground carcasses.
Carcass StateWeekDM (% of Wet Mass; [CI])Method
Whole224.5 [21.3–27.7]Literature-derived [30]
421.9 [18.9–24.9] Dried in lab
6 and 821.9Assumed to = week 4
12 and 1618.9Assumed to = lower CI week 4
Ground032.2 [30.1–34.4]Dried in lab
131.9 [28.4–35.4]Dried in lab
225.5 [24.8–26.3]Dried in lab
326.1Assumed to = average weeks 2 and 4
426.8 [23.7–29.8]Dried in lab
526.8Assumed to = week 4
Disclaimer/Publisher’s Note: The statements, opinions and data contained in all publications are solely those of the individual author(s) and contributor(s) and not of MDPI and/or the editor(s). MDPI and/or the editor(s) disclaim responsibility for any injury to people or property resulting from any ideas, methods, instructions or products referred to in the content.

