
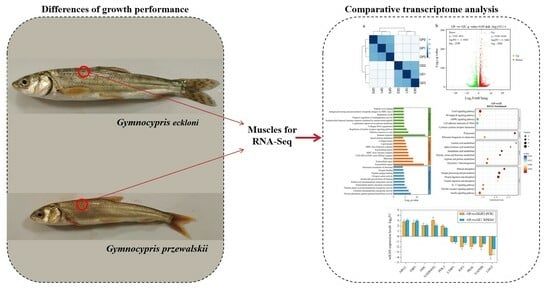
Molecular Mechanisms of Growth Differences in Gymnocypris przewalskii and Gymnocypris eckloni through a Comparative Transcriptome Perspective

Key Laboratory of Plateau Wetland Ecology and Environmental Protection, Xichang University, Xichang 615013, China
*
Author to whom correspondence should be addressed.
Fishes 2024, 9(3), 89; https://doi.org/10.3390/fishes9030089
Submission received: 1 February 2024
/
Revised: 26 February 2024
/
Accepted: 26 February 2024
/
Published: 28 February 2024
Abstract
:Genetic composition plays a crucial role in the growth rate of species, and transcriptomics provides a potent tool for studying genetic aspects of growth. We explored the growth rates and transcriptomes of the Cyprinids G. przewalskii (GP) and G. eckloni (GE). A total of 500 individuals of G. przewalskii and G. eckloni, matched in size, were separately cultured for 9 months in six cement tanks (each group with three replicates). Growth indices were measured, revealing that the growth rate of GE was greater than that of GP (p < 0.05), while there was no significant difference in survival rates (p > 0.05). Simultaneously, we conducted RNA-Seq on the muscles of both GP and GE. The results indicated a significant difference of gene expression between GP and GE, identifying 5574 differentially expressed genes (DEGs). Quantitative real-time reverse transcription–polymerase chain reaction of 10 DEGs demonstrated consistency in expression profiles with the results from the RNA-Seq analysis. The DEGs were significantly enriched in glycolysis/gluconeogenesis (ko00010), arachidonic acid formation (ko00061), arginine biosynthesis (ko00220), and the MAPK (ko04013), PI3K-Akt (ko04151), mTOR (ko04150), and TGF-β (ko04350) signal pathways, as revealed by Gene Ontology (GO) enrichment and the Kyoto Encyclopedia of Genes and Genomes (KEGG) pathway analysis. This study also identified some growth-related DEGs, such as IGF2, Noggin, Decorin and others. Notably, the low expression of IGF2 may be a factor contributing to the slower growth of GP than GE.
Key Contribution: This is the first report on growth differences of G. przewalskii and G. eckloni. A comparative analysis of the transcriptome data provides insight into the growth performance of the two Gymnocypris species.
1. Introduction
The growth rate, an important commercial trait in aquaculture, is influenced by various factors, with genetic composition playing a pivotal role [1]. The rapid advancement of next-generation sequencing technologies has promoted the application of transcriptomics in the aquaculture sector [2,3]. The transcriptome provides a blueprint of actively transcribed genes in an organism, unraveling molecular mechanisms that potentially govern growth performance [4,5]. For instance, a comparative transcriptome analysis of grass carp (Ctenopharyngodon idella) muscle tissue between fast- and slow-growing family groups revealed differentially expressed genes (DEGs) involved in the growth hormone (GH)/insulin-like growth factor (IGF) axis, calcium metabolism, protein and glycogen synthesis, oxygen transport, cytoskeletal and myofibrillar components. These DEGs might be key genes contributing to the growth differences between fast- and slow-growing fish [4]. Similarly, Lin et al. [5] conducted a comparative transcriptome analysis of mixed tissues (brain, liver, and muscle tissue samples) of black porgy (Acanthopagrus schlegelii) with varying growth rates, identifying key genes such as IGF-1, IGF-2, myosin light chain 3-like (Myl3), and growth hormone receptor type 1 (GHR1) involved in the muscle growth process. Thus, the transcriptome is emerging as a potent tool for elucidating growth differences in economically important aquatic organisms [6,7].
The growth trait is one of the most important economic traits of fish, contributing significantly to the development of the aquaculture industry [8]. The GH/IGF axis primarily regulates muscle growth [9,10]. GH and IGFs indirectly stimulate muscle growth through processes such as cell proliferation, differentiation, myogenesis, protein synthesis, and breakdown. Moreover, they directly stimulate muscle growth through hyperplasia and hypertrophy [10,11]. Further studies suggested that IGFs promote growth by activating MAPK/ERK, PI3K/AKT/TOR, and other signaling pathways [9,12]. Existing research underscores the pivotal role of the GH/IGF growth axis in fish muscle growth, as observed in gilthead sea bream (Sparus aurata) [10], fine flounder (Paralichthys adspersus) [13], and rainbow trout (Oncorhynchus mykiss) [14].
Gymnocypris eckloni (GE), a species representative of highly specialized schizothoracine fishes, is primarily found in the Yellow River system [15,16]. This omnivorous fish, residing in the middle layer of water, typically weighs 2–3 kg, or even 5–6 kg [17]. As aquaculture animals, G. eckloni has significance because of its tender and delicious meat, nutrient-rich content, and high economic value and potential for development [17,18]. Another species, Gymnocypris przewalskii (GP), also belonging to the subfamily Schizothoracinae, is a unique indigenous fish and aquatic biological resource in the Qinghai Tibet Plateau (elevation 3200 m) with ecological and economic value [16,19,20]. Despite its excellent characteristics of resistance to salt–alkaline conditions and cold temperatures and low oxygen tolerance, GP exhibits slow growth [21,22]. Both Gymnocypris species are vital economic cold-water fishes in western China. Notably, in our prior observations, GE displayed faster growth than GP in a cold-water fish breeding station in Yue-Xi City, China, especially in the juvenile stage. Surprisingly, no research has been reported on the growth differences between these two Gymnocypris species and their respective growth regulation mechanisms, despite their economic importance.
To comprehend the growth differences between juvenile GE and GP, it is imperative to conduct research. This study investigated the growth performance of these two species over a 9-month period. Additionally, a comparative analysis of the transcriptomes of GE and GP will provide insights into the growth mechanisms of Gymnocypris species. These findings will contribute to understanding the growth mechanisms of Gymnocypris species, offering insights for the advancement in molecular-marker-assisted breeding.
2. Materials and Methods
2.1. Fish
A total of 500 individuals of GP and GE, aged 3 days, were cultured separately in net cages in filtered water (XiDe ZhengYuan Fish Farm in Liangshan Prefecture, Sichuan Province, China). Uniform conditions of the freshwater, temperature (13 °C), light (on at 6:00 and off at 18:00), and same specific amount of feed (Hirear, a special expanded formula feed for fish fry; nutrient compositions’ content was as follows: crude protein ≥ 38.0%, crude fat ≥ 6.0%, crude fiber ≤ 4.0%, crude ash ≤ 17.0%, moisture ≤ 11.0%, phosphorus ≥ 1.2%, lysine ≥ 1.8%; feed twice a day) were maintained for 9 months, with growth indices (weight, length, and survival) measured every 3 months.
2.2. Sampling
For sampling purposes, 3 juveniles were randomly selected from the GP group (8.17 ± 0.61 cm; 7.73 ± 1.17 g) and the GE group (12.28 ± 0.99 cm; 18.93 ± 1.19 g). Muscle samples from the same part of juvenile fishes were collected on ice, the surface dried with absorbent paper, frozen in liquid nitrogen, and stored at −80 °C for a subsequent analysis. All experimental procedures with animals adhered to the guidelines and received approval from the Animal Research and Ethics Committees of Xi Chang University.
2.3. RNA Extraction, Library Construction, and High-Throughput Sequencing
Total RNA was extracted from the muscle tissues using a Trizol reagent (Takara Bio, Otsu, Japan). RNA purity and quantity were assessed using a NanoDrop 2000 spectrophotometer (Thermo Fisher Scientific, Shanghai, China). RNA with total RNA ≥ 1 μg, OD260/280, in the range of 1.8–2.2, and Agilent 2100 RIN ≥ 7 were used for library construction. The integrity of the RNA was confirmed with the Agilent 2100 Bioanalyzer (Agilent Technologies, Santa Clara, CA, USA). RNA libraries were constructed using the VAHTS Universal V6 RNA-Seq Library Prep Kit (Illumina, Shanghai, China) according to the manufacturer’s instructions. The libraries were sequenced on the Illumina NovaSeq 6000 platform, generating 150-bp-long paired-end reads. OE Biotech Co., Ltd. (Shanghai, China) conducted the transcriptome sequencing and analysis.
2.4. RNA Sequencing Analysis
Raw RNA data in FASTQ format were processed using fastp [23] (Version 20.1). Clean readings were assembled into expressed sequence tag clusters (contigs) after removing adaptor and poor-quality sequences. Trinity [24] (Version 2.4) was employed for de novo assembly using the paired-end approach. The longest transcript was selected as a unigene based on its length and similarity to other analyses. The Swiss-Prot database, using the diamond tool with an e-value < 1 × 10⁻⁵, was used for the functional annotation of the unigenes. The proteins with the highest number of hits to the unigenes were functionally annotated. Unigenes were then mapped to annotate their potential involvement in various metabolic pathways against the Kyoto Encyclopedia of Genes and Genomes (KEGG) database. Following annotation, the number of reads aligned to a unigene in each sample was determined using bowtie2 software [25] (Version 2.3.3.1), and the expression level of each unigene (FPKM) was calculated using eXpress software [26] (Version 1.5.1). DESeq2 software [27] (Version 1.20) identified DEGs between groups using the negative binomial distribution test (NB). The default filter conditions for DEGs were foldChange > 2 or foldChange < 0.5 and p < 0.05. R (https://cloud.oebiotech.cn/task/category/pipeline/, accessed on 10 September 2023) was used to perform a hierarchical cluster analysis of DEGs to show the unigene expression pattern in the various experimental groups and samples. R (software of clusterProfiler and ggplot2) was also used to carry out the KEGG pathway enrichment analysis of DEGs using the hypergeometric distribution. The oebiotech platform (https://cloud.oebiotech.cn/task/category/pipeline/, accessed on 10 September 2023, Shanghai, China) was utilized to create column and bubble diagrams of the significant enrichment pathway.
2.5. Quantitative Real-Time PCR (qRT–PCR) Analysis
The Trizol reagent was employed to extract total RNA from muscle samples following the manufacturer’s instructions. Subsequently, RNA integrity was assessed through 1% agarose gel electrophoresis. cDNA synthesis was performed using the PrimeScript® RT Reagent Kit with gDNA Eraser (Takara Bio Inc., Shiga, Japan), and the resulting cDNA served as a template for qRT–PCR. The list of primers used in this study is presented in Table 1. SYBR®-Premix Ex Taq™ was utilized for qRT–PCR amplifications on an ABI7500 Real-Time PCR Detection System (Applied Biosystems, Waltham, MA, USA) with a 20 µL reaction mixture. The comparative threshold cycle approach (2−ΔΔCT) analysis of target gene expression levels employed elongation factor 1 alpha (EF1α) as the reference gene [28]. Each experiment included three biological replicates.
2.6. Statistical Analyses
The body length, weight, and survival rates of 15 random-choice juvenile fish in two Gymnocypris groups were measured every 3 months. The growth metrics were calculated using the following formulas:
Survival rate (%) = Final number of animals/Initial number of animals,
Weight again rate (WGR%) = (terminal weight − initial weight)/initial weight.
3. Results
3.1. Growth Trait Analysis
Significant differences were observed in the terminal length, weight, survival rate, and weight rate between the GE and GP groups (p < 0.05; Table 2). At 90 days, no significant differences were found in the length, weight, and survival rate (p > 0.05), while GE exhibited faster weight growth than GP (p < 0.05). At 180 days, no significant differences were observed in the survival rate (p > 0.05), but GE showed faster growth in the length, weight, and weight rate compared to GP (p < 0.05). Similarly, at 270 days, no significant differences in the survival rate and weight rate were observed (p > 0.05), but GE demonstrated faster growth in length and weight than GP (p < 0.05).
3.2. Analysis of DEGs between Groups
All gene expression data were used for hierarchical clustering to illustrate relationships between samples from the GP and GE groups. The cluster analysis indicated differences in gene expression between the two groups, with samples of GP and GE clustering separately (Figure 1a). DEGs between GP and GE were identified based on p < 0.05 and absolute log2 (ratio) ≥ 1, revealing 2985 upregulated genes (p < 0.05) and 2589 downregulated genes (p < 0.05) in GP vs. GE (Figure 1b).
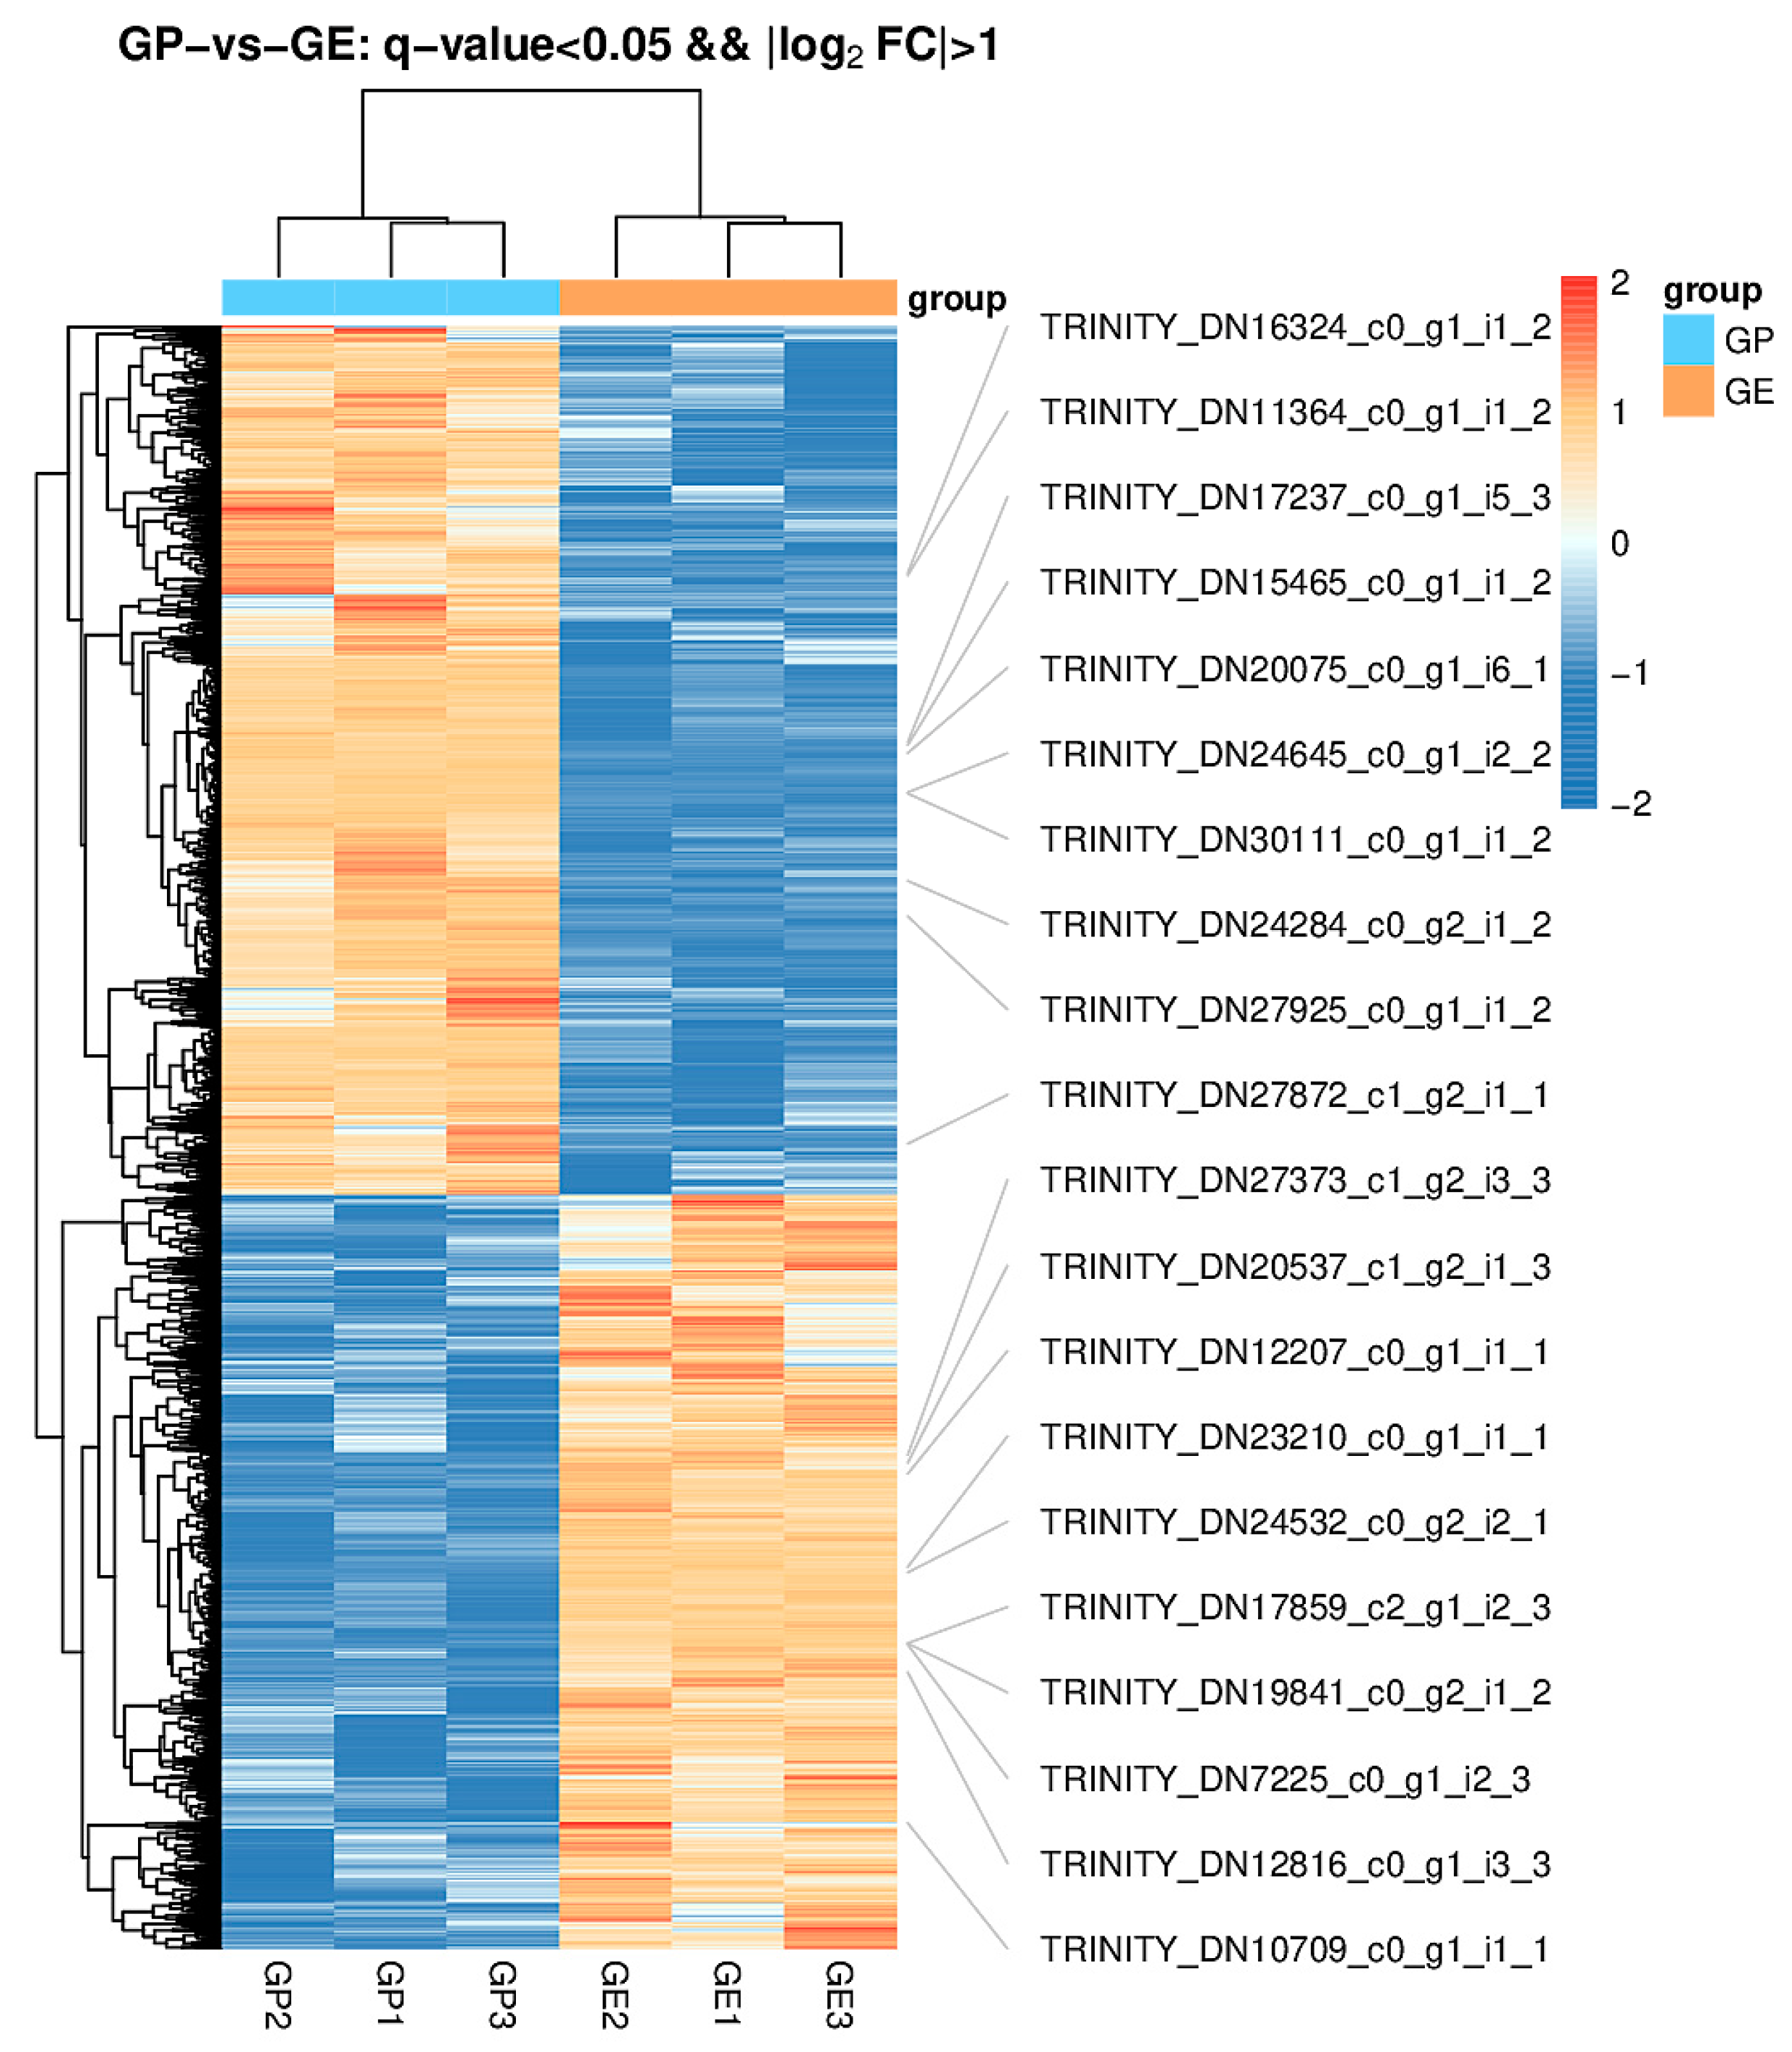
The hierarchical cluster analysis of DEGs was conducted using Trinity [24] to illustrate the expression patterns of unigenes across various groups and samples. The results indicated a significant difference in gene expression patterns between the GP and GE groups (p < 0.05; Figure 2).
The top 30 entries from the Gene Ontology (GO) enrichment analysis, with the top 10 entries in each category ordered by the −log10 p-value of GO entries and the number of different genes (number > 2) in the three categories, are presented in Figure 3. The findings revealed that the primary DEGs were enriched in the immune response, extracellular matrix (ECM), ribosome, protein-glutamine gamma-glutamyltransferase of biological processes, cellular components, and molecular functions, respectively. Notably, the term “insulin-like growth factor II binding” in the GP vs. GE comparison may be a key factor in explaining the growth differences between the GP and GE groups.
3.3. KEGG Pathway Analysis of DEGs
The KEGG pathway classification (Figure 4) showed all DEGs categorized into six groups based on their biological functions: human diseases (1266), organismal systems (866), environmental information processing (543), cellular processes (445), metabolism (316), and genetic information processing (175; Figure 4). Pathways related to the metabolism of GP vs. GE were further subdivided into eight subsets, primarily including amino acid metabolism (60), lipid metabolism (79), carbohydrate metabolism (45), the metabolism of co-factors and vitamins (32), glycan biosynthesis and metabolism (28), and energy metabolism (19; Figure 4). Additionally, subsets such as the immune system (269), endocrine system (189), infectious diseases of a bacterial origin (180), cell growth and death (125), and transport and catabolism (164) were the main components of organismal systems, human diseases, and cellular processes, respectively.
The functional enrichment analysis based on the KEGG pathway classification (Figure 5) revealed six pathways directly related to metabolism in GP vs. GE. Specifically, the main metabolic pathways included glycolysis/gluconeogenesis (ko00010), arginine and proline metabolism (ko00330), arachidonic acid metabolism (ko00590), and glycine, serine, and threonine metabolism (ko00260) in GP vs. GE (Figure 5).
Following KEGG pathway enrichment analyses, key metabolic pathways and growth-related signal pathways were identified for a further analysis in GP vs. GE, including glycolysis/gluconeogenesis (ko00010), fatty acid synthesis (ko00061), oxidative phosphorylation (ko00190), arginine biosynthesis (ko00220), glycine, serine, and threonine metabolism (ko00260), the MAPK signaling pathway (ko04010), the mTOR signaling pathway (ko04150), the TGF-β signaling pathway (ko04350), and the PI3K-Akt signaling pathway (ko04151; Table 3). Emphasis was placed on these pathways and the differentially expressed genes they encompass.
3.4. Validation of DEGs by RT–PCR
Randomly selected DEGs in GP vs. GE (ARG2, FBP1, ODC, GADD45G, PFK-1, LTBP1, IGF2, PKM, GAPDH, and LOG5) underwent validation through a quantitative real-time polymerase chain reaction (qRT–PCR). Primer design was based on the mapped sequences (Table 1). Results from qRT–PCR were compared with those obtained from transcriptome sequencing, and demonstrated consistency between the two different methods (Figure 6).
4. Discussion
4.1. Differences in the Growth Rate
The growth rate is a pivotal commercial trait for aquaculture, influenced by various factors [1,8]. G. przewalskii and G. eckloni are economically vital cold-water fishes in China [15,16], closely related and inhabiting similar waters [21,22]. However, our previous observations indicated a noticeable difference in the growth rates of these two species. In this study, G. eckloni exhibited a significantly faster growth rate than G. przewalskii juveniles. From day 3 to day 270, G. eckloni exhibited 2.2 times the growth rate of G. przewalskii, demonstrating a clear growth advantage. This rapid growth is crucial for economic fish performance. Although existing studies suggest that G. przewalskii tends to grow slowly, potential factors such as Qinghai Lake’s extreme hydrological and climatic conditions may contribute to this difference [21]. Additionally, genetics may be an issue here that drives different growth rates among the two species [1].
4.2. Differences in the Metabolism Pathways
Genetic resources are crucial factors influencing growth rates. The transcriptome provides a useful method for exploring genetic information. Relying on the transcriptome can yield insights into growth differences [4,5,6,29]. This study identified a noticeable growth difference, along with an evident transcriptome distinction. A total of 5574 DEGs were found between G. przewalskii and G. eckloni. Moreover, there were significant differences in gene expression patterns between these two fishes. These DEGs, exhibiting diverse expression patterns, may contribute to the growth rate difference observed among G. przewalskii and G. eckloni.
The glycolysis/gluconeogenesis pathway, primarily regulated by glycolytic genes, has been demonstrated in earlier research to contribute to muscle growth stimulation [30,31]. Studies indicate that the activation of glycolysis/gluconeogenesis in female muscle tissues contributes to sexual size dimorphism in flatfish as key genes involved in glycolysis (e.g., gpi, aldo, tpi, gapdh, bpgm, pgk, eno2, pk and ldh) were expressed to a greater extent in female muscle tissues than in male muscle tissues [31]. In our study, most genes related to glycolysis/gluconeogenesis were downregulated in G. przewalskii, including ENO3 (beta-enolase), PKM (pyruvate kinase), GAPDH (glyceraldehyde-3-phosphate dehydrogenase), PGM-1 (phosphoglucomutase-1), and FBP2 (fructose-1,6-bisphosphatase isozyme 2). These genes, implicated in muscle growth, could explain the growth differences between G. przewalskii and G. eckloni. Additionally, the enzyme pyruvate kinase M2 (PKM2) of glycolysis is a significant mediator of growth signals promoting cell proliferation [32]. The low expression of PKM-1 in G. przewalskii may have contributed to slower growth than in G. eckloni.
Oxidative phosphorylation is the primary pathway for energy production under aerobic conditions, critical for life, growth, and development in fishes. Impaired oxidative phosphorylation in hepatic mitochondria has been linked to growth retardation in rats [33]. Our results indicate that three DEGs related to oxidative phosphorylation were upregulated in G. przewalskii. Two of these genes were associated with proton reflux ATP synthase, playing a crucial role in energy generation. Their upregulation may suggest that G. przewalskii has a more vigorous energy metabolism and a greater energy demand for growth than G. eckloni. Arginine synthesis, with high enzyme activities involved in the urea cycle, is relatively high, especially during the early developmental stage of fish, and is crucial for fish growth; the urea cycle consists of five key enzymes [34]. Arginase (ARG) catalyzes the final step of the ornithine–urea cycle (OUC), leading to the conversion of L-arginine to L-ornithine and urea. ARG exists as two predominant isoforms, namely cytosolic ARG1 and mitochondrial ARG2 [35]. We found that ARG2, the mitochondrial isoform, had the highest expression in G. przewalskii. Three genes (GS, ASS, and ARG2) encoding key enzymes of the urea cycle were upregulated in G. przewalskii. The results of this study indicated that G. eckloni had faster growth and development, while G. przewalskii was still in the early stage of growth and development, perhaps in part because G. przewalskii had an upregulated expression of these three genes compared to G. eckloni. The arachidonic acid pathway plays a crucial role in cardiovascular biology, carcinogenesis, and various inflammatory diseases [36]. The expression of polyunsaturated fatty acid 5-lipoxygenase (LOG5) was low in G. przewalskii. LOG5 converts arachidonic acid to inflammatory mediators in the presence of a 5-lipoxygenase-activating protein [37]. LOG5 overexpression in tumor tissues leads to breast cancer [38], but the specific role of LOG5 in fishes is not yet fully understood.
4.3. Differences in the Relative Growth Pathways
In the modulation of skeletal muscle growth in teleost fishes, MAPK, PI3K-Akt, and mTOR are crucial signaling pathways [6,9]. In our study, growth arrest and DNA damage (GADD) were enriched in the MAPK signaling pathway. The GADD-inducible gene family is often upregulated in response to various environmental stresses and drug therapies. GADD45A, the first stress-inducible gene identified to be upregulated by p53, plays a key role. When GADD45A is deleted or repressed, cells exhibit uncontrolled proliferation [39]. The upregulation of GADD45A in G. przewalskii may retard cell proliferation, potentially explaining why G. przewalskii grows more slowly than G. eckloni.
Most notably, IGF2, a DEG in the MAPK pathway, was found in both G. przewalskii and G. eckloni, with lower expression in G. przewalskii. Previous studies have indicated that IGFs activate signaling molecules involved in fish muscle growth [6,11]. IGFs stimulate muscle growth by promoting myogenic cell proliferation, protein synthesis, and hypertrophy [10,11]. Particularly, IGF1 and IGF2 activate MAPK/ERK and PI3K/AKT signaling pathways in fish skeletal muscle [9,12]. IGF2 has a pronounced and direct effect on muscle growth in fishes; for instance, it activates these pathways in the myogenic cells of the gilt-head sea bream (Sparus aurata) [40] and rainbow trout (Oncorhynchus mykiss) [41]. IGF2 is more potent than IGF1 in stimulating muscle growth in fish species [40,42]. Additionally, IGF2 may contribute to the growth of hybrid grouper (Epinephelus fuscogutatus♀ × Epinephelus lanceolatus♂) by enhancing protein and glycogen synthesis [6], aligning with the findings of this study. The downregulated expression of DEGs (such as ENO3, PKM, GAPDH, PGM-1 and FBP2) in the glycolysis/gluconeogenesis pathway might be controlled by the downregulated expression of IGF2. This raises doubts about whether the regulation of G. przewalskii and G. eckloni growth may be directly influenced by IGF2 through glycogen synthesis.
The mTOR signaling pathway is crucial in cell growth, development, and protein synthesis [43]. In this pathway, some DEGs related to cell growth, such as TBCD7, were observed between G. przewalskii and G. eckloni. TBCD7, an important gene in the mTOR signaling pathway, is identified as the third subunit of the tuberous sclerosis complex (TSC), a negative regulator of cell growth [44]. Our study indicates that TBCD7 expression is upregulated in G. przewalskii, potentially contributing to its slowing of growth. The KEGG pathway analysis revealed significant differences in the expression of genes related to growth- and development-related metabolic pathways, such as the PI3K-Akt signaling pathway and TGF-β signaling pathway [45]. The PI3K/Akt signaling pathway, often enriched in the growth differential transcriptome [46], plays a crucial role. Collagen VI, a major extracellular matrix (ECM) protein, maintains the functional integrity of skeletal muscles [47]. Col6a1 is implicated in ECM remodeling during muscle fibrosis. Col6a1/mice and collagen VI-deficient zebrafish display a myopathic phenotype [47]. Mutations in the three collagen VI genes COL6A1, COL6A2 and COL6A3 cause Bethlem myopathy and Ullrich congenital muscular dystrophy (UCMD) in humans [48]. However, the functions of COL6A1, COL6A2 and COL6A3 in fish muscle growth require further investigation. The TGF-β signaling pathway is also involved in growth- and development-related metabolic pathways [45]. Decorin, a myokine and a connective tissue protein, stimulates connective tissue accretion and muscle hypertrophy [49]. It exerts negative control over cell proliferation by blocking TGF-β [50]. Bone morphogenic proteins (BMPs) are growth factors crucial for skeletal development and bone growth and are regulated by Noggin, a soluble BMP antagonist, partially through feedback inhibition [51]. Compared with G. eckloni, both Decorin and Noggin 2 were weakly expressed in G. przewalskii, suggesting their involvement in the negative regulation of fish muscle growth.
5. Conclusions
In summary, G. eckloni exhibits faster growth than G. przewalskii. The RNA-Seq analysis revealed more than 5574 DEGs between the two species, with the KEGG enrichment pathway highlighting molecular functions related to glycolysis/gluconeogenesis, arachidonic acid metabolism, the citrate cycle, and MAPK, PI3K-Akt, and mTOR signal pathways. This study further uncovers growth-related genes and pathways, emphasizing the potential importance of the differential expression of IGF2 in the growth rate difference between G. eckloni and G. przewalskii. This transcriptome analysis enriches the gene resources for both species, contributing to deeper understanding of the growth mechanisms of Gymnocypris.
Author Contributions
Conceptualization and methodology, software and validation, formal analysis and resources, data curation and writing—original draft preparation, Y.Z.; writing—review and editing, visualization, project administration, funding acquisition, J.Z. All authors have read and agreed to the published version of the manuscript.
Funding
This work was supported by the PhD Start-up Project of Xichang University (Zhou JunMing, grant No. YBZ202240). The funders had no role in the study design, data collection and analysis, decision to publish, or preparation of the manuscript.
Institutional Review Board Statement
The study was conducted according to the guidelines of the Declaration of Helsinki and approved by the Animal Ethics Committee of Xichang University (Code: DKY20230314, Date: 10 August 2023).
Data Availability Statement
The data presented in this study are available on request from the corresponding author. The data are not publicly available due to privacy.
Conflicts of Interest
The authors declare no conflict of interest.
References
- Xie, X.; Liao, X.P.; Xu, Z.S.; Liang, W.L.; Su, Y.L.; Lin, L.; Xie, J.G.; Lin, W.Q. Transcriptome analysis of the muscle of fast-and slow-growing phoenix barb (Spinibarbus denticulatus denticulatus). J. Fish Biol. 2023, 102, 504–515. [Google Scholar] [CrossRef]
- Chandhini, S.; Rejish, K.V.J. Transcriptomics in aquaculture: Current status and applications. Rev. Aquac. 2019, 11, 1379–1397. [Google Scholar] [CrossRef]
- Waiho, K.; Ikhwanuddin, M.; Afiqah-Aleng, N.; Shu-Chien, A.C.; Wang, Y.J.; Ma, H.Y.; Fazhan, H. Transcriptomics in advancing portunid aquaculture: A systematic review. Rev. Aquac. 2022, 14, 2064–2088. [Google Scholar] [CrossRef]
- Lu, X.; Chen, H.M.; Qian, X.Q.; Gui, J.F. Transcriptome analysis of grass carp (Ctenopharyngodon idella) between fast- and slow-growing fish. Comp. Biochem. 2020, 35, 100688. [Google Scholar] [CrossRef] [PubMed]
- Lin, Z.J.; Zhang, Z.Y.; Solberg, M.F.; Chen, Z.Q.; Wei, M.L.; Zhu, F.; Jia, C.F.; Meng, Q.; Zhang, Z.W. Comparative transcriptome analysis of mixed tissues of black porgy (Acanthopagrus schlegelii) with differing growth rates. Aquac. Res. 2021, 52, 5800–5813. [Google Scholar] [CrossRef]
- Sun, Y.; Guo, C.Y.; Wang, D.D.; Li, X.F.; Shi, Q.; Hu, G.J.; Fang, C.; Lin, H.R.; Zhang, Y. Transcriptome analysis reveals the molecular mechanisms underlying growth superiority in a novel grouper hybrid (Epinephelus fuscogutatus♀ × Epinephelus lanceolatus♂). BMC Genet. 2016, 17, 24. [Google Scholar] [CrossRef]
- Gomes, F.; Watanabe, L.; Vianez, J.; Nunes, M.; Cardoso, J.; Lima, C.; Schneider, H.; Sampaio, I. Comparative analysis of the transcriptome of the Amazonian fish species Colossoma macropomum (tambaqui) and hybrid tambacu by next generation sequencing. PLoS ONE 2019, 14, e0212755. [Google Scholar] [CrossRef] [PubMed]
- Wang, Y.D.; Yao, J.J.; Liao, A.M.; Tan, H.F.; Luo, Y.X.; Wu, P.; Wang, S.; Zhang, C.; Qin, Q.B.; Tao, M.; et al. The formation of hybrid fish derived from hybridization of Megalobrama amblycephala (♀) × Siniperca chuatsi (♂). Aquaculture 2022, 548, 737547. [Google Scholar] [CrossRef]
- Fuentes, E.N.; Valdés, J.A.; Molina, A.; Björnsson, B.T. Regulation of skeletal muscle growth in fish by the growth hormone–insulin-like growth factor system. Gen. Comp. Endocrinol. 2013, 192, 136–148. [Google Scholar] [CrossRef] [PubMed]
- Valente, L.; Moutou, K.; Conceição, L.; Engrola, S.; Jmo, F.; Johnston, I. What determines growth potential and juvenile quality of farmed fish species? Rev. Aquac. 2013, 5, S168–S193. [Google Scholar] [CrossRef]
- Yang, S.Y.; Liu, Z.; Yang, Z.Z.; Zhao, Z.M.; Zhang, C.Y.; Gong, Q.; Du, X.G.; Wu, J.Y.; Feng, Y.; Du, J.; et al. Improvement of skeletal muscle growth by GH/IGF growth-axis contributes to growth performance in commercial fleshy sturgeon. Aquaculture 2021, 543, 736929. [Google Scholar] [CrossRef]
- Elia, D.; Madhala, D.; Ardon, E.; Reshef, R.; Halevy, O. Sonic hedgehog promotes proliferation and differentiation of adult muscle cells: Involvement of MAPK/ERK and PI3K/Akt pathways. Biochim. Biophys. Acta Mol. Cell Res. 2007, 1773, 1438–1446. [Google Scholar] [CrossRef]
- Fuentes, E.; Björnsson, B.T.; Valdés, J.; Einarsdottir, I.; Lorca, B.; Alvarez, M.; Molina, A. IGF-i/PI3K/AKT and IGF-I/MAPK/ERK pathways in vivo in skeletal muscle are regulated by nutrition and contribute to somatic growth in the fine flounder. Am. J. Physiol. Regul. 2011, 300, 1532–1542. [Google Scholar] [CrossRef]
- Gahr, S.A.; Vallejo, R.L.; Weber, G.M.; Shepherd, B.S.; Silverstein, J.T.; Rexroad, C.E., 3rd. Effects of short-term growth hormone treatment on liver and muscle transcriptomes in rainbow trout (Oncorhynchus mykiss). Physiol. Genom. 2008, 32, 380–392. [Google Scholar] [CrossRef]
- Qi, D.L.; Chao, Y.; Wu, R.R.; Xia, M.Z.; Chen, Q.C.; Zheng, Z.Q. Transcriptome analysis provides insights into the adaptive responses to hypoxia of a Schizothoracine fish (Gymnocypris eckloni). Front. Physiol. 2018, 9, 1326. [Google Scholar] [CrossRef] [PubMed]
- Wang, Y.S.; Gonzalez, R.J.; Patrick, M.L.; Grosell, M.; Wood, C.M. Unusual physiology of scale-less carp, Gymnocypris przewalskii, in Lake Qinghai: A high altitude alkaline saline lake. Comp. Biochem. Physiol. Part A Mol. Integr. Physiol. 2003, 134, 409–421. [Google Scholar] [CrossRef] [PubMed]
- Dong, Y.Z.; Deng, S.H.; Xiao, W.Y. Artificial propagation of Gymnocypris eckloni herzenstein. Anim. Husb. Feed Sci. 2016, 37, 8–9. (In Chinese) [Google Scholar] [CrossRef]
- Sun, W.C.; Shen, Z.X.; Luo, Y.H.; Wang, G.J. Physical and chemical muscle characteristics by comparative Gymncypris eckloni and Qinghai Lake naked carp (Gymnocypris przewalskii). Food Res. Dev. 2013, 34, 14–17. (In Chinese) [Google Scholar] [CrossRef]
- Xiong, F.; Chen, D.Q.; Duan, X.B. Threatened fishes of the world: Gymnocypris przewalskii (Kessler, 1876) (Cyprinidae: Schizothoracinae). Environ. Biol. Fishes 2010, 87, 351–352. [Google Scholar] [CrossRef]
- Zhang, R.Y.; Ludwig, A.; Zhang, C.F.; Tong, C.; Li, G.G.; Tang, Y.T.; Peng, Z.G.; Zhao, K. Local adaptation of Gymnocypris przewalskii (Cyprinidae) on the Tibetan Plateau. Sci. Rep. 2015, 5, 9780. [Google Scholar] [CrossRef] [PubMed]
- Zhao, K.; Li, J.B.; Yang, G.S.; Duan, Z.Y.; He, S.P.; Chen, Y.Y. Molecular phylogeny of endemic Gymnocyprinus in Qinghai lake and its adjacent water systems. Chin. Sci. Bull. 2005, 50, 1348–1355. (In Chinese) [Google Scholar] [CrossRef]
- Wood, C.M.; Du, J.Z.; Rogers, J.; Brauner, C.J.; Richards, J.G.; Semple, J.W.; Murray, B.W.; Chen, X.Q.; Wang, Y.X. Przewalski’s naked carp (Gymnocypris przewalskii): An Endangered species taking a metabolic holiday in Lake Qinghai, China. Physiol. Biochem. Zool. 2007, 80, 59–77. [Google Scholar] [CrossRef] [PubMed]
- Chen, S.F.; Zhou, Y.Q.; Chen, Y.R.; Gu, J. fastp: An ultra-fast all-in-one FASTQ preprocessor. Bioinformatics 2018, 34, i884–i890. [Google Scholar] [CrossRef] [PubMed]
- Grabherr, M.G.; Haas, B.J.; Yassour, M.; Levin, J.Z.; Thompson, D.A.; Amit, I.; Adiconis, X.; Fan, L.; Raychowdhury, R.; Zeng, Q.D.; et al. Trinity: Reconstructing a full-length transcriptome without a genome from RNA-Seq data. Nat. Biotechnol. 2013, 29, 644–652. [Google Scholar] [CrossRef]
- Langmead, B.; Salzberg, S.L. Fast gapped-read alignment with Bowtie 2. Nat. Methods 2012, 9, 357–359. [Google Scholar] [CrossRef] [PubMed]
- Roberts, A.; Pachter, L. Streaming fragment assignment for real-time analysis of sequencing experiments. Nat. Methods 2013, 10, 71–73. [Google Scholar] [CrossRef]
- Anders, S.; Huber, W. Differential expression of RNA-Seq data at the gene level—The DESeq package. Eur. Mol. Biol. Lab. (EMBL) 2013, 10, f1000research. [Google Scholar]
- Zhang, H.C.; Xu, B.K.; A, L.L.; Ma, Q.H.; Gao, Q.; Tian, W.G.; Yu, L.X.; Liang, J. Cloning, tissue expression and polymorphism of MHCⅡ gene of Gymnocypris. J. Fish China 2023, 1–18. [Google Scholar] [CrossRef]
- Cao, X.L.; Cui, H.; Ji, X.Y.; Li, B.H.; Ji, X.Y.; Lu, R.H.; Zhang, Y.R.; Chen, J.J. Determining the potential roles of branched-chain amino acids in the regulation of muscle growth in common carp (Cyprinus carpio) Based on transcriptome and microRNA sequencing. Aquac. Nutr. 2023, 7965735. [Google Scholar] [CrossRef]
- Tixier, V.; Bataillé, L.; Etard, C.; Jaglaet, K. Glycolysis supports embryonic muscle growth by promoting myoblast fusion. Proc. Natl. Acad. Sci. USA 2013, 110, 18982–18987. [Google Scholar] [CrossRef]
- Wang, N.; Tian, Y.S.; Zhang, J.J.; Li, Z.T.; Cheng, M.L.; Wu, Y.P. Involvement of glycolysis activation in flatfish sexual size dimorphism: Insights from transcriptomic analyses of Platichthys stellatus and Cynoglossus semilaevis. Comp. Biochem. Phys. D Genom. Proteom. 2021, 39, 100832. [Google Scholar] [CrossRef] [PubMed]
- Gao, X.L.; Wang, H.Z.; Yang, J.J.; Chen, J.M.; Jie, J.; Li, L.W.; Liu, Z.R. Reciprocal regulation of protein kinase and pyruvate kinase activities of pyruvate kinase M2 by growth signals. J. Biol. Chem. 2013, 288, 15971–15979. [Google Scholar] [CrossRef] [PubMed]
- Peterside, I.E.; Selak, M.A.; Simmons, R.A. Impaired oxidative phosphorylation in hepatic mitochondria in growth-retarded rats. Am. J. Physiol. Endocrinol. Metab. 2003, 285, E1258. [Google Scholar] [CrossRef] [PubMed]
- Wang, Q.C.; Xu, Z.; Ai, Q.H. Arginine metabolism and its functions in growth, nutrient utilization, and immunonutrition of fish. Anim. Nutr. 2021, 7, 716–727. [Google Scholar] [CrossRef]
- Banerjee, B.; Koner, D.; Lal, P.; Sahaet, N. Unique mitochondrial localization of arginase 1 and 2 in hepatocytes of air-breathing walking catfish, Clarias batrachus and their differential expression patterns under hyper-ammonia stress. Gene 2017, 622, 13. [Google Scholar] [CrossRef] [PubMed]
- Wang, B.; Wu, L.J.; Chen, J.; Dong, L.L.; Chen, C.; Wen, Z.; Hu, J.; Fleming, I.; Wang, D.W. Metabolism pathways of arachidonic acids: Mechanisms and potential therapeutic targets. Signal Transduct. Target. Ther. 2021, 6, 94. [Google Scholar] [CrossRef] [PubMed]
- Rubin, P.; Mollison, K.W. Pharmacotherapy of diseases mediated by 5-lipoxygenase pathway eicosanoids. Prostaglandins Other Lipid Mediat. 2007, 83, 188–197. [Google Scholar] [CrossRef] [PubMed]
- Jiang, W.G.; Douglas-Jones, A.; Mansel, R.E. Levels of expression of lipoxygenases and cyclooxygenase-2 in human breast cancer. Prostaglandins Leukot. Essent. Fat. Acids 2003, 69, 275–281. [Google Scholar] [CrossRef]
- Siafakas, A.R.; Richardson, D.R. Growth arrest and DNA damage-45 alpha (GADD45α). Int. J. Biochem. Cell B 2009, 41, 986–989. [Google Scholar] [CrossRef]
- Montserrat, N.; Capilla, E.; Navarro, I.; Gutiérrez, J. Metabolic effects of insulin and IGFs on gilthead sea bream (Sparus aurata) muscle cells. Front. Endocrinol. 2012, 3, 55. [Google Scholar] [CrossRef]
- Codina, M.; García de la Serrana, D.; Sánchez-Gurmaches, J.; Montserrat, N.; Chistyakova, O.; Navarro, I.; Gutiérrez, J. Metabolic and mitogenic effects of IGF-II in rainbow trout (Oncorhynchus mykiss) myocytes in culture and the role of IGF-II in the PI3K/Akt and MAPK signalling pathways. Gen. Comp. Endocrinol. 2008, 157, 116–124. [Google Scholar] [CrossRef]
- Rius-Francino, M.; Acerete, L.; Jiménez-Amilburu, V.; Capilla, E.; Navarro, I.; Gutiérrez, J. Differential effects on proliferation of GH and IGFs in sea bream (Sparus aurata) cultured myocytes. Gen. Comp. Endocrinol. 2011, 172, 44–49. [Google Scholar] [CrossRef]
- Tang, Y. The Study of mTOR Signal Pathway in the Regulation of the Rapid Growth of Fish Species. Master’s Thesis, Hunan Normal University, Changsha, China, 2020. [Google Scholar]
- Ren, S.X.; Huang, Z.Y.; Jiang, Y.Q.; Wang, T. dTBC1D7 regulates systemic growth independently of TSC through insulin signaling. J. Cell Biol. 2018, 217, 517–526. [Google Scholar] [CrossRef]
- Zhang, J.H.; Shen, Y.B.; Xu, X.Y.; Dai, Y.F.; Li, J.L. Transcriptome Analysis of the liver and muscle tissues of black carp (Mylopharyngodon piceus) of different growth rates. Mar. Biotechnol. 2020, 22, 706–716. [Google Scholar] [CrossRef]
- Xie, N.N.; Tian, J.; Meng, X.L.; Dong, L.X.; Jiang, M.; Wen, H.; Lu, X. DNA methylation profiling and transcriptome sequencing reveal the molecular mechanism of the high-carbohydrate diet on muscle growth of grass carp (Ctenopharyngodon idella). Aquac. Rep. 2023, 30, 101545. [Google Scholar] [CrossRef]
- Sabatelli, P.; Gualandi, F.; Gara, S.K.; Grumati, P.; Zamparelli, A.; Martoni, E.; Pellegrini, C.; Merlini, L.; Ferlini, A.; Bonaldo, P.; et al. Expression of collagen VI α5 and α6 chains in human muscle and in Duchenne muscular dystrophy-related muscle fibrosis. Matrix Biol. 2012, 31, 187–196. [Google Scholar] [CrossRef] [PubMed]
- Baker, N.L.; Mörgelin, M.; Rachel, P.; Nathalie, G.; North, K.N.; Bateman, J.F.; Lamandé, S.R. Dominant collagen VI mutations are a common cause of Ullrich congenital muscular dystrophy. Hum. Mol. Genet. 2005, 14, 279–293. [Google Scholar] [CrossRef]
- Bahl, N.; Stone, G.; Mclean, M.; Ho, K.K.Y.; Vita Birzniece, V. Decorin, a growth hormone-regulated protein in humans. Eur. J. Endocrinol. 2018, 178, 145–152. [Google Scholar] [CrossRef] [PubMed]
- Zhu, W.; Kim, J.H.; Cheng, C.; Rawlins, B.A.; Boachie-Adjei, O.; Crystal, R.G.; Hidaka, C. Noggin regulation of bone morphogenetic protein (BMP) 2/7 heterodimer activity in vitro. Bone 2006, 39, 61–71. [Google Scholar] [CrossRef]
- De Luca, A.; Santra, M.; Baldi, A.; Giordano, A.; Iozzo, R.V. Decorin-induced growth suppression is associated with up-regulation of p21, an inhibitor of cyclin-dependent kinases. J. Biol. Chem. 1996, 271, 18961–18965. [Google Scholar] [CrossRef] [PubMed]
Figure 1.
(a) Sample-to-sample distances in each group. The GP group includes samples GP1, GP2, and GP3; the GE group includes samples GE1, GE2, and GE3. (b) Volcano plots depicting differentially expressed genes (DEGs) in the GP vs. GE.
Figure 1.
(a) Sample-to-sample distances in each group. The GP group includes samples GP1, GP2, and GP3; the GE group includes samples GE1, GE2, and GE3. (b) Volcano plots depicting differentially expressed genes (DEGs) in the GP vs. GE.

Figure 2.
Hierarchical cluster analysis of differentially expressed genes of G. przewalskii (GP) and G. eckloni (GE). The GP group includes samples GP1, GP2, and GP3; the GE group includes samples of GE1, GE2, and GE3. Different colors represent different relative abundances of genes, where red represents higher intensity, and blue represents lower intensity. The tree on the left represents the clustering of cells in the ordinate axis, and the tree on the top represents the clustering of samples of each group.

Figure 3.
Top 30 results in the Gene Ontology pathway enrichment analyses of differentially expressed genes in the muscles of G. przewalskii (GP) vs. G. eckloni (GE).
Figure 3.
Top 30 results in the Gene Ontology pathway enrichment analyses of differentially expressed genes in the muscles of G. przewalskii (GP) vs. G. eckloni (GE).

Figure 4.
Kyoto Encyclopedia of Genes and Genomes pathway enrichment analyses of differentially expressed genes in the muscles in G. przewalskii (GP) vs. G. eckloni (GE).
Figure 4.
Kyoto Encyclopedia of Genes and Genomes pathway enrichment analyses of differentially expressed genes in the muscles in G. przewalskii (GP) vs. G. eckloni (GE).

Figure 5.
Enrichment analysis of differentially expressed genes in Kyoto Encyclopedia of Genes and Genomes pathways (top 20) in G. przewalskii (GP) vs. G. eckloni (GE). The horizontal axis in the figure is the enrichment score; larger bubble denotes a more substantial number of genes in the enriched pathway, the bubble color changes from blue–yellow–red, and the smaller the enrichment p-value, the greater the significance.

Figure 6.
Data comparison for validation of differentially expressed genes (DEGs) using reverse transcription–polymerase chain reaction (RT–PCR) and RNA-Seq in G. przewalskii (GP) vs. G. eckloni (GE). The blue bar indicates the expression levels of DEGs by RNA-Seq in GP vs. GE, and the yellow bar represents the expression levels of DEGs by quantitative real-time RT–PCR in GP vs. GE. A value above the line of Y = 0 represents upregulation (p < 0.05), and a value below the line of Y = 0 represents downregulation (p < 0.05). ARG2, arginase 2; FBP1, fructose-1,6-bisphosphatase 1; ODC, ornithine decarboxylase; GADD45G, growth-arrest- and DNA-damage-inducible protein; PFK-1, ATP-dependent 6-phosphofructokinase; LTBP1, latent-transforming growth factor beta-binding protein 1; IGF2, insulin-like growth factor 2; PKM, pyruvate kinase; GAPDH, glyceraldehyde-3-phosphate dehydrogenase; LOG5, polyunsaturated fatty acid 5-lipoxygenase.


Table 1.
Primers used for RT–PCR assay for the validation of DEGs.
| Gene Name | Primer Name | Primer (5′-3′) |
|---|---|---|
| FBP1 | FBP1 F | AGCATGGTATGATGAAGCACAGTAC |
| FBP1 R | GCAGTTGAAGACGGTCCTTAGGT | |
| GAPDH | GAPDH F | GGCGTCGTTCGTGGTCTTCA |
| GAPDH R | CGTCCTCGGATCAGCAGAACTC | |
| PFKl | PFKl F | CTCCTCATCCTCCTCATCCTCATCC |
| PFKl R | CGAAGCACGAGCACGACATCTATT | |
| IGF2 | IGF2 F | GTGCTCACACGCTCTTCCAGTT |
| IGF2 R | CGTTCGGCGGCTTCTTTGTTCT | |
| PKM | PKM F | ATGATGAGGAGGAGCGTGAAGAGT |
| PKM R | CGAACAGACAGGCGTCCAGAAC | |
| ODC | ODC F | TGGACCAATCTCAAGTTCAGGAAGT |
| ODC R | GCAGAGAACCAGAATCACATCACAG | |
| ARG2 | ARG2 F | GGAGACCTGACCTTCAAGCATCTG |
| ARG2 R | AGCGTGACCTTCTACTGAACCAATC | |
| GADD45G | GADD45G F | CAAGCCTCCTGTGCCACTCAA |
| GADD45G R | AGACTCTTCTTCGCCTTCAATCTCA | |
| LOG5 | LOG5 F | AAGGCTAATGGCATCGGTGGAA |
| LOG5 R | TCCTCGTCCTCCTGAACTGTCTC | |
| LTBP1 | LTBP1 F | CAGGATTCAAGGACTCTCAGGATGG |
| LTBP1 R | CCTCTGGTGTGACTGGTGGTGTA | |
| EF1α | EF1α F | GTATTACCATTGACATTGC |
| EF1α R | CTGAGAAGTACCAGTGAT |
Note: FBP1 is fructose-1,6-bisphosphatase 1; GAPDH, glyceraldehyde-3-phosphate dehydrogenase; PFK1, ATP-dependent 6-phosphofructokinase; IGF2, insulin-like growth factor II; PKM, pyruvate kinase; ODC, ornithine decarboxylase; ARG2, arginase 2; GADD45G, growth-arrest- and DNA-damage-inducible protein; LOG5, polyunsaturated fatty acid 5-lipoxygenase; LTBP1, latent-transforming growth factor beta-binding protein 1; EF1α, elongation factor 1 alpha.
Table 2.
Growth trait measurements of G. przewalskii (GP) and G. eckloni (GE).
| Day | Group | Length (cm) | Weight (g) | Weight Gain Rate (%, Month) | Survival Rate (%) |
|---|---|---|---|---|---|
| 3 | GP | 1.32 ± 0.14 | 0.40 ± 0.05 | - | - |
| CE | 1.41 ± 0.17 | 0.41 ± 0.05 | - | - | |
| 90 | GP | 4.81 ± 0.49 | 1.71 ± 0.51 | 115.95 ± 32.30 b | 92.80 |
| CE | 5.92 ± 0.72 | 2.80 ± 0.61 | 228.90 ± 51.30 a | 94.30 | |
| 180 | GP | 7.60 ± 0.83 b | 6.82 ± 1.43 b | 107.28 ± 31.16 b | 94.29 |
| CE | 11.58 ± 1.35 a | 17.83 ± 3.39 a | 182.61 ± 33.99 a | 95.86 | |
| 270 | GP | 11.18 ± 1.56 b | 16.33 ± 3.17 b | 45.79 ± 10.07 | 95.77 |
| CE | 16.94 ± 1.95 a | 36.39 ± 8.40 a | 34.42 ± 7.27 | 97.12 | |
| 3–270 | GP | - | - | 425.44 ± 65.30 b | 83.80 |
| CE | - | - | 964.45 ± 150.53 a | 87.80 |
Values (expressed as mean ± SD) with different letters in the same list on same day are significantly different from each other (p < 0.05).
Table 3.
Metabolic and growth-relative pathways’ differentially expressed genes identified in the muscle of G. przewalskii (GP) vs. G. eckloni (GE) by transcriptomic analysis.
Table 3.
Metabolic and growth-relative pathways’ differentially expressed genes identified in the muscle of G. przewalskii (GP) vs. G. eckloni (GE) by transcriptomic analysis.
| Swiss-Prot Annotation | Swiss-Prot Id | log2FC | p-Value |
|---|---|---|---|
| Metabolism | |||
| Glycolysis/gluconeogenesis (ko00010) | |||
| Fructose-1,6-bisphosphatase 1, FBP1 | Q3SZB7 | 2.9663 | 0.0022 |
| ATP-dependent 6-phosphofructokinase, PFK-l | P12382 | 1.5851 | 3.00 × 10⁻¹⁸ |
| Fructose-bisphosphate aldolase C, ALDOC | P53448 | 1.1698 | 1.73 × 10⁻²⁶ |
| Fructose-1,6-bisphosphatase isozyme 2, FBP2 | Q9N0J6 | −1.0720 | 1.87 × 10−43 |
| Beta-enolase, ENO3 | B5DGQ7 | −1.1410 | 3.87 × 10−60 |
| Pyruvate kinase, PKM | Q92122 | −1.3675 | 4.19 × 10⁻²⁹ |
| Glyceraldehyde-3-phosphate dehydrogenase, GAPDH | Q5XJ10 | −1.3808 | 1.06 × 10−63 |
| Phosphoglycerate mutase 2, PGAM2 | P15259 | −1.3868 | 4.98 × 10−73 |
| Phosphoglucomutase-1, PGM-1 | Q08DP0 | −2.9078 | 1.56 × 10⁻⁷ |
| Fatty acid biosynthesis (ko00061) | |||
| Long-chain-fatty-acid-CoA ligase 4, ACSL4 | Q9QUJ7 | 2.3333 | 1.93 × 10−45 |
| Enoyl-[acyl-carrier-protein] reductase, MECR | Q28GQ2 | 1.9786 | 0.0047 |
| Glutaryl-CoA dehydrogenase, GCDH | Q2KHZ9 | 1.6638 | 3.80 × 10−124 |
| Long-chain-fatty-acid-CoA ligase 1, ACSL1 | Q9JID6 | −1.0999 | 2.52 × 10⁻⁹ |
| Long-chain-fatty-acid-CoA ligase, ACBG2 | Q7ZYC4 | −1.3741 | 1.14 × 10⁻⁶ |
| Oxidative phosphorylation (ko00190) | |||
| Cytochrome c oxidase subunit 1, COX1 | O78681 | 1.3706 | 7.66 × 10−70 |
| V-type proton ATPase 16 kDa proteolipid subunit, ATP6C | P27449 | 1.3687 | 2.71 × 10⁻²⁰ |
| V-type proton ATPase subunit S1, ATP6IP1 | P40682 | 1.0171 | 3.27 × 10⁻⁵ |
| Arginine biosynthesis (ko00220) | |||
| Arginase, non-hepatic 2, ARG2 | Q91554 | 3.0893 | 7.09 × 10−188 |
| Glutamine synthetase, GS | Q4R7U3 | 2.8844 | 0.0002 |
| Argininosuccinate synthase, ASS | Q66I24 | 1.3530 | 2.09 × 10⁻¹⁸ |
| Alanine aminotransferase 2-like, ALAT2 | Q6NYL5 | 1.0654 | 8.87 × 10⁻⁵ |
| Glycine, serine, and threonine metabolism (ko00260) | |||
| Glycine cleavage system H protein, GCSH | P11183 | 1.9057 | 1.25 × 10⁻⁷ |
| Glycine dehydrogenase (decarboxylating), GLDC | P23378 | 1.8935 | 9.32 × 10−43 |
| L-threonine 3-dehydrogenase, TDH | Q2KIR8 | 1.5801 | 4.53 × 10−42 |
| 2-Amino-3-ketobutyrate coenzyme A ligase, KBL | O75600 | 1.0194 | 2.34 × 10⁻¹² |
| Guanidinoacetate N-methyltransferase, GAMT | Q71N41 | −1.0939 | 2.06 × 10−38 |
| 5-Aminolevulinate synthase, erythroid-specific, ALAS-E | Q9YHT4 | −1.3104 | 4.77 × 10−55 |
| Phosphoserine phosphatase, PSPH | P78330 | −1.4583 | 1.82 × 10⁻⁸ |
| Arginine and proline metabolism (ko00330) | |||
| Ornithine decarboxylase, ODC | P09057 | 2.1095 | 1.96 × 10−102 |
| Creatine kinase S-type, CKS | P11009 | 1.2791 | 0.0054 |
| Prolyl 4-hydroxylase subunit alpha-1, P4HA1 | Q1RMU3 | 1.0175 | 4.95 × 10⁻⁸ |
| Spermine oxidase, SMO | Q70LA7 | −1.0509 | 5.59 × 10⁻¹¹ |
| Creatine kinase B-type, CKB | P05122 | −1.1671 | 2.80 × 10⁻¹⁷ |
| Arachidonic acid metabolism (ko00590) | |||
| Prostacyclin synthase, PTGIS | F1RE08 | 2.0229 | 2.97 × 10⁻³⁵ |
| Prostaglandin G/H synthase 2, COX2 | P70682 | 1.7387 | 6.57 × 10−94 |
| Prostaglandin E synthase, PTGES | Q95L14 | 1.7151 | 1.04 × 10−62 |
| Polyunsaturated fatty acid 5-lipoxygenase, LOG5 | P09917 | −2.4108 | 6.26 × 10⁻⁸ |
| Growth-relative pathways | |||
| MAPK signaling pathway (ko04013) | |||
| Growth-arrest- and DNA-damage-inducible protein gamma, GADD45G | Q2KIX1 | 2.0844 | 2.02 × 10−55 |
| Growth-arrest- and DNA-damage-inducible protein beta, GADD45B | O75293 | 1.7536 | 1.46 × 10−135 |
| Dual-specificity protein phosphatase 1-A, DUSP1-A | Q91790 | 1.5648 | 1.18 × 10−174 |
| Growth-arrest- and DNA-damage-inducible protein alpha, GADD45A | P24522 | 1.0219 | 2.70 × 10⁻⁷ |
| Insulin-like growth factor II, IGF2 | Q02816 | −1.2402 | 5.33 × 10⁻¹¹ |
| Mast/stem cell growth factor receptor, KITA | Q8JFR5 | −1.2955 | 1.96 × 10⁻⁹ |
| Ribosomal protein S6 kinase alpha-5, MSK1 | Q8C050 | −3.9579 | 0.0126 |
| mTOR signaling pathway (ko04150) | |||
| Large neutral amino acid transporter small subunit 5, SLC7A5 | Q7YQK4 | 1.5903 | 3.22 × 10⁻⁷ |
| TBC1 domain family member 7, TBC1D7 | F1QRX7 | 1.2640 | 1.25 × 10⁻⁷ |
| CAP-Gly domain-containing linker protein 1, CLIP1 | O42184 | 1.1088 | 3.60 × 10⁻³¹ |
| Rapamycin-insensitive companion of mTOR Rictor, RICTR | Q6QI06 | 1.1008 | 3.20 × 10⁻¹¹ |
| E3 ubiquitin-protein ligase, RNF152 | Q58EC8 | −2.1847 | 0.0064 |
| PI3K-Akt signaling pathway (ko04151) | |||
| Integrin alpha-6 light chain, ITGA6 | P26007 | 1.8209 | 3.80 × 10−91 |
| Integrin alpha-3 light chain, ITA3 | Q62470 | 1.8050 | 2.42 × 10⁻²¹ |
| Collagen alpha-1(VI) chain, COL6A1 | P12109 | −1.5839 | 6.26 × 10−65 |
| Collagen alpha-2(I) chain, COL1A2 | O93484 | −2.1801 | 3.16 × 10−151 |
| Collagen alpha-1(I) chain, COL1A1 | P02457 | −2.3289 | 1.42 × 10−189 |
| TGF-beta signaling pathway (ko04350) | |||
| Latent-transforming growth factor beta-binding protein 1, LTBP1 | Q00918 | −1.0871 | 0.0030 |
| Decorin | Q29393 | −1.3786 | 8.19 × 10−105 |
| Repulsive guidance molecule A, RGMA | Q8JG54 | −1.6540 | 1.56 × 10⁻¹² |
| Noggin-2, NOGG2 | Q9W740 | −2.6002 | 0.0115 |
Disclaimer/Publisher’s Note: The statements, opinions and data contained in all publications are solely those of the individual author(s) and contributor(s) and not of MDPI and/or the editor(s). MDPI and/or the editor(s) disclaim responsibility for any injury to people or property resulting from any ideas, methods, instructions or products referred to in the content. |
© 2024 by the authors. Licensee MDPI, Basel, Switzerland. This article is an open access article distributed under the terms and conditions of the Creative Commons Attribution (CC BY) license (https://creativecommons.org/licenses/by/4.0/).
Share and Cite
MDPI and ACS Style
Zhao, Y.; Zhou, J. Molecular Mechanisms of Growth Differences in Gymnocypris przewalskii and Gymnocypris eckloni through a Comparative Transcriptome Perspective. Fishes 2024, 9, 89. https://doi.org/10.3390/fishes9030089
AMA Style
Zhao Y, Zhou J. Molecular Mechanisms of Growth Differences in Gymnocypris przewalskii and Gymnocypris eckloni through a Comparative Transcriptome Perspective. Fishes. 2024; 9(3):89. https://doi.org/10.3390/fishes9030089
Chicago/Turabian StyleZhao, Yun, and Junming Zhou. 2024. "Molecular Mechanisms of Growth Differences in Gymnocypris przewalskii and Gymnocypris eckloni through a Comparative Transcriptome Perspective" Fishes 9, no. 3: 89. https://doi.org/10.3390/fishes9030089