Article

Using qPCR to Identify Potential Effects of Thermal Conditions during Embryogenesis on Mitochondrial DNA Copy Number in Juvenile Brown Trout Salmo trutta

1
River Ecology and Management Research Group, Department of Environmental and Life Sciences, Karlstad University, 651 88 Karlstad, Sweden
2
Norwegian Institute for Nature Research, 0855 Oslo, Norway
*
Author to whom correspondence should be addressed.
Fishes 2024, 9(4), 142; https://doi.org/10.3390/fishes9040142
Submission received: 27 February 2024 / Revised: 16 April 2024 / Accepted: 16 April 2024 / Published: 19 April 2024

Abstract

:
Changes in the number, structure, and function of mitochondria during the early life stages of animals can play an important role for an organism’s metabolic rate, growth, and health. Previous studies have shown that juvenile brown trout (Salmo trutta) subjected to elevated temperatures during the embryonic stage respond phenotypically with a reduced metabolic rate. The aim of this study was to explore if embryonic temperature affects the mitochondria content of young brown trout and as such explains the previously found differences in metabolic rates. Here, we optimize a quantitative PCR (qPCR) method for the mitochondria cytochrome c oxidase subunit I gene, and then use the method as a proxy for mitochondrial DNA content. We hypothesize that young trout subjected to elevated temperatures during the embryonic stage respond phenotypically with a reduced mitochondrial DNA content. To test this hypothesis, we subjected brown trout to either control ambient (4.4 ± 1.5 °C) or elevated temperatures (7.1 ± 0.6 °C) during embryogenesis. Subsequently, we extracted DNA from liver and white muscle tissue of juvenile brown trout from the two different incubation temperature treatments and successively optimized qPCR for mitochondrial DNA. We found that the amount of mitochondria DNA in liver tissue was 18 times higher than in white muscle tissue, but there was no significant difference in mitochondria content in liver or muscle tissue between brown trout exposed to elevated and ambient control temperatures during embryogenesis. We conclude that reduced metabolic rate is not likely associated with mitochondria DNA content. We also suggest that qPCR is a simple and cost-effective method to quantify mitochondria DNA in frozen and partly degraded tissue from different treatment groups and a useful proxy for identification of differences in mitochondria number.
Key Contribution: The optimized qPCR for the mitochondria COI gene is a simple and cost-effective method to quantify mitochondria DNA copy number in frozen tissue from different treatment groups. Our study indicates that the altered metabolic rates reported for juvenile trout in response to differences in embryonic temperatures cannot be explained by changes in mitochondria DNA copy number.

1. Introduction

Changes in thermal conditions due to climate change are expected to affect wild fish populations in temperate regions by a number of different ways, which include effects on metabolic scope, growth, and life history traits [1,2]. In the context of thermal adaptation/acclimation, mitochondria are described as key metabolic structures determining the thermal range that organisms can tolerate. The catalytic capacity of these cellular organelles is highly sensitive to thermal variation, and to some extent, determines the temperature dependence of an organism’s biological functions [3]. For fishes and other aquatic ectotherms that live in thermal equilibrium with the ambient environment, changes in thermal conditions can influence metabolic demands on the organisms. An increase in oxidative capacity and metabolic rate often relates to an increase in mitochondrial volume or density, which is inherently achieved via the enlargement of mitochondria or via increased number of mitochondria [4]. Quantitative changes in mitochondrial DNA (mtDNA) usually correlate with the number of mitochondria, and the mtDNA content can therefore be used as an indicator for an organism’s oxidative capacity and metabolism [5,6]. Nevertheless, the mtDNA copy number per mitochondria can vary depending on tissue type as well as other factors such as age, diet, and exposure to environmental contaminants [5,7,8,9,10]. In the early stages of an organism’s development, environmental factors, such as temperature, play a significant role in shaping embryonic development, metabolism, growth, and overall fitness [6,11]. Two studies of fish have shown that early thermal conditions experienced in the egg stage affect energetic requirements of a fish in its juvenile stage [2,12]. For example, [2] showed that elevated temperature at the embryonic stage resulted in reduced metabolic rates for juvenile brown trout (Salmo trutta). The reduced metabolic rate could be a result of hormonal differences, a change in mitochondrial number, changes in mitochondrial enzyme activities, in oxidative capacity of mitochondria, or a change in gene regulation [6,13].
Mitochondrial adaptation in teleosts can be investigated by a variety of methods, thus providing different mechanistic insights. Many of the methods used to study mitochondria function, such as the western blot technique for mitochondrial protein studies, centrifugation procedures to isolate mitochondria, and microscopy combined with staining of mitochondria are not suitable for use on frozen and partly degraded tissue. In this latter case, qPCR is a good method to use to determine mtDNA copy number [14,15,16].
The PCR method is a simple and cost-effective relative method. It can detect specific genes, such as, for example, the cytochrome C oxidase unit I (COI) gene, which is present in the mitochondrial genome. A quantitative PCR (qPCR) method for a specific gene generates results in the form of a cycle threshold (Ct) value, which reflects the number of cycles required for a fluorescent signal to cross the threshold in a qPCR reaction. The lower the Ct value, the more the actual nucleic acid sequence is present in the sample. When using qPCR, the level of a control gene, i.e., a housekeeping gene, is analyzed and the expression of this gene enables adjustments for differences in DNA extraction and qPCR efficiency [14,17,18].
Previous studies have shown that incubation temperature affects metabolic rate of brown trout [2,12], but no mechanisms behind this difference have been tested. One possible explanation for the observed difference in metabolic rates could be related to mtDNA. We hypothesize that brown trout subjected to elevated temperatures during the embryonic stage respond phenotypically with a reduced mtDNA content in the juvenile stage. In addition to testing this hypothesis, we develop and optimize a qPCR method for quantification of mtDNA using frozen liver and muscle tissue taken from juvenile brown trout subjected to the two different incubation temperatures: cold ambient and elevated.

2. Materials and Methods

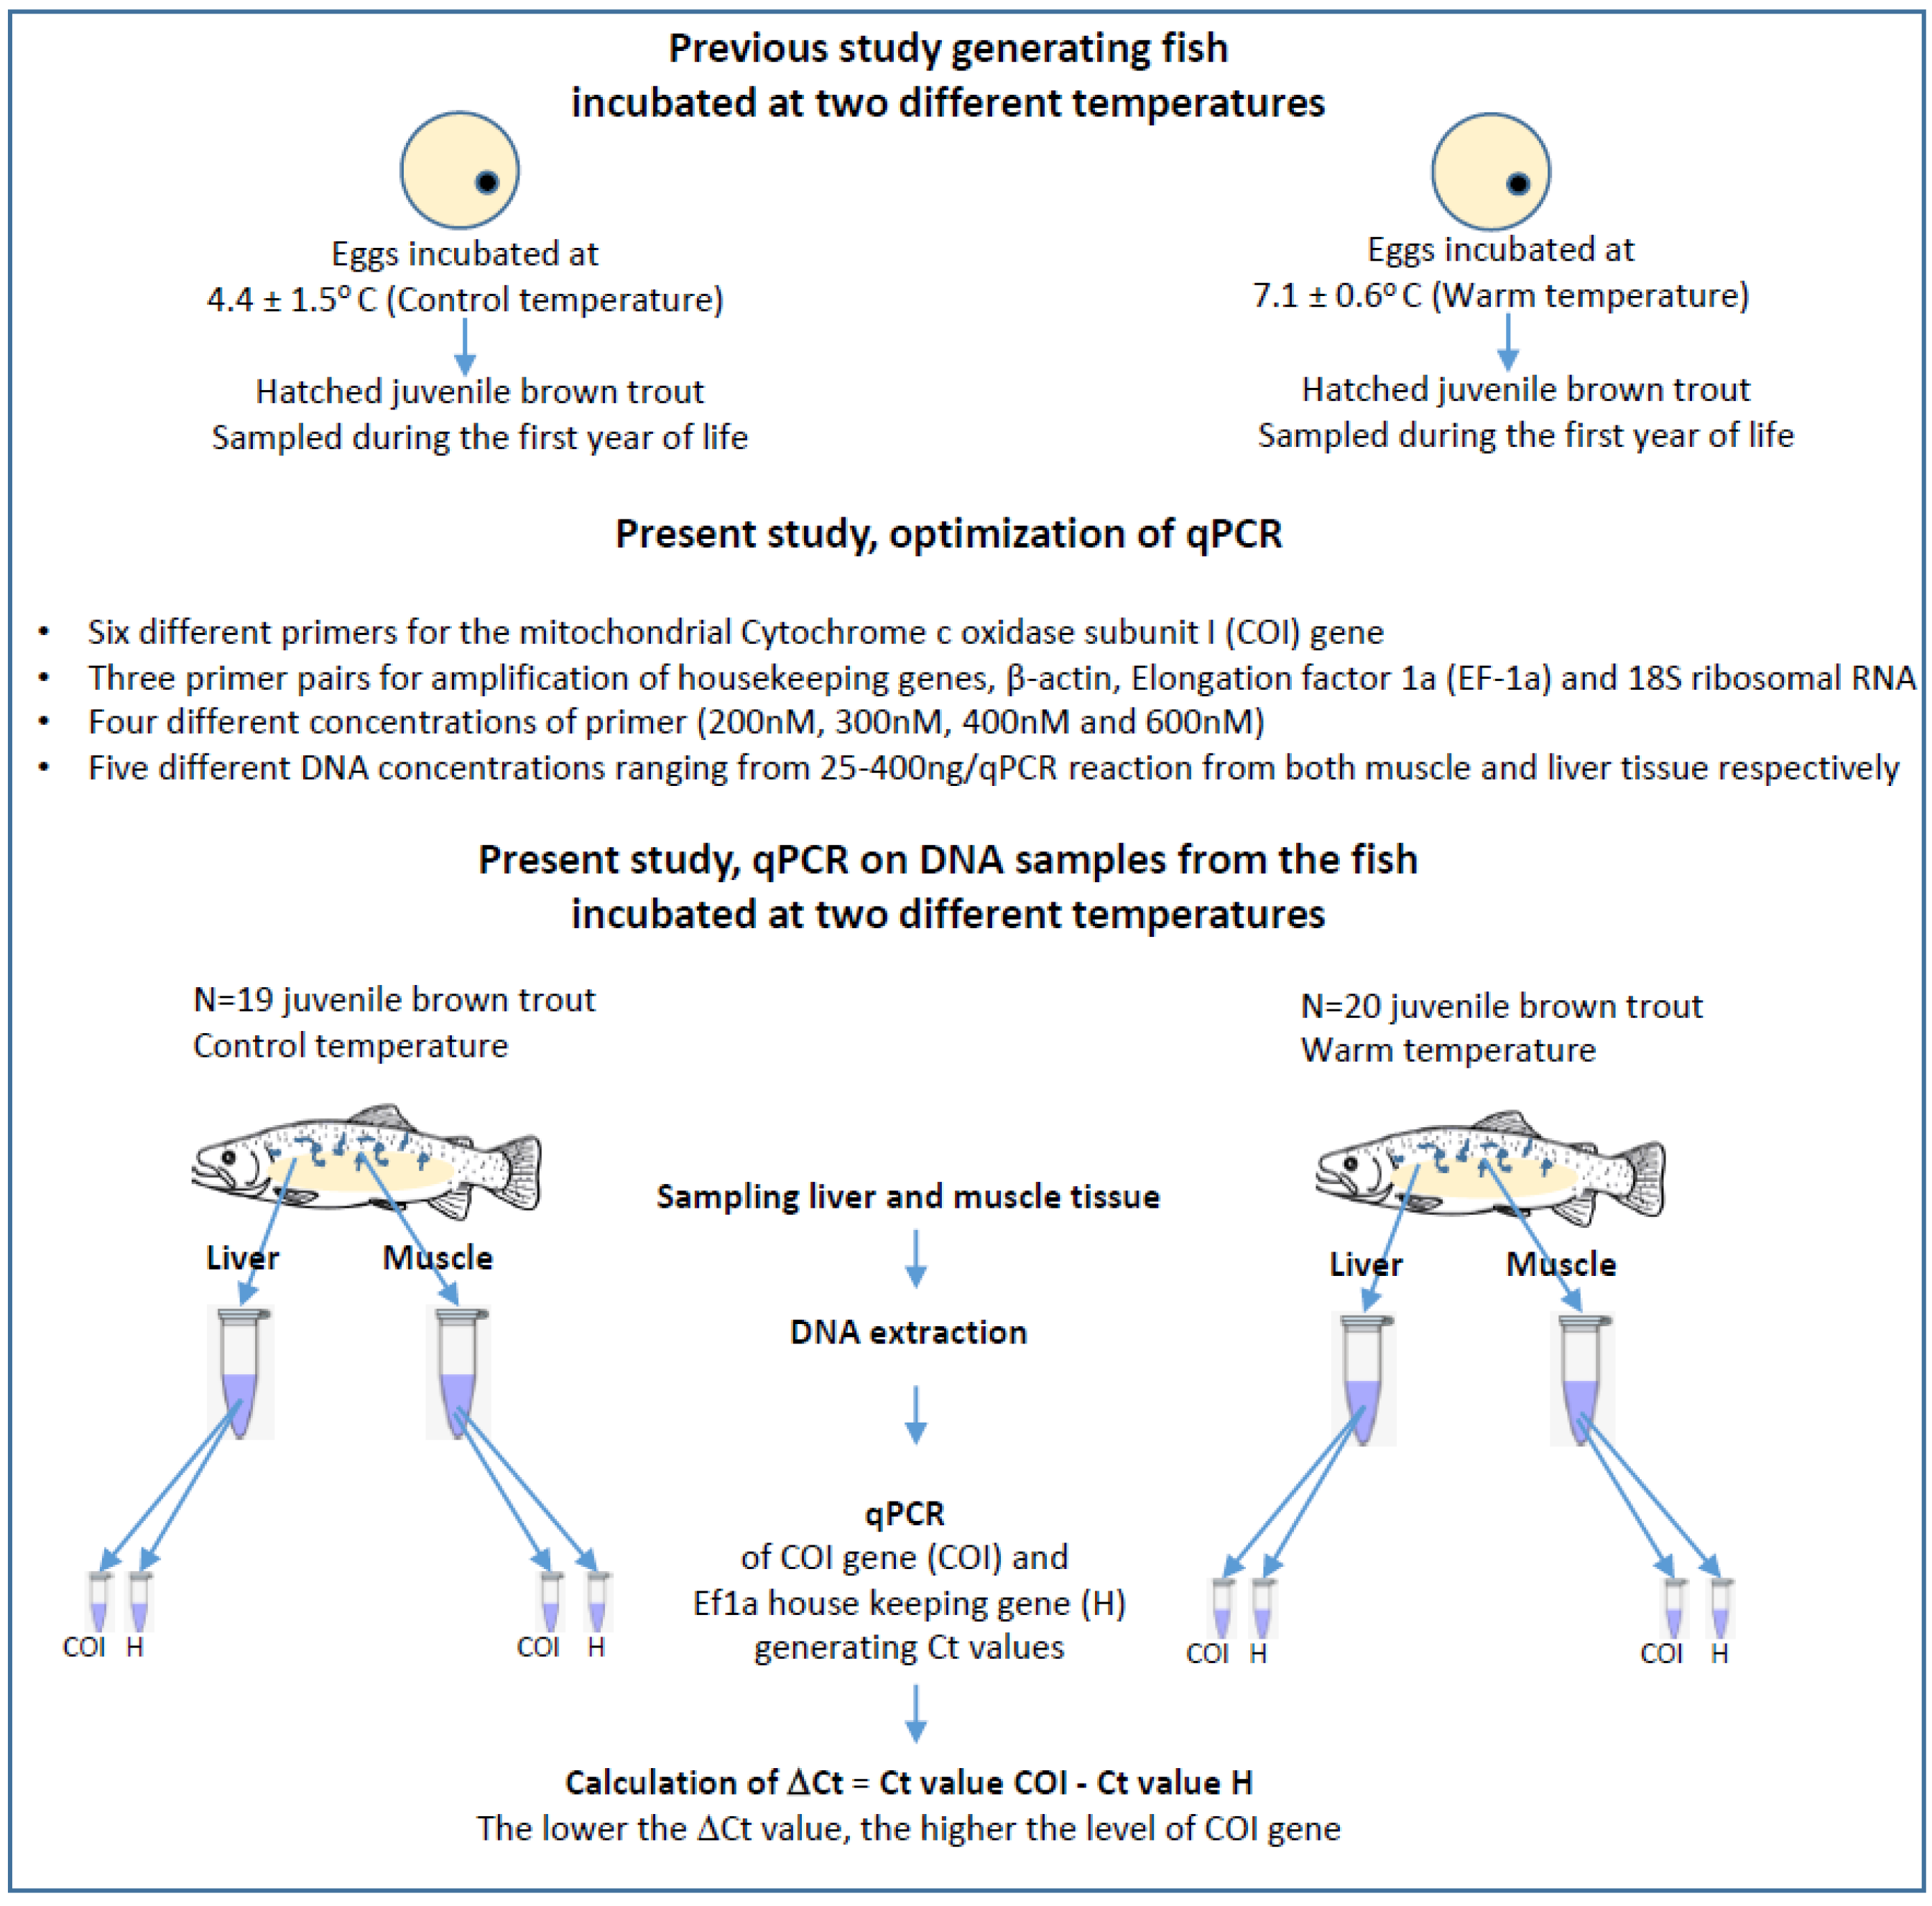
2.1. Rearing of Fish

As described above, we found that incubation temperature affected metabolic rates of brown trout, based on a study conducted on brown trout at the Norwegian Institute for Nature (NINA) Research Station Ims in southwestern Norway (59° N, 6° E) in 2017–18 [2]. As we no longer had these fish available to further explore the mechanism behind this difference in metabolic rates, we used brown trout from the same population raised at the same hatchery and under similar conditions in 2018–2019. These trout were used in several different studies, all focused on testing the effect of incubation temperature (2 temperatures) and parental cross (4 crosses) on the growth and behavior of juvenile fish [19,20,21]. In the study reported here, we limited ourselves to one cross, i.e., anadromous S. trutta, which were either incubated at ambient water (control) temperatures or at elevated temperatures (warm), approximately +2.7 °C above ambient water conditions [19,20,21]. Below we describe the rearing conditions for the anadromous trout. More detail can be found in our previous studies [19,20,21].
The River Imsa has both anadromous and resident brown trout populations, but only offspring from crosses of anadromous brown trout spawning in the River Imsa were used here. The anadromous spawners were collected in a box trap, located about 150 m upstream of the mouth of the River Imsa, when the brown trout returned from the sea to spawn. These brown trout had been previously captured and Carlin-tagged as out-migrating smolts, which allowed us to identify the returning spawners as anadromous brown trout from the River Imsa [1].
In 2018, we collected eggs from 12 anadromous females and crossed them with sperm from 12 anadromous males on 9 November 2018. The males averaged 771 ± 451 g (range 309–1539 g) and the females averaged 577 ± 186 (range 315–993 g). Eggs were incubated using water piped in from the River Imsa to the NINA Research Station. The eggs were maintained at either ambient (cold) temperature conditions or at temperatures elevated approximately +2.7 °C above (warm) ambient conditions. Water was heated using a heat exchanger. There were daily variations in temperature, but heated water was always warmer than ambient cold water. The mean temperature during the incubation regimes was 4.4 ± 1.5 for cold conditions and 7.1 ± 0.6 °C for warm conditions (Figure 1). The rearing tanks had a water flow of 2 L min−1, a water level of 30 cm, and a surface light intensity of approximately 70 lx during daytime (12 h light/12 h dark cycle).
The fish from the two treatments were raised in four incubation trays (2 trays for each incubation temperature) with constant water flow until the start of exogenous feeding. Mortality was negligible. On 22 February 2019 and on 9 April 2019, the warm- and cold-incubated brown trout were moved into four 60 L holding tanks, respectively (2 tanks for each incubation temperature). The following day, exogenous feeding was initiated, using commercial pellets (Ewos Opal food pellets with 29–31.5% lipids, 42–45% proteins and a digestible energy density of 21 kJ g−1, Cargill®, Bergen, Norway). From 10 April 2019 onwards, all brown trout were maintained using unheated water from the River Imsa. In August, the fish were subsequently moved to four 500 L holding tanks due to the large size of the fish.

2.2. Tissue Sampling and DNA Extraction

The brown trout were removed from their holding tanks in August 2019. These fish were then sacrificed by overdosing them with chlorobutanol and immediately placed in a freezer at −20 °C. Intact fish were kept at −20 °C for approximately one year, before analyzing liver and muscle tissues. Upon removing the fish from the freezer, the length of the fish was measured to the nearest mm. As expected, brown trout from cold ambient incubation conditions were smaller than brown trout from elevated temperature incubation conditions (total length of 73 vs. 87 mm, t-test; t37 = 5.5, p < 0.001), which was previously described, based on the same cohort and experimental rearing conditions [21]. The sampling of liver and white muscle tissue from each individual was performed in a consistent way. The white muscle was sampled from the same side and location. Total DNA, containing both nuclear and mitochondrial DNA, was extracted from liver and muscle tissue of control ambient (n = 19) and warm (n = 20) incubated juvenile brown trout using a commercial kit (QIAamp DNA Micro, Qiagen, Stockholm, Sweden), following the manufacturer’s instructions (Figure 1). The concentration and DNA quality were assessed with NanoQuant Plate™ (TECAN, Gröding, Austria). The liver and muscle tissue samples (10 mg each) were lysed overnight at 56 °C at 900 rpm in a thermal shaker. The ratio 260/280, measuring DNA purity, ranged from 2.0 to 2.3.

2.3. Optimization of the qPCR for Mitochondrial DNA Quantification

The optimization of the qPCR was performed by selecting six different primer pairs previously published for the mitochondrial cytochrome c oxidase subunit I (COI) gene as well as a set of three primer pairs for amplification of housekeeping genes, β-actin, Elongation factor 1a (EF-1a), and 18S ribosomal RNA (Table 1).
Four different concentrations of each primer (200 nM, 300 nM, 400 nM, and 600 nM) and five different DNA concentrations ranging from 25 to 400 ng/qPCR reaction from both muscle and liver tissue, respectively, were tested (Table 2). The qPCR amplifications were performed with StepOnePlus™ Real-Time PCR System (Thermofisher Scientific Inc., Waltham, MA, USA) using PowerUp™ SYBR™ Green Master Mix (Thermofisher Scientific Inc., Waltham, MA, USA) in a total volume of 20 μL. The thermal protocols used had an initial step of 95 °C for 10 min, followed by a two-step cycling protocol (95 °C for 15 s and 60 °C or 61 °C for 60 s) for 40 cycles. Melt curves were included in the thermal protocol to confirm one single peak for primer specificity. The optimal conditions chosen had a primer pair/qPCR efficiency close to 100% (Figure 2).
Among the different primer pair combinations and concentrations tested, the primer pairs Dalvin_COI334 forward (300 nM) and reverse (300 nM) [14] performed the best for amplification of the COI gene. For amplification of the housekeeping gene, the primer pair targeting the Elongation factor 1a gene forward (300 nM) and reverse (600 nM) [26] performed the best. Each sample was thereafter analyzed in the qPCR assay performed with these selected primer pairs together with the reagents and temperature cycles described above, including a melting curve analysis to confirm specific amplification.
Each sample (100 ng DNA/reaction) was analyzed in duplicate, and in each run, negative controls were included (without template). A melting curve analysis was included in the thermal protocol to confirm specific amplification (Figure 1).

2.4. Statistical Analysis
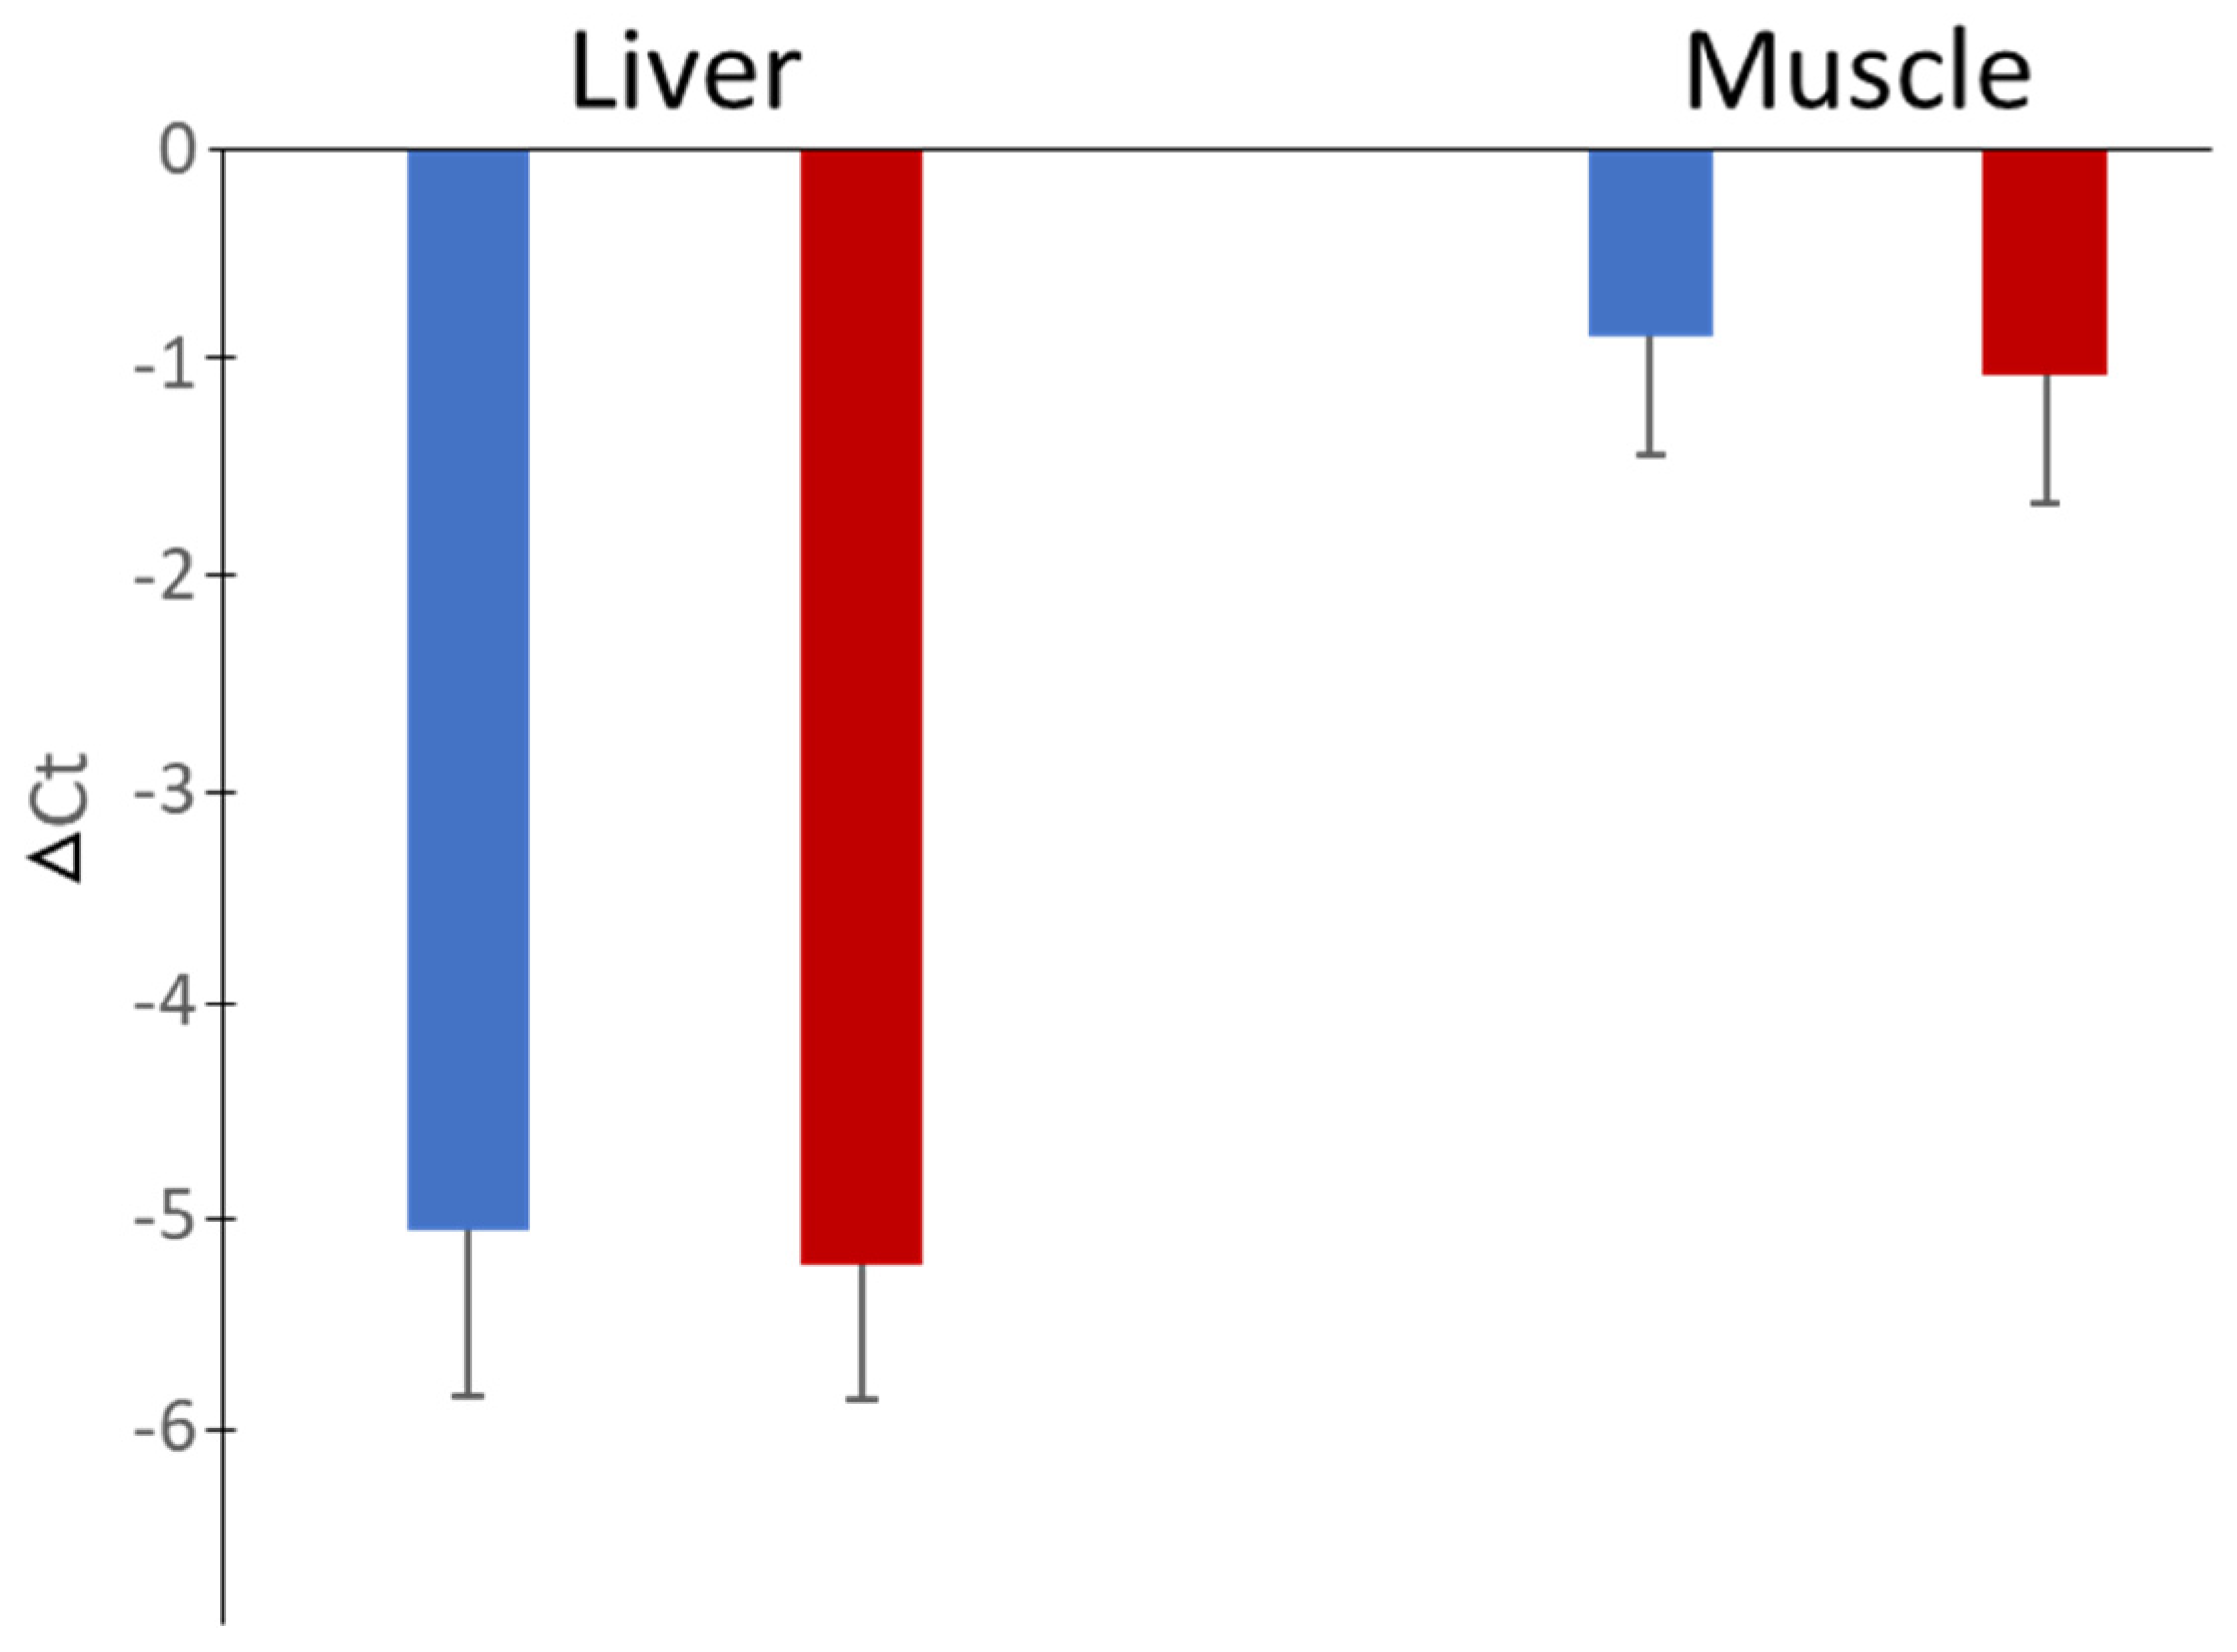
The ΔCt value is the difference between the Ct value of the COI gene minus the Ct value for the housekeeping gene, which is performed to adjust for differences in the DNA extraction and qPCR efficiency. The lower the ΔCt value, the higher the level of the COI gene. ΔCt values were computed from the qPCR analysis of DNA from the liver and muscle tissue of juvenile fish raised at ambient (control) (n = 19) and elevated (n = 20) incubation temperatures. Prior to analysis, all data were inspected for normality and for homogeneity of variances, and no transformations were needed. Data were analyzed using t-tests, testing for differences between the control and warm incubation temperature treatments. Statistical analyses were performed in the SPSS software package (IBM SPSS Statistics, v.25). To compare the level of mtDNA in the liver versus muscle tissue, the formula 2−(mean ΔCt Liver − mean ΔCt Muscle) was used.

3. Results

The optimization of the qPCR for the COI gene and housekeeping gene demonstrated that Dalvin_COI334 [14] and the housekeeping gene Elongation factor 1a [26] in combination performed the best, with a PCR efficiency close to 100% and with one single peak in the melting curve for both primers (Table 2). There was less than a 1% difference in PCR efficiency using extracted DNA from either muscle or liver tissue.
The results show that the mean qPCR cycle threshold (Ct) value for the brown trout averaged −5.16 ΔCt for muscle tissue and −0.97 ΔCt for liver tissue, and thus, the amount of mtDNA in the liver was more than 18 times higher than in the muscle tissue (Figure 3). The ΔCt values for the control ambient incubation temperature and the elevated incubation temperature were −5.08 and −5.24, respectively, for liver tissue and 0.87 and 1.06, respectively, for muscle tissue (Figure 2). Separate t-tests for the liver and muscle tissue showed that these differences between the control ambient incubation temperature and the elevated incubation temperature were not significant (liver: t37 = 0.70, p = 0.49; muscle t37 = 0.97, p = 0.34).

4. Discussion

Temperature during the embryonic stage has been shown to affect metabolic rate [2,12]. Our aim was to investigate if this metabolic adaptation could be a result of a change in the mtDNA copy number as a proxy for the number of mitochondria. While we did not measure the metabolic rates of brown trout in this study, two other studies have reported effects of incubation temperature on metabolic rates of brown trout, with one of the studies being performed on the same population used in this study [2,12]. Thus, it seems likely that there were differences in metabolic rates of the juvenile brown trout raised at the two incubation temperatures used in this study.
We performed a relative quantification of the mtDNA content in high-energy-demanding tissues, liver and white muscle, from juvenile brown trout incubated at either ambient water (control) temperature or at elevated temperatures (warm), but detected no significant differences between treatments. This indicates that the lower metabolic rate seen in juvenile brown trout exposed to increased temperature during embryogenesis is likely not an effect of a reduced mtDNA copy number.
Changes in mitochondria number, structure, and function represent an important part of animal development, and it has been demonstrated that adaption occurs as a result of aging [7], increased exercise [4], change in dietary composition [9], exposure to environmental stressors and temperature changes [6]. Thermal changes in the ambient environment can induce mitochondrial metabolic adaptation, and it can occur via different mechanisms that could include the adaption of mitochondrial phosphorylation respiration rate, mitochondrial complex II/I activity, or cytochrome c oxidase activity [28]. For this study we only measured mitochondrial DNA quantity and used this as a proxy for mitochondria number. It may well be that the difference in metabolic rates that was previously reported [2] is related to the functionality of individual mitochondria instead. In other words, mitochondria have the ability to respond both morphologically and functionally to external stimuli, and thus, it is important to investigate the functional response as well, for example, by studying membrane potential changes via changes in fusion and fission processes. Hence, possible avenues for future research could include looking at how mitochondrial dynamics are regulated by the gene expression of FIS1 and DRP1, which are involved in mitochondrial fission, as well as looking at MFN1, MFN2, and OPA1, which are involved in mitochondrial fusion. Investigating oxygen consumption rate, the mitochondrial membrane potential and mitochondrial NAD(P)H would also be of high value. While examination of different aspects of mitochondrial functionality are potentially interesting avenues to pursue in future studies, it was not possible to examine them in this study as we worked with frozen tissues. The use of frozen tissues is not compatible with studies of changes in membrane potential or gene expression due to the degradation of membranes, mRNA, and proteins.
We studied two different tissue types, liver and muscle, with liver tissue having more than 18 times higher levels of mtDNA than muscle tissue. The liver is composed of several types of cells, and a majority of these cells are rich in mitochondria, which are used to support various energy-demanding functions such as detoxification, energy storage, glucose regulation, protein, and lipid metabolism. The liver is therefore expected to have a higher number of mitochondria compared to the white muscle cells that generate much of the energy through anaerobic metabolism. The lack of an effect of incubation temperature effect for two different tissues strengthens our conclusion that the difference in metabolic rates is not related to differences in mtDNA content. This indicates that other regulatory mechanisms must be involved in explaining the previously observed difference in metabolic rates [2,12]. Potential mechanisms could involve changes in mitochondrial volume density, membrane phospholipid fatty acid composition, mitochondrial enzyme activities, changes in oxidative capacity of mitochondria, or gene regulation [9].
qPCR for quantification of mitochondrial counts has shortcomings due to the fact that the mtDNA copy number per mitochondria can vary depending on tissue type and other factors such as age, diet, and exposure to environmental contaminants [7,8,9,10]. It is also possible that the mitochondrial genome can be duplicated as pseudogenes in the nuclear genome, which can be a problem if the level of pseudogenes is unequal in the different groups analyzed [29]. Therefore, when investigating mtDNA copy number, one must use the same tissue and only manipulate one variable, such as temperature, to be able to make fair comparisons. Despite this limitation, qPCR is a simple and cost-effective method to quantify mtDNA in frozen and partly degraded tissue from different treatment groups, and we use the qPCR results as a way of exploring if there were differences in mitochondria number. Nevertheless, all primers may not perform well. In our study, five of the nine selected primer pairs performed poorly, and thus, we recommend that one initially performs some form of qPCR method optimization with selected primers and DNA templates from samples of the study. This is to check that the qPCR efficiency and specificity are at a level that ensures that the results are reliable and reproducible. The advantage of using the COI gene for relative quantification of mitochondria number is the stability of DNA, which facilitates good recoveries, even from trace samples and frozen samples with poor quality [30].
Previous studies have shown that incubation temperature affects both the physiology and behavior of juvenile brown trout [2,20,21,31]. This suggests that the consequences of global warming will likely have an impact on the ecology of brown trout in the near future. It is difficult to predict the overall consequences of global warming as the resources for brown trout and that of their prey will likely be affected [32]. Nevertheless, the results from this study indicate that changes in the mtDNA copy number cannot explain the previously reported decrease in metabolic rate and aerobic scope in response to elevated incubation temperatures [2] and also highlight the need for additional studies to determine what causes reduced metabolic rates in brown trout exposed to elevated temperatures during embryogenesis.

5. Conclusions

We optimized a qPCR to quantify the amount of mitochondrial DNA in liver and muscle tissue from juvenile brown trout incubated as eggs at either ambient water or elevated water temperatures, but we detected no significant differences between incubation temperatures. This indicates that the lower metabolic rate seen in juvenile brown trout exposed to increased temperature during the embryo stage is likely not an effect of a change in the mtDNA copy number and number of mitochondria in liver or white muscle tissue. It is, however, possible that a change in mitochondrial content may be present in other types of tissues such as the heart, or that there is a mitochondrial response, but it is on a functional level.

Author Contributions

Conceptualization, L.G.; methodology, A.E.; formal analysis, G.A. and A.E.; investigation, L.G., B.J., G.A. and A.E.; resources, B.J. and L.G.; data curation, A.E., G.A. and L.G.; writing—original draft preparation, G.A. and A.E.; writing—review and editing, L.G., B.J., G.A. and A.E.; visualization, G.A. and A.E.; project administration, L.G. and B.J.; funding acquisition, B.J. and L.G. All authors have read and agreed to the published version of the manuscript.

Funding

The authors received financial support from the River Ecology and Management Research Group at Karlstad University and the Norwegian Research Council, Klimaforsk, project no. 268005.

Institutional Review Board Statement

The care and use of the experimental fish complied with the Norwegian animal welfare laws and policies as approved by the Norwegian Animal Research Experimentation Agency (NARA) with the Animal Care and Use ID: 15450.

Informed Consent Statement

Not applicable.

Data Availability Statement

Raw data were generated at The Department of Environmental and Life Sciences/Biology Karlstad University and are available from the author Ann Erlandsson on request.

Acknowledgments

We thank Dick Durtsche, Northern Kentucky University, for his suggestion to look at mitochondria as a potential explanation for the differences we observed in our earlier study of metabolic rates in brown trout. We thank the staff of the NINA Research Station Ims for rearing the fish and for checking the fish trap in the River Ims. We thank Geni Zanol for help with work done in the laboratory.

Conflicts of Interest

The authors declare no conflicts of interest.

References

  1. Jonsson, B.; Jonsson, N. A review of the likely effects of climate change on anadromous Atlantic salmon Salmo salar and brown trout Salmo trutta, with particular reference to water temperature and flow. J. Fish Biol. 2009, 75, 2381–2447. [Google Scholar] [CrossRef]
  2. Durtsche, R.D.; Jonsson, B.; Greenberg, L.A. Thermal conditions during embryogenesis influence metabolic rates of juvenile brown trout Salmo trutta. Ecosphere 2021, 12, e0337. [Google Scholar] [CrossRef]
  3. Blier, P.U.; Lemieux, H.; Pichaud, N. Holding our breath in our modern world: Will mitochondria keep the pace with climate changes? Can. J. Zool. 2014, 92, 591–601. [Google Scholar] [CrossRef]
  4. Ørtenblad, N. Mitochondrial increase in volume density with exercise training: More, larger or better? Acta Physiol. 2018, 222, e12976. [Google Scholar] [CrossRef]
  5. Lee, H.C.; Wei, Y.H. Mitochondrial role in life and death of the cell. J. Biomed. Sci. 2000, 7, 2–15. [Google Scholar] [CrossRef]
  6. Li, Z.H.; Zhang, P.; Ma, H.K.; Xu, W.Y.; Sun, J.Q.; Yan, B.L.; Zhang, Q.Q.; Gao, H. Effect of temperature and salinity on mtDNA copy number of the ridgetail white prawn, Palaemon carinicauda Holthuis, 1950 (Decapoda, Palaemonidae). Crustaceana 2018, 91, 1061–1072. [Google Scholar] [CrossRef]
  7. Hartmann, N.; Reichwald, K.; Wittig, I.; Dröse, S.; Schmeisser, S.; Lück, C.; Hahn, C.; Graf, M.; Gausmann, U.; Terzibasi, E.; et al. Mitochondrial DNA copy number and function decrease with age in the short-lived fish Nothobranchius furzeri. Aging Cell 2011, 10, 824–831. [Google Scholar] [CrossRef]
  8. Pieters, N.; Koppen, G.; Smeets, K.; Napierska, D.; Plusquin, M.; De Prins, S.; Van De Weghe, H.; Nelen, V.; Cox, B.; Cuypers, A.; et al. Decreased mitochondrial DNA content in association with exposure to polycyclic aromatic hydrocarbons in house dust during wintertime: From a population enquiry to cell culture. PLoS ONE 2013, 8, e63208. [Google Scholar] [CrossRef]
  9. Liao, K.; Yan, J.; Mai, K.; Ai, Q. Dietary lipid concentration affects liver mitochondrial DNA copy number, gene expression and DNA methylation in large yellow croaker (Larimichthys crocea). Comp. Biochem. Physiol. Part B Biochem. Mol. Biol. 2016, 193, 25–32. [Google Scholar] [CrossRef]
  10. Picca, A.; Guerra, F.; Calvani, R.; Coelho-Júnior, H.J.; Leeuwenburgh, C.; Bucci, C.; Marzetti, E. The contribution of mitochondrial DNA alterations to aging, cancer, and neurodegeneration. Exp. Gerontol. 2023, 178, 112203. [Google Scholar] [CrossRef]
  11. Consuegra, S.; John, E.; Verspoor, E.; De Leaniz, C.G. Patterns of natural selection acting on the mitochondrial genome of a locally adapted fish species. Genet. Sel. Evol. 2015, 47, 58. [Google Scholar] [CrossRef]
  12. Álvarez, D.; Cano, J.M.; Nicieza, A.G. Microgeographical variation in metabolic rate and energy storage of brown trout: Countergradient selection or thermal sensitivity. Evol. Ecol. 2006, 20, 345–363. [Google Scholar] [CrossRef]
  13. Wright, T.G.; Dawson, B.; Jalleh, G.; Guelfi, K.J. Influence of hormonal profile on resting metabolic rate in normal, overweight and obese individuals. Ann. Nutr. Metab. 2015, 66, 162–167. [Google Scholar] [CrossRef]
  14. Dalvin, S.; Glover, K.A.; Sørvik, A.G.; Seliussen, B.B.; Taggart, J.B. Forensic identification of severely degraded Atlantic salmon (Salmo salar) and rainbow trout (Oncorhynchus mykiss) tissues. Investig. Genet. 2010, 1, 12. [Google Scholar] [CrossRef]
  15. Hsieh, A.Y.Y.; Budd, M.; Deng, D.; Gadawska, I.; Côté, H.C.F. A monochrome multiplex real-time quantitative PCR assay for the measurement of mitochondrial DNA content. J. Mol. Diagn. 2018, 20, 612–620. [Google Scholar] [CrossRef]
  16. Yin, Y.; Shen, H. Common methods in mitochondrial research (Review). Int. J. Mol. Med. 2022, 50, 126. [Google Scholar] [CrossRef]
  17. Refinetti, P.; Warren, D.; Morgenthaler, S.; Ekstrøm, P.O. Quantifying mitochondrial DNA copy number using robust regression to interpret real time PCR results. BMC Res. Notes 2017, 10, 593. [Google Scholar] [CrossRef]
  18. Atkinson, S.; Carlsson, J.E.L.; Ball, B.; Egan, D.; Kelly-Quinn, M.; Whelan, K.; Carlsson, J. A quantitative PCR-based environmental DNA assay for detecting Atlantic salmon (Salmo salar L.). Aquat. Conserv. Mar. Freshw. Ecosyst. 2018, 28, 1238–1243. [Google Scholar] [CrossRef]
  19. Jonsson, B.; Jonsson, N. Differences in growth between offspring of anadromous and freshwater brown trout Salmo trutta. J. Fish Biol. 2021, 99, 18–24. [Google Scholar] [CrossRef]
  20. Jonsson, B.; Greenberg, L. Egg incubation temperature influences the population-specific outmigration rate of juvenile brown trout Salmo trutta. Fish Biol. 2022, 100, 909–917. [Google Scholar] [CrossRef]
  21. Greenberg, L.; Filipsson, K.; Bergman, E.; Jonsson, B. The effects of egg incubation temperature and parental cross on the swimming activity of juvenile brown trout Salmo trutta. Behav. Ecol. Sociobiol. 2023, 77, 114. [Google Scholar] [CrossRef]
  22. Kalayci, G.; Ozturk, R.C.; Capkin, E.; Altinok, I. Genetic and molecular evidence that brown trout Salmo Trutta belonging to the Danubian lineage are a single biological species. J. Fish Biol. 2018, 93, 792–804. [Google Scholar] [CrossRef]
  23. Rezaei, A. Studies on protein structure of cytochrome C oxidase subunit II gene in Salmo trutta caspius. J. Adv. Zool. 2015, 36, 1–10. [Google Scholar] [CrossRef]
  24. Capo, E.; Spong, G.; Königsson, H.; Byström, P. Effects of filtration methods and water volume on the quantification of brown trout (Salmo trutta) and Arctic char (Salvelinus alpinus) EDNA Concentrations via Droplet Digital PCR. Environ. DNA 2020, 2, 152–160. [Google Scholar] [CrossRef]
  25. Hansen, B.H.; Rømma, S.; Garmo, Ø.A.; Pedersen, S.A.; Olsvik, P.A.; Andersen, R.A. Induction and activity of oxidative stress-related proteins during waterborne Cd/Zn-exposure in brown trout (Salmo trutta). Chemosphere 2007, 67, 2241–2249. [Google Scholar] [CrossRef]
  26. Churova, M.V.; Meshcheryakova, O.V.; Ruchev, M.; Nemova, N.N. Age- and stage-dependent variations of muscle-specific gene expression in brown trout Salmo trutta L. Comp. Biochem. Physiol. B Biochem. Mol. Biol. 2017, 211, 16–21. [Google Scholar] [CrossRef] [PubMed]
  27. Tinoco, A.B.; Näslund, J.; Delgado, M.J.; de Pedro, N.; Johnsson, J.I.; Jönsson, E. Ghrelin increases food intake, swimming activity and growth in juvenile brown trout (Salmo trutta). Physiol. Behav. 2014, 124, 15–22. [Google Scholar] [CrossRef] [PubMed]
  28. Cominassi, L.; Ressel, K.N.; Brooking, A.A.; Marbacher, P.; Ransdell-Green, E.C.; O’Brien, K.M. Metabolic rate increases with acclimation temperature and is associated with mitochondrial function in some tissues of threespine stickleback. J. Exp. Biol. 2022, 225, jeb244659. [Google Scholar] [CrossRef]
  29. Parr, R.L.; Maki, J.; Reguly, B.; Dakubo, G.D.; Aguirre, A.; Wittock, R.; Robinson, K.; Jakupciak, J.P.; Thayer, R.E. The pseudo-mitochondrial genome influences mistakes in heteroplasmy interpretation. BMC Genom. 2006, 7, 185. [Google Scholar] [CrossRef]
  30. Dawnay, N.; Ogden, R.; McEwing, R.; Carvalho, G.R.; Thorpe, R.S. Validation of the barcoding gene COI for use in forensic genetic species identification. Forensic Sci. Int. 2007, 173, 1–6. [Google Scholar] [CrossRef]
  31. Takatsu, K.; Selz, O.M.; Brodersen, J. Temperature regime during embryogenesis alters subsequent behavioural phenotypes of juvenile brown trout. Biol. Lett. 2022, 18, 20220369. [Google Scholar] [CrossRef] [PubMed]
  32. Bærum, K.M.; Finstad, A.G.; Ulvan, E.M.; Haugen, T.O. Population consequences of climate change through effects on functional traits of lentic brown trout in the sub-Arctic. Sci. Rep. 2021, 11, 15246. [Google Scholar] [CrossRef] [PubMed]
Figure 1. Temperature (°C) during incubation and post-hatching of brown trout at the Norwegian Institute for Nature Research Station Ims in southwestern Norway in 2018–2019. The blue line shows ambient cold conditions and the orange line shows elevated conditions. The point in time when exogenous feeding was initiated is indicated by the blue and orange arrows.
Fishes 09 00142 g001
Figure 2. Overview of the experimental design. A qPCR method optimization was performed followed by analysis of the amount of mitochondrial DNA in muscle and liver tissue from S. trutta, originating from fertilized eggs incubated at control ambient or elevated (warm) temperatures.
Fishes 09 00142 g002
Figure 3. Mean ± 1 SD for ΔCt in liver and muscle tissue from fish incubated in the control ambient (blue histobars) and warm temperature (red histobars) conditions. Differences are Ct COI gene value minus the Ct housekeeping gene value.
Fishes 09 00142 g003
Table 1. Primers tested in the method optimization.
Primer (Target)Forward Sequence 5′-3′Reverse Sequence 5′-3′Reference
Dalvin_COI030GAATAGTCGGCACCGCCCTAAGTCTCTCGCCAGGCTGGCTGAGTTCTGCT[14]
Ward_COITCAACCAACCACAAAGACATTGGCACTAGACTTCTGGGTGGCCAAAGAATCA[22]
Rezaei_COIGGCAATCACACGATGATTTTTTCGTTAACTTGCTTGTACTTGGA[23]
Atkinson_COICGCCCTAAGTCTCTTGATTCGACGTTATAAATTTGGTCATCTCCCAGA[18]
Dalvin_COI334CTACCCCCCTCTAGCAGGTAATCTTGGGAAAAAATAGTTAAGTCAACGGAA[14]
Capo_COITCAACCAACCACAAAGACATTGGCACAGTGTTTCACAGTGTGTAGGC[24]
Primer (housekeeping)Forward Sequence 5′-3′Reverse Sequence 5′-3′Reference
β-actinCCAAAGCCAACAGGGAGAAGAGGGACAACACTGCCTGGAT[25]
Elongation factor 1aGCAAGAACGACCCTCCAATGCAGGCGATGTGAGCAGTATG[26]
18S ribosomal RNATGGCCGTTCTTAGTTGGTCTCTAAGAAGTTGGACGCCG[27]
Table 2. Summary of PCR efficiency and specificity of tested primers.
Primer (Target)Range PCR Efficiency (%)Specificity of Primer
(Melting Curve)
Reference
Dalvin_COI030Poor efficiency-[14]
Ward_COIPoor efficiency-[22]
Rezaei_COIPoor efficiency-[23]
Atkinson_COIPoor efficiency-[18]
Dalvin_COI334103–114%One peak[14]
Cap_COIPoor efficiency-[24]
Primer (housekeeping)Range PCR efficiency (%)Specificity of primer
(melting curve)
Reference
β-actin96–314%One peak[25]
Elongation factor 1a100–111%One peak[26]
18S ribosomal RNA93–104%One peak[27]
Disclaimer/Publisher’s Note: The statements, opinions and data contained in all publications are solely those of the individual author(s) and contributor(s) and not of MDPI and/or the editor(s). MDPI and/or the editor(s) disclaim responsibility for any injury to people or property resulting from any ideas, methods, instructions or products referred to in the content.

