
Hauling Snow Crab Traps in Eastern Canada: A Study Documenting Tension in Ropes

Fisheries and Marine Institute, Memorial University of Newfoundland, P.O. Box 4920, St. John’s, NL A1C 5R3, Canada
*
Author to whom correspondence should be addressed.
Fishes 2024, 9(5), 154; https://doi.org/10.3390/fishes9050154
Submission received: 5 April 2024
/
Revised: 24 April 2024
/
Accepted: 25 April 2024
/
Published: 26 April 2024
(This article belongs to the Special Issue Advances in Crab Fisheries)
Abstract
:Entanglement in commercial fishing gear is one of the main factors inhibiting the recovery of critically endangered North Atlantic right whales. Installing low-breaking-strength (LBS) components in the buoy lines and main lines of stationary fishing gear may be a viable solution for some fisheries. But is it an effective solution for deep-water trap fisheries? This study quantified in-line rope tensions observed during fishing operations for snow crab (Chionoecetes opilio) in Newfoundland and Labrador, Canada. We conducted a controlled fishing experiment in which we documented the loads experienced while hauling fleets of traps. The results showed that several factors contributed to the loads observed, including the components of the traps, the presence of crabs, and environmental conditions such as wind direction and wave height. According to the statistical models, the maximum tension from the estimated marginal means was 477.53 kgf in the buoy line and 987.99 kgf in the main line for the baited hauls, which exceeds the safe working load (154 kgf) of the proposed low-breaking-strength components. Our results suggest that LBS components are not a viable solution for this deep-water fishery.
Keywords:
snow crab; low-breaking strength components; whale entanglement mitigation; load-cell; tension; marine mammal protection; whalesafe gear; trapsKey Contribution: This study involved a controlled fishing experiment in which we documented the loads experienced while hauling fleets of snow crab traps in eastern Canada. Significant loads in both buoy lines and main lines were observed, suggesting that low-breaking-strength (LBS) components intended to mitigate whale entanglement are not a viable solution for this fishery.
1. Introduction
North Atlantic right whales (NARWs) are one of the most endangered whale species on Earth, with an estimated population of around 356 (+7/−10) individuals and fewer than 70 calving mothers [1]. Entanglement in commercial fishing gear is one of the main causes of mortality for NARWs and a major factor inhibiting the recovery of this species [2,3]. Evidence indicates that any vertical line rising into the water column poses a significant entanglement risk for large whales [4], with trap/pot gear used in the lobster and crab fisheries posing the greatest risk [2,5]. The rate of entanglement for NARWs increased between 1980 and 2009, in part due to innovation and the adoption of ropes with higher tensile strength in many fisheries [6,7]. Despite years of focused regulation and management efforts in the United States, there has been no decrease in the frequency or severity of entanglements [1,6,8,9].
Alternative equipment (termed “whalesafe” gear) to reduce the amount and strength of vertical ropes in the water column have been developed for the fishing industry [4,10]. Whalesafe fishing gear aims to either prevent entanglement by reducing the amount of rope in the water column or alleviate entanglement by incorporating “weak” components in fishing gear to reduce the severity and duration of these events, improving the odds of survival for entangled whales. These “weak” components, also referred to as low-breaking-strength (LBS) components, are designed to break when they experience a set amount of tension. Examples include plastic links, plastic swivels, weak ropes, weak sleeves, and break-away links [10]. In most cases, these components are designed to fail at 1700 lbf (771 kgf) of tension based on Knowlton et al. [7]. Although not scientifically proven to prevent entanglements, these components should fail when an entangled whale exerts sufficient force to break the LBS component, thereby separating itself from a portion of the fishing gear, reducing the risk of serious injury and mortality due to entanglement [11]. Ideally, these components can be used in fisheries where loads remain within safe working limits, typically one-fifth the breaking strength, according to marine tackle regulations [12].
The Government of Canada recently announced plans to implement whalesafe fishing gear in non-tended, commercial fixed-gear fisheries in Atlantic Canada and Quebec to mitigate entanglements, starting with the voluntary use of such gear in 2024. While shallow inshore fisheries are likely to operate within the preferred 1700 lbf (771 kgf) breaking strength, e.g., [13], additional research is necessary to ensure the suitability of LBS components for offshore fisheries that experience heavy loads and use large-diameter rope. One of Canada’s deepest and heaviest fisheries is the snow crab (Chionoecetes opilio) fishery off the coast of Newfoundland and Labrador (NL), Canada’s easternmost province. With a landed value of nearly CAD 624 million in 2021 [14], snow crab is a significant economic contributor to the province. A barrier to the implementation and adoption of LBS components in this fishery is the unintended breakage and loss of gear during hauling procedures. The fishery is known for its significant depth (>300 m) and high number of traps per haul [15]. Trap limits increase with vessel size [16], with smaller coastal vessels typically setting 25 traps in a fleet, and larger offshore vessels typically setting 100 and up to 200 traps in a fleet. The in-line tension in the buoy lines (rope connecting the surface buoy to the first trap) and main lines (or ground rope; rope in between traps) is expected to be high during hauling procedures owing to the thick ropes (up to 16 mm in diameter) commonly used by harvesters to haul these fishing systems.
This study quantifies the in-line rope tensions observed during fishing operations for snow crab in Newfoundland and Labrador. We conducted a controlled fishing experiment in which we documented, with high precision, the loads experienced while hauling fleets of traps. We investigated several factors that contribute to hauling loads with the aim of determining whether LBS components are suitable for this fishery. This research aims to address significant knowledge gaps regarding LBS technology and the NL snow crab fishery in order to help make evidence-based decisions regarding the best path forward to reduce human-caused mortality of NARWs while ensuring that the fishery remains sustainable. This research gathers crucial data to protect the fishery, the harvesters, and the economy in NL as well as to provide lessons that can be useful in similar fisheries that require solutions for entanglement mitigation.
2. Materials and Methods
2.1. Study Site
A comparative fishing experiment was conducted in Conception Bay, Newfoundland and Labrador (Figure 1), aboard the fishing vessel FV Island Voyager (18 m length) between 26 October and 6 November 2022. The water depth at the study site ranged from 269 to 289 m and the substrate type was mud. Traps were set and hauled on 15 separate days. Environmental conditions during hauling were recorded, with wind speeds varying between 9 and 56 km/h and wave height varying between 1.0 and 4.5 m.
2.2. Fishing Gear
The traps used were the standard conical design with 140 mm stretched mesh, a bottom ring diameter of 133 cm, a volume of 2.1 , and a top plastic entrance cone. The trap frame, which accounts for most of the weight, is ~12.5 kg [18]. Three experimental treatments were evaluated (Figure 2):
- W—frames only (no netting, cone, or bait);
- TU—traditional traps unbaited;
- TB—traditional traps baited with squid.
For each treatment, the traps were arranged in a fleet of fifty traps, 33 m apart and attached to a 1617 m long, 16 mm diameter main line. No anchors were used. Two buoy lines of 16 mm diameter and 402 m long each were attached to buoys and high flyers on either side (Figure 3). All ropes were made of polypropylene. Each fleet consisted of a single treatment (trap type). Fleets containing treatments 1 and 2 were deployed and hauled multiple times every day (weather permitting), while treatment 3 (baited traps) was deployed and hauled once per day to allow them to soak for at least 24 h, allowing enough time for crabs to enter the pots. The vessel was placed in neutral while hauling the gear, allowing it to stay over top of the gear during hauling. Catches were released immediately after sampling.
A wireless load cell (Euroload ELT24) was installed above the hauler (Figure 4) to measure the tension while hauling. Data were transmitted to a laptop computer on the bridge of the vessel in real time at a rate of 90 measurements per minute. Two images of the hauler and rope angle were taken per haul before the traps came aboard: one near the beginning of the haul, after the buoy, and another just before the first trap. These images were used to measure the angle of the buoy line in relation to the load cell (Figure 4). The average of all angles was 4.4° (0.08 rad), representing an increase of 0.3%, which was not deemed significant, indicating that the load cell was in-line, requiring no correction of the observed loads.
2.3. Statistical Analysis
All analyses were performed using R statistical software (version 4.2.1) [19]. The response variable was maximum tension (kgf). To estimate the rope breaking strength required in the buoy lines and in the main line, two maximum tension values were extracted for each haul: the maximum tension before the first trap came aboard (buoy line; Phase A), and the maximum tension after the first trap came aboard (main line; Phase B).
The explanatory variables in the data exploration included “Treatment” (i.e., W, TU, or TB), “Depth”, “Wind Speed”, “Wind Direction”, and “Wave Height” and the random variable was “Haul” (i.e., haul 1 to haul 63). However, “Wind Speed” and “Wave Height” were found to be highly correlated; therefore, “Wind Speed” was discarded from the model selection procedure (i.e., “Wave Height” was deemed to have a larger effect on the maximum tension). Two Gaussian generalized linear mixed-effect models (GLMMs) were fitted using the glmmTMB package [20], one for Phase A and one for Phase B. A model selection procedure was followed, where the model with the lowest correction to Akaike’s information criterion (AICc) [21] was identified and selected using the AICctab function in the bbmle package [22]. Model fit was assessed with a residual investigation, quantile–quantile plot, and dispersion test in the DHARMa package (residual diagnostics for hierarchical (multi-level/mixed) regression models) [23]. The model’s estimated marginal means for Phase A and Phase B were calculated with their respective 95% confidence intervals (CI) using the function emmeans from the emmeans package in R [24].
3. Results
A total of 63 hauls were conducted during the experiment: 24 hauls for the fleet containing the frames only (W), 22 hauls for the fleet containing traditional unbaited traps (TU), and 17 hauls for the fleet containing traditional baited traps (TBs). The average weight of catch for the baited traps was 20.48 kg and 1024.00 kg per fleet. The total time to haul the fleets was 43.7 min and 44.4 min, on average, for the W and TU fleets, respectively. By comparison, the treatment with baited traps (TBs) typically took longer (56.4 min on average) to allow time for the crew to empty all 50 traps. In Phase A, the maximum tension observed for the W fleet ranged between 21.04 and 448.2 kgf, between 16.24 and 814.60 kgf for the TU fleet, and between 16.61 and 917.46 kgf for the TB fleet. For Phase B, the observed maximum tension values were higher, ranging between 355.51 and 566.56 kgf for the W fleet, between 546.67 and 773.49 kgf for the TU fleet, and between 837.73 and 1203.72 kgf for the TB fleet.
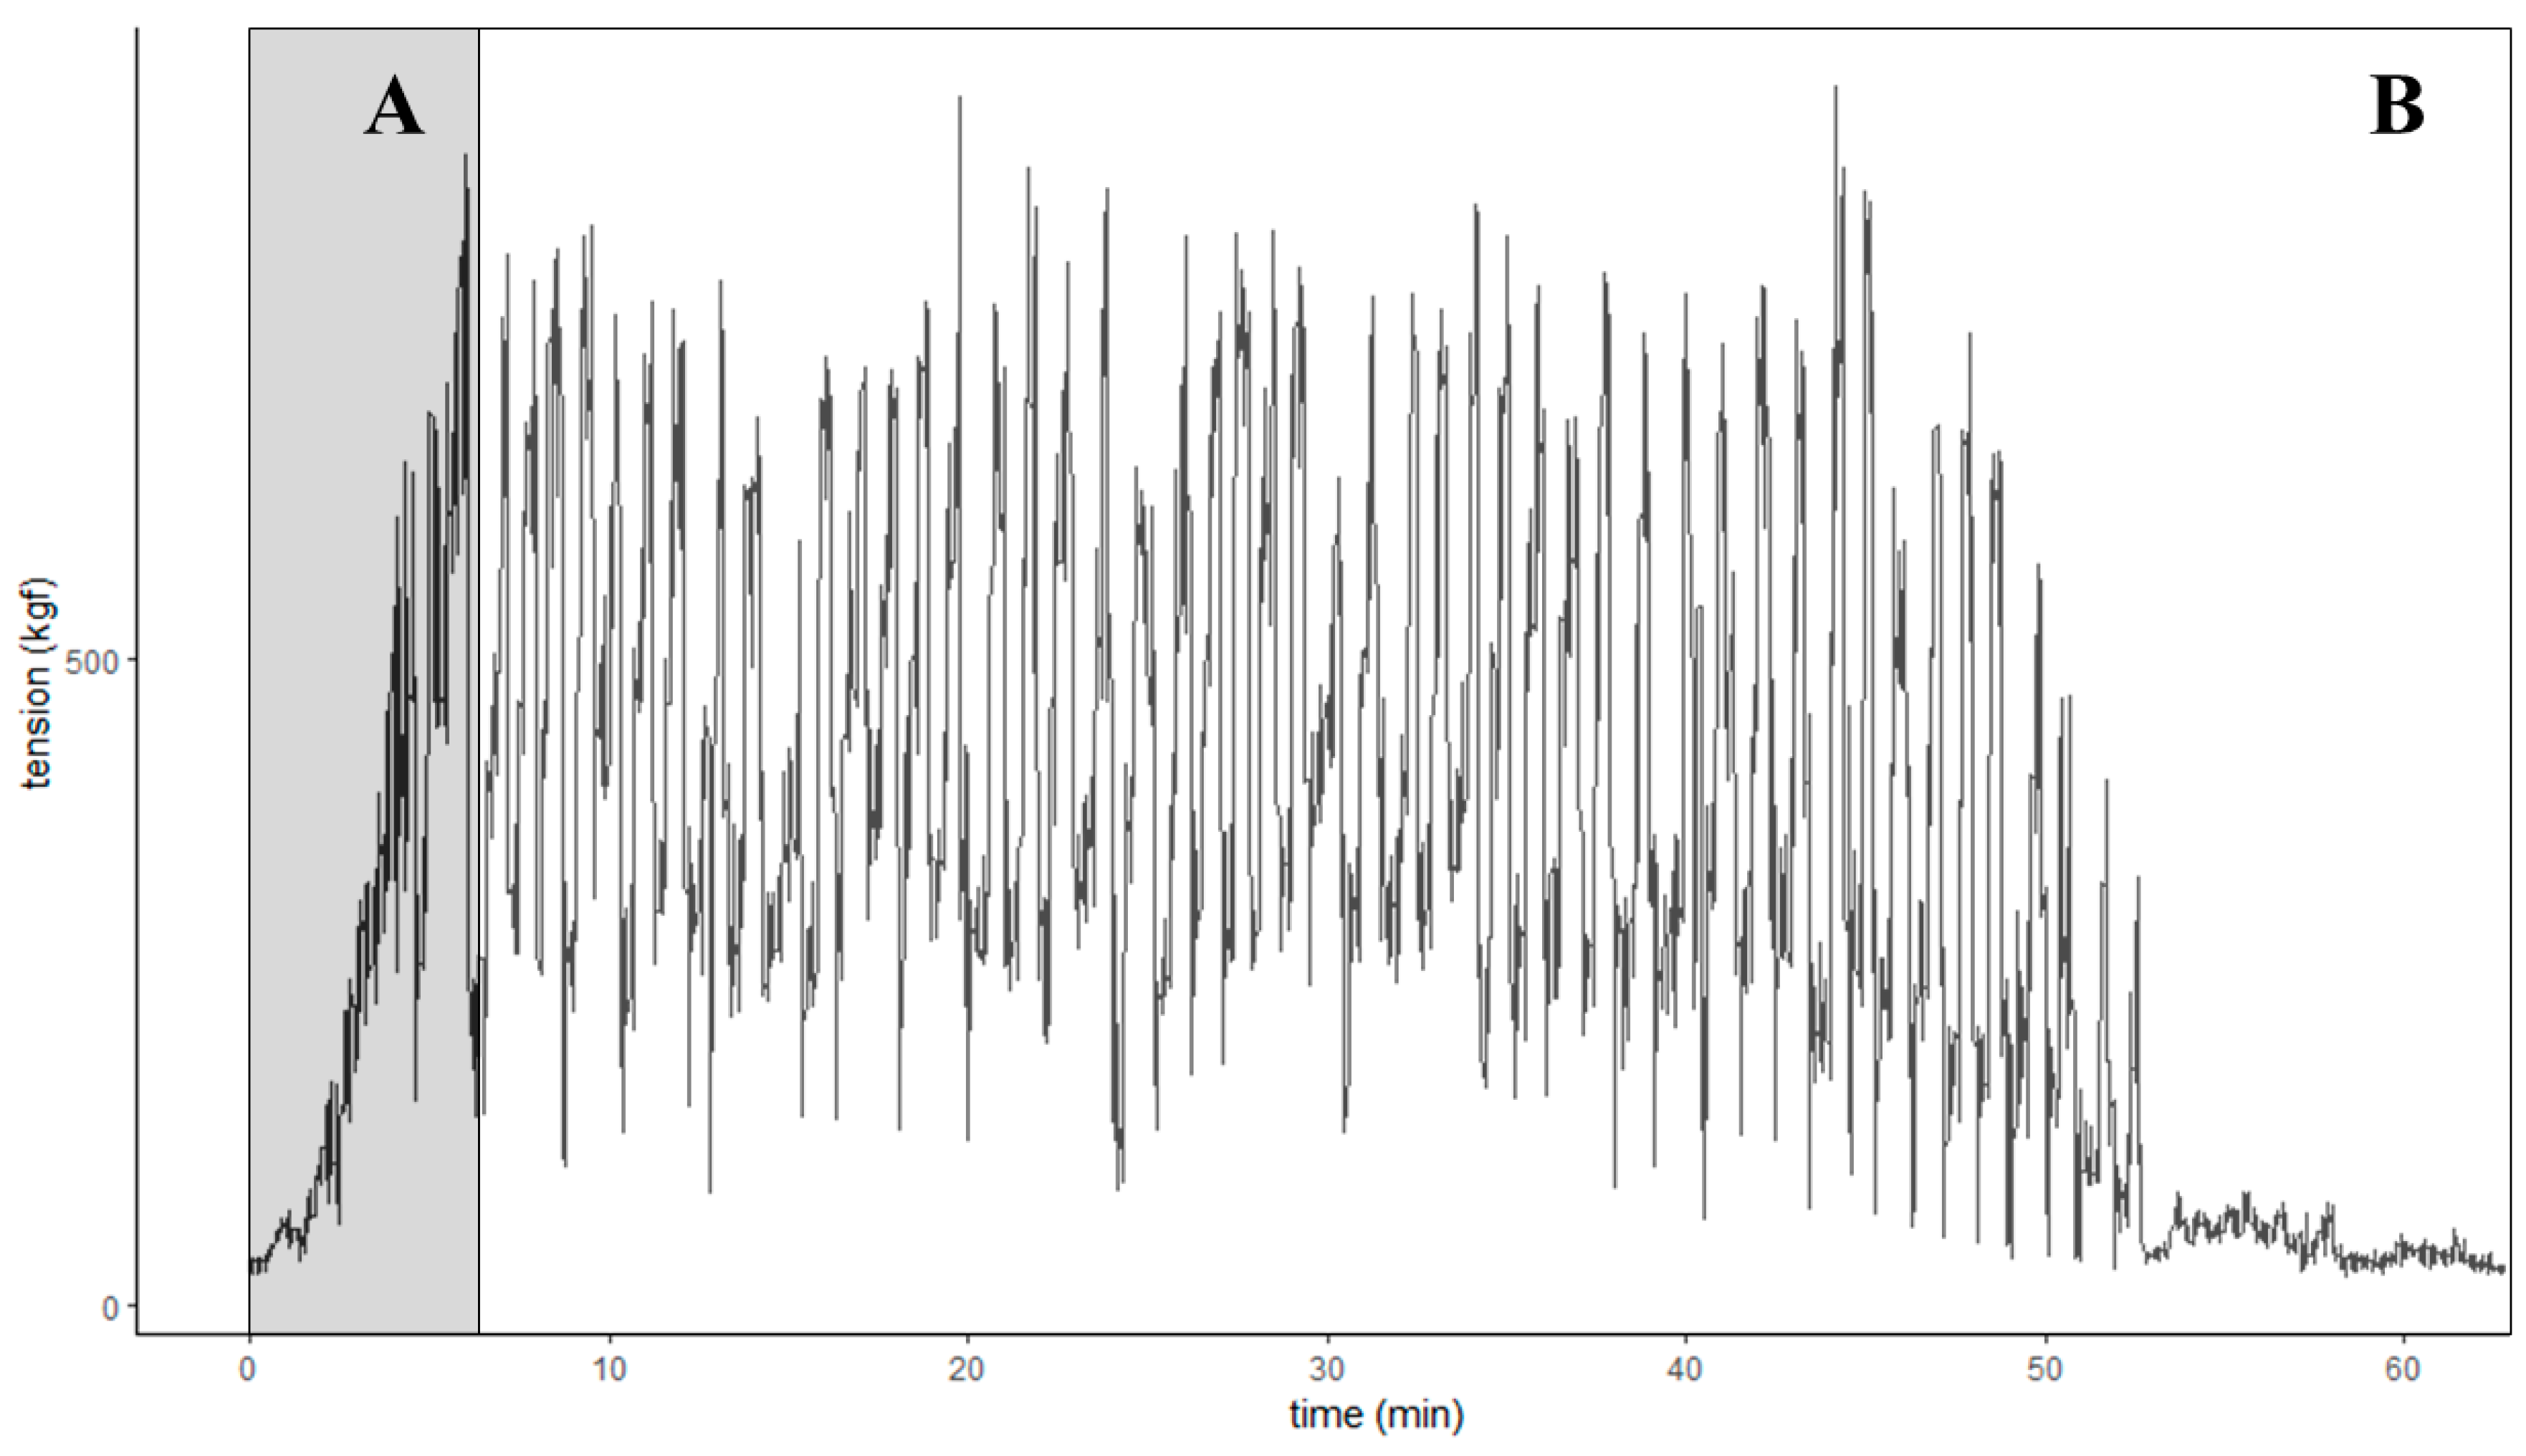
Figure 5 provides an example of the typical loads observed during the hauling of a fleet of baited snow crab traps. Phase A begins when the high flyer is taken aboard and the harvester inserts the rope into the hauler (time = 0). As the buoy line is drawn aboard the vessel, the tension increases, initially slowly as the slack rope is collected, and then more rapidly as traps begin to lift off the seabed towards the surface. This phase lasts, on average, 5.2 min. Phase B begins when the first trap is hauled aboard the vessel. At this point, the buoy line is completely onboard. The subsequent 45–55 min demonstrate the common hauling procedure until all traps are hauled. The variance in the tension over time (rising and falling) is largely determined by harvester behaviour. The speed of the hauler is dynamically manipulated by the crew using a hydraulic system. Typically, the operator increases the hauling speed (and resulting tension) between traps until the next trap breaks the water surface, at which point the operator slows the hauler (reducing tension) so the trap can be safely brought onboard. Once the trap is aboard, the hauler is accelerated (increasing tension) until the next trap breaks the water surface. The sequence repeats itself until all traps are brought aboard the vessel.
3.1. Statistical Model—Phase A
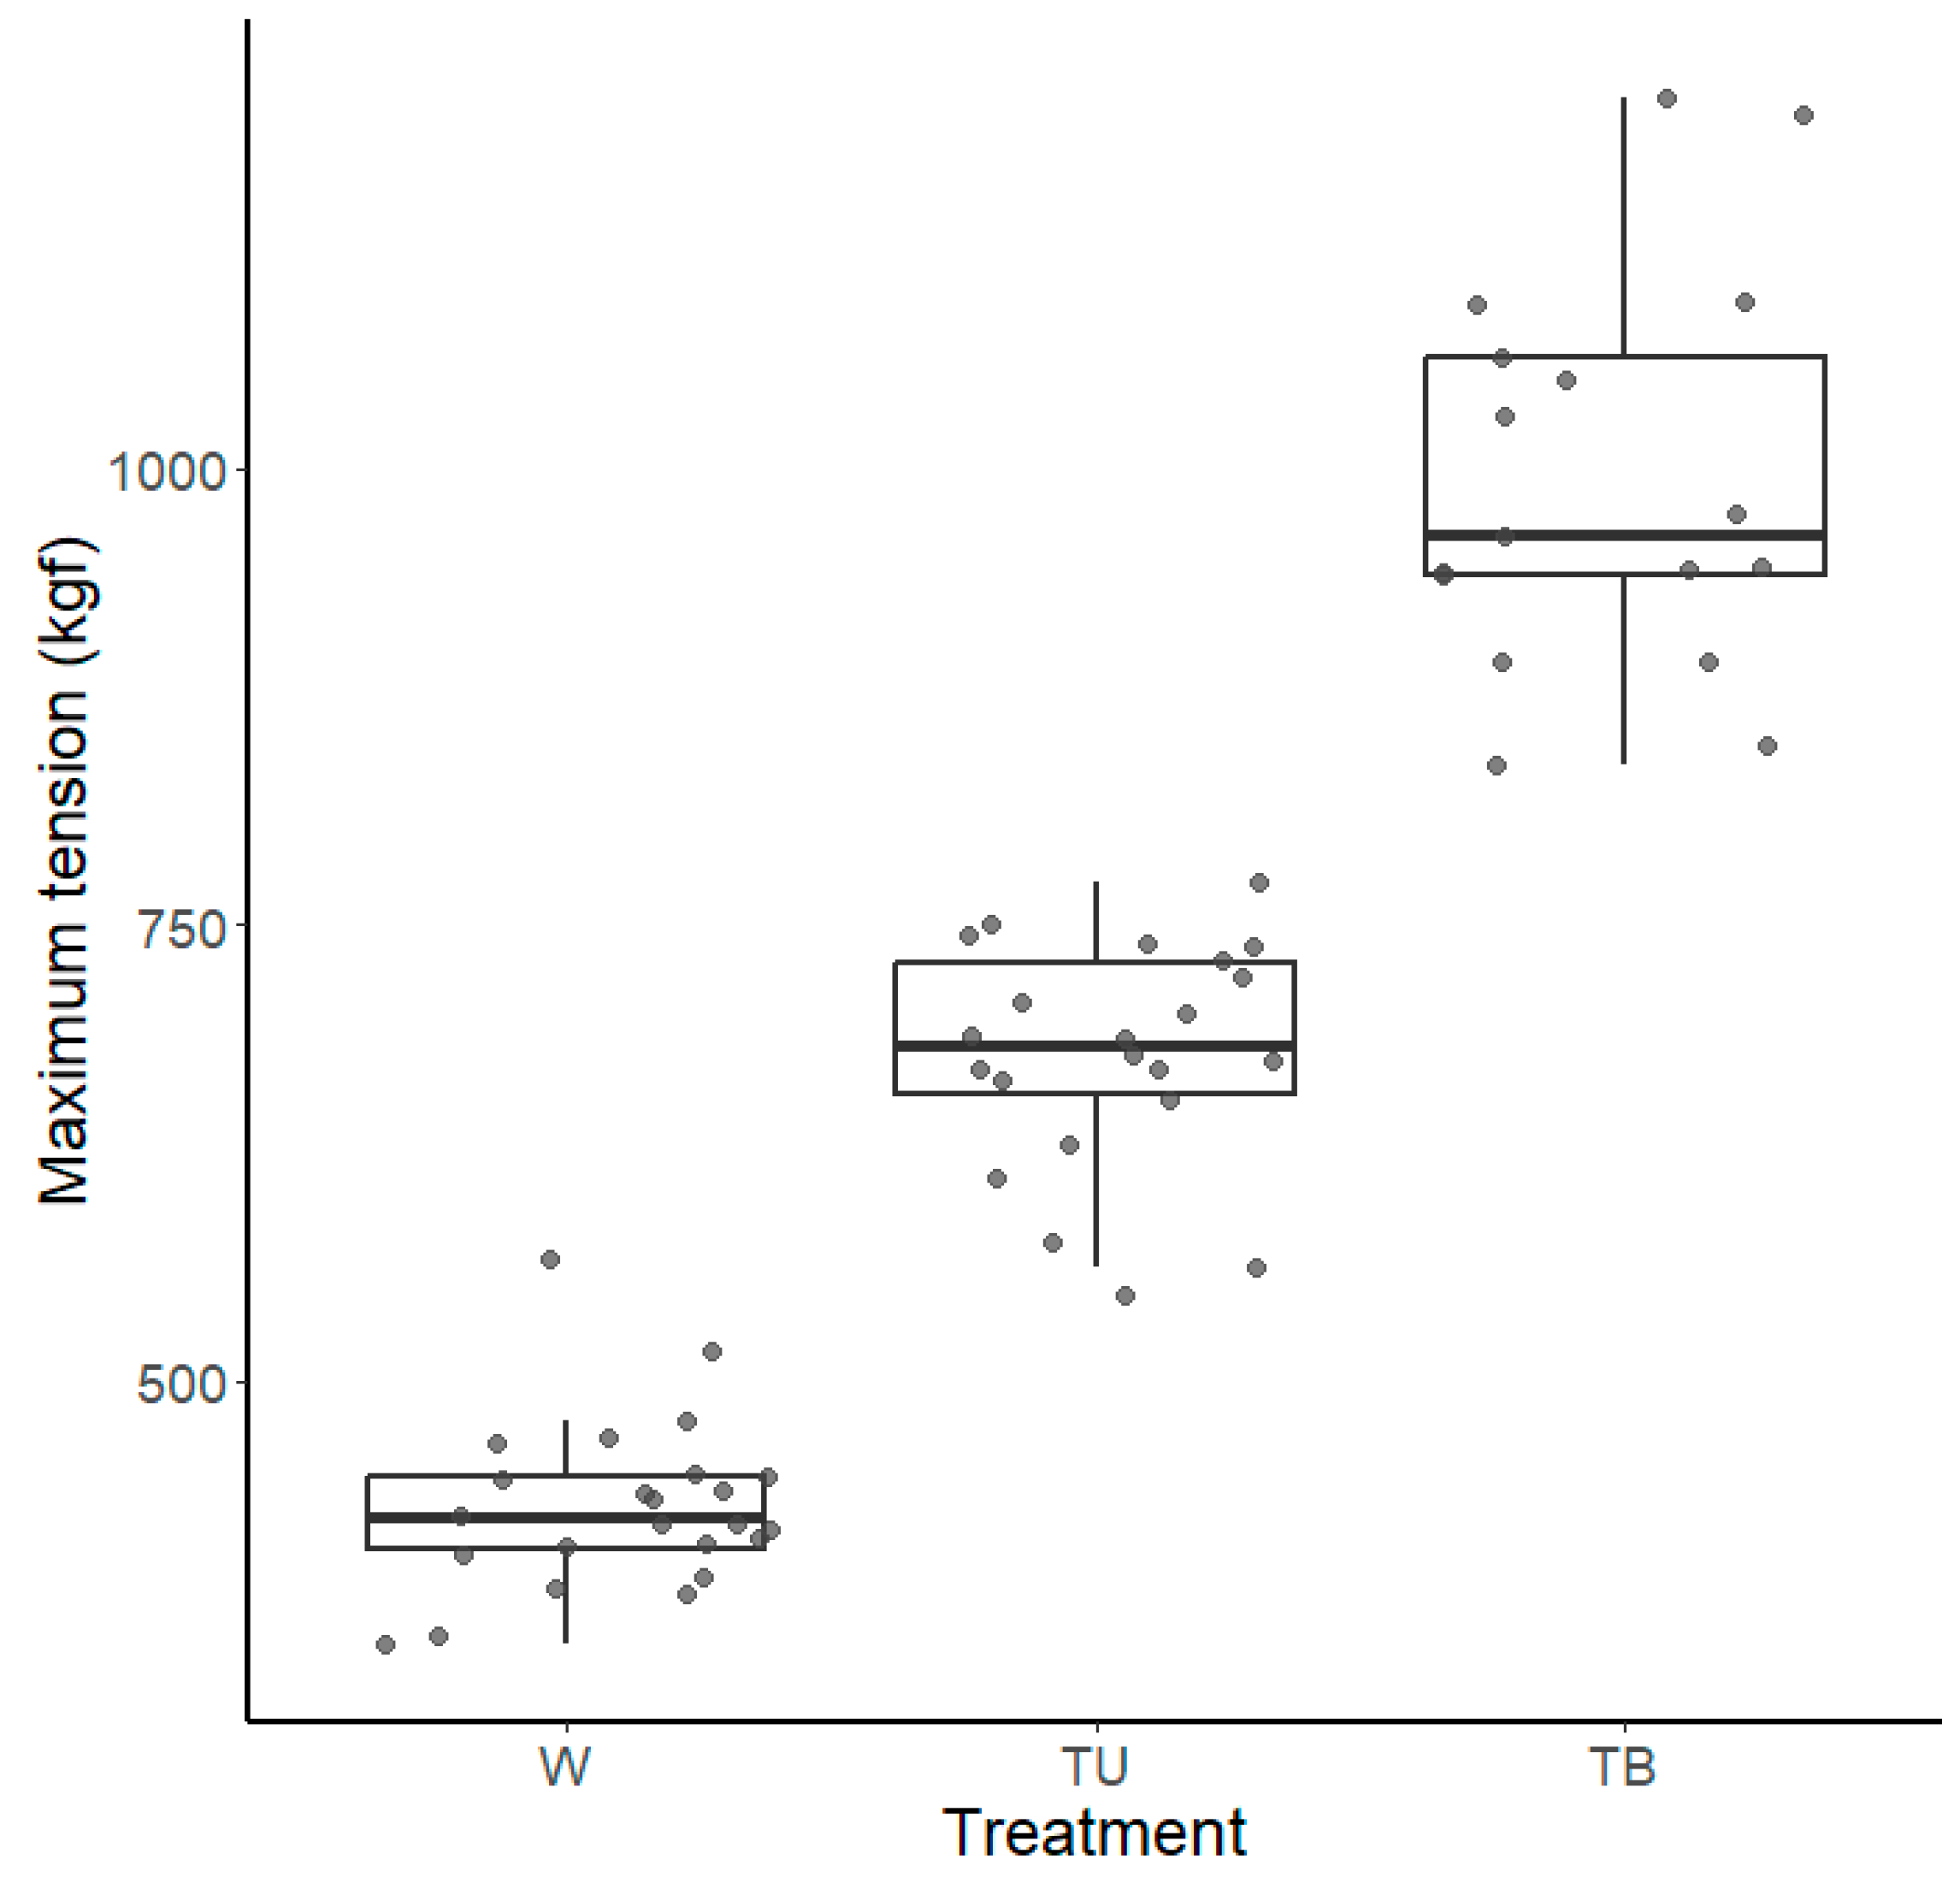
The lowest AICc GLMM model for Phase A included “Treatment” and “Wave Height” as explanatory variables and “Haul” as the random variable. The result from the model indicated that the maximum tension was significantly reduced by 151.08 kgf (CI: 27.63–274.98 kgf) (p-value = 0.017) and by 212.26 kgf (CI: 90.99–333.53 kgf) (p-value = 0.005) for the TU and W fleets, respectively, when compared to the TB fleet (Table 1, Figure 6). Wave height was shown to be not statistically significant (p-value = 0.055). Estimated marginal means from the model indicated that the maximum tension for the TB fleet was 477.53 kgf (CI: 382.84–572.21 kgf), while the TU and W fleets produced maximum tensions of 326.44 kg (CI: 243.95–408.94 kgf) and 265.27 kgf (CI: 186.26–344.27 kgf), respectively, averaged over wave height variable.
3.2. Statistical Model—Phase B
For Phase B, the model with the lowest AICc included “Treatment”, “Wind Direction”, and “Wave Height” as explanatory variables and “Haul” as the random variable. Similar to Phase A, hauling the TU fleet significantly reduced the maximum tension by 280.19 kgf (CI: 239.91–320.48 kgf) (p-value < 0.0001) and hauling the W fleet significantly reduced the maximum tension by 525.71 kgf (CI: 486.41–565.01 kgf) (p-value < 0.0001) when compared to the TB fleet (Table 2, Figure 7). Wave height was statistically significant (p-value < 0.0001), and the model indicated that for every one unit increase in wave height (i.e., 1 m), the maximum tension increased by 42.35 kgf, averaged over trap treatment. Relative to an East wind direction, the North and South wind directions significantly increased the maximum tension by 129.81 kgf (p-value = 0.016) and by 91.52 kgf (p-value = 0.041), respectively, averaged over trap treatment. The remainder of the wind directions were found to be not statistically significant when compared to the East wind direction (Table 2). Estimated marginal means from the model indicated that the maximum tension for the TB fleet was 987.99 kgf (CI: 954.72–1021.26 kgf), the maximum tension for the TU fleet was 680.60 kgf (CI: 651.61–709.58 kgf), and the maximum tension for the W fleet was 433.93 kgf (CI: 406.17–461.69 kgf), averaged over wave height and wind direction variables.
4. Discussion
This study measured tension in the inshore snow crab fishery in Newfoundland for the first time. We evaluated the tension in both the buoy lines (Phase A) and main lines (Phase B). The maximum tension across all three treatments in Phase A was lower than in Phase B, likely due to the lower number of traps that were elevated from the sea floor in Phase A.
Our results showed that the components of the traps contribute to the loads experienced. The addition of both netting and catch increased the tensions observed. According to the estimated marginal means from Phase A, traps with mesh (TU) had an increase in tension when hauling of 23.06% compared to frames only (W) and traps with catch (TB) showed a 46.28% increase in tension when hauling compared to traps without (TU). We attribute this increased load to increased hydrodynamic drag as the traps are lifted through the water column. Traps with netting had more drag than frames alone because of the additional contact area, and the mesh at the bottom of traps with catch were completely covered with crabs, which also increased the area interacting with water and, therefore, the drag. Additionally, factors such as the number of traps per trawl have been shown to add significant tension while hauling due to the drag effect of the traps on the bottom [13].
Environmental conditions (water depth, wind direction, wind speed, and wave height) were recorded during the experiment. Although water depth has been shown to increase load when harvesting lobster in the Gulf of Maine [13], this was not detected in our results. We attribute this to the limited range of depths in our study design. Wave height was shown to have no effect in Phase A, but increased tension significantly in Phase B. Willse et al. [13] observed that loads when hauling are likely to increase in inclement weather. Our observations showed this only to be true for the main line.
The authors recognize that there were limitations to the study. Principally, tension was measured across a limited range of depths and so the effect of depth on tension was not statistically detectable. The snow crab fishery encompasses depths of 50 to 600 m [25] but focuses mostly on depths of 200 to 400 m where legal-size males are more abundant [26,27]. While this experiment was conducted within the depth interval most commonly fished, further research should aim to capture a wider variety of depths to evaluate the relation between depth and tension in this fishery. The length of the fleets was not a varying factor in this study. Another study identified a drag effect increase with a greater number of traps in a fleet [13]; therefore, additional research on tension when hauling fleets of varying lengths should be conducted in this fishery.
Marine tackle regulations in Canada encourage safe working loads to be one-fifth the breaking strength of the equipment [12]. Best practices would, therefore, suggest that an LBS component designed to break at 771 kgf should not be placed in fishing operations exceeding 771/5 = 154 kgf. The loads documented in this study significantly exceed this value, suggesting that the use of LBS components would be an unwise gear modification for deep-water fisheries such as the snow crab fishery in eastern Canada. If, at any point in time, the tension surpasses the threshold of the LBS components, the component would break, and this would result in the loss of fishing equipment and likely ghost gear as depths are too great for grappling. Ghost gear not only poses a risk of entanglement and monetary loss for harvesters, but it also has the potential to have serious repercussions on the ecosystem due to the continuous capture of animals [28]. LBS breakage also represents a safety risk for harvesters as it has been shown to fly backwards out of the hauler after breakage as the energy (tension on the rope) in the system is released. Additionally, the value of LBS gear for large whale conservation should be assessed before implementation is considered. Evidence suggests that the entanglement severity was not reduced in areas where LBS components were used [4,9]; however, the LBS components used at the time were inserted next to the surface buoy rather than lower in the buoy line where conservation benefits could be greater, and so much research remains to be conducted on them to assess their efficacy. If LBS components are implemented in this fishery and similar deep fisheries without considering the results obtained from this research, they have the potential to create serious environmental repercussions and negative impacts on harvesters and the province’s economy.
5. Conclusions
This study involved a controlled fishing experiment in which we documented the loads experienced while hauling fleets of snow crab traps in eastern Canada. The results showed that several factors contributed to the loads observed, including the components of the traps and the presence of crab, as well as environmental conditions such as wind and wave height. The maximum tensions observed significantly exceeded the safe working load of the proposed low-breaking-strength components. Our results suggest that current LBS components are not a viable solution for this fishery on the basis of potential human safety, gear loss, and ecosystem impacts.
Author Contributions
Conceptualization, P.D.W. and G.P.; methodology, G.P., P.D.W. and T.A.-S.; investigation, G.P.; data curation, G.P. and T.A.-S.; formal analysis, G.P. and T.A.-S.; investigation, G.P. and P.D.W.; data curation, G.P.; writing—original draft preparation, G.P.; writing—review and editing, G.P., T.A.-S. and P.D.W.; validation, P.D.W.; visualization, G.P. and T.A.-S.; supervision, P.D.W.; project administration, G.P. and P.D.W.; resources, P.D.W.; funding acquisition, P.D.W. All authors have read and agreed to the published version of the manuscript.
Funding
This research was funded by Fisheries and Oceans Canada through the Whalesafe Gear Adoption Fund. Grant number WS21-1-001.
Institutional Review Board Statement
Ethical review and approval were waived for this study due to the catch and release of invertebrates at sea that did not involve holding, captivity, or experiments.
Data Availability Statement
Data are available upon request.
Acknowledgments
The authors wish to thank the Captain and crew of the F/V Island Voyager. Lindsee Clark and Meghan Donovan are also thanked for their contribution during the sea trials as well as John Cross for his contribution to the angle correction protocol. We also thank Sean Brillant and his team, specifically Alexandra Cole, Alexandra Mayette, and Shiva Javdan, for their continuous help with analysis questions and statistical support.
Conflicts of Interest
The authors declare no conflicts of interest. The funders had no role in the design of the study; in the collection, analyses, or interpretation of data; in the writing of the manuscript; or in the decision to publish the results.
References
- Pettis, H.M.; Pace, R.M., III; Hamilton, P.K. North Atlantic Right Whale Consortium 2022 Annual Report Card; Report to the North Atlantic Right Whale Consortium; NARWC: Providence, RI, USA, 2023; 15p. [Google Scholar]
- Myers, H.J.; Moore, M.M.; Baumgartner, M.F.; Brillant, S.W.; Katona, S.K.; Knowlton, A.R.; Morissette, L.; Pettis, H.M.; Shester, G.; Werner, T.B. Ropeless fishing to prevent large whale entanglements: Ropeless Consortium report. Mar. Policy 2019, 107, 103587. [Google Scholar] [CrossRef]
- Pace, R.M., III; Williams, R.; Kraus, S.D.; Knowlton, A.R.; Pettis, H.M. Cryptic mortality of North Atlantic right whales. Conserv. Sci. Pract. 2021, 3, e346. [Google Scholar] [CrossRef]
- Moore, J.M. How we can all stop killing whales: A proposal to avoid whale entanglement in fishing gear. ICES J. Mar. Sci. 2019, 76, 781–786. [Google Scholar] [CrossRef]
- Johnson, A.; Salvador, G.; Kenney, J.; Robbins, J.; Kraus, S.; Landry, S.; Clapham, P. Fishing gear involved in entanglements of right and hump-back whales. Mar. Mammal Sci. 2005, 21, 635–645. [Google Scholar] [CrossRef]
- Knowlton, A.R.; Hamilton, P.K.; Marx, M.K.; Pettis, H.M.; Kraus, S.D. Monitoring North Atlantic right whale Eubalaena glacialis entanglement rates: A 30 yr retrospective. Mar. Ecol. 2012, 466, 293–302. [Google Scholar] [CrossRef]
- Knowlton, A.R.; Robbins, J.; Landry, S.; McKenna, H.A.; Kraus, S.D.; Werner, T.B. Effects of fishing rope strength on the severity of large whale entanglements. Conserv. Biol. 2016, 30, 318–328. [Google Scholar] [CrossRef] [PubMed]
- Henry, A.; Garron, M.; Reid, A.; Morin, D.M.; Ledwell, W.; Cole, T.V. Serious Injury and Mortality Determinations for Baleen Whale Stocks along the Gulf of Mexico, United States East Coast, and Atlantic Canadian Provinces, 2012–2016; US Department of Commerce: Washington, DC, USA, 2019. [CrossRef]
- Pace, R.M.; Cole, T.V.N.; Henry, A.G. Incremental fishing gear modifications fail to significantly reduce large whale serious injury rates. Endanger. Species Res. 2014, 26, 115–126. [Google Scholar] [CrossRef]
- NOAA Fisheries. Approved Weak Inserts for the Atlantic Large Whale Take Reduction Plan. 2023. Available online: https://www.fisheries.noaa.gov/new-england-mid-atlantic/marine-mammal-protection/approved-weak-inserts-atlantic-large-whale-take (accessed on 11 March 2024).
- Knowlton, A.R.; Malloy, R., Jr.; Kraus, S.D.; Werner, T.B.; Aquarium, N.E. Development and Evaluation of Reduced Breaking Strength Rope to Reduce Large Whale Entanglement Severity; Report to the Massachusetts Office of Energy and Environmental Affairs; Consortium for Wildlife Bycatch Reduction: Boston, MA, USA, 2018. [Google Scholar]
- Government of Canada. Cargo, Fumigation, and Tackle Regulations. Canada Shipping Act. 2021. Available online: https://laws-lois.justice.gc.ca/eng/regulations/sor-2007-128/FullText.html (accessed on 25 March 2024).
- Willse, N.; Summers, E.; Chen, Y. Vertical line requirements and North Atlantic Right Whale entanglement risk reduction for the Gulf of Maine American lobster fishery. Mar. Coast. Fish. 2022, 14, e10203. [Google Scholar] [CrossRef]
- DFO. Seafisheries Landed Value by Province, 2021. Zonal Interchange File [Database]. Ottawa. 2022. Available online: https://www.dfo-mpo.gc.ca/stats/commercial/land-debarq/sea-maritimes/s2021pv-eng.htm (accessed on 19 January 2024).
- Mullowney, D.R.J.; Baker, K.D.; Pedersen, E.J. Harvesting strategies during a forecasted decline in the Newfoundland and Labrador snow crab fishery. Fish. Res. 2020, 232, 105707. [Google Scholar] [CrossRef]
- DFO. Snow Crab Integrated Fisheries Management Plan for Newfoundland and Labrador. 2024. Available online: https://www.dfo-mpo.gc.ca/fisheries-peches/ifmp-gmp/snow-crab-neige/2019/index-eng.html (accessed on 11 March 2024).
- Vihtakari, M. ggOceanMaps: Plot Data on Oceanographic Maps Using ‘ggplot2’_. R Package Version 1.3.4. 2022. Available online: https://CRAN.R-project.org/package=ggOceanMaps (accessed on 12 March 2024).
- Brown, P.; Araya-Schmidt, T.; Bungay, T.; Winger, P.D. Assessing the technical and economic viability of galvanizing snow crab (Chionoecetes opilio) traps. Fishes 2024, 9, 109. [Google Scholar] [CrossRef]
- R Core Team. R: A Language and Environment for Statistical Computing. R Foundation for Statistical Computing, Vienna, Austria. 2022. Available online: https://www.R-project.org/ (accessed on 5 March 2024).
- Brooks, M.E.; Kristensen, K.; van Benthem, K.J.; Magnusson, A.; Berg, C.W.; Nielsen, A.; Skaug, H.J.; Maechler, M.; Bolker, B.M. glmmTMB balances speed and flexibility among packages for zero-inflated generalized linear mixed modeling. R J. 2017, 9, 378–400. [Google Scholar] [CrossRef]
- Akaike, H. A new look at the statistical model identification. IEEE Trans. Automat. Control 1974, 19, 716–723. [Google Scholar] [CrossRef]
- Bolker, B.; R Development Core Team. bbmle: Tools for General Maximum Likelihood Estimation. R Package Version 1.0.23.1. 2020. Available online: https://cran.r-project.org/web/packages/bbmle/bbmle.pdf (accessed on 12 March 2024).
- Hartig, F. DHARMa: Residual Diagnostics for Hierarchical (Multi-Level/Mixed) Regression Models. R Package Version 0.4.1. 2021. Available online: https://CRAN.R-project.org/package=DHARMa (accessed on 22 March 2024).
- Lenth, R. Emmeans: Estimated Marginal Means, aka Least-Squares Means. R Package Version 1.4. 2019. Available online: https://cran.r-project.org/web/packages/emmeans/emmeans.pdf (accessed on 22 March 2024).
- DFO. Snow Crab. 2015. Available online: https://www.dfo-mpo.gc.ca/fisheries-peches/sustainable-durable/fisheries-peches/snow-crab-eng.html (accessed on 11 March 2024).
- Dawe, E.G.; Colbourne, E.B. Distribution and demography of snow crab (Chionoecetes opilio) males on the Newfoundland and Labrador Shelf. In Crabs in Cold Water Regions: Biology, Management, and Economics; Paul, A.J., Dawe, E.G., Elner, R., Jamieson, G.S., Kruse, G.H., Otto, R.S., Sainte-Marie, B., Shirley, T.C., Woodby, D., Eds.; Alaska Sea Grant College Program, University of Alaska Fairbanks: Fairbanks, AK, USA, 2002; pp. 577–594. [Google Scholar] [CrossRef]
- Mullowney, D.; Morris, C.; Dawe, E.; Zagorsky, I.; Goryanina, S. Dynamics of snow crab (Chionoecetes opilio) movement and migration along the Newfoundland and Labrador and Eastern Barents Sea continental shelves. Rev. Fish Biol. Fish. 2018, 28, 435–459. [Google Scholar] [CrossRef]
- Cerbule, K.; Herrmann, B.; Grimaldo, E.; Brinkhof, J.; Sistiaga, M.; Larsen, R.B.; Bak-Jensen, Z. Ghost fishing efficiency by lost, abandoned or discarded pots in snow crab (Chionoecetes opilio) fishery. Mar. Pollut. Bull. 2023, 193, 115249. [Google Scholar] [CrossRef] [PubMed]
Figure 1.
Map of the fishing area located in Conception Bay, Newfoundland and Labrador, Canada, with an inset map of the fleets of traps deployed during the experiment coloured by treatment. Map was created using the ggOceanMaps package and ggOceanMapsData packages in R [17]. Arctic polar stereographic projection was used.

Figure 2.
Picture of the two different types of traps used in the experiment. (a) Frames only: traditional conical traps with mesh and entrance cone removed and (b) unaltered traditional conical crab traps used for the unbaited and baited treatments.
Figure 2.
Picture of the two different types of traps used in the experiment. (a) Frames only: traditional conical traps with mesh and entrance cone removed and (b) unaltered traditional conical crab traps used for the unbaited and baited treatments.
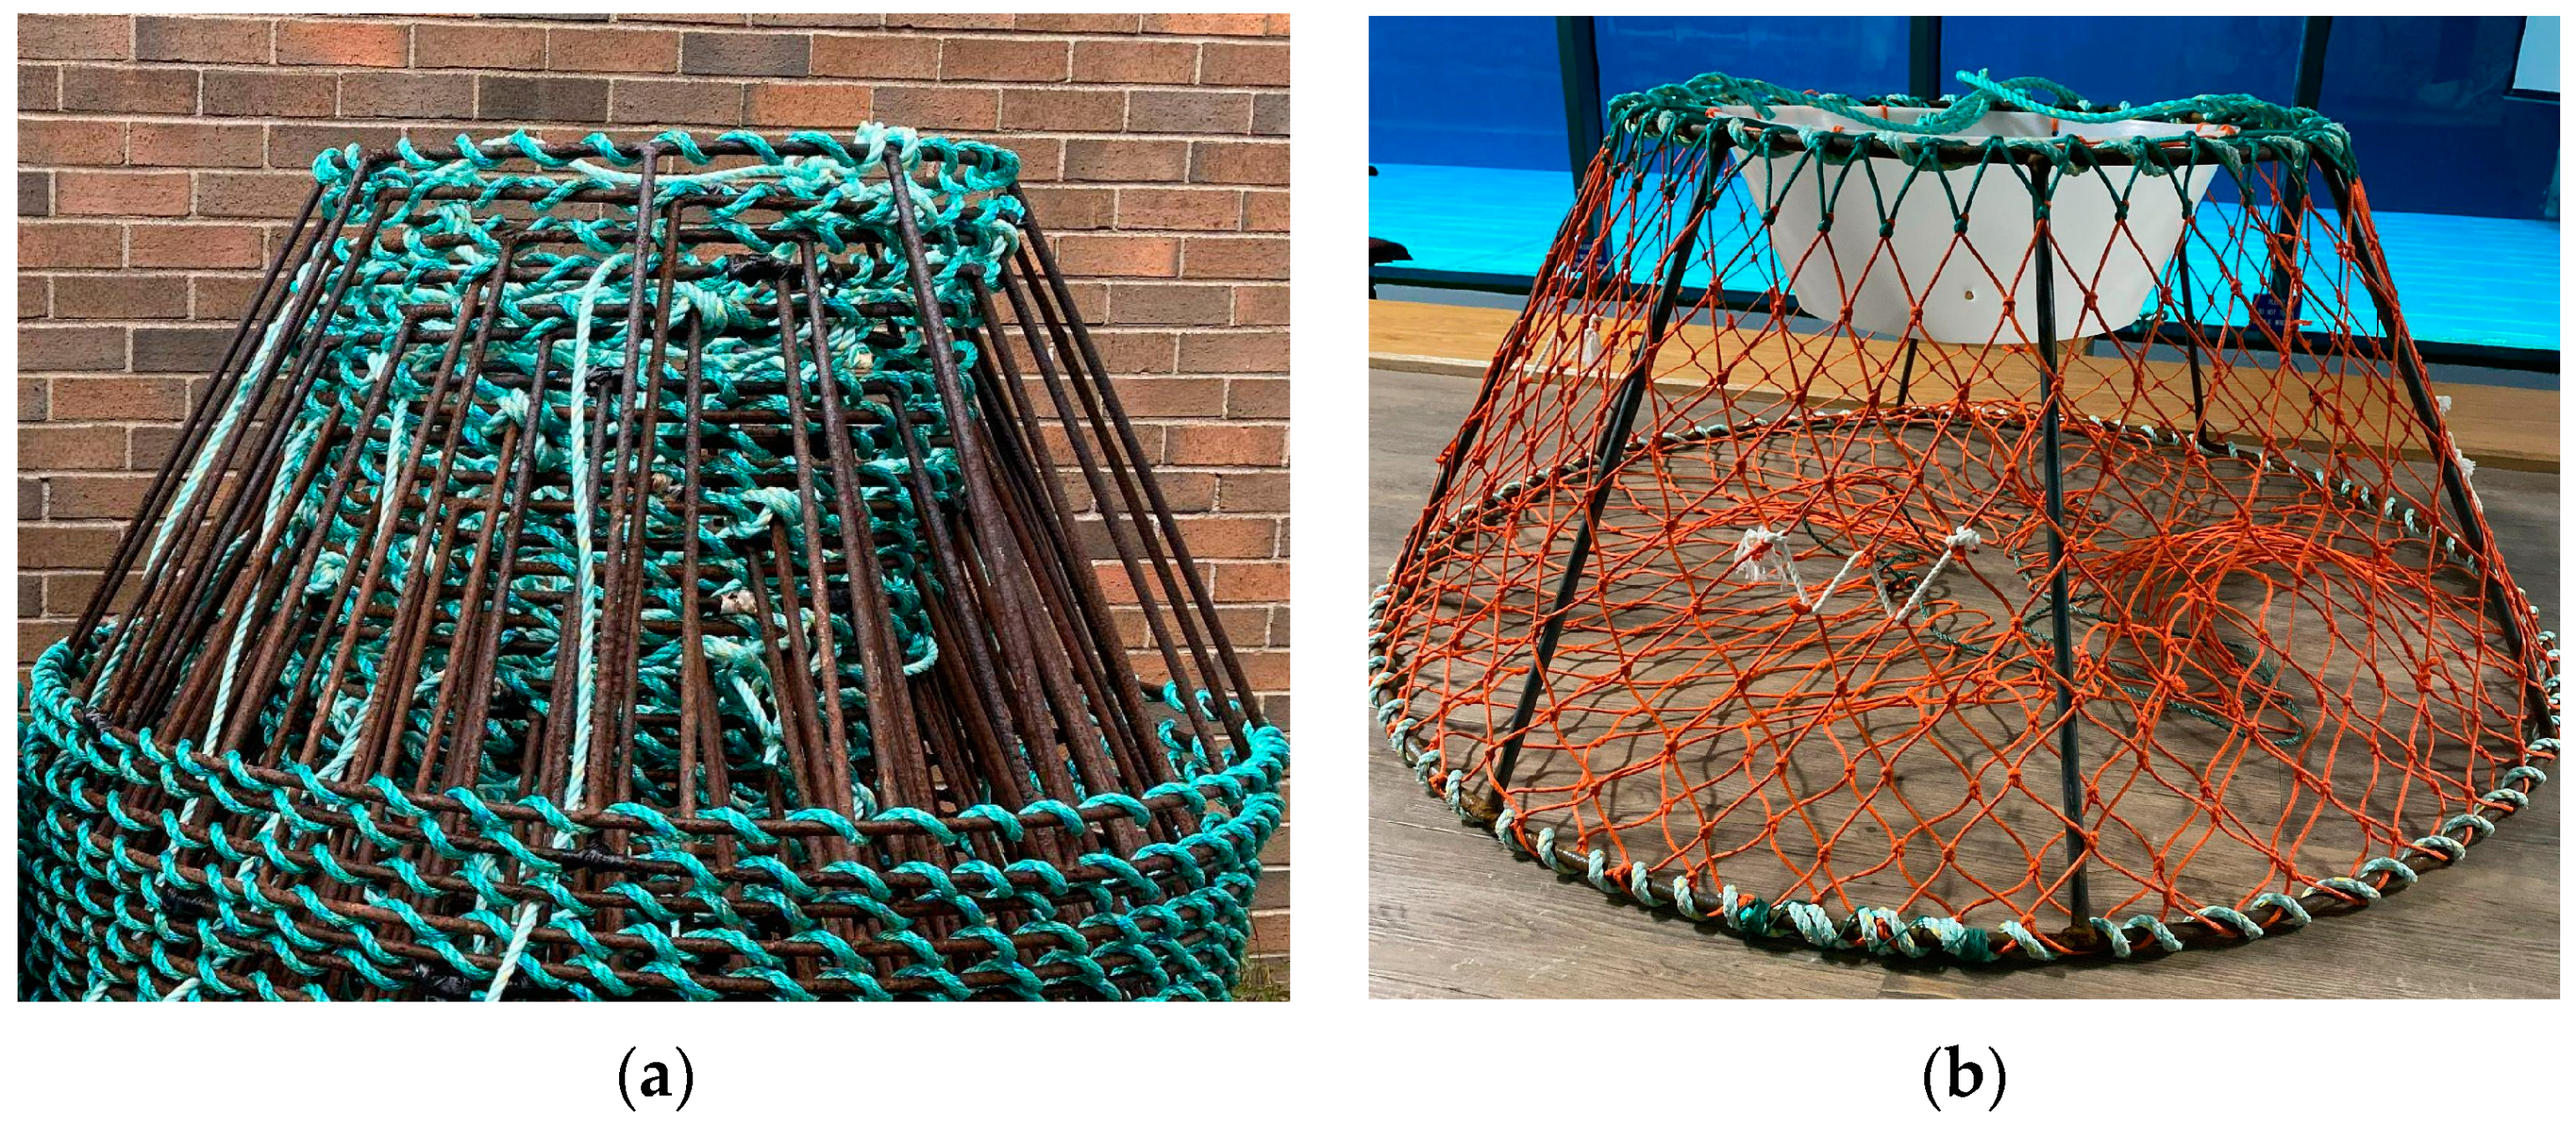
Figure 3.
Diagram of fleet configuration demonstrating two high flyers and two buoys at the surface of the water attached to the two buoy lines of 402 m, with a total of 50 traps per fleet.
Figure 3.
Diagram of fleet configuration demonstrating two high flyers and two buoys at the surface of the water attached to the two buoy lines of 402 m, with a total of 50 traps per fleet.
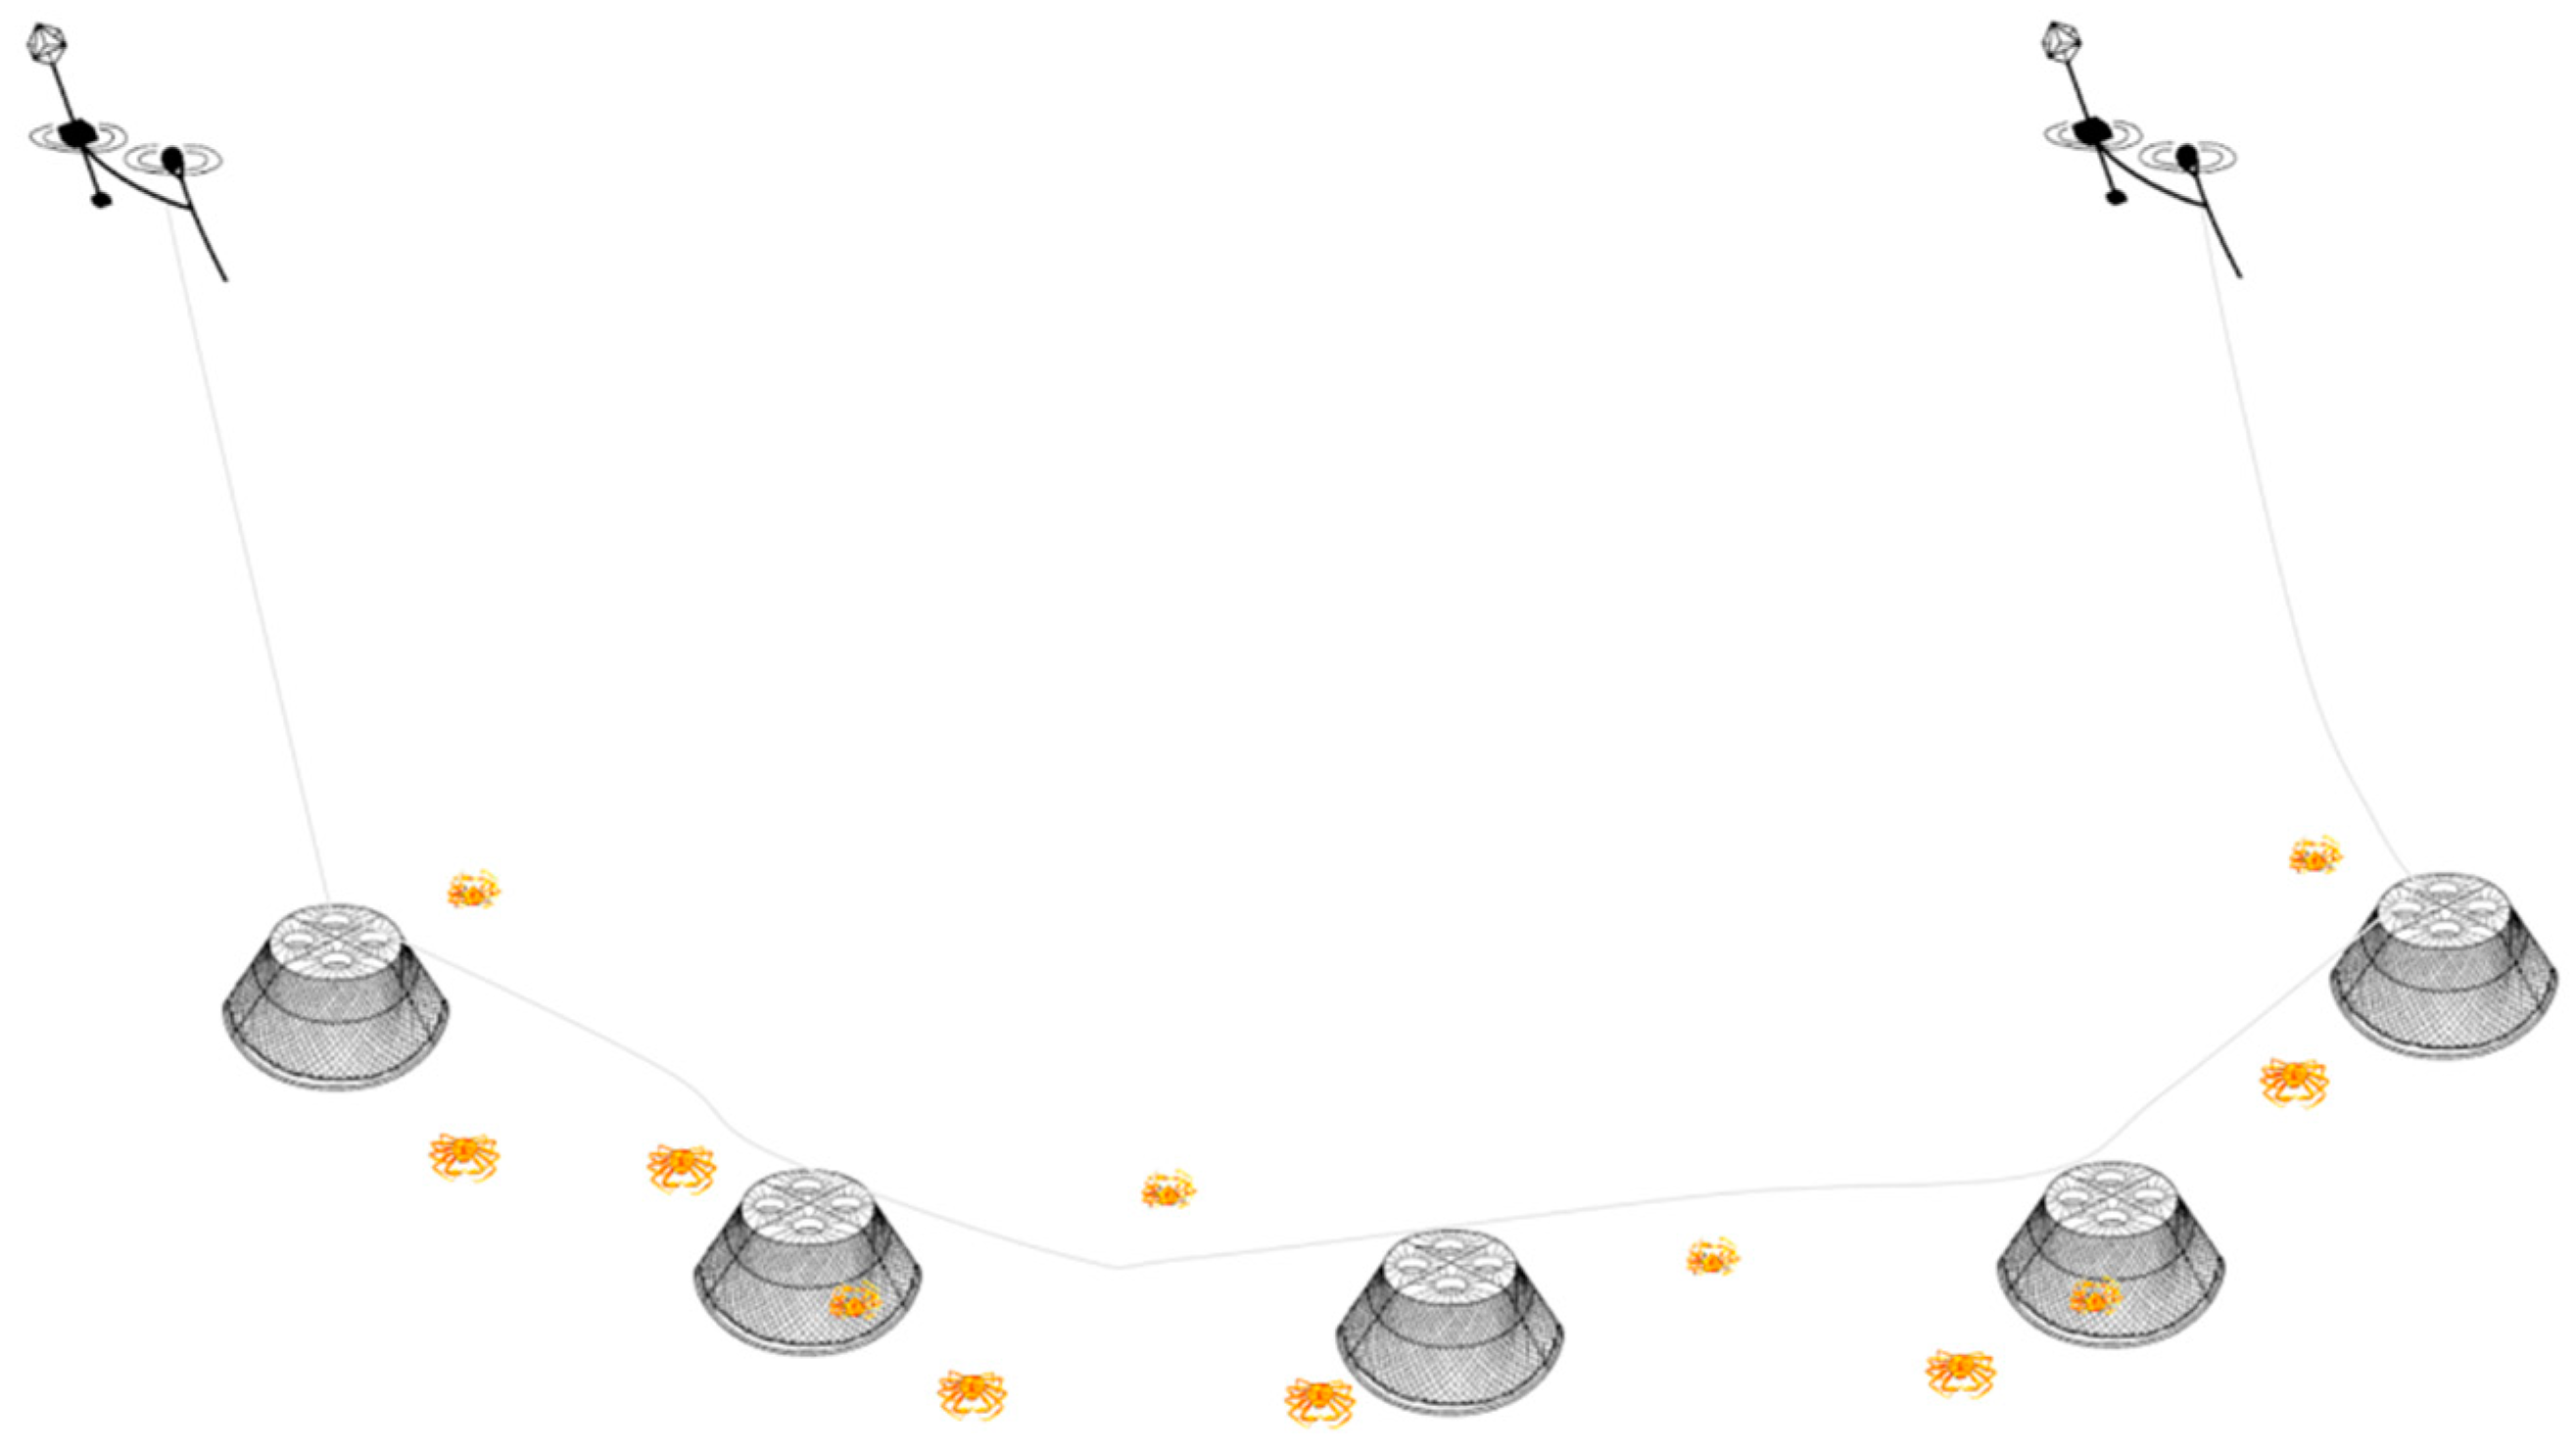
Figure 4.
Picture of the Euroload load-cell (ELT24) installed above the hauler aboard the FV Island Voyager fishing vessel during the experiment.
Figure 4.
Picture of the Euroload load-cell (ELT24) installed above the hauler aboard the FV Island Voyager fishing vessel during the experiment.
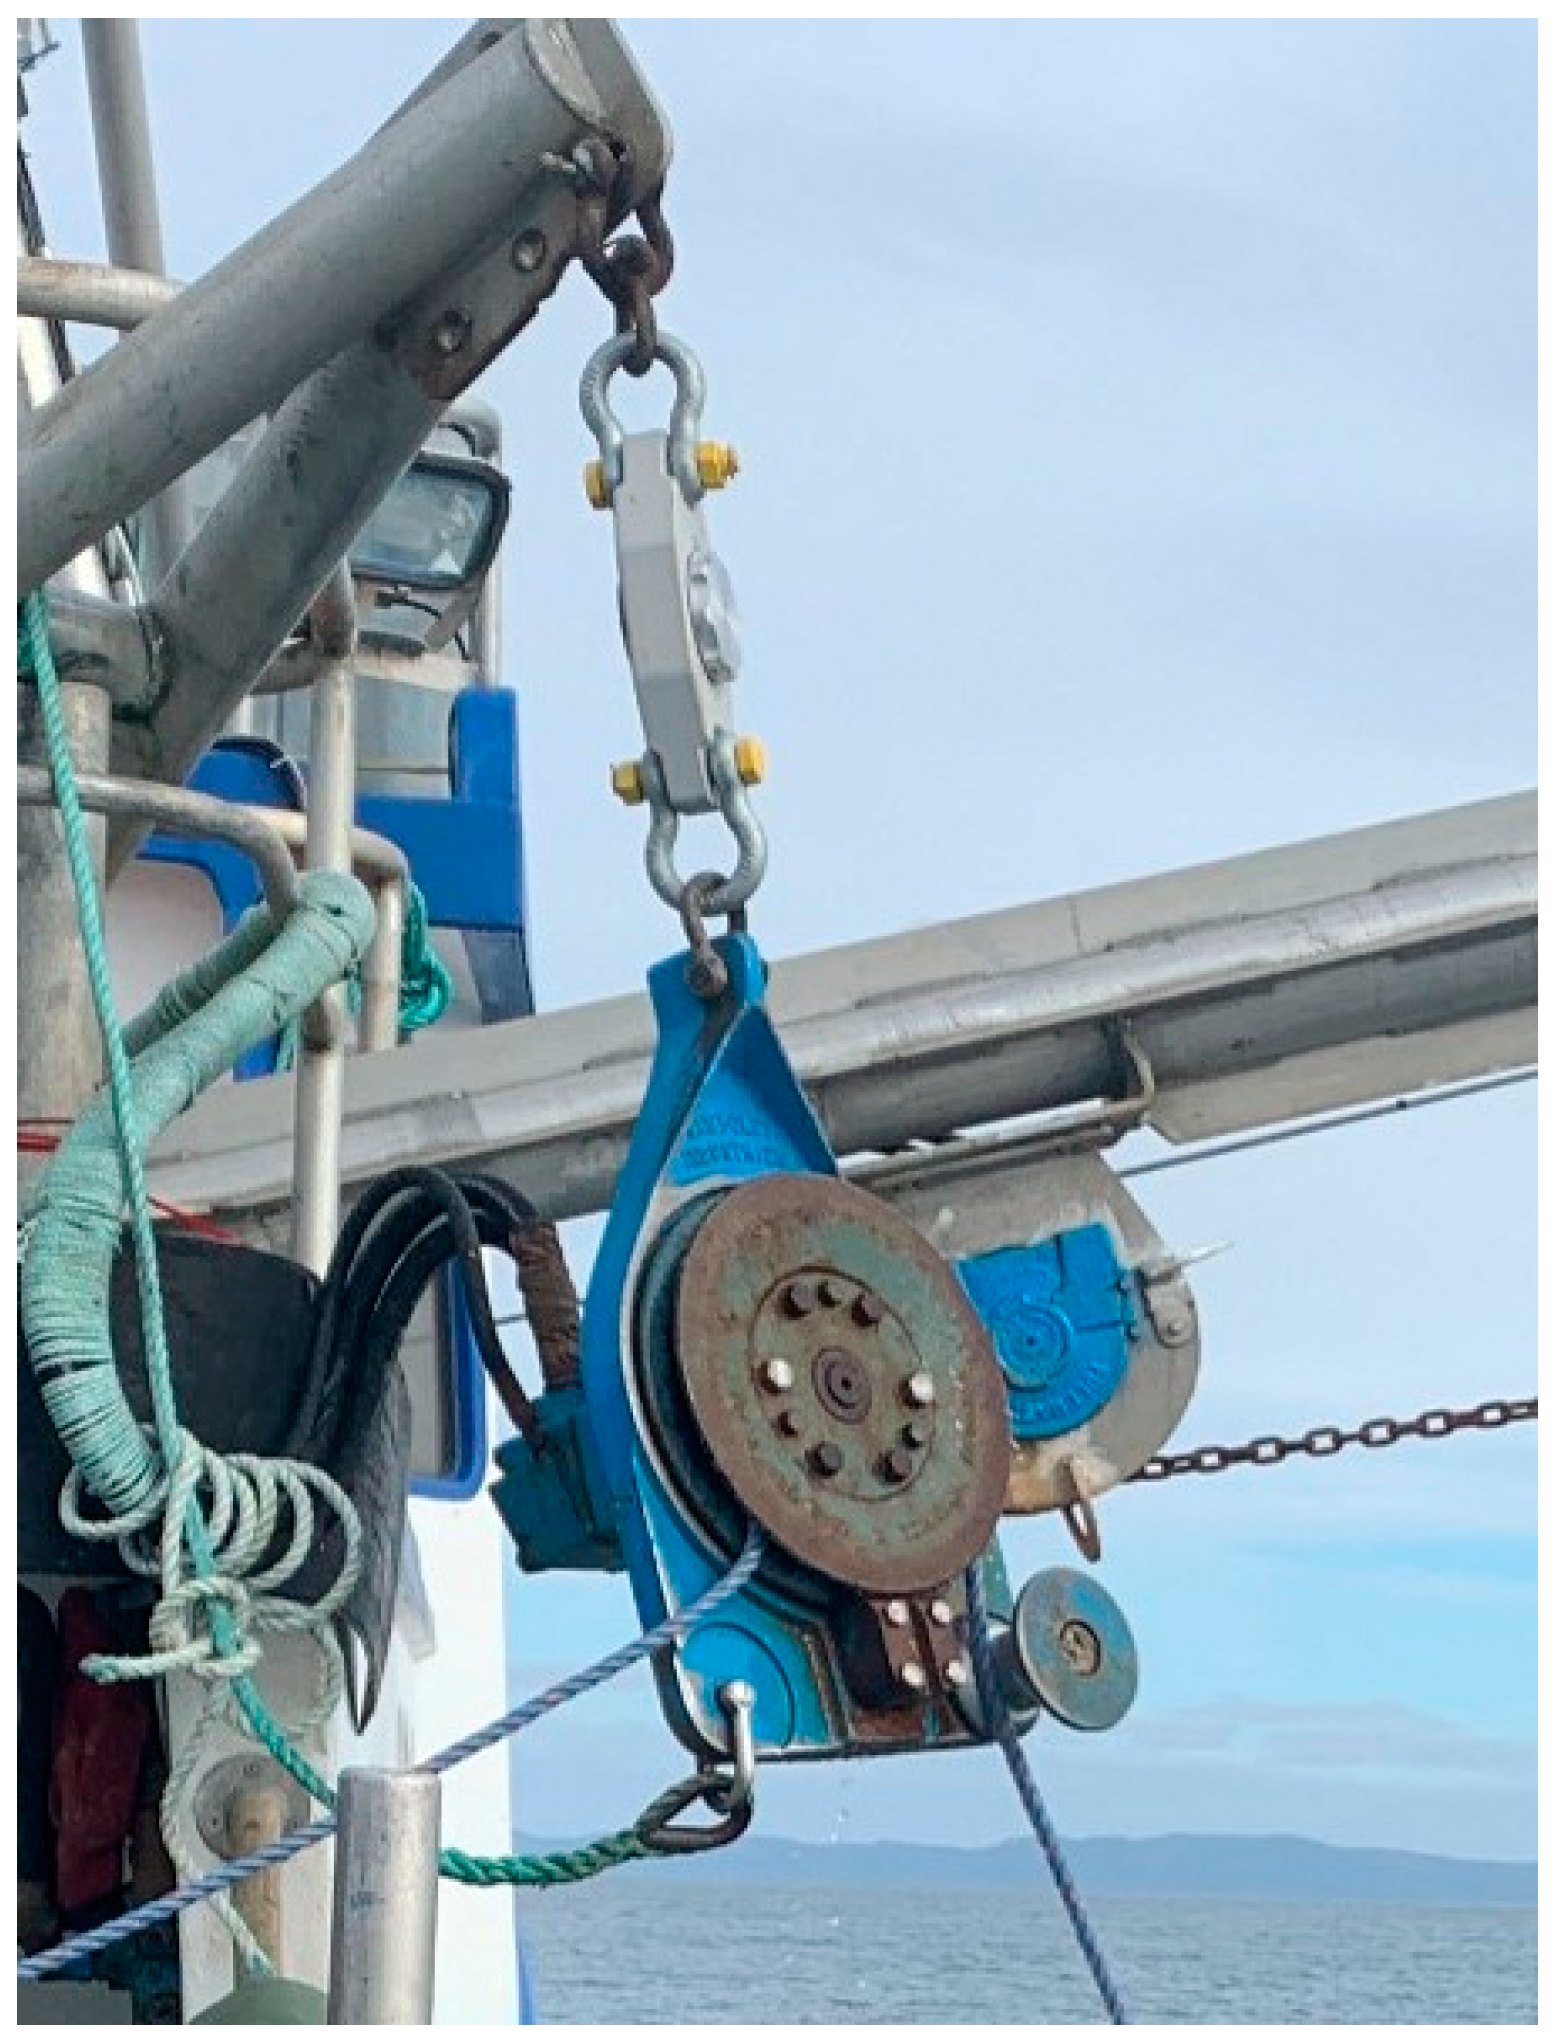
Figure 5.
Representation of the tension, in kgf, over time, in minutes, of a typical haul of traditional baited traps (TBs) during Phase A (shaded) and Phase B.
Figure 5.
Representation of the tension, in kgf, over time, in minutes, of a typical haul of traditional baited traps (TBs) during Phase A (shaded) and Phase B.

Figure 6.
Box plot for the maximum tension per haul (kgf) during phase A for all 3 treatments: frames only (W), traditional unbaited traps (TUs), and traditional baited traps (TBs). The bottom of the box represents the 25th quartile (Q1), the horizontal bar in the middle represents the median (Q2), and the top of the box represents the 75th quartile (Q3). Dots show the observed values.

Figure 7.
Box plot for the maximum tension per haul (kgf) during Phase B for all 3 treatments: frames only (W), traditional unbaited traps (TUs), and traditional baited traps (TBs). The bottom of the box represents the 25th quartile (Q1), the horizontal bar in the middle represents the median (Q2), and the top of the box represents the 75th quartile (Q3). Dots show the observed values.

Table 1.
Generalized linear mixed model (GLMM) estimates, standard error, z value, and p-value for hauling of Phase A (buoy lines).
Table 1.
Generalized linear mixed model (GLMM) estimates, standard error, z value, and p-value for hauling of Phase A (buoy lines).
| Phase A Model | Estimate | Standard Error | Z Value | p-Value |
|---|---|---|---|---|
| Intercept | 363.89 | 81.08 | 4.488 | <0.0001 |
| Treatment: TU | −151.08 | 62.99 | −2.399 | 0.016 |
| Treatment: W | −212.26 | 61.88 | −3.430 | 0.001 |
| Wave height | 47.41 | 24.74 | 1.916 | 0.055 |
Table 2.
Generalized linear mixed model (GLMM) estimates, standard error, Z value, and p-value for hauling of Phase B (main line).
Table 2.
Generalized linear mixed model (GLMM) estimates, standard error, Z value, and p-value for hauling of Phase B (main line).
| Phase B Model | Estimate | Standard Error | Z Value | p-Value |
|---|---|---|---|---|
| Intercept | 834.812 | 51.339 | 16.261 | <0.0001 |
| Treatment: TU | −280.194 | 20.555 | −13.631 | <0.0001 |
| Treatment: W | −525.712 | 20.052 | −26.217 | <0.0001 |
| Wave height | 42.351 | 9.386 | 4.512 | <0.0001 |
| Wind direction: North | 129.808 | 53.680 | 2.418 | 0.016 |
| Wind direction: North East | 69.335 | 44.391 | 1.562 | 0.118 |
| Wind direction: North West | 52.598 | 39.152 | 1.343 | 0.179 |
| Wind direction: South | 91.517 | 44.803 | 2.043 | 0.041 |
| Wind direction: South West | 9.345 | 40.226 | −0.227 | 0.821 |
| Wind direction: West | 42.351 | 9.386 | 0.232 | 0.814 |
Disclaimer/Publisher’s Note: The statements, opinions and data contained in all publications are solely those of the individual author(s) and contributor(s) and not of MDPI and/or the editor(s). MDPI and/or the editor(s) disclaim responsibility for any injury to people or property resulting from any ideas, methods, instructions or products referred to in the content. |
© 2024 by the authors. Licensee MDPI, Basel, Switzerland. This article is an open access article distributed under the terms and conditions of the Creative Commons Attribution (CC BY) license (https://creativecommons.org/licenses/by/4.0/).
Share and Cite
MDPI and ACS Style
Peck, G.; Araya-Schmidt, T.; Winger, P.D. Hauling Snow Crab Traps in Eastern Canada: A Study Documenting Tension in Ropes. Fishes 2024, 9, 154. https://doi.org/10.3390/fishes9050154
AMA Style
Peck G, Araya-Schmidt T, Winger PD. Hauling Snow Crab Traps in Eastern Canada: A Study Documenting Tension in Ropes. Fishes. 2024; 9(5):154. https://doi.org/10.3390/fishes9050154
Chicago/Turabian StylePeck, Genevieve, Tomas Araya-Schmidt, and Paul D. Winger. 2024. "Hauling Snow Crab Traps in Eastern Canada: A Study Documenting Tension in Ropes" Fishes 9, no. 5: 154. https://doi.org/10.3390/fishes9050154