Comparative Study of the Reactivity of the Tungsten Oxides WO2 and WO3 with Beryllium at Temperatures up to 1273 K


Abstract
1. Introduction
2. Experimental
3. Data Analysis
- Heating the sample to the desired temperature;
- Recording high resolution spectra of the Be 1s, O 1s, and W 4f and valence band spectra;
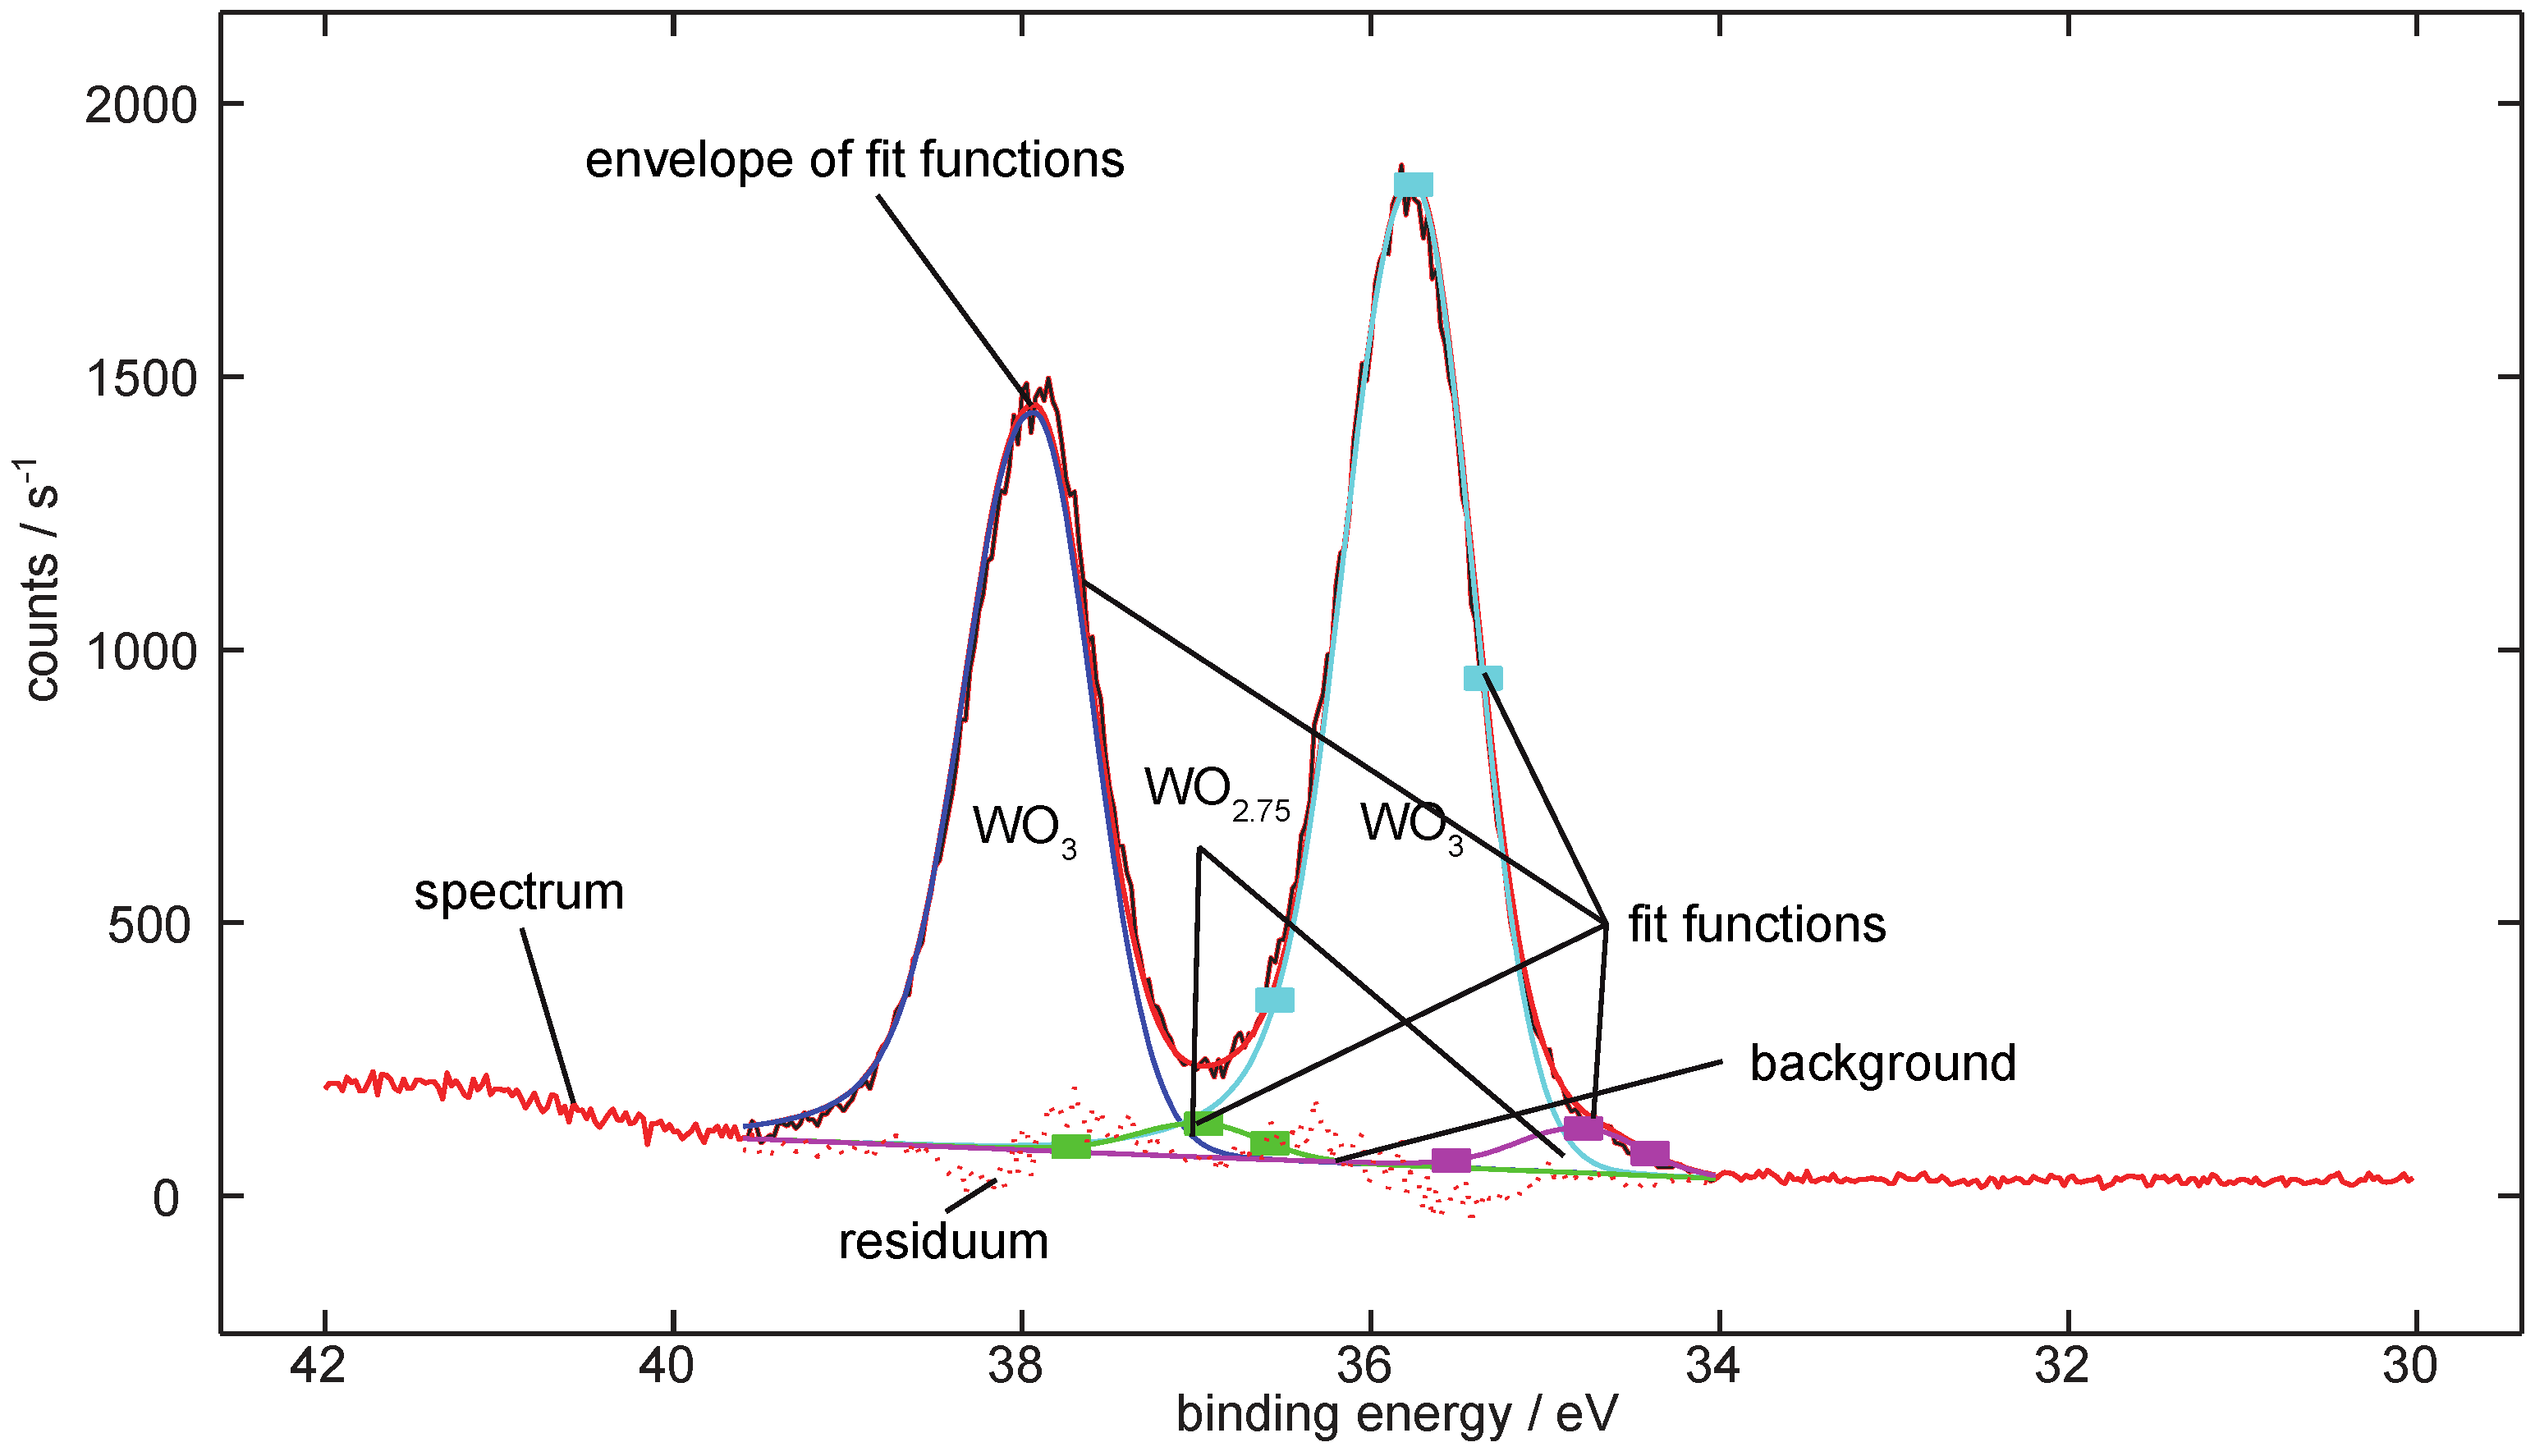
- Spectral deconvolution of the spectra to identify and quantify elements and compounds;
- Compare the results to the previous temperature step and set up the main chemical equation;
- Identify possible chemical reactions;
- Solve the linear equation system to obtain the prefactors for the single reaction equations.
4. Results
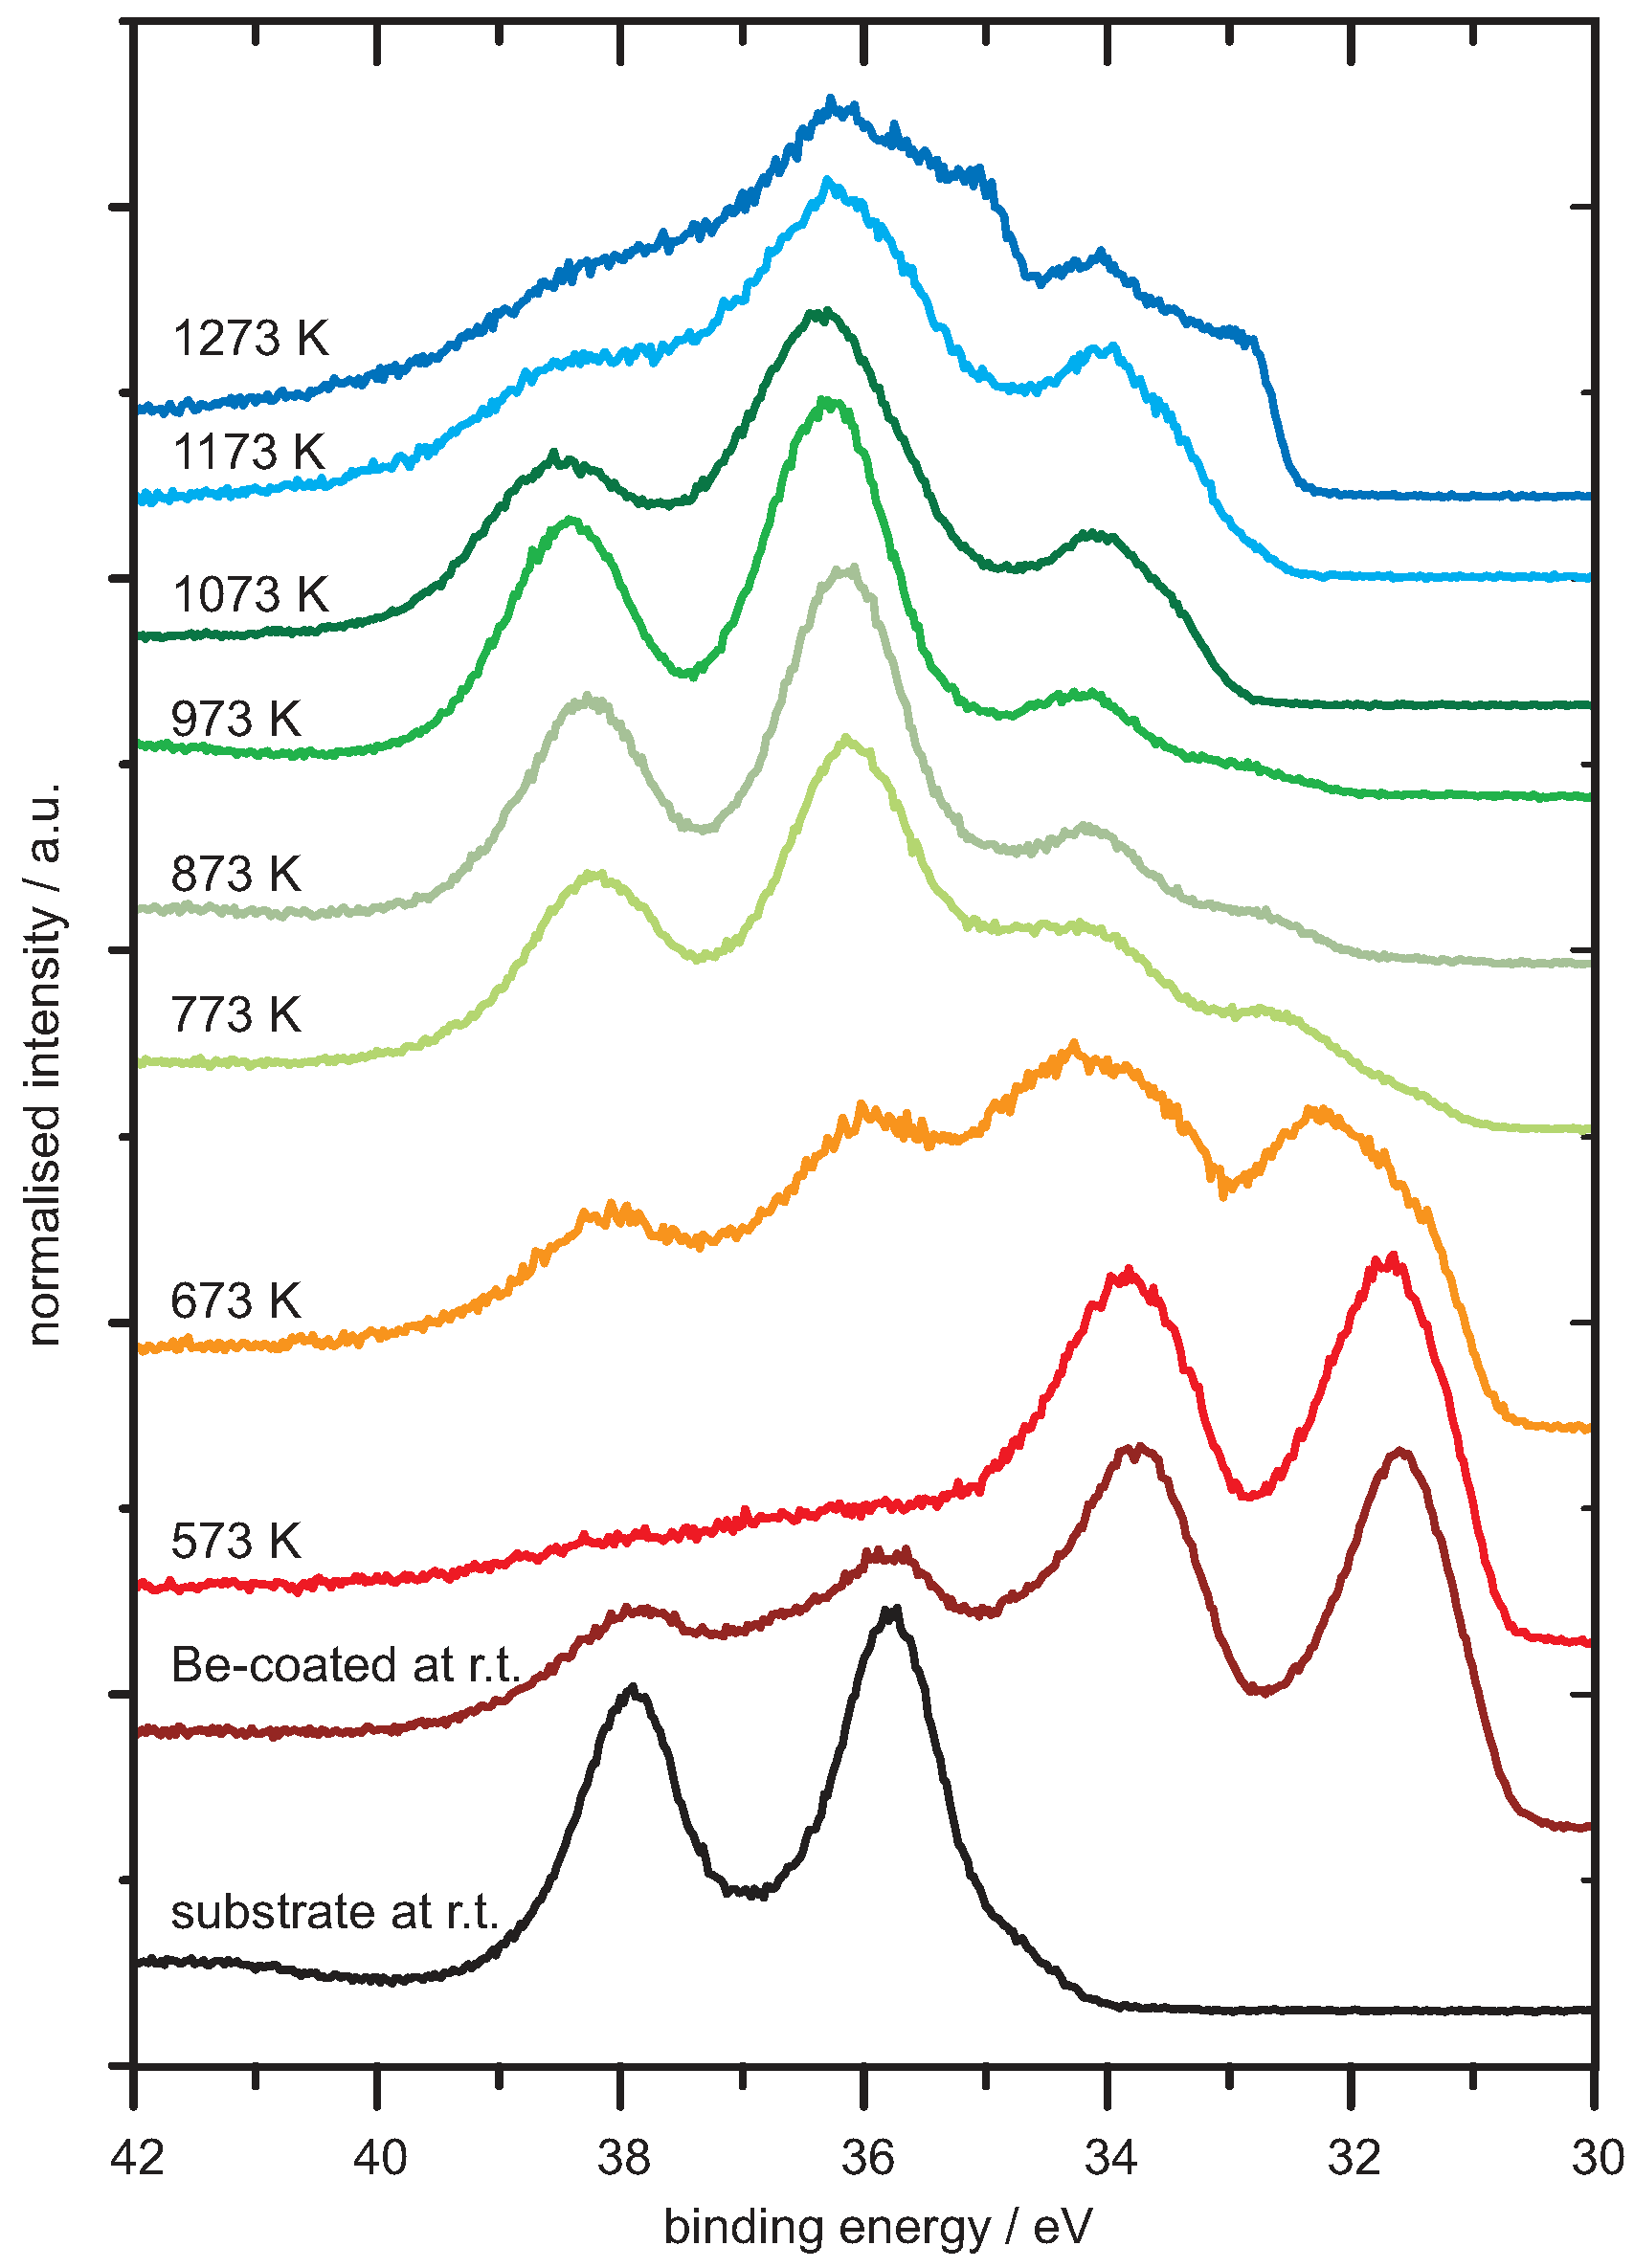
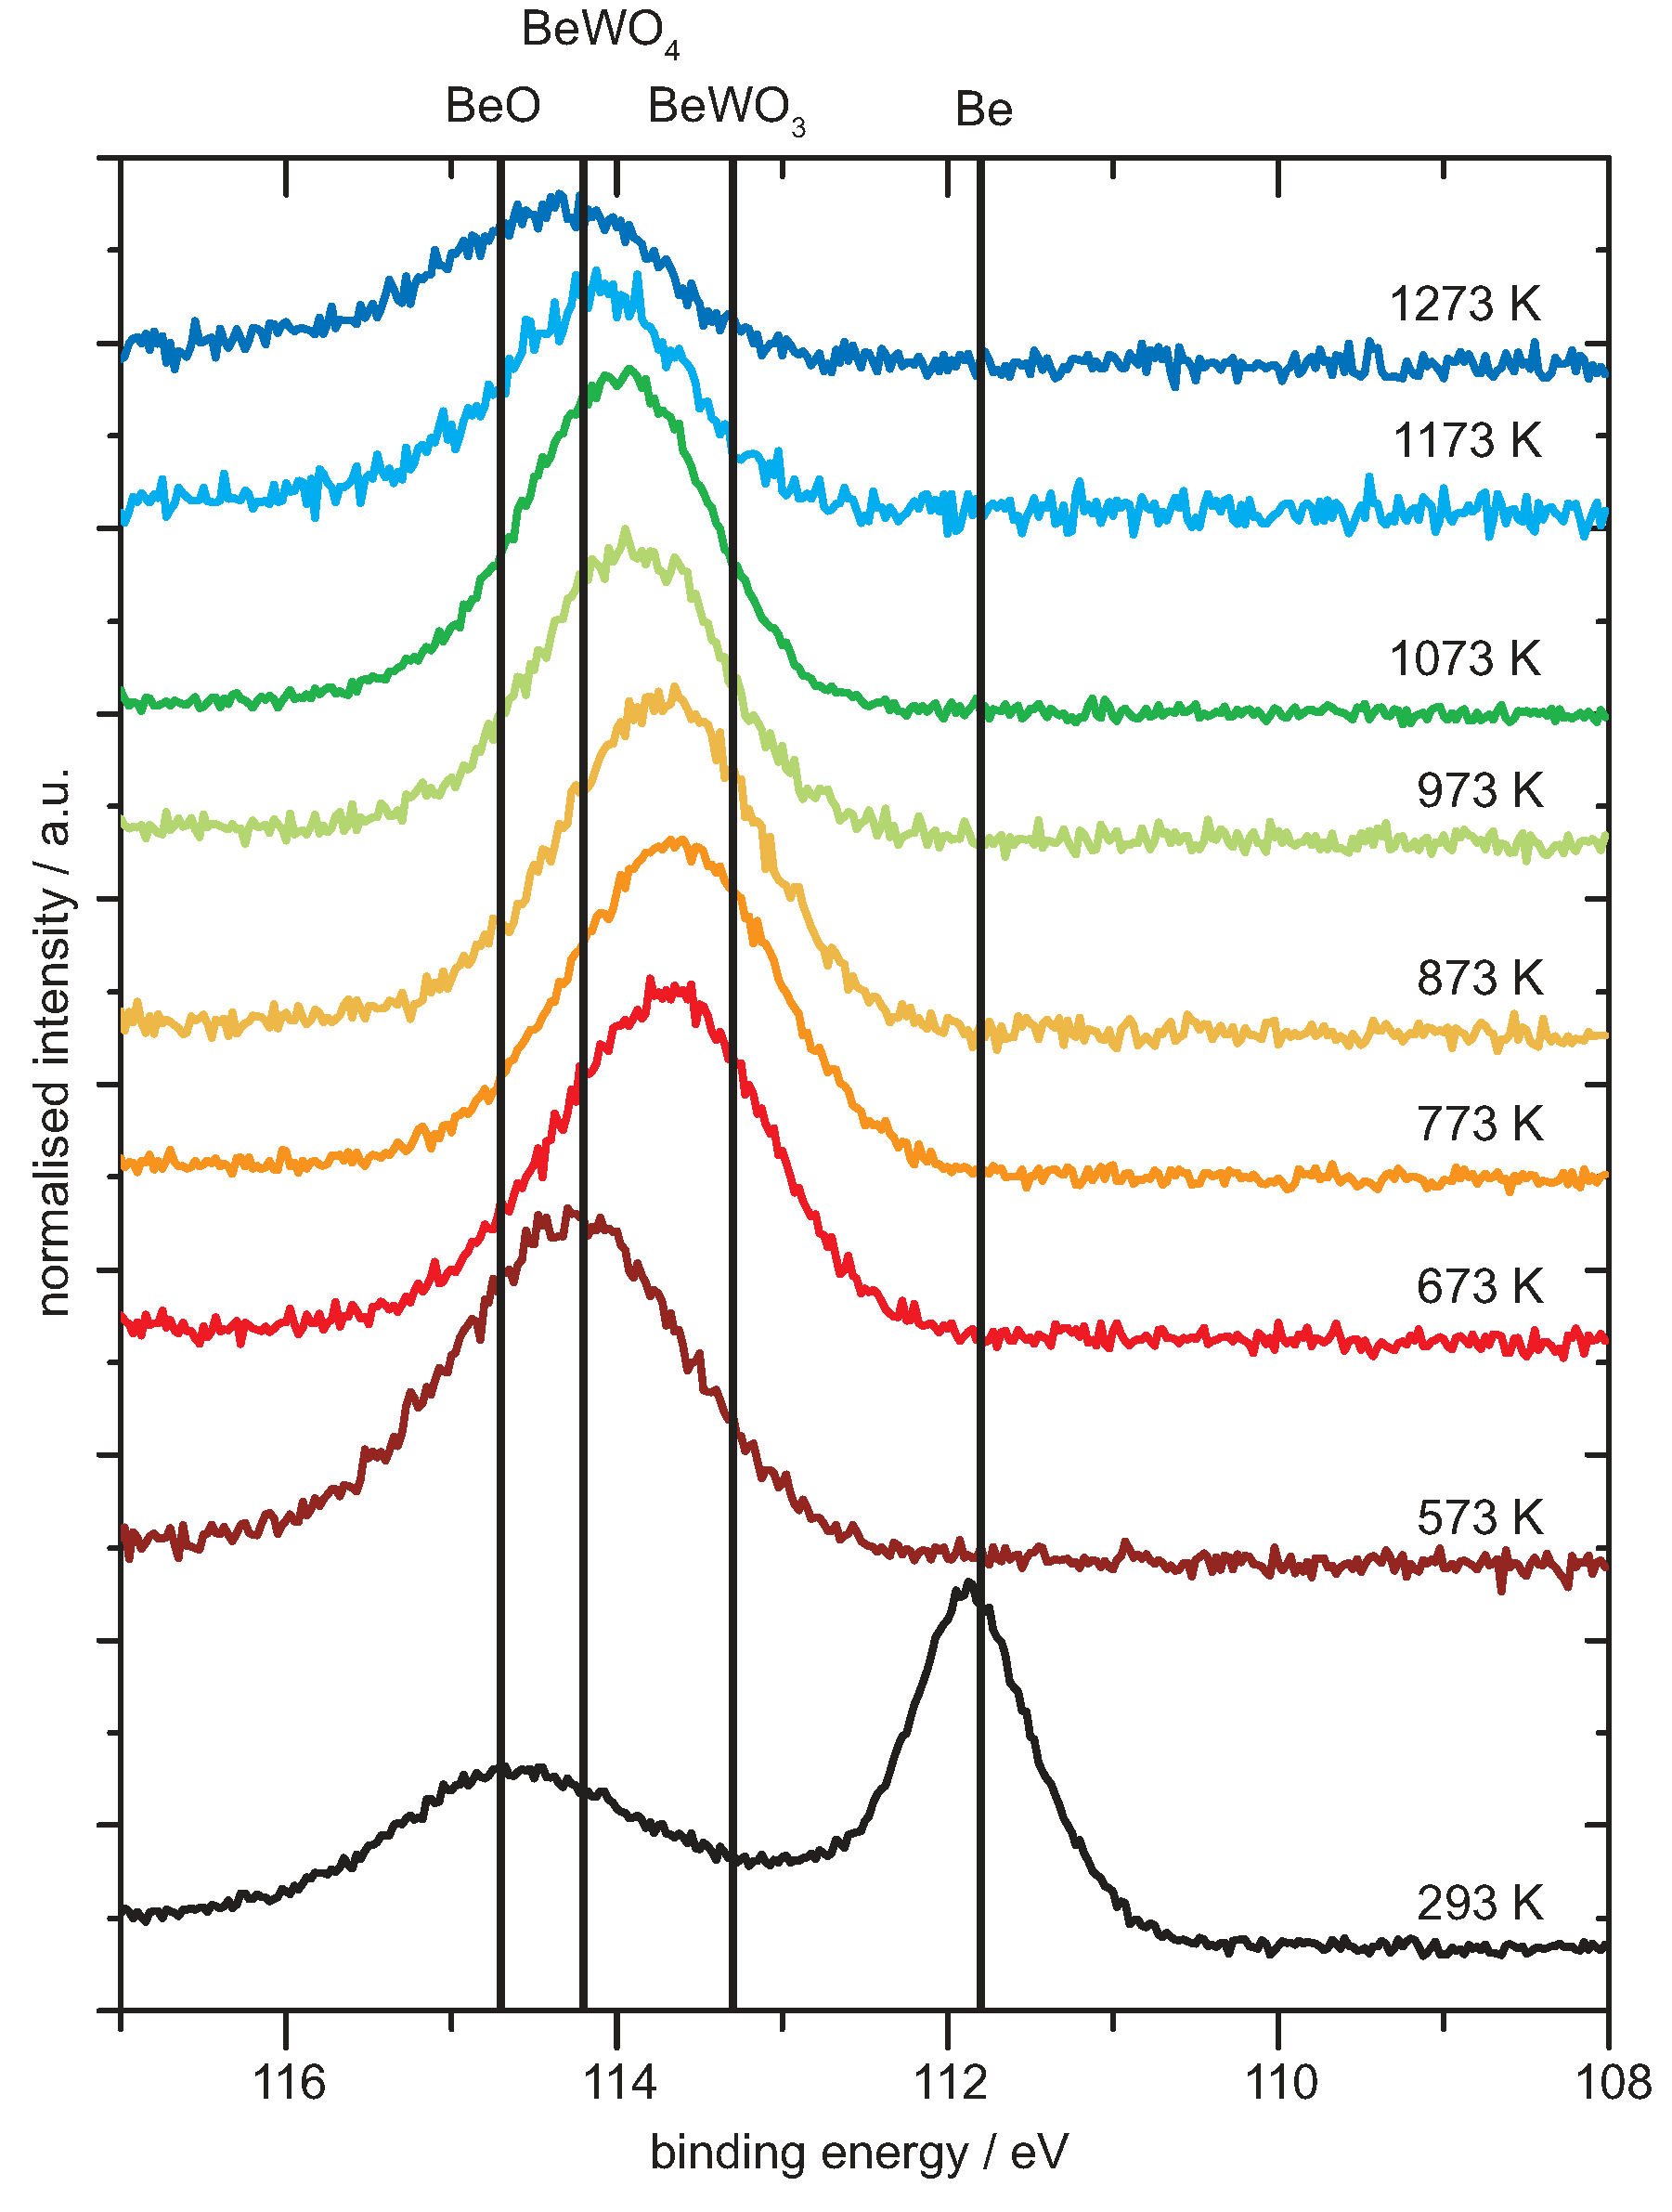
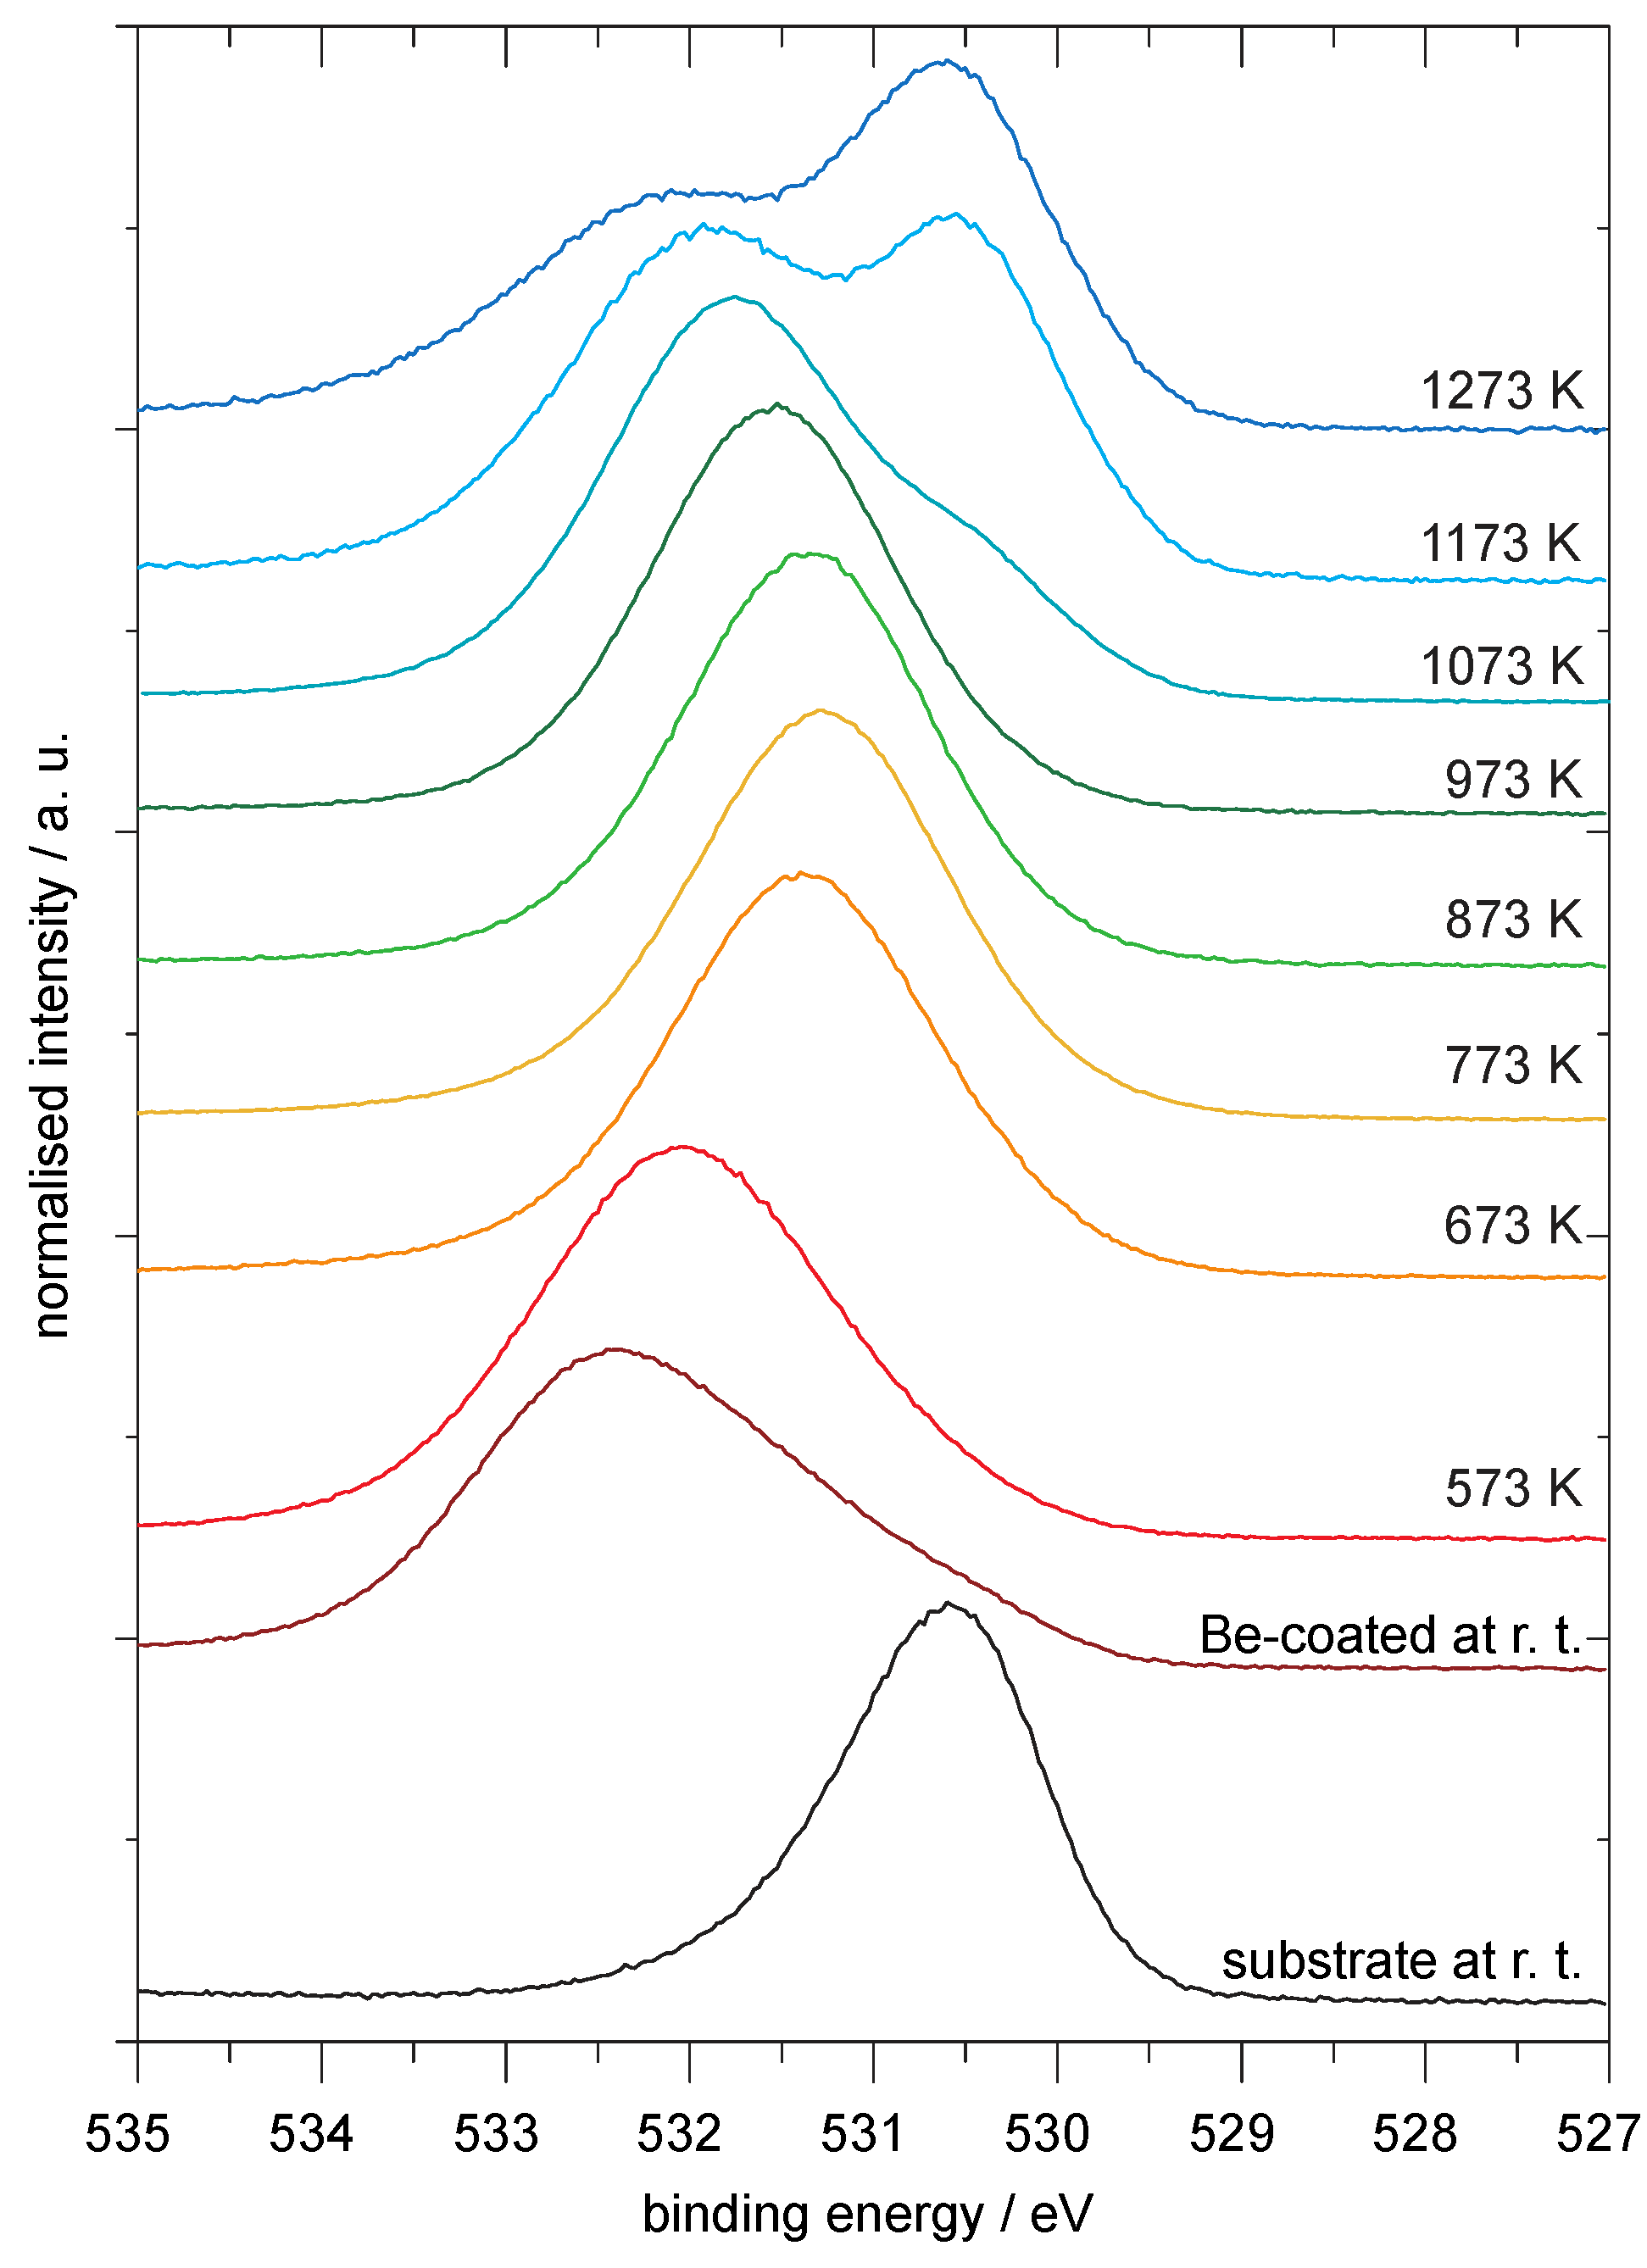
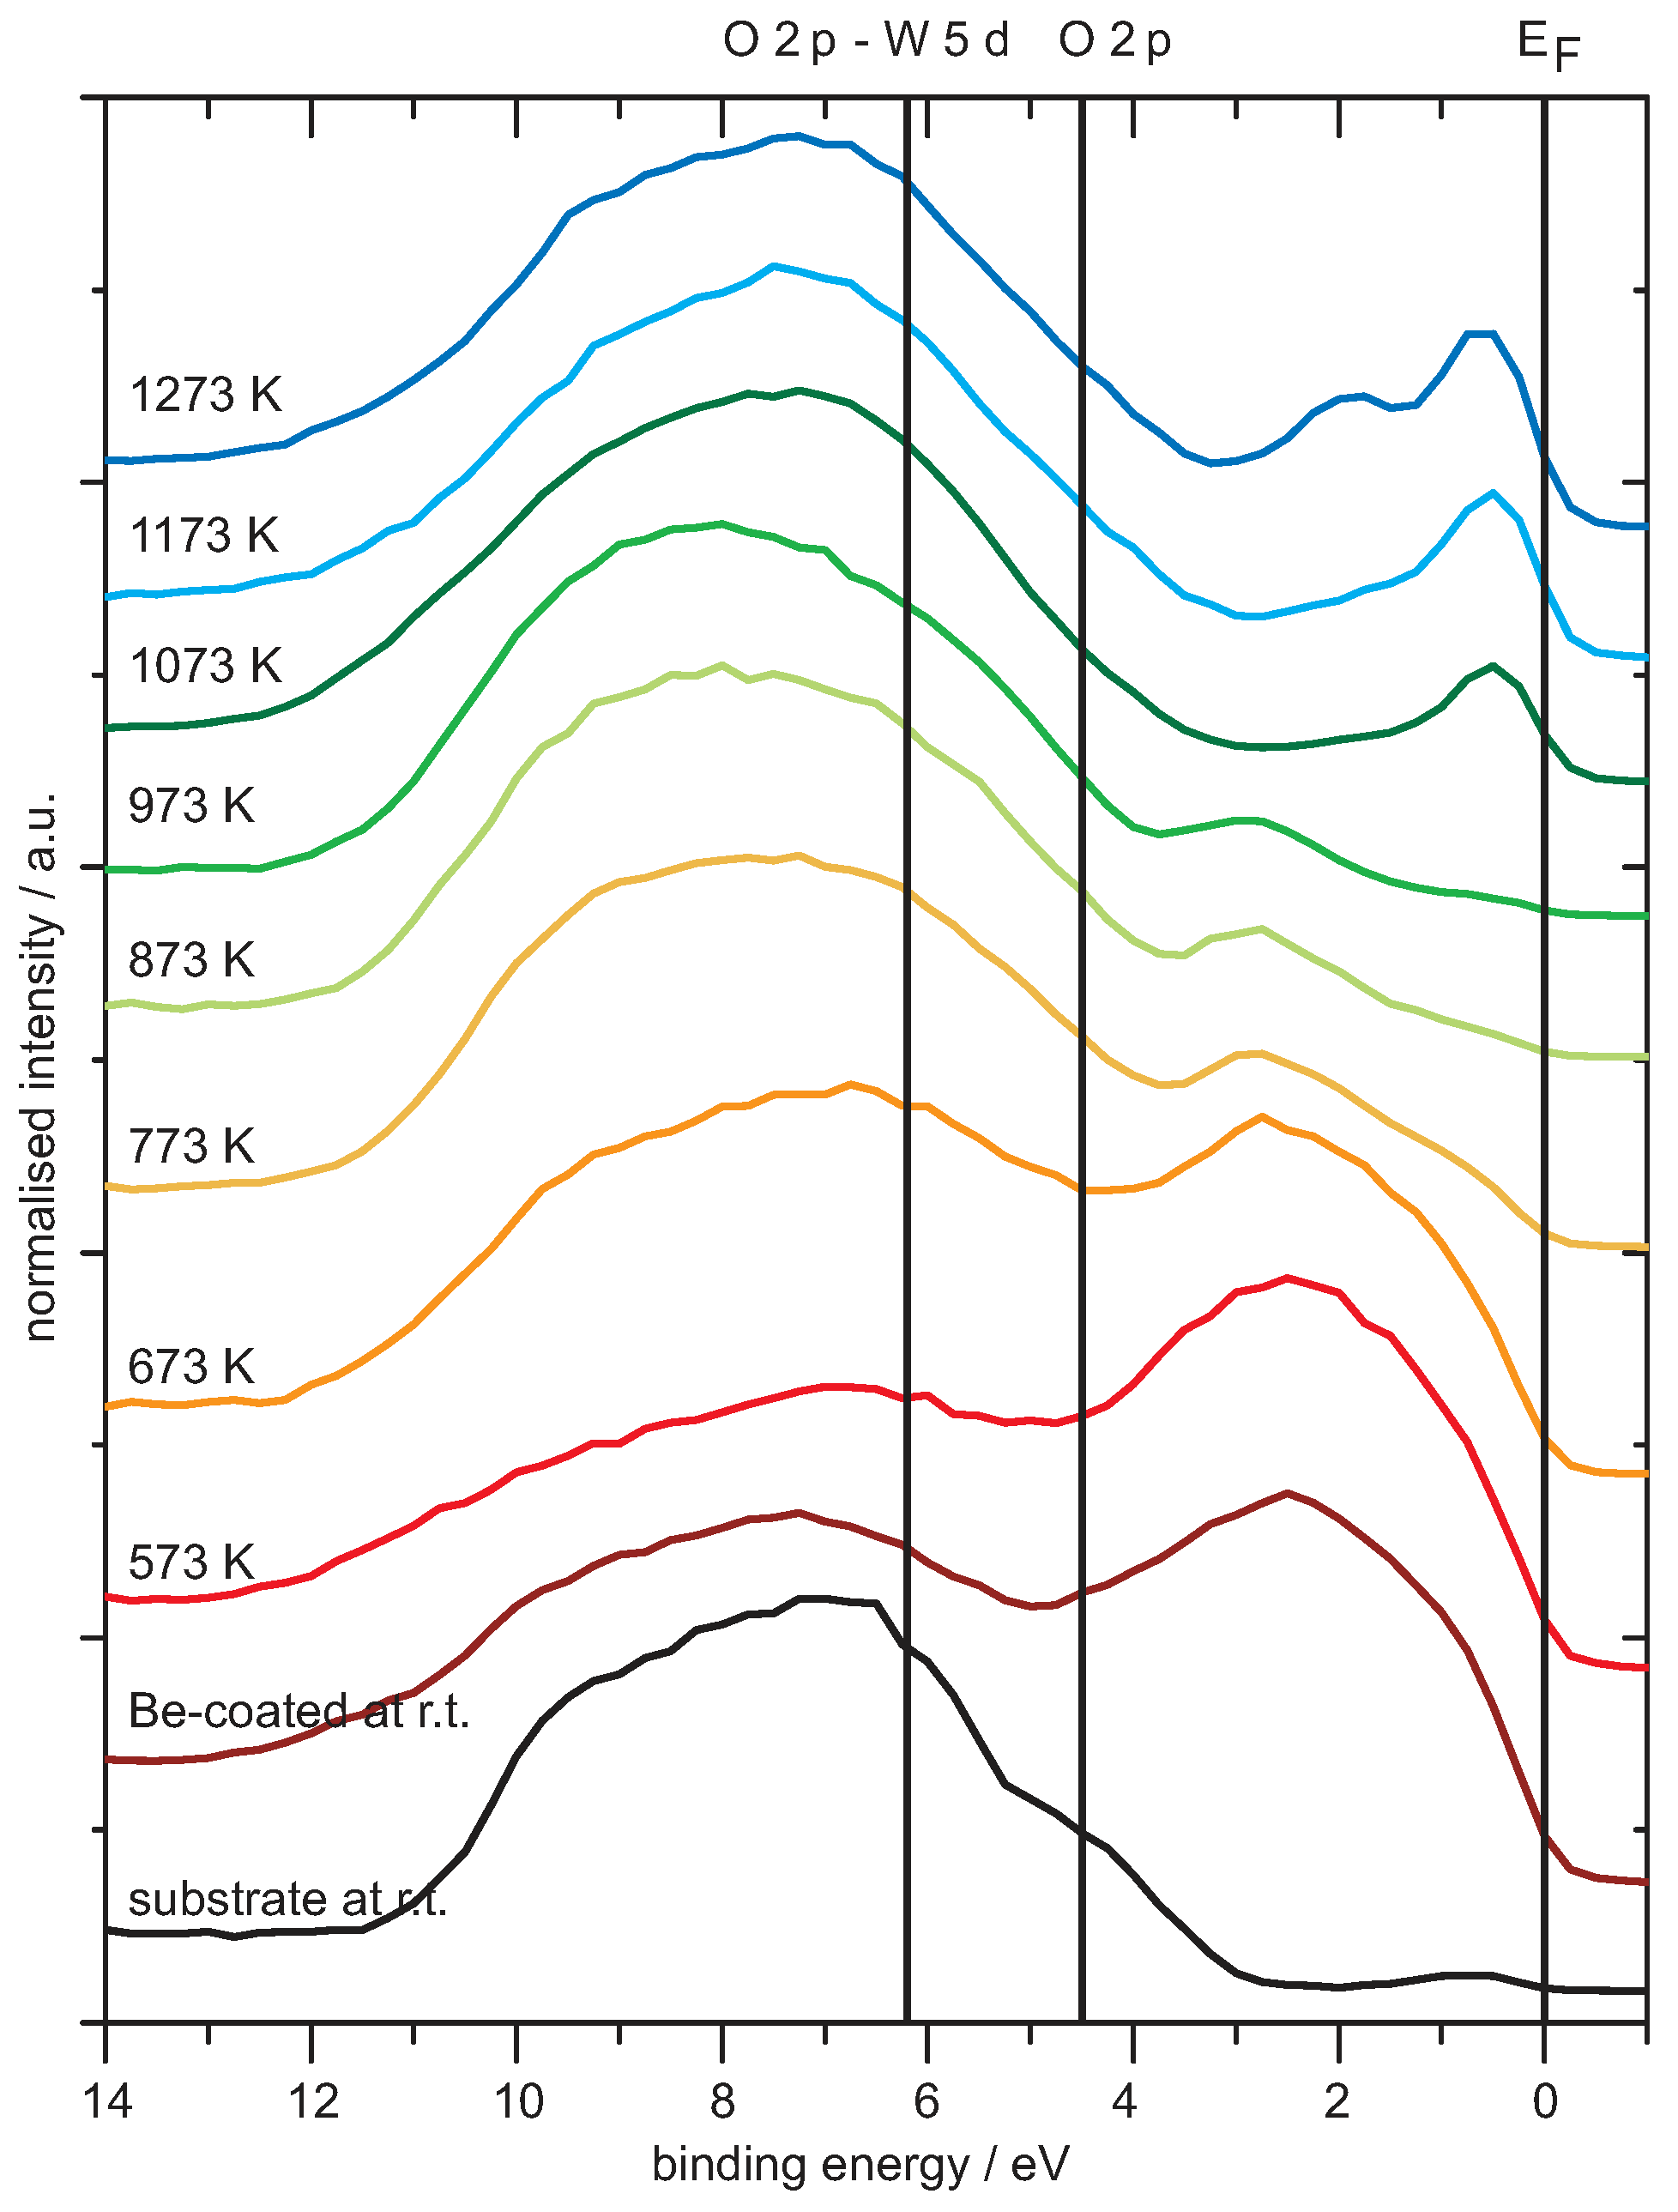
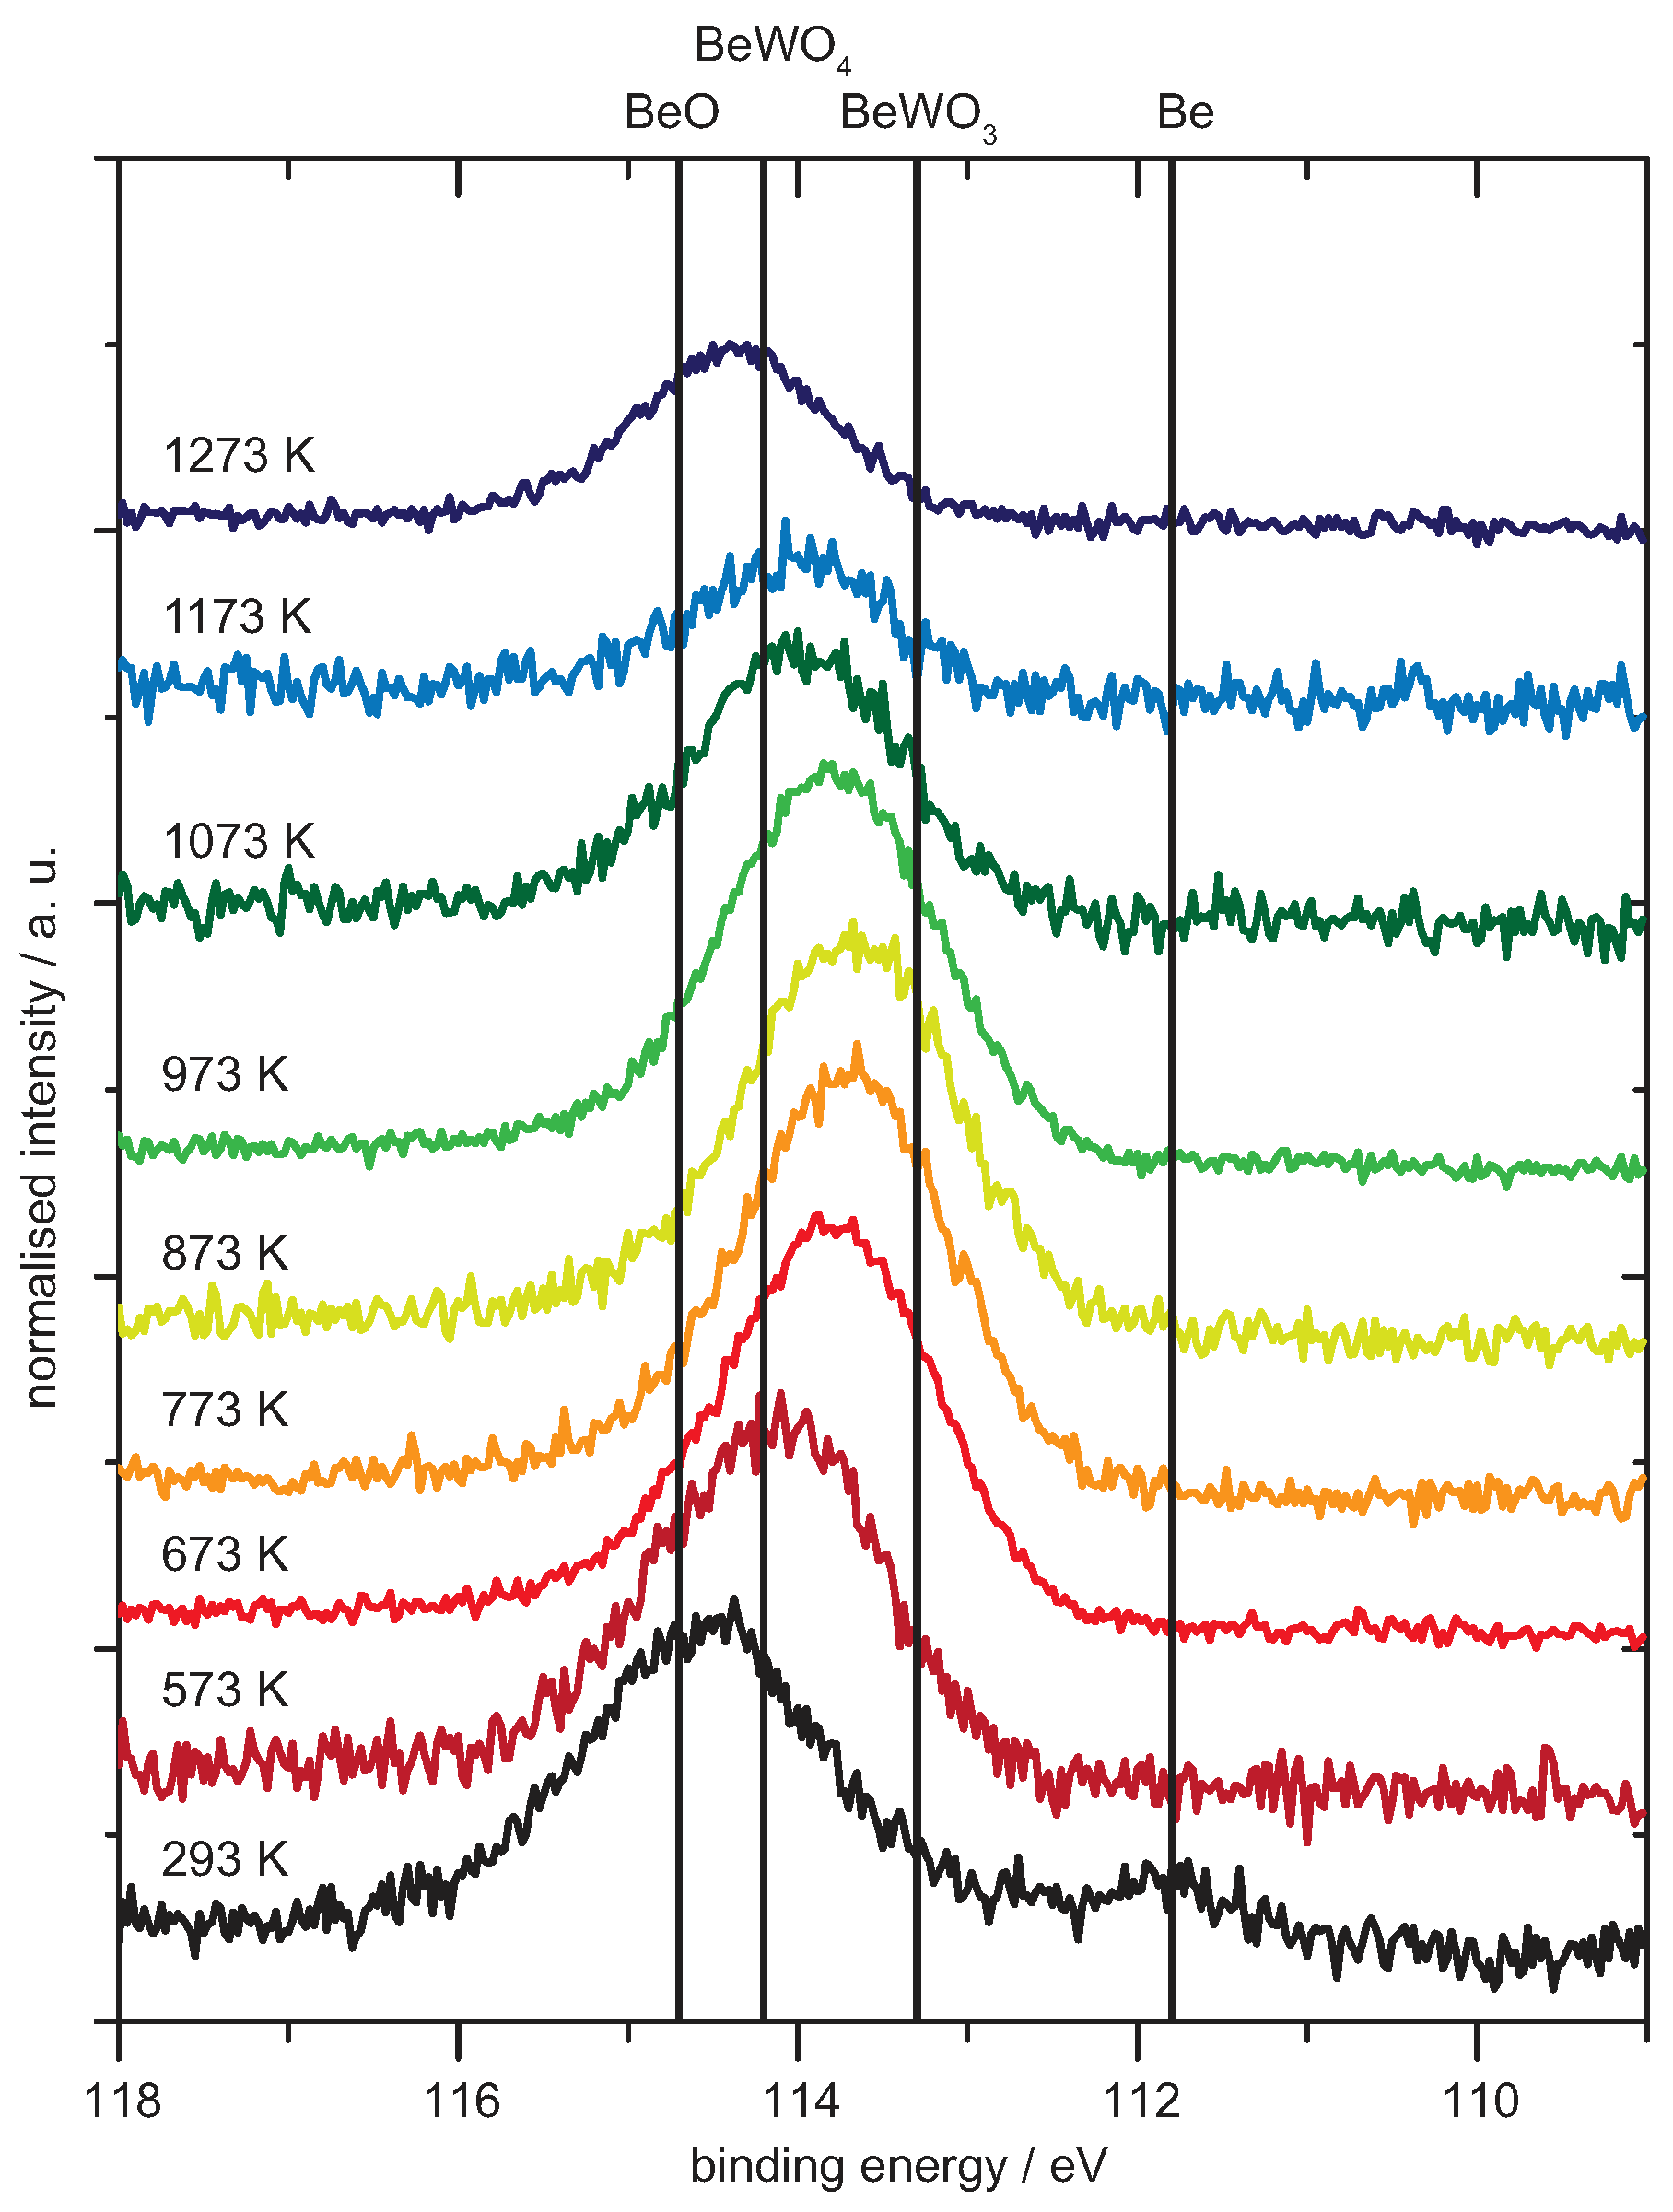
4.1. Be on WO3
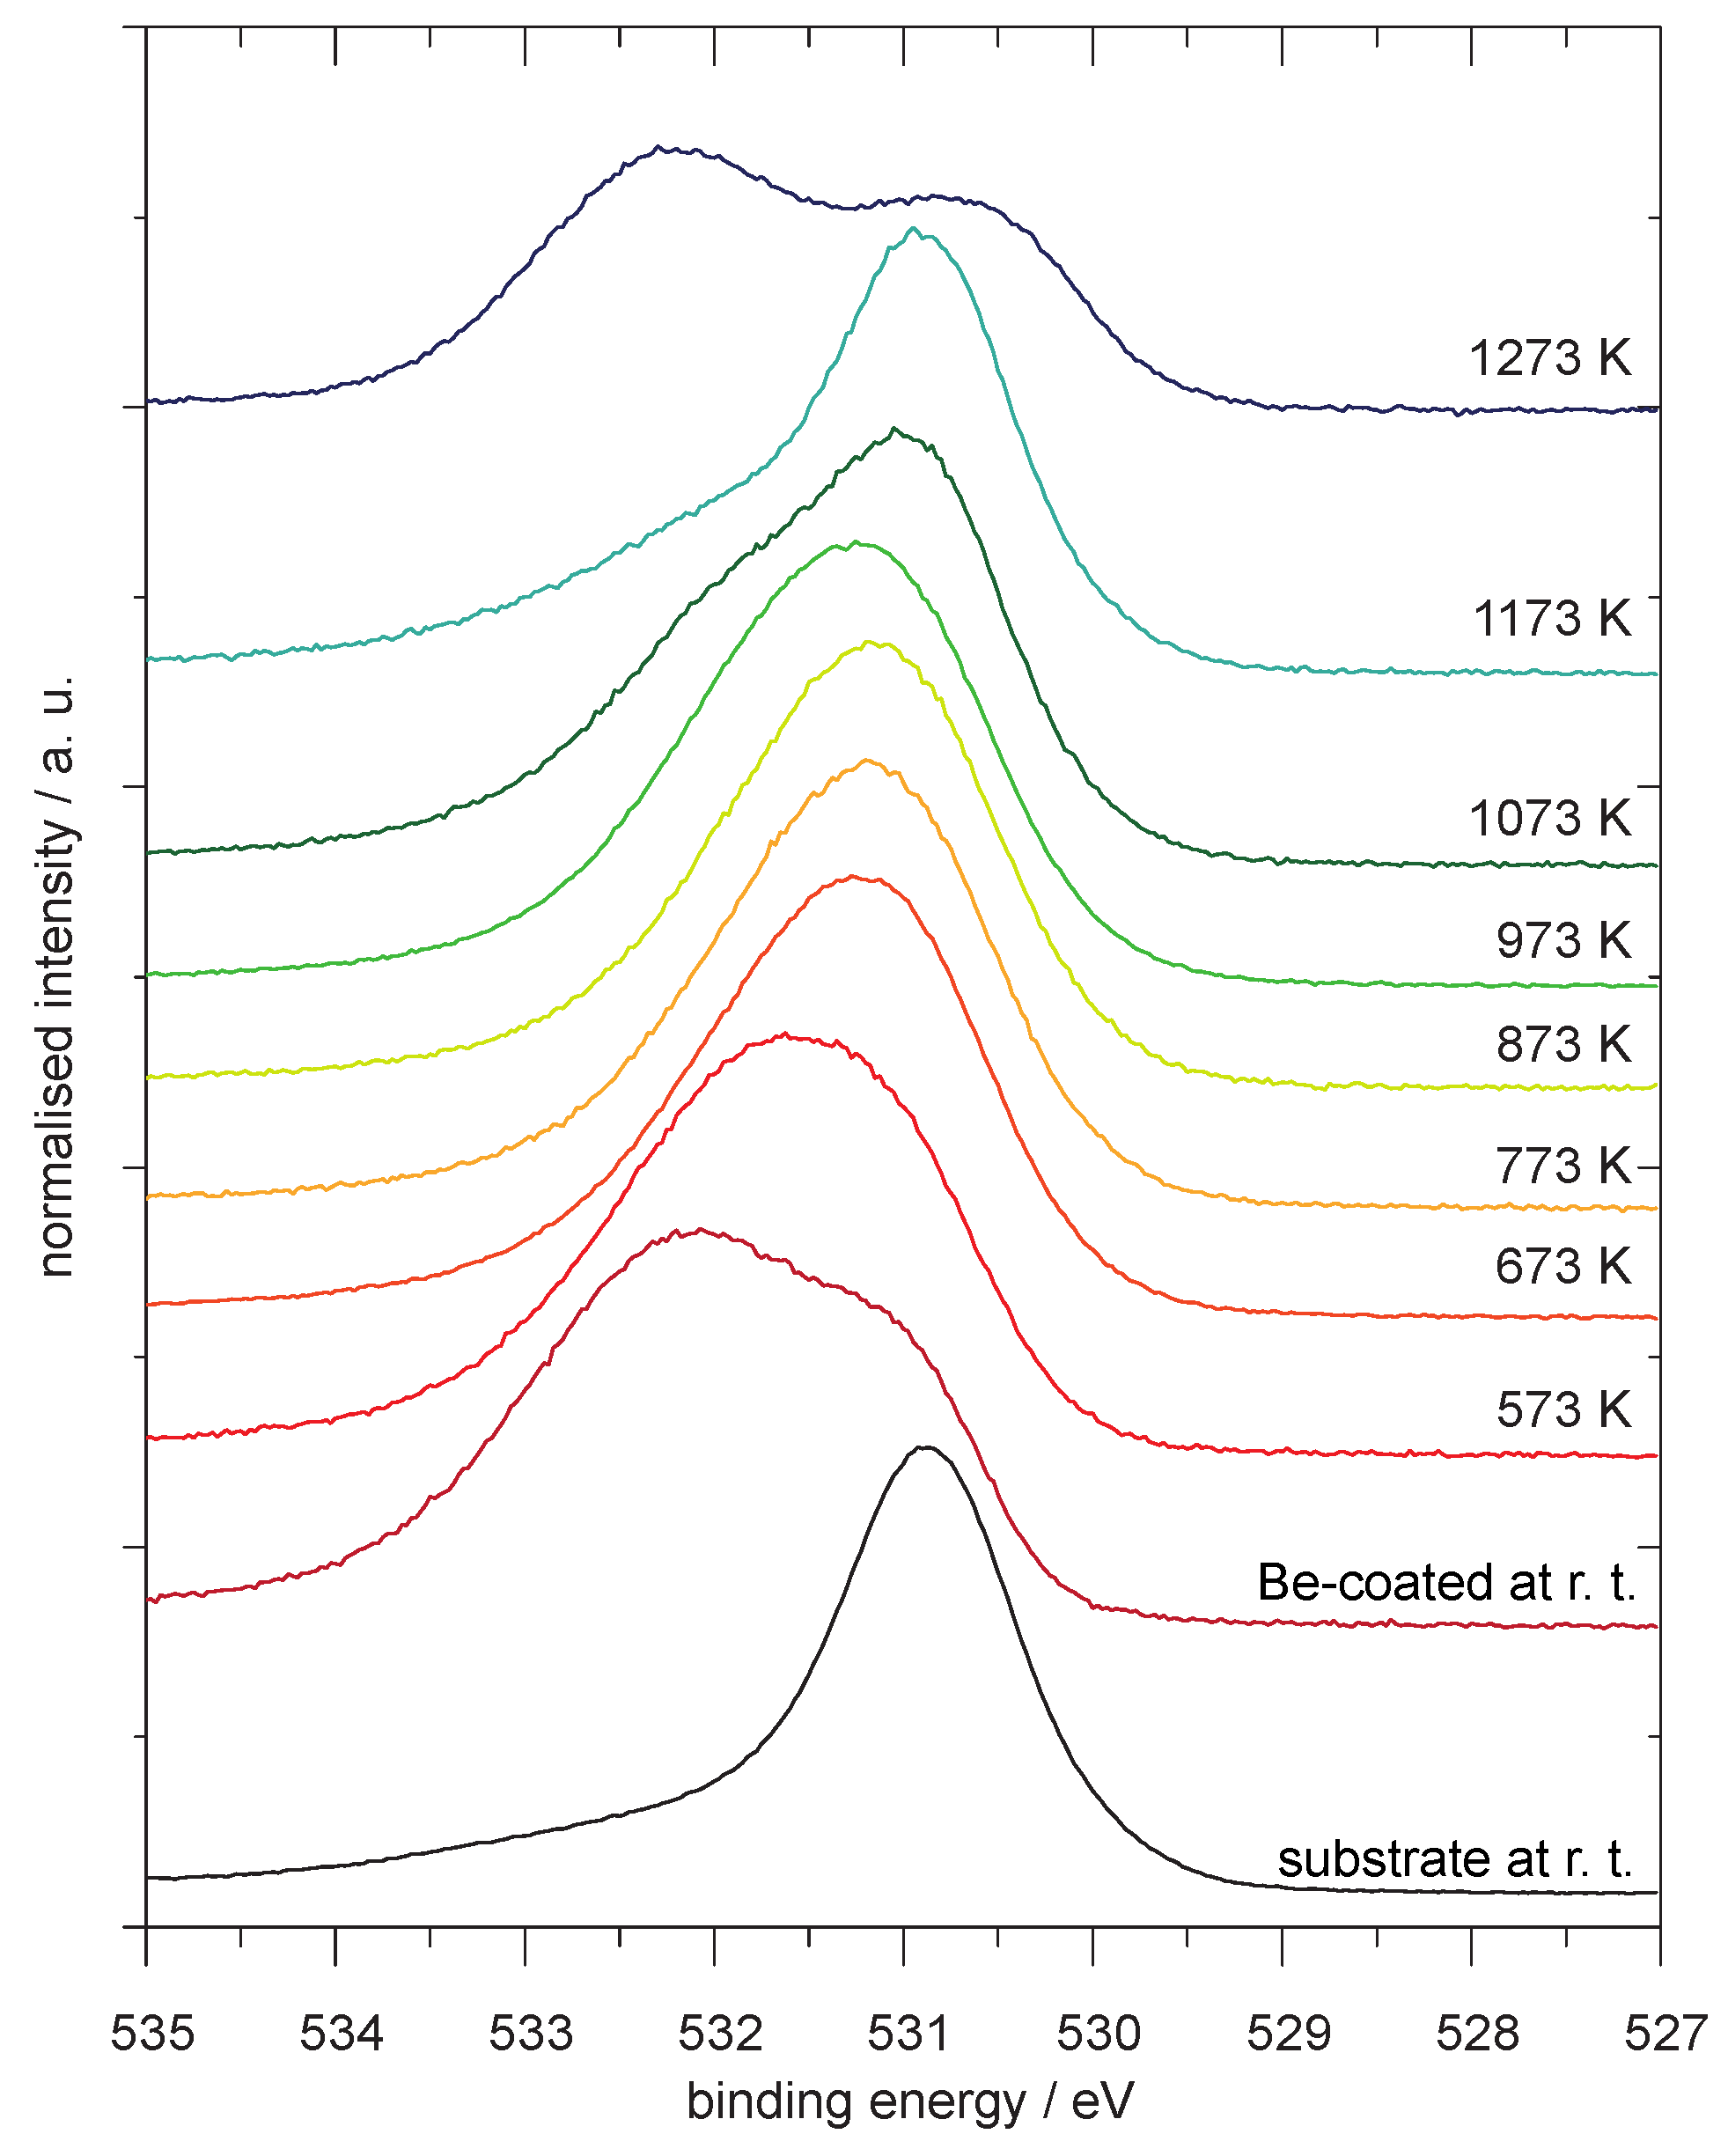
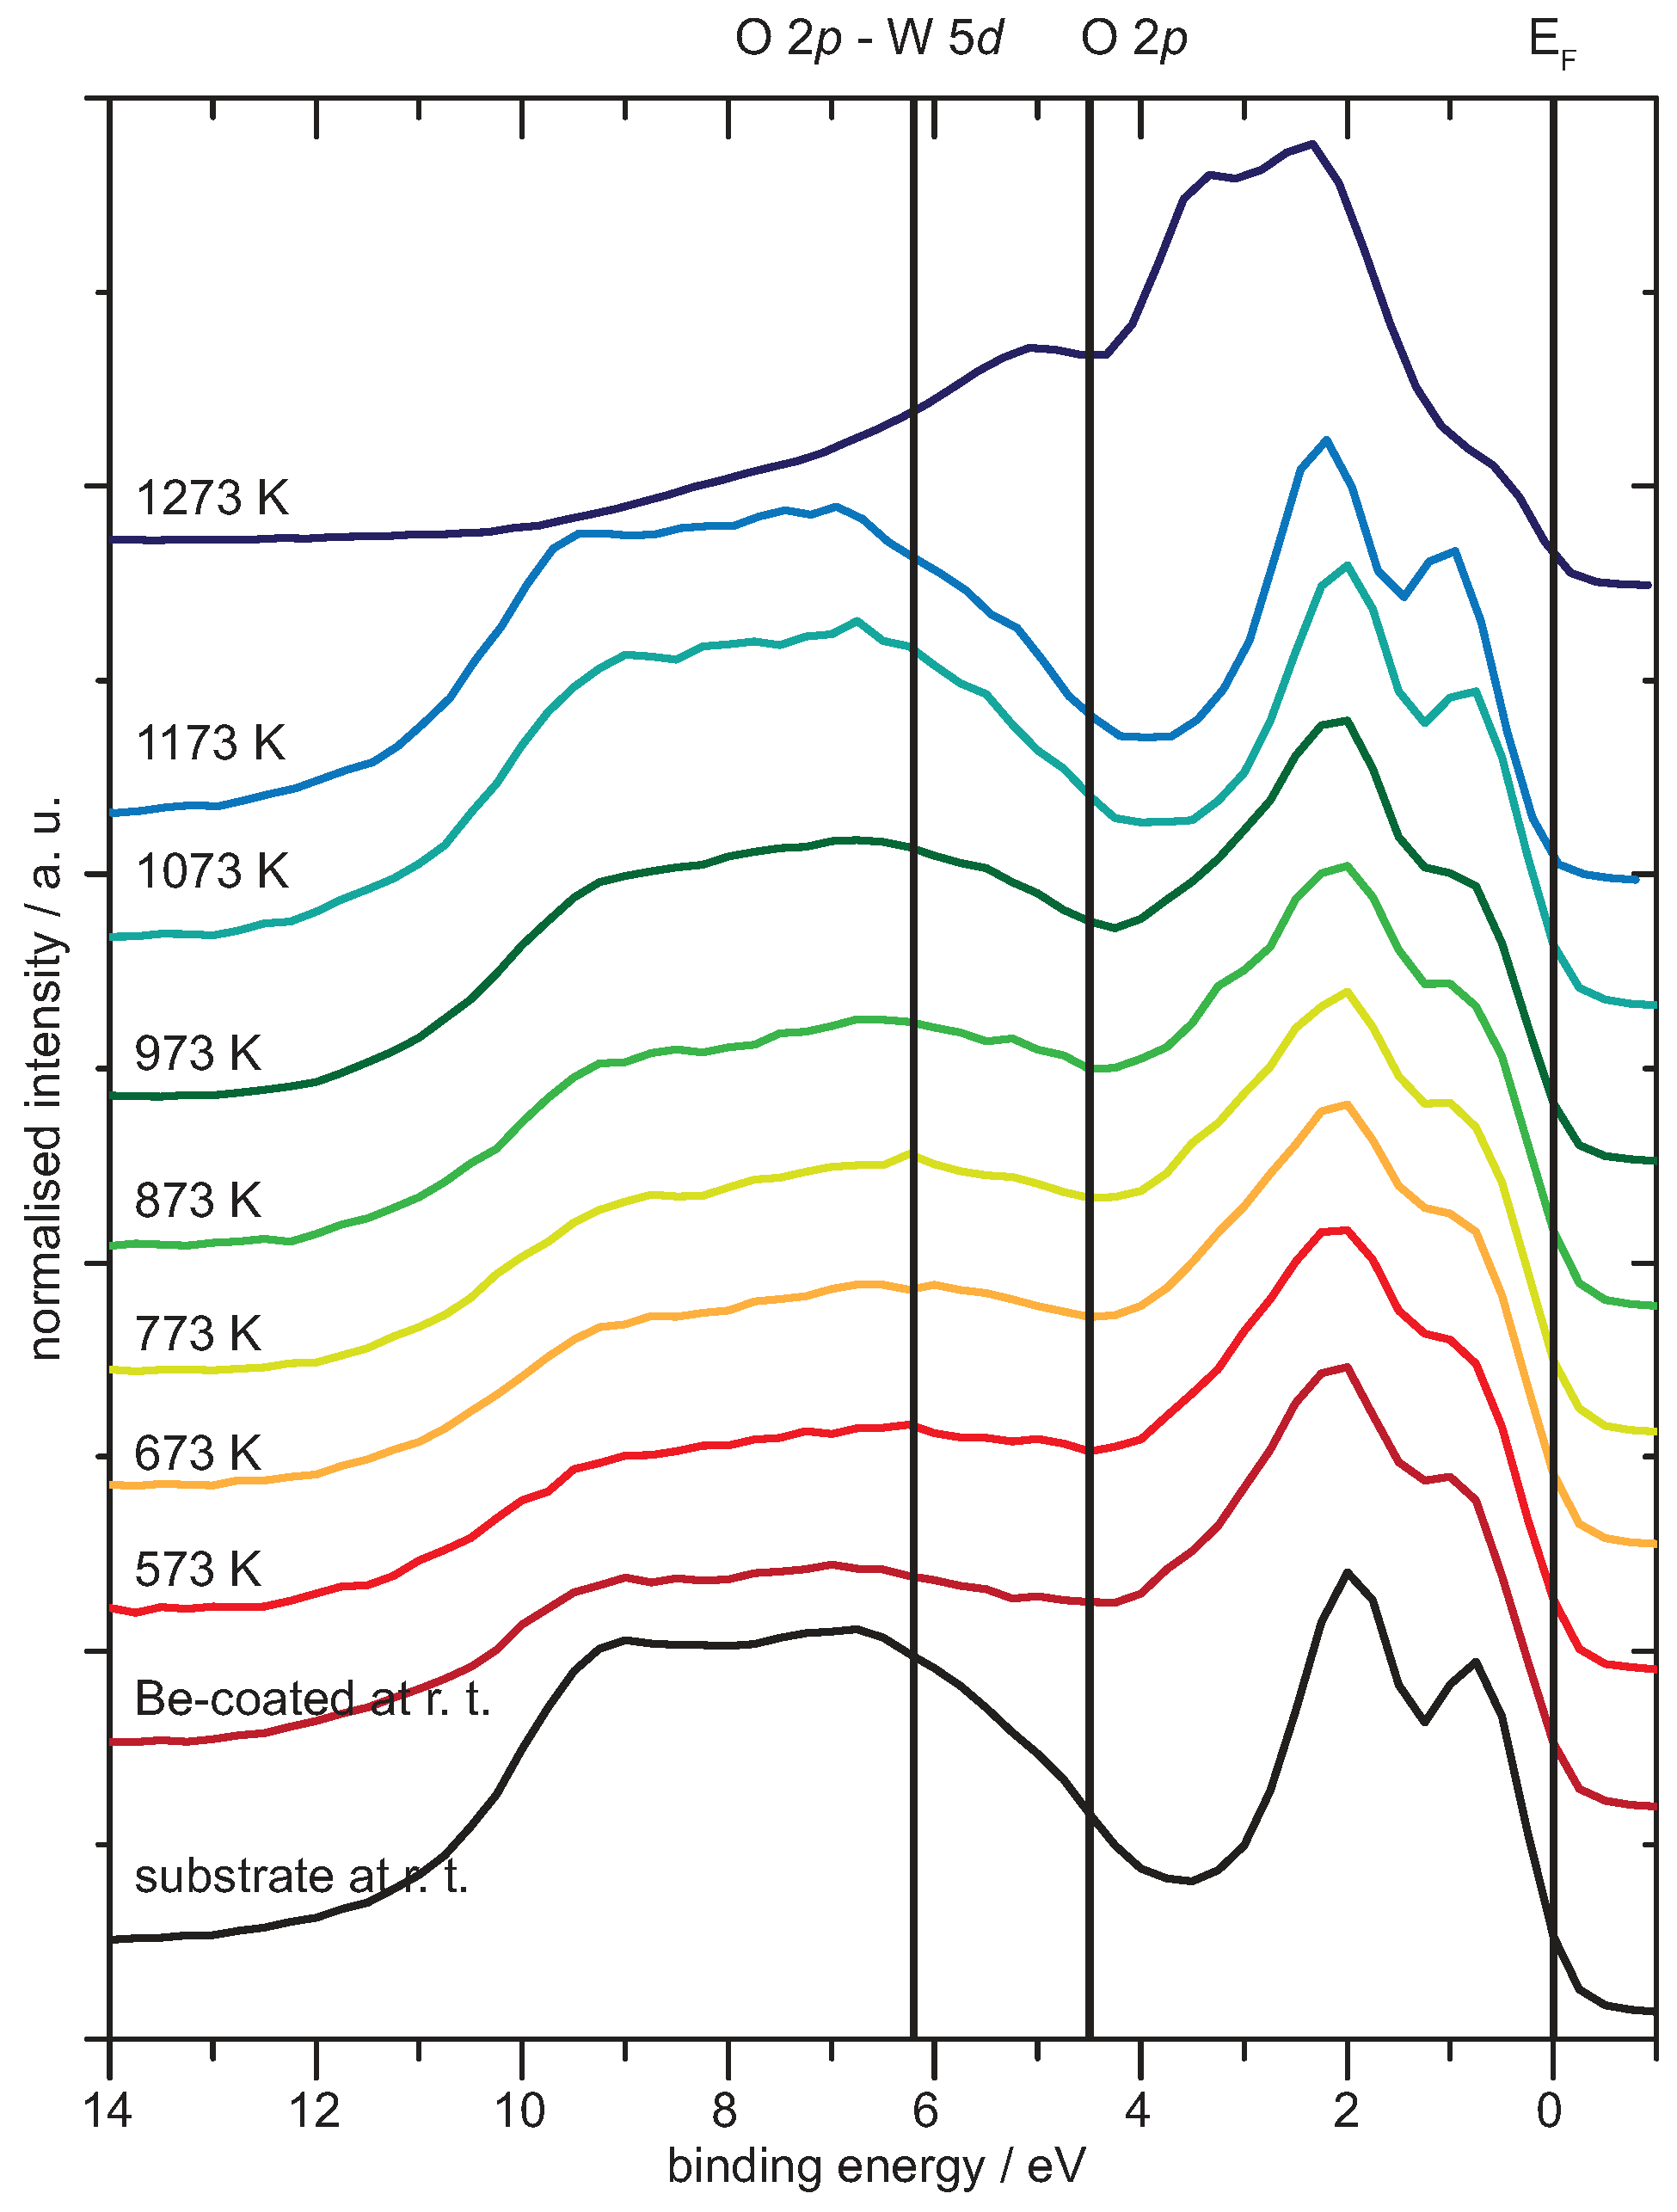
Analysis of the Spectra
4.2. Be on WO2
Analysis of the Spectra
5. Discussion
5.1. The System Beryllium-Oxygen-Tungsten
5.2. The Model
Funding
Acknowledgments
Conflicts of Interest
Abbreviations
| r. t. | room temperature |
| UHV | ultra-high vacuum |
| XPS | x-ray photoelectron spectroscopy |
| XRD | x-ray diffraction |
References
- Patel, K.J.; Desai, M.S.; Panchal, C.J.; Deota, H.N.; Trivedi, U.B. All-Solid-Thin Film Electrochromic Devices Consisting of Layers ITO/NiO/ZrO2/WO3/ITO. J. Nano-Electron. Phys. 2013, 5, 02023. [Google Scholar]
- Granqvist, C.G. Electrochromic tungsten oxide films: Review of progress 1993–1998. Sol. Energ. Mater. Sol. Cells 2000, 60, 201. [Google Scholar] [CrossRef]
- Lee, W.; Fang, Y.; Ho, J.J.; Hsieh, W.; Ting, S.; Huang, D.; Ho, F.C. Effects of surface porosity on tungsten trioxide(WO3) films’ electrochromic performance. J. Electron. Mater. 2000, 29, 183–187. [Google Scholar] [CrossRef]
- Habazaki, H.; Hayashi, Y.; Konno, H. Characterization of electrodeposited WO3 films and its application to electrochemical wastewater treatment. Elektrochim. Acta 2002, 47, 4181. [Google Scholar] [CrossRef]
- Williams, D.E.; Aliwell, S.R.; Pratt, K.F.E.; Caruana, D.J.; Jones, R.L.; Cox, R.A.; Hansford, G.M.; Halsall, J. Modelling the response of a tungsten oxide semiconductor as a gas sensor for the measurement of ozone. Meas. Sci. Technol. 2002, 13, 923–931. [Google Scholar] [CrossRef]
- Cantalini, C.; Sun, H.T.; Faccio, M.; Pelino, M.; Santucci, S.; Lozzi, L.; Passacantando, M. NO2 sensitivity of WO3 thin film obtained by high vacuum thermal evaporation. Sens. Actuators B 1996, 31, 81. [Google Scholar] [CrossRef]
- Berak, J.M.; Sienko, M.J. Effect of oxygen-deficiency on electrical transport properties of tungsten trioxide crystals. J. Solid State Chem. 1970, 2, 109–133. [Google Scholar] [CrossRef]
- Wiltner, A. Untersuchungen zur Diffusion und Reaktion von Kohlenstoff auf Nickel- und Eisenoberflächen sowie von Beryllium auf Wolfram. Ph.D. Thesis, Universität Bayreuth, Bayreuth, Germany, 2005. [Google Scholar]
- Miller, S.; Berning, G.L.P.; Plank, H.; Roth, J. X-ray photoelectron spectroscopy study of TiC films grown by annealing thin Ti films on graphite. J. Vac. Sci. Technol. A 1997, 15, 2029–2034. [Google Scholar] [CrossRef]
- Miller, S. Untersuchung der chemischen Wechselwirkung von Titan und Kohlenstoff mittels Röntgen- Photoelektronen-Spektroskopie. Ph.D. Thesis, Universität Bayreuth, Bayreuth, Germany, 1997. [Google Scholar]
- Briggs, D.; Grant, J.T. Surface Analysis by Auger and X-Ray Photoelectron Spectroscopy; IM Publications and Chichester and SurfaceSpectra Limited: Manchester, UK, 2003. [Google Scholar]
- Briggs, D.; Seah, M.P. Practical Surface Analysis—Volume 1: Auger and X-Ray Photoelectron Spectroscopy; John Wiley & Sons: Chichester, UK, 1990. [Google Scholar]
- MultiPak Software Release Notes, version 6.1A; Physical Electronics, Inc.: EdenPrairie, MN, USA, 1999.
- Doniach, S.; Šunjić, M. Many-electron singularity in X-ray photoemission and X-ray line spectra from metals. J. Phys. C Solid State 1970, 3, 285–291. [Google Scholar] [CrossRef]
- Shirley, D.A. High-Resolution X-Ray Photoemission Spectrum of the Valence Bands of Gold. Phys. Rev. B 1972, 5, 4709–4714. [Google Scholar] [CrossRef]
- Mundy, J.N.; Rothman, S.J.; Lam, N.Q.; Hoff, H.A.; Nowicki, L.J. Self-diffusion in tungsten. Phys. Rev. B 1978, 18, 6566–6575. [Google Scholar] [CrossRef]
- Bussolotti, F.; Lozzi, L.; Passacantando, M.; La Rosa, S.; Santucci, S.; Ottaviano, L. Surface electronic properties of polycrystalline WO3 thin films: A study by core level and valence band photoemission. Surf. Sci. 2003, 538, 113–123. [Google Scholar] [CrossRef]
- Khyzhun, O. XPS, XES and XAS studies of the electronic structure of tungsten oxides. J. Alloys Compd. 2000, 305, 1–6. [Google Scholar] [CrossRef]
- Jeong, J.I.; Hong, J.H.; Moon, J.H.; Kang, J.S.; Fukuda, Y. X-ray photoemission studies of W 4f core levels of electrochromic HxWO3 films. J. Appl. Phys. 1996, 79, 9343–9348. [Google Scholar] [CrossRef]
- Katrib, A.; Hemming, F.; Wehrer, P.; Hilaire, L.; Maire, G. The multi-surface structure and catalytic properties of partially reduced WO3, WO2 and WC + O2 or W + O2 as characterized by XPS. J. Electron Spectrosc. Relat. Phenom. 1995, 76, 195–200. [Google Scholar] [CrossRef]
- Moulder, J.F.; Stickle, W.F.; Bomben, K.D. Handbook of X-Ray Photoelectron Spectroscopy; Perkin-Elmer Corporation: Waltham, MA, USA, 1992. [Google Scholar]
- Fleisch, T.H.; Zajac, G.W.; Schreiner, J.O.; Mains, G.J. An XPS study of the UV photoreduction of transition and noble metal oxides. Appl. Surf. Sci. 1986, 26, 488–497. [Google Scholar] [CrossRef]
- Salvati, L.; Makovsky, L.E.; Stencel, J.M.; Brown, F.R.; Hercules, D.M. Surface spectroscopic study of tungsten-alumina catalysts using x-ray photoelectron, ion scattering, and Raman spectroscopies. J. Phys. Chem. 1981, 85, 3700–3707. [Google Scholar] [CrossRef]
- Wagner, C.D. X-ray photoelectron spectroscopy with X-ray photons of higher energy. J. Vac. Sci. Technol. 1978, 15, 518–523. [Google Scholar] [CrossRef]
- Nefedov, V.I.; Salyn, Y.V. A comparison of different spectrometers and charge corrections used in X-ray photoelectron spectroscopy. J. Electron Spectrosc. Relat. Phenom. 1977, 10, 121–124. [Google Scholar] [CrossRef]
- Lopatin, S.I.; Semenov, G.A. Thermochemical Study of Gaseous Salts of Oxygen-containing Acids: VIII. Beryllium Molybdate and Tungstates. Russ. J. Gen. Chem. 2001, 71, 1220–1224. [Google Scholar] [CrossRef]
- Chupka, W.; Berkowitz, J.; Giese, C. Vaporization of Beryllium Oxide and Its Reaction with Tungsten. J. Chem. Phys. 1959, 30, 827–834. [Google Scholar] [CrossRef]
- Linsmeier, C.; Ertl, K.; Roth, J.; Wiltner, A.; Schmid, K.; Kost, F.; Bhattacharyya, S.; Baldwin, M.; Doerner, R. Binary beryllium-tungsten mixed materials. J. Nucl. Mater. 2007, 363–365, 1129–1137. [Google Scholar] [CrossRef]
- Wiltner, A.; Kost, F.; Lindig, S.; Linsmeier, C. Structural investigation of the Be-W intermetallic system. Phys. Scr. 2007, T128, 133–136. [Google Scholar] [CrossRef]
- Wiltner, A.; Linsmeier, C. Surface alloying of thin beryllium films on tungsten. New J. Phys. 2006, 8, 1–11. [Google Scholar] [CrossRef]
- Wiltner, A.; Linsmeier, C. Formation of a surface alloy in the beryllium-tungsten system. J. Nucl. Mater. 2005, 337–339, 951–955. [Google Scholar] [CrossRef]
- Goldstraß, P.; Klages, K.U.; Linsmeier, C. Surface reactions on beryllium after carbon vapour deposition and thermal treatment. J. Nucl. Mater. 2001, 290–293, 76–79. [Google Scholar] [CrossRef]
- Linsmeier, C.; Wanner, J. Reactions of oxygen atoms and molecules with Au, Be, and W surfaces. Surf. Sci. 2000, 454–456, 305–309. [Google Scholar] [CrossRef]
- Wu, Y.; Fan, L.; Huang, W.; Chen, S.; Chen, S.; Chen, F.; Zou, C.; Wu, Z. Depressed transition temperature of WxV1-xO2: Mechanistic insights from the X-ray absorption fine structure (XAFS) spectroscopy. Phys. Chem. Chem. Phys. 2014, 16, 17705. [Google Scholar] [CrossRef]
- Stizza, S.; Mancini, G.; Benfatto, M.; Natoli, C.; Garcia, J.; Bianconi, A. Structure of oriented V2O5 gel studied by polarized x-ray-absorption spectroscopy at the vanadium K edge. Phys. Rev. B 1989, 40, 12229. [Google Scholar] [CrossRef]
- Bianconi, A.; Giovannelli, A.; Dovoli, I.; Stizza, S.; Palladino, L.; Gzowski, O.; Murawski, L. Xanes (X-ray absorption near edge structure) of V in vanadium-iron phosphate glasses. Solid State Commun. 1982, 42, 547–551. [Google Scholar] [CrossRef]
- Bianconi, A. Multiplet splitting of final-state configurations in x-ray-absorption spectrum of metal VO2: Effect of core-hole-screening, electron correlation, and metal-insulator transition. Phys. Rev. B 1982, 26, 274. [Google Scholar] [CrossRef]
- Longa, S.; Soldatov, A.; Pompa, M.; Bianconi, A. Atomic and electronic structure probed by X-ray absorption spectroscopy: Full multiple scattering analysis with the G4XANES package. Comput. Mater. Sci. 1995, 4, 199–210. [Google Scholar] [CrossRef]
- Köppen, M. Untersuchung des ternären Systems Wolfram-Sauerstoff-Beryllium/Investigation of the Ternary System Tungsten-Oxygen-Beryllium (in German). Master’s Thesis, Technical University of Munich, Munich, Germany, 2008. [Google Scholar] [CrossRef]


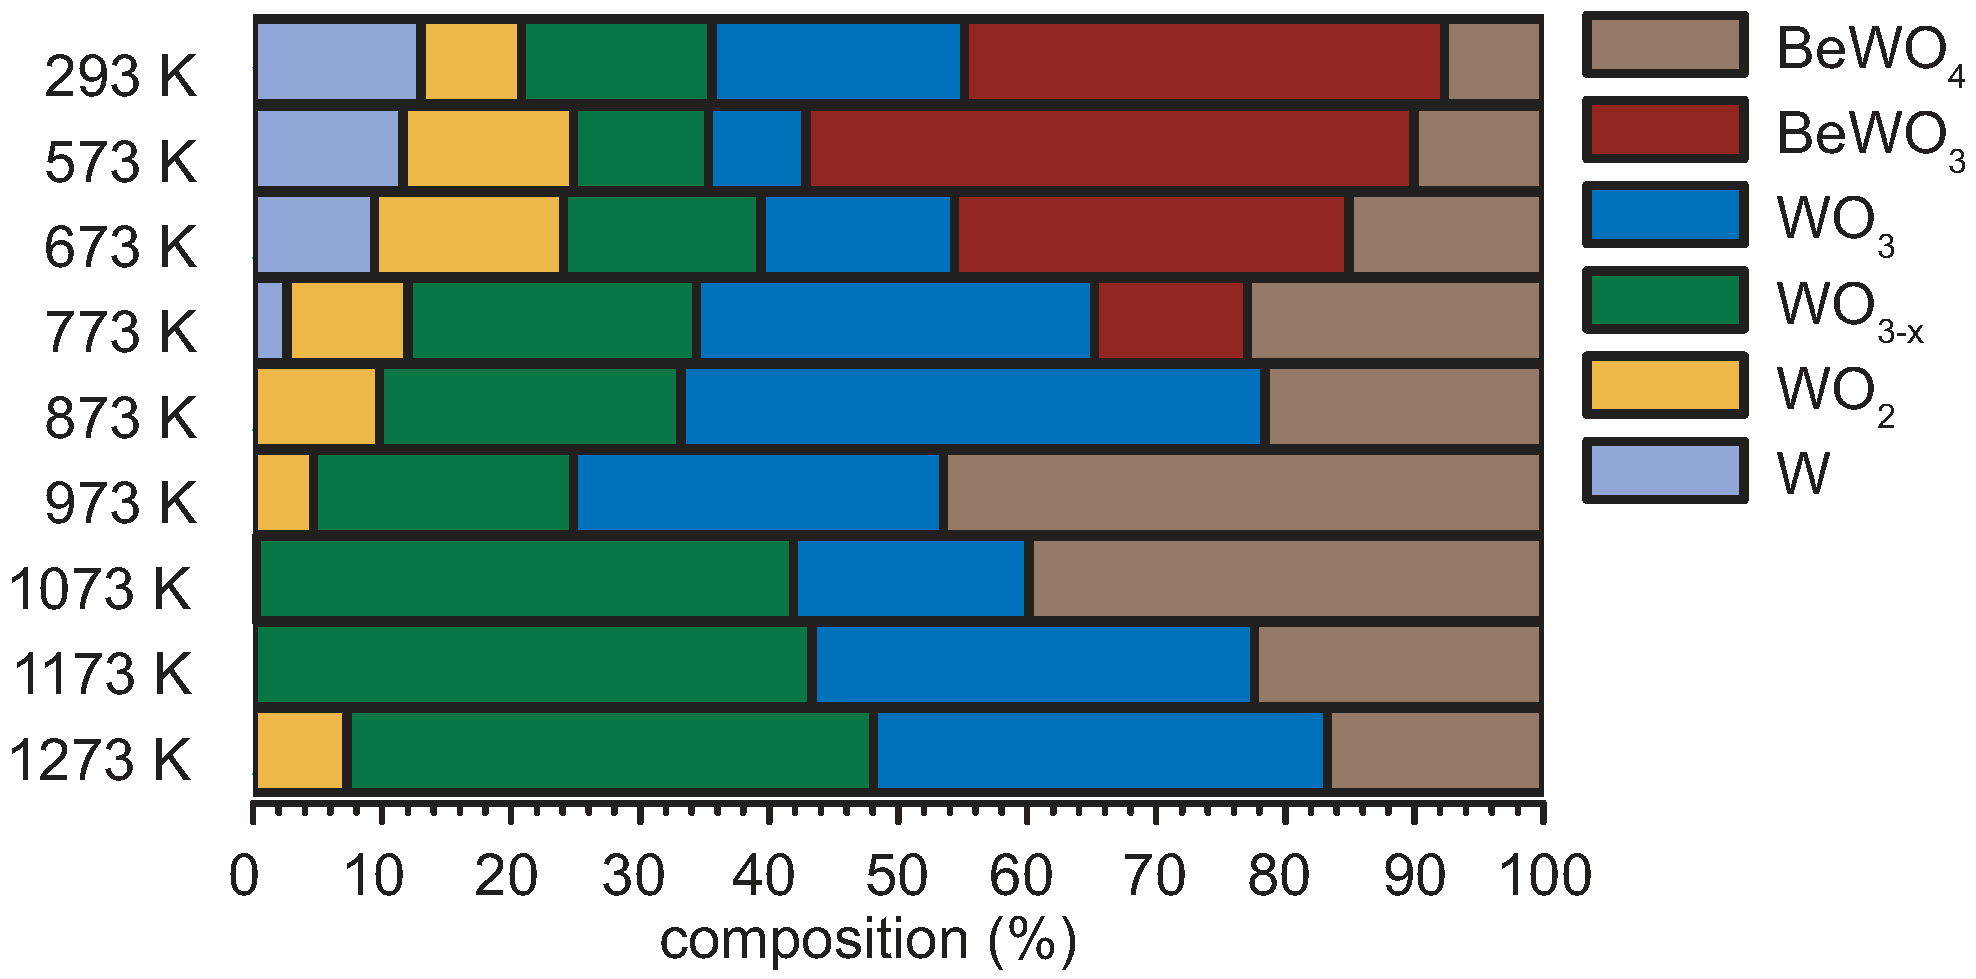
| T [K] | Signal Contributions of the W 4f-Region [%] | |||||
|---|---|---|---|---|---|---|
| W | WO2 | WO3−x | WO3 | BeWO3 | BeWO4 | |
| 293 | 13.0 | 7.8 | 14.8 | 19.6 | 37.2 | 7.6 |
| 573 | 11.6 | 13.2 | 10.5 | 7.5 | 47.2 | 10.0 |
| 673 | 9.4 | 14.7 | 15.3 | 15.0 | 30.6 | 15.1 |
| 773 | 2.6 | 9.4 | 22.3 | 30.8 | 11.9 | 22.9 |
| 873 | 0.0 | 9.8 | 23.4 | 45.3 | 0.0 | 21.6 |
| 973 | 0.0 | 4.7 | 20.2 | 28.6 | 0.0 | 46.5 |
| 1073 | 0.0 | 0.3 | 41.6 | 18.3 | 0.0 | 39.9 |
| 1173 | 0.0 | 0.0 | 43.3 | 34.3 | 0.0 | 22.4 |
| 1273 | 0.0 | 7.3 | 40.8 | 35.2 | 0.0 | 16.7 |
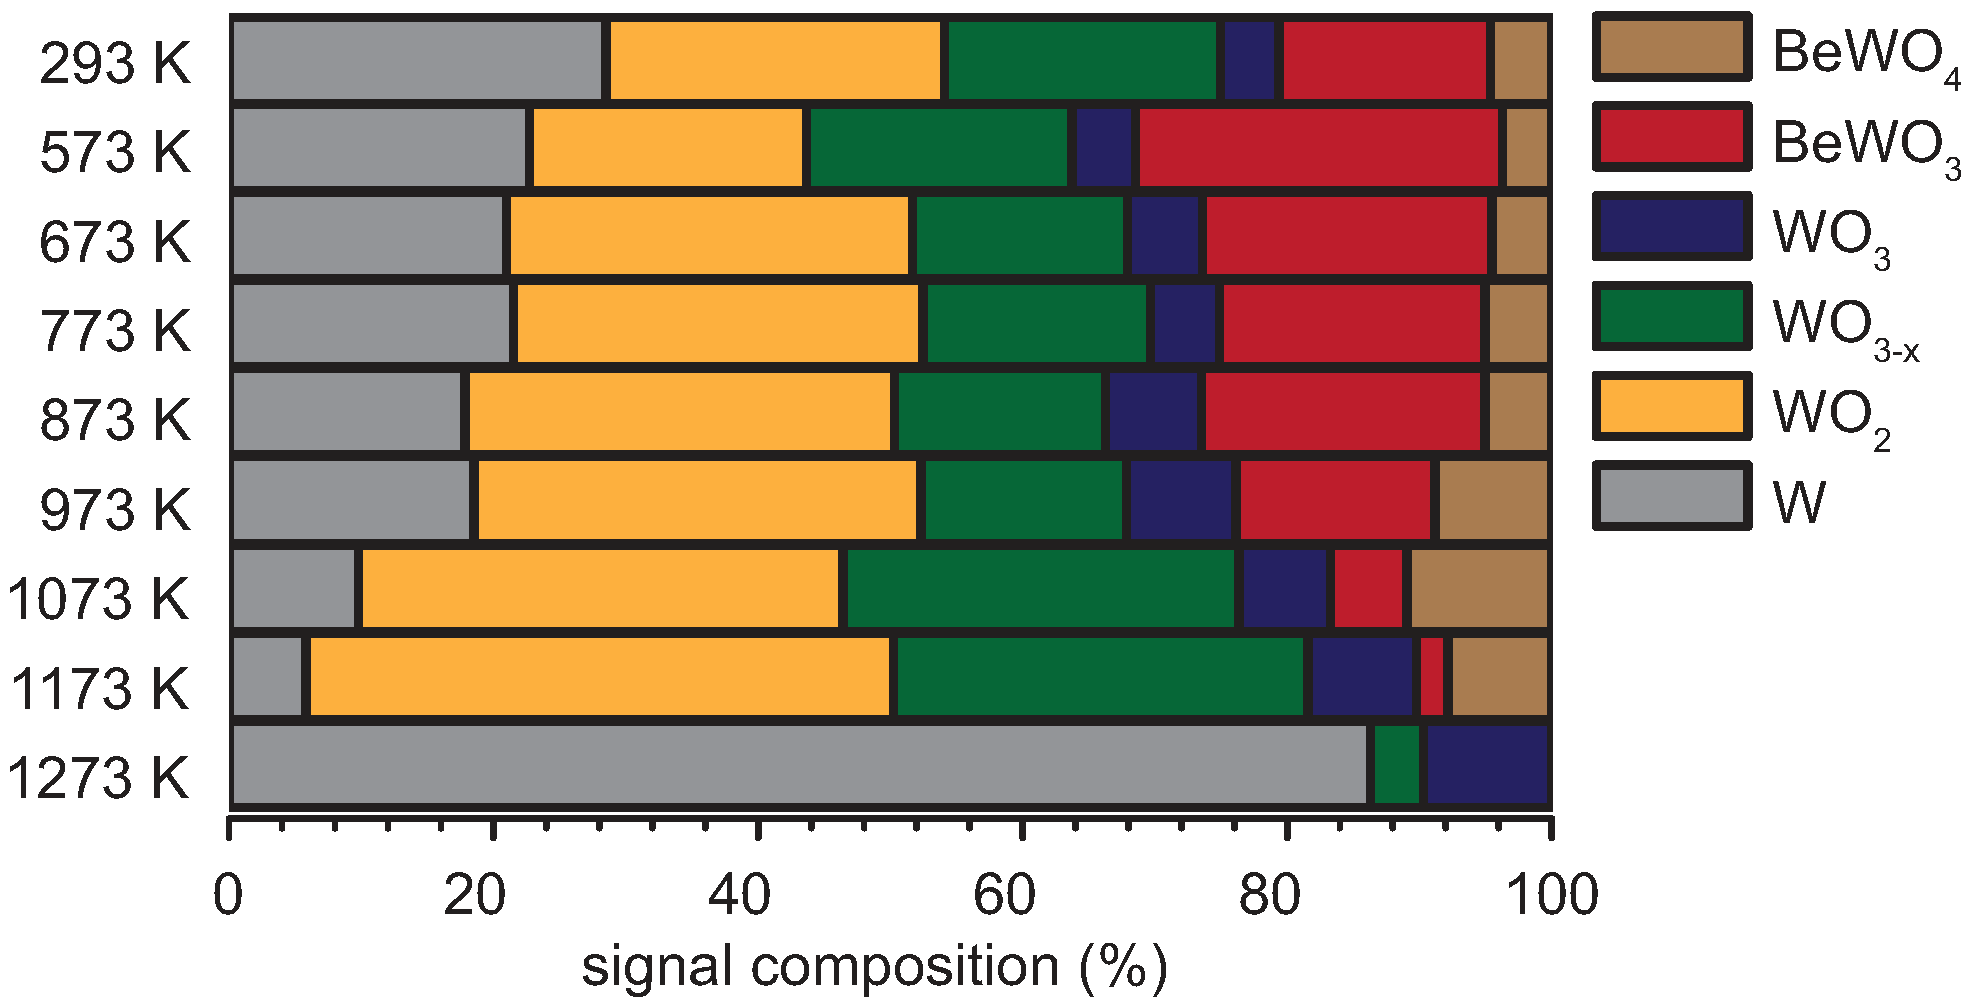
| Temperature [K] | Signal Contributions of the W 4f-Region [%] | |||||
|---|---|---|---|---|---|---|
| W | WO2 | WO3−x | WO3 | BeWO3 | BeWO4 | |
| 293 | 28.5 | 25.6 | 20.8 | 4.5 | 16.0 | 4.7 |
| 573 | 22.7 | 21.0 | 20.1 | 4.8 | 27.8 | 3.7 |
| 673 | 21.0 | 30.7 | 16.2 | 5.7 | 21.9 | 4.5 |
| 773 | 21.5 | 31.0 | 17.2 | 5.2 | 20.1 | 5.0 |
| 873 | 17.8 | 32.5 | 16.0 | 7.2 | 21.5 | 5.0 |
| 973 | 18.5 | 33.8 | 15.5 | 8.3 | 15.1 | 8.8 |
| 1073 | 9.8 | 36.7 | 29.9 | 6.9 | 5.8 | 10.9 |
| 1173 | 5.8 | 44.4 | 31.4 | 8.2 | 2.4 | 7.8 |
| 1273 | 85.3 | 0.0 | 4.0 | 9.7 | 0.0 | 0.0 |
© 2019 by the author. Licensee MDPI, Basel, Switzerland. This article is an open access article distributed under the terms and conditions of the Creative Commons Attribution (CC BY) license (http://creativecommons.org/licenses/by/4.0/).
Share and Cite
Köppen, M. Comparative Study of the Reactivity of the Tungsten Oxides WO2 and WO3 with Beryllium at Temperatures up to 1273 K. Condens. Matter 2019, 4, 82. https://doi.org/10.3390/condmat4030082
Köppen M. Comparative Study of the Reactivity of the Tungsten Oxides WO2 and WO3 with Beryllium at Temperatures up to 1273 K. Condensed Matter. 2019; 4(3):82. https://doi.org/10.3390/condmat4030082
Chicago/Turabian StyleKöppen, Martin. 2019. "Comparative Study of the Reactivity of the Tungsten Oxides WO2 and WO3 with Beryllium at Temperatures up to 1273 K" Condensed Matter 4, no. 3: 82. https://doi.org/10.3390/condmat4030082
APA StyleKöppen, M. (2019). Comparative Study of the Reactivity of the Tungsten Oxides WO2 and WO3 with Beryllium at Temperatures up to 1273 K. Condensed Matter, 4(3), 82. https://doi.org/10.3390/condmat4030082