
SrTiO3: Thoroughly Investigated but Still Good for Surprises

1
Max Planck Institute for Solid State Research, Heisenbergstr. 1, D-70569 Stuttgart, Germany
2
Institute of Physics, University of Silesia, ul. 75 Pułku Piechoty 1, 41-500 Chorzów, Poland
3
Department of Earth Sciences, University of Cambridge, Downing Street, Cambridge CB2 3EQ, UK
*
Author to whom correspondence should be addressed.
Condens. Matter 2024, 9(1), 3; https://doi.org/10.3390/condmat9010003
Submission received: 31 October 2023
/
Revised: 6 December 2023
/
Accepted: 2 January 2024
/
Published: 6 January 2024
(This article belongs to the Special Issue Complexity in Quantum Materials: In Honor of Prof. K.A. Muller)
Abstract
:For decades, SrTiO3 has been in the focus of research with seemingly never-ending new insights regarding its ground state properties, application potentials, its surface and interface properties, the superconducting state, the twin boundaries, domain functionalities, etc. Here, we focus on the already well-investigated lattice dynamics of STO and show that four different temperature regimes can be identified which dominate the elastic properties, the thermal conductivity, and the birefringence. These regimes are a low-temperature quantum fluctuation-dominated one, followed by an intermediate regime, a region of structural phase transition at ~105 K and its vicinity, and at high temperatures, a regime characterized by precursor and saturation effects. They can all be elucidated by lattice dynamical aspects. The relevant temperature dependences of the soft modes are discussed and their relationship to lattice polarizability is emphasized.
1. Introduction
SrTiO3 (STO), a cubic perovskite oxide, was synthesized in the early 1950s [1] and has been intensively investigated since then. A breakthrough discovery was made by K. A. Müller in 1958 [2] when he unambiguously established the structural phase transition from cubic to tetragonal at around 105 K. Later, he identified the tetragonal rotation angle of the oxygen octahedra as the order parameter [3]. Shortly after discovering the 105 K structural phase transition, Cochran predicted the occurrence of zone-center transverse soft optic modes in perovskite oxides like SrTiO3 and BaTiO3 at the Γ-point [4]. Their existence was confirmed experimentally in the following years [5]. Related to the rotational instability in STO is a zone-boundary transverse acoustic mode at the R-point, which softens with decreasing temperature to become unstable at TS = 105 K [6]. Below TS, the mode folds back to the zone centre and splits into three optic modes, two doubly degenerate and a single mode, the frequencies of which all follow the Curie–Weiss law in temperature. We will show here that this point turns out to be important for the understanding of the thermal conductivity TC and the birefringence Δn. Two important experiments were carried out in the early years of research on STO, namely, inelastic neutron scattering experiments where an anomalous acoustic mode dispersion was seen at small momenta q and interpreted as originating from mode–mode coupling [7]. The other observation was that the dielectric permittivity did not peak at low temperatures but was saturated to a plateau. This was interpreted as suppression of ferroelectricity by quantum fluctuations and was termed quantum paraelectricity [8].
While quantum paraelectricity attained enormous attention after its introduction, the acoustic phonon mode anomaly at small momentum was rarely addressed. It has, however, important consequences for the elastic properties and the origin of precursor phenomena as well as for dynamically driven elastically distorted domains appearing on specific length scales. We focus on this aspect by using results from theory obtained within the polarizability model and experiments from birefringence and elastic measurements. In addition, new measurements of the thermal conductivity to ultra-low temperatures are interpreted in terms of quantum effects and mode–mode coupling theory. Besides the importance of elastically distorted local regions, newly obtained data from the formation of polar clusters are emphasized. Our results imply that polar and elastically distorted dynamical domains coexist at temperatures below the structural phase transition resulting from anharmonic mode–mode coupling [9]. A comparison with experimental data is made.
2. Theory
The dispersion relations for the lowest optic and acoustic modes along (100) have been obtained within the polarizability model [10,11,12] as a function of temperature T and momentum q. At high temperatures, the optic and acoustic modes are well separated, and only negligible coupling or crossing occurs. Around and below the structural phase transition, a tiny dip at small momentum q appears in the acoustic mode, which becomes increasingly pronounced with decreasing temperature. Simultaneously, the dip shifts to a smaller momentum. A special feature, which has been rarely addressed so far, is the fact that softens at the zone boundary, caused by optic–acoustic mode–mode coupling. This softening remains incomplete to the lowest temperature of 4 K [13]. The anomalies at small momentum can be easily identified by taking the momentum derivatives of the two modes (Figure 1).
The q-dependent mode–mode coupling anomaly can be associated with the deviation from linearity, which appears as the inversion point in and the maximum, i.e., the saddle point in . This choice is justified by the fact that the acoustic mode derivative smoothly decreases with q, whereas the optic mode derivative exhibits no saddle point in the harmonic case. The corresponding momentum qc defines the length scales of elastic and polar clusters, which appear simultaneously at the same temperatures. Since the coupling stems from the off-diagonal matrix elements in the dynamical matrix, an analytic expression for both derivatives is rather difficult to obtain but it can be derived numerically (see Figure 1). Whereas elastic clusters appear on a rather large length scale as compared to polar clusters, both length scales start to diverge with decreasing temperature. A true divergence takes place in the elastically distorted areas, whereas the polar clusters adopt a similar behavior as the dielectric permittivity, namely, they saturate in the quantum fluctuation-dominated region below ≈30 K. The calculated size of the elastically distorted areas is similar to those reported recently by inelastic neutron scattering, although by a factor of 2 smaller. This difference might be related to the too-coarse q sampling in the calculations. Above TS, precursor dynamics of the structural phase transition occurs as previously reported for STO and several other perovskite oxides. If the linear regime for T > TS is subtracted from the data (inset to Figure 2), the precursors become more apparent as indicated by the shaded area in the inset to Figure 2. Experimentally, strong elastic precursor softening was observed at temperatures as high as ~125 K, i.e., ~20 K above the actual transition point while analytical data fits show even higher precursor temperatures [14]. Similar conclusions were reached by birefringence measurements [15]. Theoretically, precursors have been predicted to be universal in perovskite oxides [16]. Evidence for polar nano-domain formation has been obtained by resonant piezoelectric spectroscopy [17], interpreted in terms of ferroelastic twin walls that become polar at low temperatures.
The inset to Figure 2 also highlights what can be expected for the birefringence data and elastic effects, namely, in a rather small temperature region below TS, deviations from simple, one-order parameter mean-field behavior should occur, whereas approaching the quantum fluctuation-dominated regime, nonlinear elastic anomalies with the simultaneous appearance of polarization clusters are observed [18], which is consistent with the present results (Figure 2). It is important to emphasize that deviations from mean-field results have already been postulated by Müller and Berlinger [19], who argued that for temperatures very close to TS (t = (TS − T)/TS > 0.9), the order parameter can be described by a critical exponent β ≈ 0.33(2). Later, Salje et al. [20] showed that criticality occurs only in a very small interval near Ts, while the temperature evolution of the excess entropy is fully compatible with a mean-field near-tricritical Landau potential. A weak singularity was seen for a maximum temperature interval of 2 K. Below 103 K (0.981 TS), the order parameter follows a mean field behavior, which is very well described by a 2–4–6 Landau behavior. Birefringence data by Geday and Glazer [21] concurred and did not find deviations from a mean-field behavior.
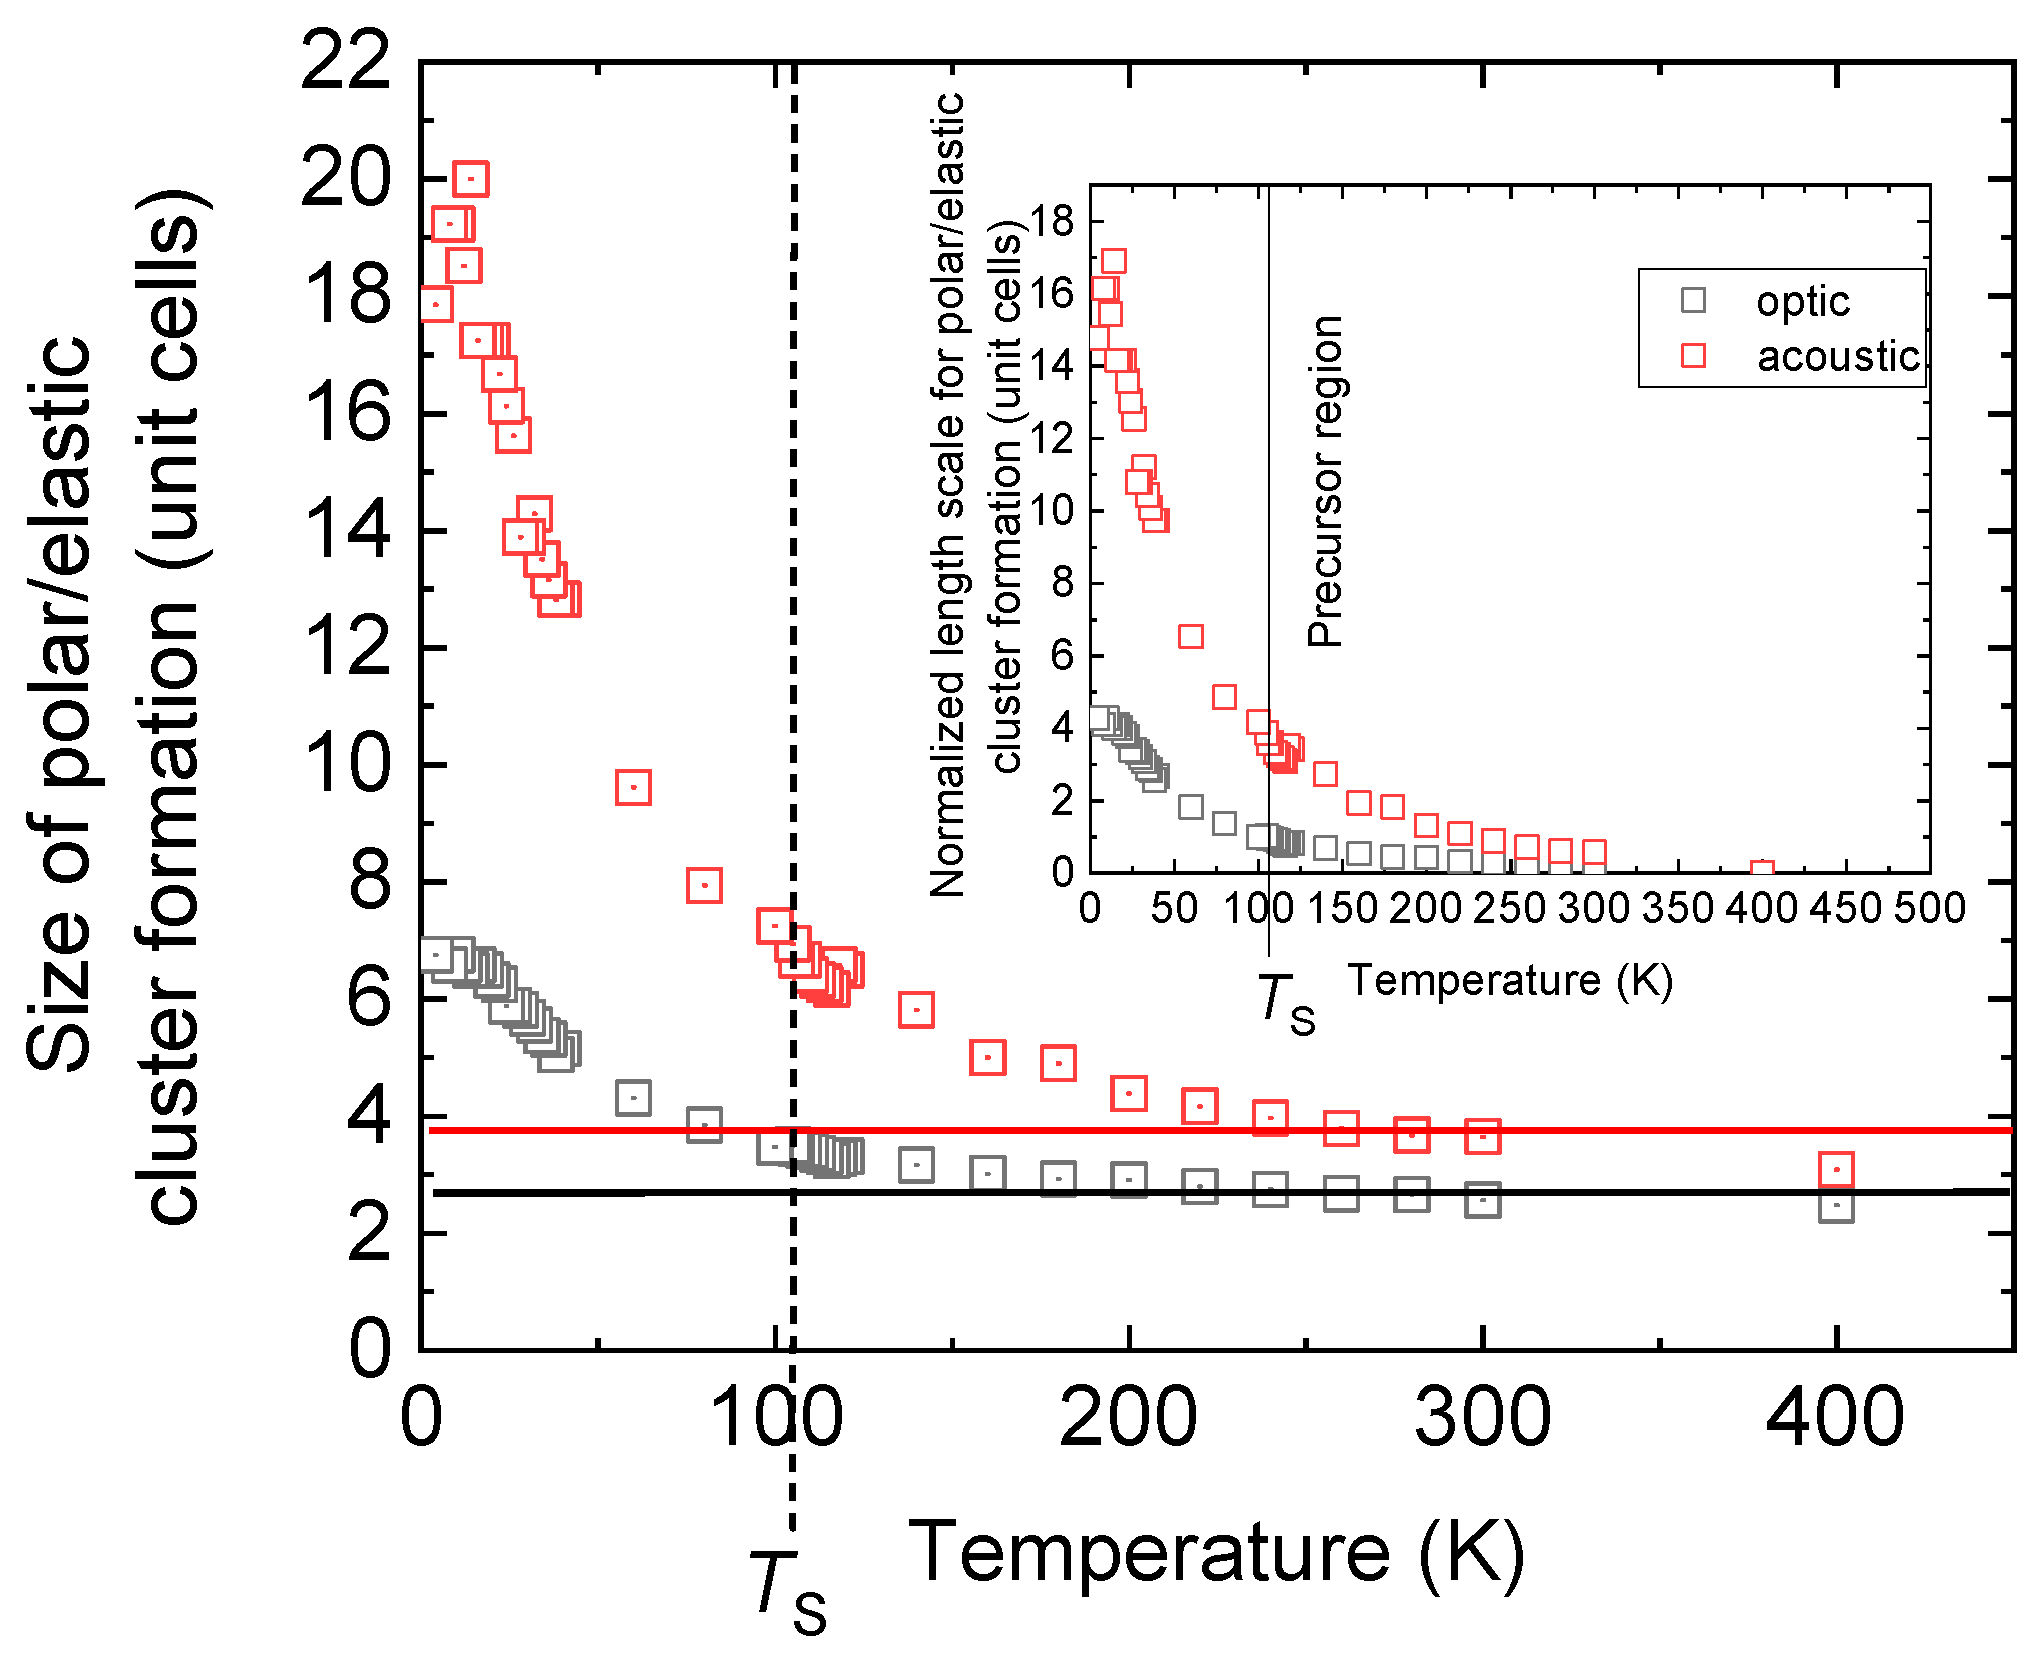
A closer look into the cluster formation below TS, especially in the quantum regime, reveals that three novel regions in the cluster size can be identified (Figure 3), which canbe related to the twin boundary formation below TS. For temperatures 60 K < T < TS, a small but smooth increase in both cluster states takes place. Below 60 K and more pronounced below 40 K especially, the elastic properties are strongly affected, and a rapid increase in elastically deformed clusters occurs. The polar regions exhibit a similar but much less pronounced behavior. Below 25 K to 20 K, a steady state is reached and characterized by scattering in the size and distribution around an average value of the polar elastic domains.
In the quantum paraelectric state, a “quantum domain glass” at T < 40 K shows intense relaxation and temperature hysteresis of its nanostructure. This includes a high correlation between domains so that domains float collectively in a complex, smooth landscape with long relaxation times. This correlation becomes very strong in the “quantum domain solid” state below 25 K. Approaching zero Kelvin leads to a predominance of large coherently moving clusters [13].
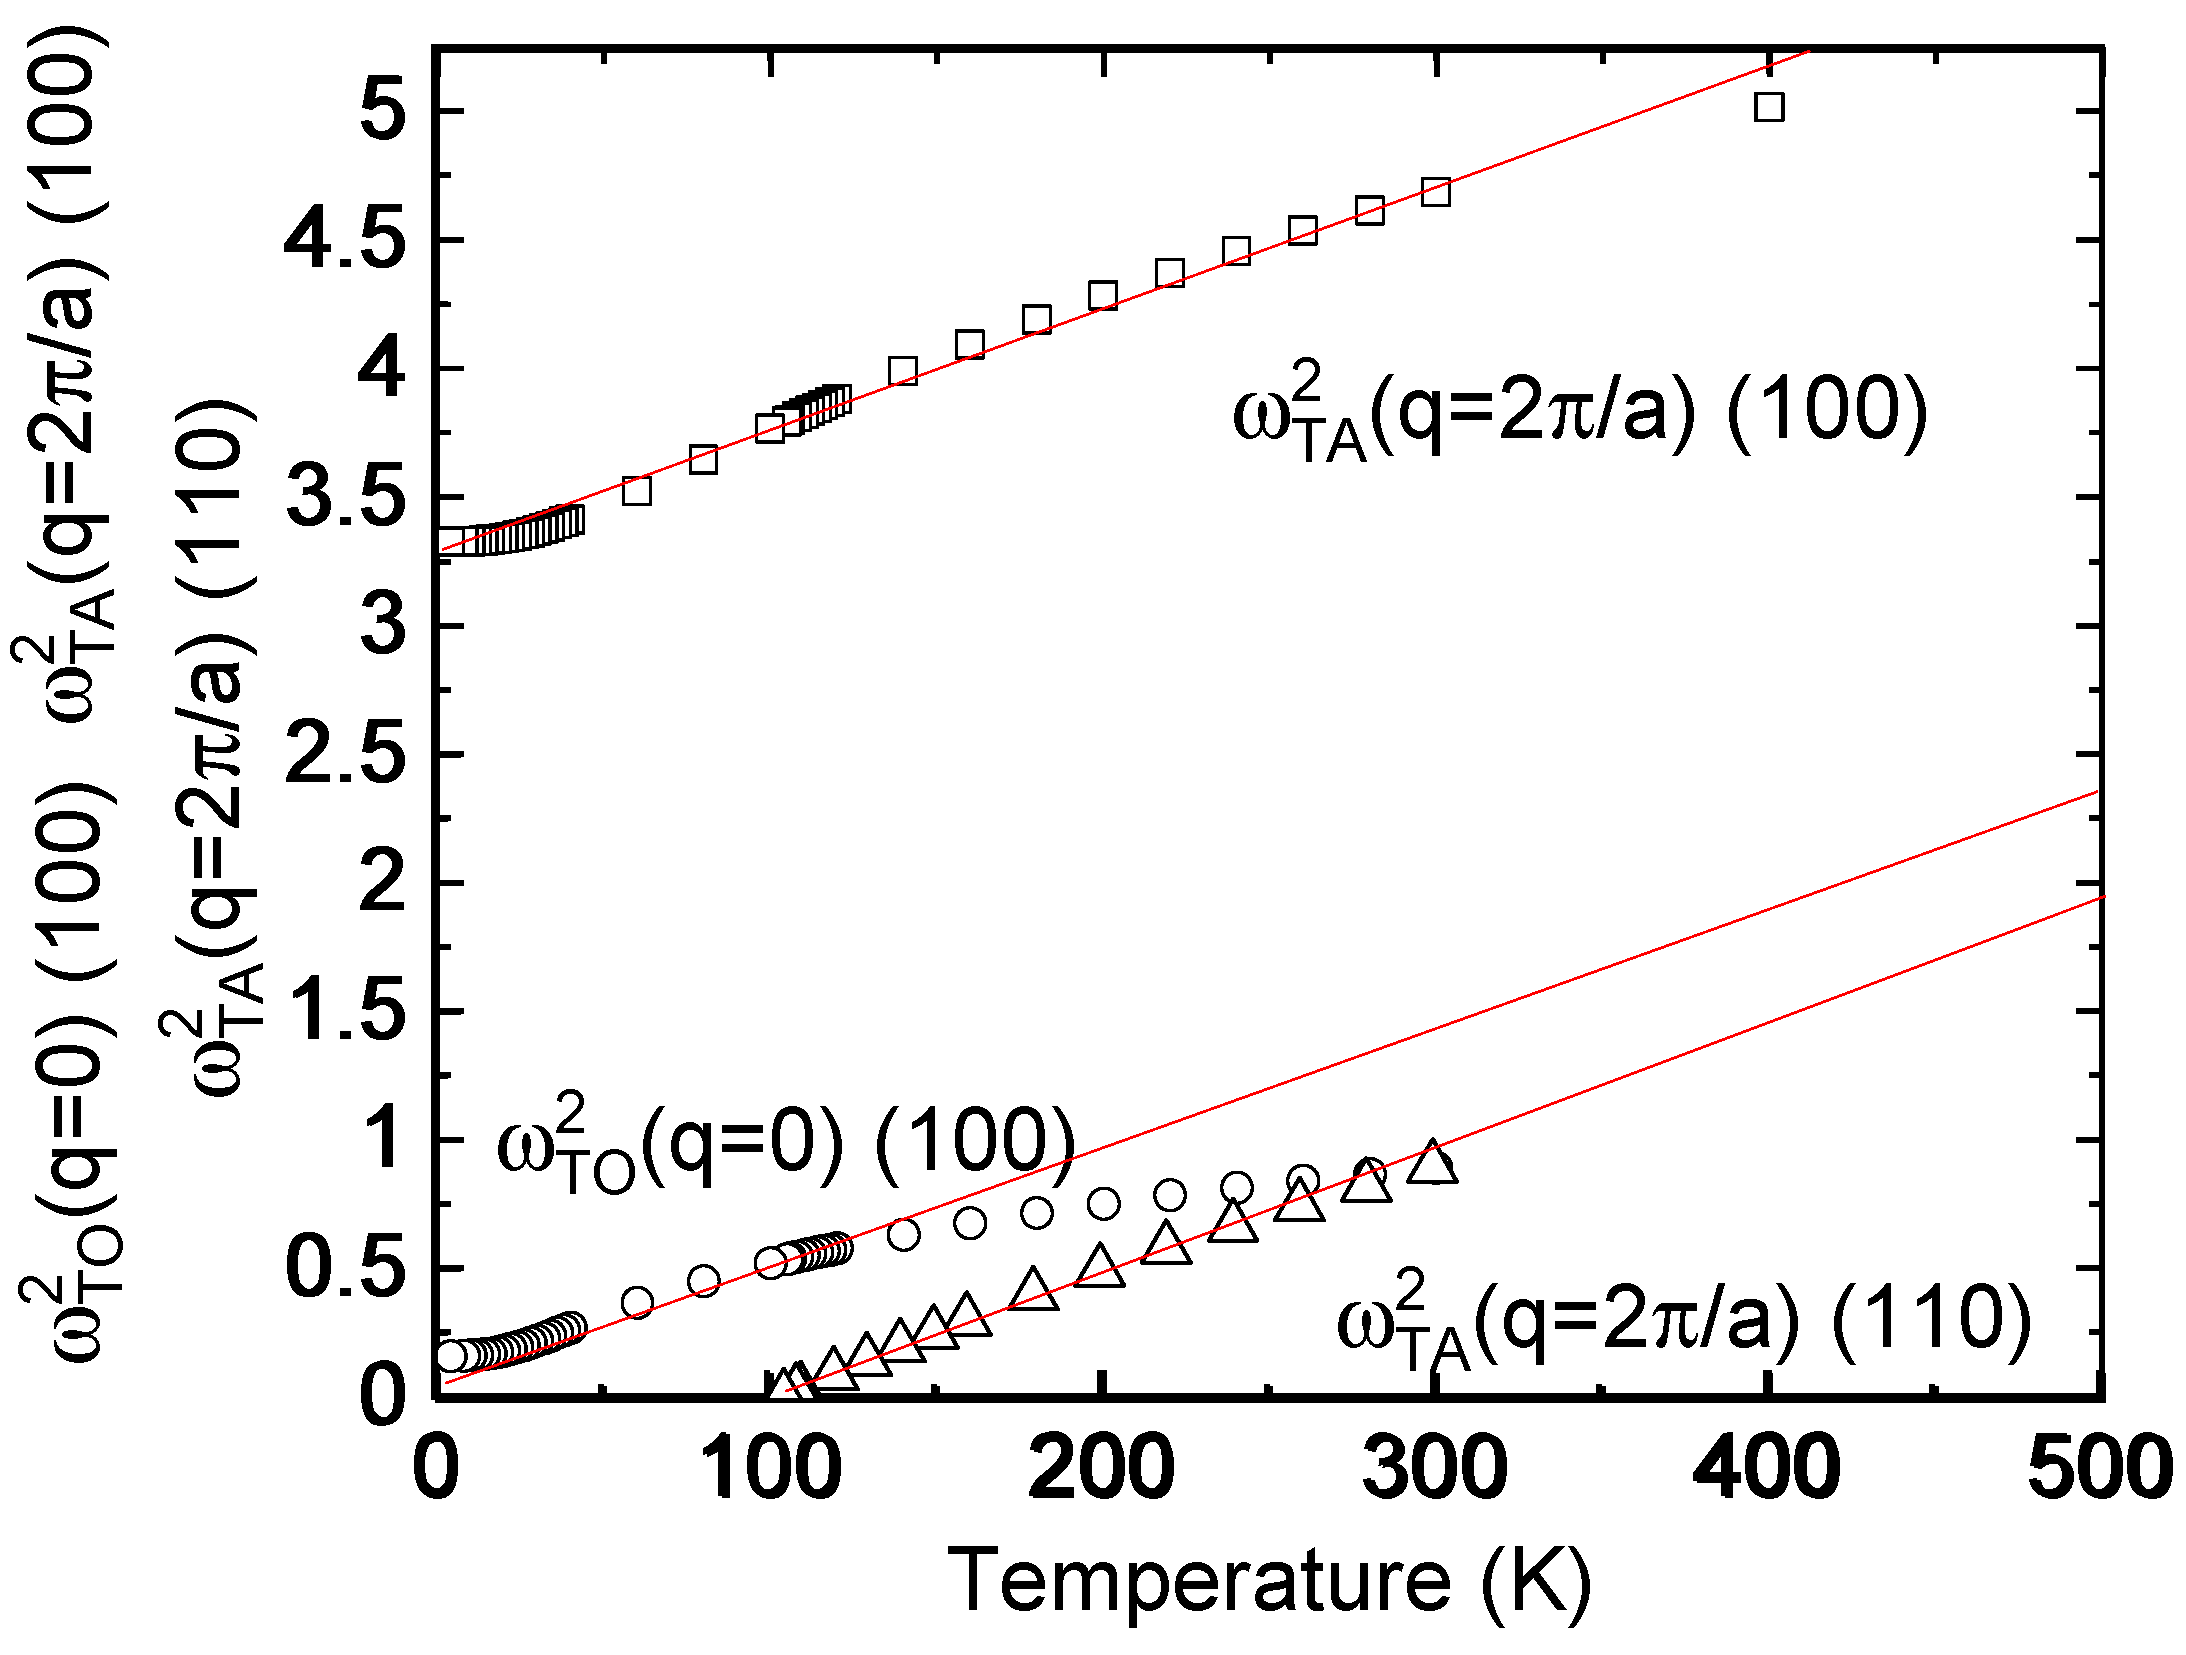
Motivated by recent inelastic neutron scattering data [22], the soft modes observed in STO have been reinvestigated. In [22], special interest was devoted to the transverse optic/acoustic mode–mode coupling region, which followed the quantum fluctuation-dominated regime. The conclusions were that the ground state of STO is formed by a hybridized optical–acoustic phonon mode where quantum fluctuations are accompanied by fluctuating domains of mesoscopic length. In addition, the softening of the M- and Γ-point modes was followed over a large temperature range with the observation that their temperature dependence perfectly overlaps the whole temperature range when shifted by 9 meV. The origin of this observation has not been addressed yet. As shown in Figure 4, this fact finds a natural explanation since both modes are dominated by the polarizability coordinate and consequently adopt analogous temperature behavior. In addition, the soft acoustic zone-boundary mode related to the TO Γ-point mode also follows this temperature dependence, such that all three modes of STO overlap if shifted by a mode-specific energy. At very low energies, the latter two modes saturate as a consequence of the onset of quantum fluctuations. A distinct difference between the three modes lies in their high-temperature properties, where deviations from mean-field behavior and saturation start near TS for the transverse optic mode. The R-point acoustic mode shows first deviations from mean-field behavior below ca. 300 K. This temperature evolution has been predicted in refs. [9,10,11] and identified, for the first time, in the antimony-sulfur-iodide SbSI [23] and later also in STO [24].
3. Thermal Conductivity
We now turn to the discussion of the thermal conductivity (TC). Experimentally, the TC was measured with a conventional two-thermometer one-heater arrangement using a commercial system (Quantum Design, PPMS). The experimental techniques’ details can be found elsewhere [25]. Our data (see Figure 5), which cover the temperature range from room temperature down to 2 K, are similar to the results reported by Jaoui et al. [26], Martelli et al. [27], and Steigmeier [28].
The TC is a function of the specific heat cv, the phonon mean-free path, and the phonon group velocity. All parameters are specifically temperature dependent. The transverse optic soft mode and the related acoustic mode dominate the TC at low temperatures since the crossing wave vector avoidance rule produces a dip in the acoustic mode dispersion and defines the mean-free path. The group velocities for these two modes are readily obtained from their dispersion, where the one related to is much larger than for the optic mode. Accordingly, the contribution from the optic mode can be neglected in this discussion. A strong increase in TC [29,30,31,32] is seen near 40 K. Around TS, a rather broad anomaly (see inset to Figure 5) in TC appears, which signals the phase transition and possibly the nucleation of domain structures in the ferroelastic phase. In Figure 6, the frequencies of the TA and TO modes are plotted as a function of temperature, where the shaded regions labeled I, II, and III denote the quantum domain solid, the quantum domain glass regime, and the area around the phase transition temperature where precursors and deviations from mean-field behavior are highlighted. Note that above TS ≈ 105 K, the calculated TC is in good agreement with the measured data [12]. For T > TS, substantial corrections related to the R-point acoustic soft mode are needed.
Above TS, the R-point acoustic mode softens substantially and completely dominates the TC. This can be shown by replotting the inverse of TC (Figure 5) as a function of temperature (Figure 7). Above TS, TC follows a Curie–Weiss law like the soft mode and shows deviations from it in the precursor region. Here, the effect of other modes is apparently less relevant for the heat transport, which is dominated by the acoustic R-point mode. Below TS, this mode converts to optic modes, and a more complex temperature evolution of TC is seen.
From these results, we conclude that novel temperature scales have been observed, which are needed to explain experimental observations. In particular, we have shown that the quantum fluctuation-dominated region has profound effects on TC followed by a crossover state where the lowest transverse optic and the related acoustic modes are the most important ingredients for the understanding of the dynamics and the TC. Above TS, the zone-boundary soft acoustic mode at the R-point gains importance and is the only relevant contribution to TC.
4. Birefringence
We now discuss birefringence measurements at low temperatures. The measurements were performed using a birefringence imaging system (Metripol, Oxford, UK). The details of the technique can be found in [21,33,34]. The light intensity measured by a microscope equipped with a rotating plane polarizer, a circular-polarizing analyzer, and a CCD camera [33] is given by the formula:
where I0 is the intensity of polarized light passing through the sample (transmittance), α is the angular position of the analyzer as it rotates, and φ is the angle of the slow axis of the indicatrix (indicatrix orientation) with respect to the horizontal axis of the microscope. The parameter δ is the retardance for the sample of a thickness t between the two orthogonal components of the polarized light and is given by
I = 0.5 I0 × [1 + sin(2φ − 2α) × sinδ]
δ = (2π/λ) × Δn × t
Here, Δn means the birefringence of the sample, and the wavelength of the light was λ = 570 nm. The absolute values of |sinδ| and φ are shown on color maps. When the |sinδ| values are small, then the relation sinδ ≈ δ is well fulfilled, and the Δn can be calculated directly from relation (2) provided the |sinδ| continuously goes to zero at TS. In such cases, the Δn(T) and φ(T) runs are determined for selected areas from the maps.
The sample was heated in a high-precision Linkam TMSG600 (Surrey, UK) temperature stage, with a heating/cooling rate of 1 K min−1. This hot stage maintains a temperature within an accuracy of 0.1 K.
These experiments have been performed analogously to the procedure reported in [20]. They are now analyzed in deeper detail, emphasizing the critical regions discussed above. The results are displayed in Figure 8 for temperatures 80 K < T < 180 K. Below TS, the data can be fitted linearly following simple Landau theory. Close to TS, weak deviations are observable, which cover a small interval around TS compared with results from the measurements of the excess entropy and the structural order parameter Q [20]. Note that the birefringence data reveal small variations in TS with variable sample thickness.
Nominally, Δn should be zero above the phase transition temperature, but small finite signals are observed at T >> TS, defining a wide precursor regime. This behavior is analogous to elastic anomalies observed in [17]. The data above TS can be described in a related manner as the TC, namely as a function of t = (1 − T/TS), which is shown in Figure 8.
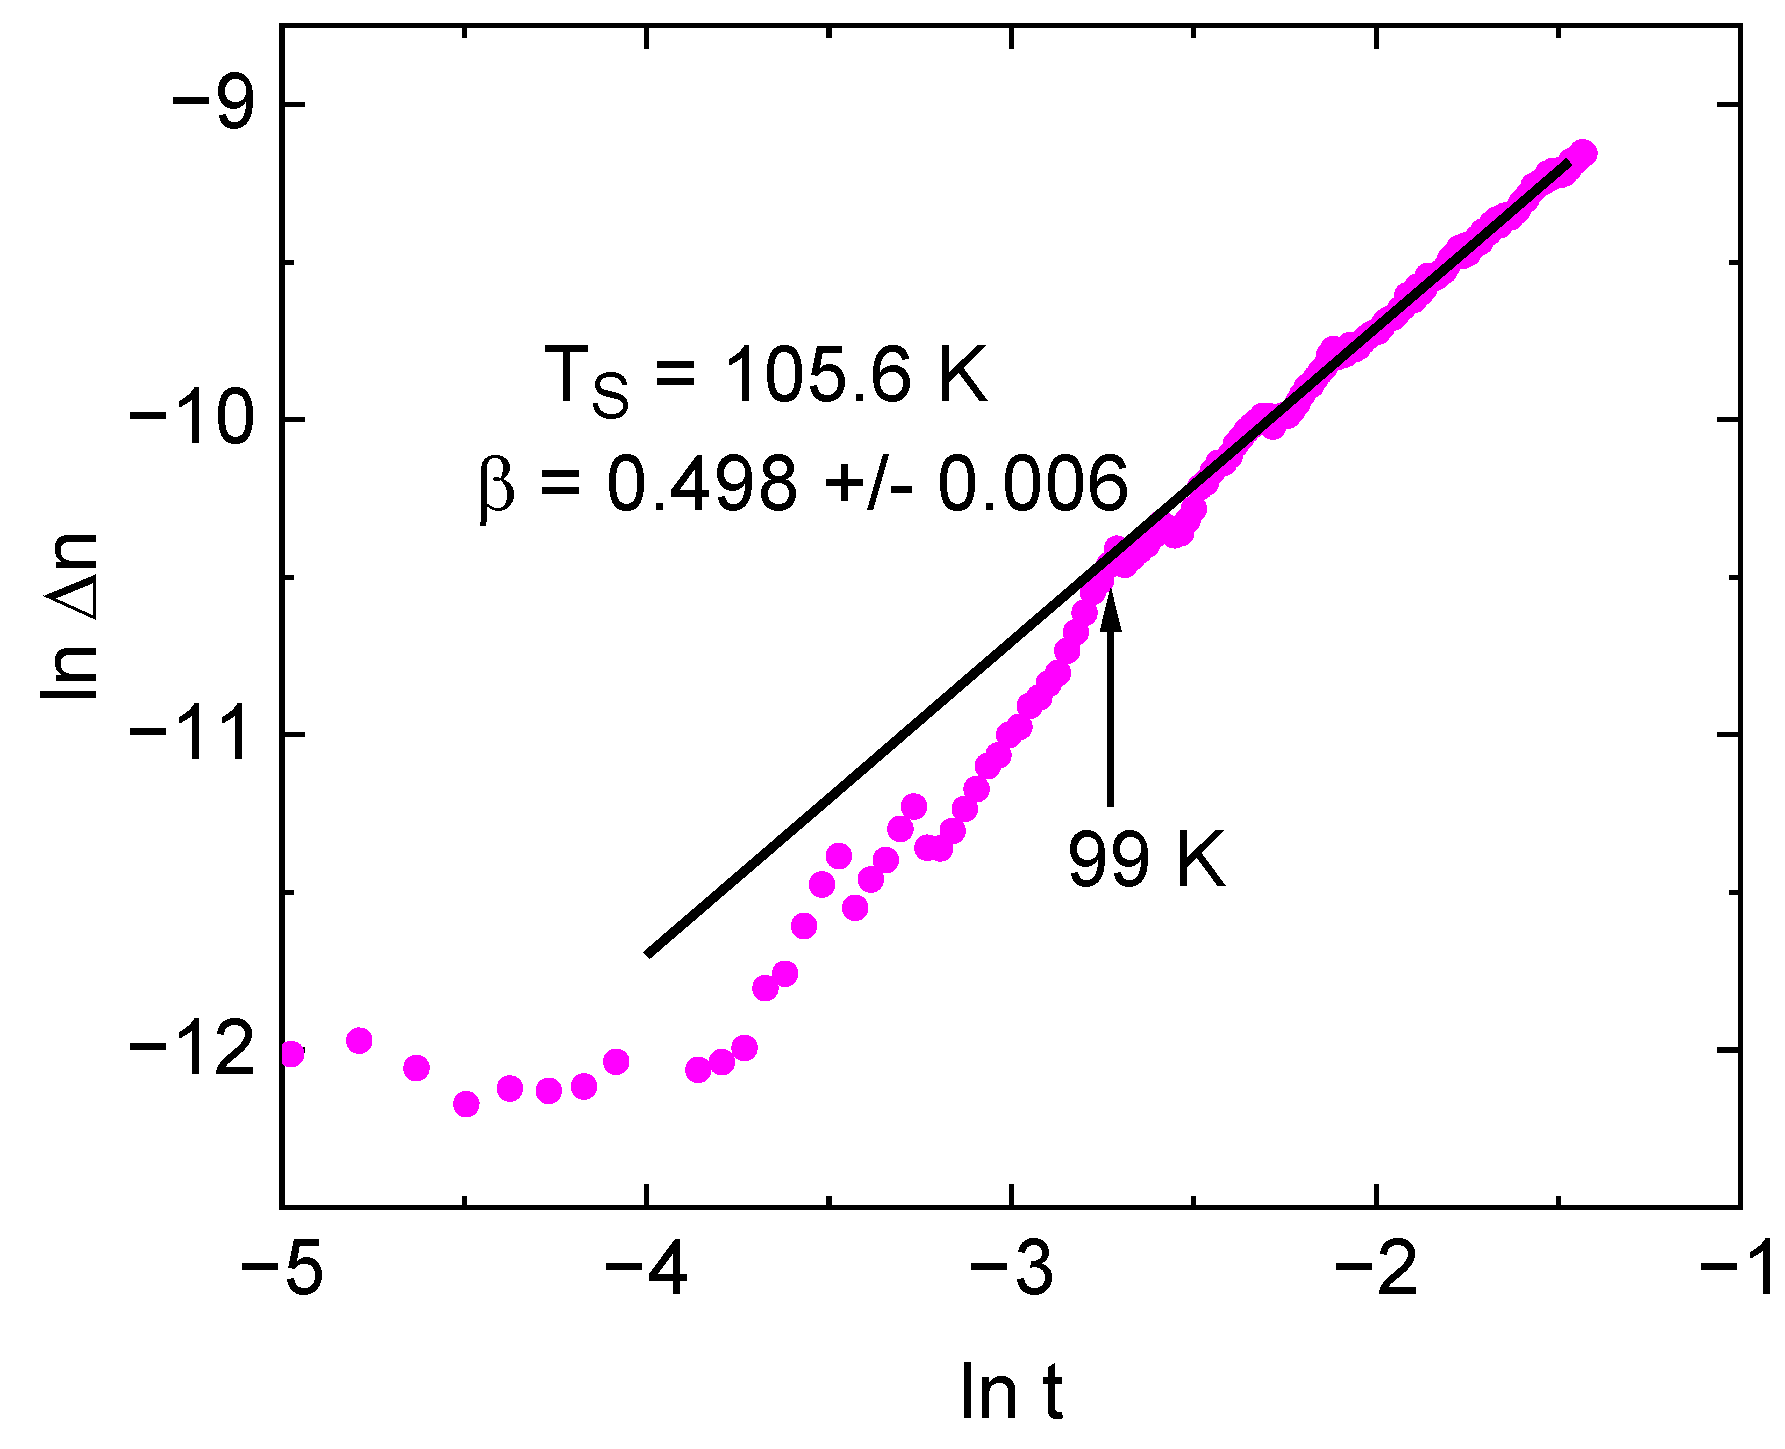
An inversion point in several data around identical temperatures in lnΔn versus lnt in Figure 9 is followed by a linear increase at higher temperatures, which can be fitted by a Curie–Weiss law with a critical exponent β ≈ 0.498, which is very close to the expected mean-field behavior. A question arises as to why the birefringence should exhibit the same temperature dependence as the zone-boundary transverse acoustic mode. Whereas the TC dependence can be well explained by being dominated by this mode, this is not necessarily true for Δn. Here, the softening of might lead to elastically distorted regions, which adopt lower symmetry than the bulk and correspondingly allow for the observed weak birefringence. On the other hand, defects might also be a possible source of symmetry lowering; at present, it is unclear which effect dominates.
5. Conclusions
In summary, by considering the lattice dynamics, we have identified new temperature regimes. These can be classified as the quantum regime where quantum domain glass properties dominate, and the soft mode displacement coordinate is much smaller than the quantum fluctuations [35]. With increasing temperature, mode–mode coupling dominates, accompanied by the formation of polar and elastic cluster formation to give place to mean-field behavior at higher temperatures. The region very close to TS is surprisingly close to the mean-field behavior. Just above TS, the precursor effects appear, which reflect the fact that fluctuations in the order parameter precede the transition. At higher temperatures, it appears that influences static as well as dynamic properties and is responsible for the thermal conductivity as the only source. Interestingly, the soft zone-boundary mode exhibits the same temperature dependence as the soft optic mode and its related acoustic mode, demonstrating that all modes are driven by the polarizability coordinate stemming from strong anharmonicity. The above conclusions are supported by new measurements of the thermal conductivity and complemented by novel birefringence data.
Author Contributions
A.B.-H. developed the theoretical background; R.K.K. carried out the thermal conductivity measurements; K.R. measured the birefringence; E.K.H.S. contributed through discussions and writing of the paper. All authors have read and agreed to the published version of the manuscript.
Funding
The research of EKHS was funded by EPSRC (grant EP/P024904/1).
Data Availability Statement
No new data were created or analyzed in this study.
Conflicts of Interest
The authors declare no conflicts of interest.
References
- Hulm, J.K. The dielectric properties of some alkaline earth titanates at low temperatures. Proc. Phys. Soc. Lond. Ser. A 1950, 63, 1184–1185. [Google Scholar] [CrossRef]
- Müller, K.A. Paramagnetische Resonanz von Fe3+ in SrTiO3 Einkristallen. Helv. Phys. Acta 1958, 31, 173–433. [Google Scholar]
- Müller, K.A.; Berlinger, W.; Waldner, F. Characteristic Structural Phase Transitions in Perovskite-Type Compounds. Phys. Rev. Lett. 1968, 21, 814–817. [Google Scholar] [CrossRef]
- Cochran, W. Crystal Stability and the Theory of Ferroelectricity. Phys. Rev. Lett. 1959, 3, 412–417. [Google Scholar] [CrossRef]
- Yamada, Y.; Shirane, G. Neutron Scattering and Nature of the Soft Optical Phonon in SrTiO3. J. Phys. Soc. Jpn. 1969, 26, 396–403. [Google Scholar] [CrossRef]
- Fleury, P.; Scott, J.; Worlock, J.M. Electric-Field-Induced Raman Scattering in SrTiO3 and KTaO3. Phys. Rev. Lett. 1968, 21, 16–20. [Google Scholar] [CrossRef]
- Cowley, R.A. Lattice Dynamics and Phase Transitions of Strontium Titanate. Phys. Rev. 1964, 134, A981–A997. [Google Scholar] [CrossRef]
- Müller, K.A.; Burkard, H. SrTiO3 an Intrinsic Quantum Paraelectric below 4 K. Phys. Rev. B 1979, 19, 3593–3602. [Google Scholar] [CrossRef]
- Scott, J.F.; Ledbetter, H. Interpretation of Elastic Anomalies in SrTiO3 at 37 K. Z. Phys. B 1997, 104, 635–639. [Google Scholar] [CrossRef]
- Migoni, R.; Bäuerle, D.; Bilz, H. Origin of Raman Scattering and Ferroelectricity in Oxidic Perovskites. Phys. Rev. Lett. 1979, 37, 1155–1159. [Google Scholar] [CrossRef]
- Bilz, H.; Benedek, G.; Bussmann-Holder, A. Theory of ferroelectricity: The polarizability model. Phys. Rev. B 1987, 35, 4840–4849. [Google Scholar] [CrossRef] [PubMed]
- Bussmann-Holder, A. The polarizability model for ferroelectricity in perovskite oxides. J. Phys. Cond. Mat. 2012, 24, 273202. [Google Scholar] [CrossRef] [PubMed]
- Bussmann-Holder, A. A simple recipe to calculate the thermal conductivity of anharmonic crystals: The case of SrTiO3. Ferroelectrics 2019, 553, 26–35. [Google Scholar] [CrossRef]
- Cordero, F.; Trequattrini, F.; da Silva, P.S., Jr.; Venet, M.; Aktas, O.; Salje, E.K.H. Elastic precursor effects during Ba1−xSrxTiO3 ferroelastic phase transitions. Phys. Rev. Res. 2023, 5, 013121. [Google Scholar] [CrossRef]
- Roleder, K.; Bussmann-Holder, A.; Górny, M.; Szot, K.; Glazer, A.M. Precursor dynamics to the structural instability in SrTiO3. Phase Transit. 2012, 85, 939–948. [Google Scholar] [CrossRef]
- Bussmann-Holder, A.; Beige, H.; Völkel, G. Precursor effects, broken local symmetry, and coexistence of order-disorder and displacive dynamics in perovskite ferroelectrics. Phys. Rev. B 2009, 79, 184111. [Google Scholar] [CrossRef]
- Salje, E.K.H.; Aktas, O.; Carpenter, M.A.; Laguta, V.V.; Scott, J.F. Domains within Domains and Walls within Walls: Evidence for Polar Domains in Cryogenic SrTiO3. Phys. Rev. Lett. 2013, 111, 247603. [Google Scholar] [CrossRef]
- Kityk, A.V.; Schranz, W.; Sondergeld, P.; Havlik, D.; Salje, E.K.H.; Scott, J.F. Low-frequency superelasticity and nonlinear elastic behavior of SrTiO3 crystals. Phys. Rev. B 2000, 61, 946–956. [Google Scholar] [CrossRef]
- Müller, K.A.; Berlinger, W. Static Critical Exponents at Structural Phase Transitions. Phys. Rev. Lett. 1971, 26, 13–17. [Google Scholar] [CrossRef]
- Salje, E.K.H.; Gallardo, M.C.; Jimenez, J.; Romero, F.J.; del Cerro, J. The cubic-tetragonal phase transition in strontium titanate: Excess specific heat measurements and evidence for a near-tricritical, mean field type transition mechanism. J. Phys. Condens. Matter 1998, 10, 5535–5543. [Google Scholar] [CrossRef]
- Geday, M.A.; Glazer, A.M. Birefringence of SrTiO3 at the ferroelastic phase transition. J. Phys. Condens. Matter 2004, 16, 3303–3310. [Google Scholar] [CrossRef]
- Fauqué, B.; Bourges, P.; Subedi, A.; Behnia, K.; Baptiste, B.; Roessli, B.; Fennell, T.; Raymond, S.; Steffens, P. Mesoscopic fluctuating domains in strontium titanate. Phys. Rev. B 2022, 106, L14030. [Google Scholar] [CrossRef]
- Teng, M.K.; Balkanski, M.; Massot, M.; Ziolkiewicz, M.K. Optical Phonon Analysis in the AvBVICVII Compounds. Phys. Status Solidi (B) 1974, 62, 173–182. [Google Scholar] [CrossRef]
- Gryaznov, D.; Blokhin, E.; Sorokine, A.; Kotomin, E.A.; Evarestov, R.A.; Bussmann-Holder, A.; Maier, J. A Comparative Ab Initio Thermodynamic Study of Oxygen Vacancies in ZnO and SrTiO3: Emphasis on Phonon Contribution. J. Phys. Chem. 2013, C117, 13776–13784. [Google Scholar] [CrossRef]
- Rotter, M.; Müller, H.; Gratz, E.; Doerr, M.; Loewenhaupt, M. A miniature capacitance dilatometer for thermal expansion and magnetostriction. Rev. Sci. Instrum. 1998, 69, 2742–2746. [Google Scholar] [CrossRef]
- Jaoui, A.; Jiang, S.; Li, X.; Tomioka, Y.; Inoue, I.H.; Engelmayer, J.; Sharma, R.; Pätzold, L.; Lorenz, T.; Fauqué, B.; et al. Glasslike thermal conductivity and narrow insulating gap of EuTiO3. Phys. Rev. Mat. 2023, 7, 094604. [Google Scholar] [CrossRef]
- Martelli, V.; Jiménez, J.L.; Continentino, M.; Baggio-Saitovitch, E.; Behnia, K. Thermal Transport and Phonon Hydrodynamics in Strontium Titanate. Phys. Rev. Lett. 2018, 120, 125901. [Google Scholar] [CrossRef] [PubMed]
- Steigmeier, E.F. Field Effect on the Cochran Modes in SrTiO3 and KTaO3. Phys. Rev. 1968, 168, 523–530. [Google Scholar] [CrossRef]
- Omini, M.; Sparavigna, A. Beyond the isotropic-model approximation in the theory of thermal conductivity. Phys. Rev. B. 1996, 53, 9064–9073. [Google Scholar] [CrossRef]
- Omini, M.; Sparavigna, A. Heat transport in dielectric solids with diamond structure. Nuovo C. D 1997, 19, 1537–1564. [Google Scholar]
- Broido, D.A.; Ward, A.; Mingo, N. Lattice thermal conductivity of silicon from empirical interatomic potentials. Phys. Rev. B 2005, 72, 014308. [Google Scholar] [CrossRef]
- Lazar, I.; Szot, K.; Roleder, K. Influence of Defects-Induced Stresses on Birefringence in SrTiO3 Single Crystals. Crystals 2023, 13, 985. [Google Scholar] [CrossRef]
- Geday, M.A.; Kaminsky, W.; Lewis, J.G.; Glazer, A.M. Images of absolute retardance L. Deltan, using the rotating polariser method. J. Microsc. 2000, 198, 1–9. [Google Scholar] [CrossRef] [PubMed]
- Glazer, A.; Lewis, J.; Kaminsky, W. An automatic optical imaging system for birefringent media. Proc. R. Soc. Lond. Ser. A Math. Phys. Eng. Sci. 1996, 452, 2751–2765. [Google Scholar]
- Kustov, S.; Liubimova, I.; Salje, E.K.H. Domain Dynamics in Quantum-Paraelectric SrTiO3. Phys. Rev. Lett. 2020, 124, 016801. [Google Scholar] [CrossRef]
Figure 1.
(left) Derivative of the transverse acoustic mode with respect to momentum q. (right) Derivative of the transverse optic mode with respect to momentum q for multiple temperatures as indicated by the different colors.
Figure 1.
(left) Derivative of the transverse acoustic mode with respect to momentum q. (right) Derivative of the transverse optic mode with respect to momentum q for multiple temperatures as indicated by the different colors.

Figure 2.
Size of polar (black) and elastically (red) distorted clusters as a function of temperature. The inset shows the same dependence with a subtracted background as marked by red and black horizontal lines. The sizes are derived from the inverse momentum values a = 1/qc as defined in the text. Since these values are derived from an isotropic three-dimensional integration in q space, the related objects seem to have a bubble-type shape. This changes when anisotropic but ill-defined integration is used, which yields cigar-shaped domains.

Figure 3.
Elastic and polar domain sizes as a function of temperature for low temperatures. The dashed vertical lines indicate the different regions discussed in the text.
Figure 3.
Elastic and polar domain sizes as a function of temperature for low temperatures. The dashed vertical lines indicate the different regions discussed in the text.

Figure 4.
Temperature dependence of the squared soft modes of STO. Red lines are guides to the eye.

Figure 5.
Temperature dependence of the thermal conductivity of STO in the range 2–300 K. The inset displays the temperature regime close to the cubic-to-tetragonal phase transition.
Figure 5.
Temperature dependence of the thermal conductivity of STO in the range 2–300 K. The inset displays the temperature regime close to the cubic-to-tetragonal phase transition.

Figure 6.
The transverse optic and acoustic mode frequencies as a function of temperature.

Figure 7.
Inverse thermal conductivity κ as a function of temperature. The red line is a linear fit to the experiential data above 200 K with an intersection 1/κ = 0 at −106 K. In the inset, Δ represents the difference between the experimental data and the red line. Δ disappears at approximately 160 K on heating, which coincides with the disappearance of birefringence (see Figure 8).

Figure 8.
(Lower) Birefringence Δn as a function of temperature for a [100] oriented STO single crystal. The dashed lines indicate the temperature region where deviations from Landau’s theory occur. The images taken at 80 K (Upper) show a single domain region (seen as a homogeneous shadowed rectangle of 190 × 140 µm2 size) within a region with a dense domain structure. Δn values versus temperature were calculated for these rectangles.

Figure 9.
Double logarithmic plot of the birefringence Δn as a function of the reduced temperature t. If it is assumed that below the continuous transition, the critical exponent can be computed from the relationship Δn(T) ~ (TS – T)2β, we find β to be almost 0.5 below 99 K.
Figure 9.
Double logarithmic plot of the birefringence Δn as a function of the reduced temperature t. If it is assumed that below the continuous transition, the critical exponent can be computed from the relationship Δn(T) ~ (TS – T)2β, we find β to be almost 0.5 below 99 K.

Disclaimer/Publisher’s Note: The statements, opinions and data contained in all publications are solely those of the individual author(s) and contributor(s) and not of MDPI and/or the editor(s). MDPI and/or the editor(s) disclaim responsibility for any injury to people or property resulting from any ideas, methods, instructions or products referred to in the content. |
© 2024 by the authors. Licensee MDPI, Basel, Switzerland. This article is an open access article distributed under the terms and conditions of the Creative Commons Attribution (CC BY) license (https://creativecommons.org/licenses/by/4.0/).
Share and Cite
MDPI and ACS Style
Bussmann-Holder, A.; Kremer, R.K.; Roleder, K.; Salje, E.K.H. SrTiO3: Thoroughly Investigated but Still Good for Surprises. Condens. Matter 2024, 9, 3. https://doi.org/10.3390/condmat9010003
AMA Style
Bussmann-Holder A, Kremer RK, Roleder K, Salje EKH. SrTiO3: Thoroughly Investigated but Still Good for Surprises. Condensed Matter. 2024; 9(1):3. https://doi.org/10.3390/condmat9010003
Chicago/Turabian StyleBussmann-Holder, Annette, Reinhard K. Kremer, Krystian Roleder, and Ekhard K. H. Salje. 2024. "SrTiO3: Thoroughly Investigated but Still Good for Surprises" Condensed Matter 9, no. 1: 3. https://doi.org/10.3390/condmat9010003