PaddyCheck—An Instrument for Rice Quality Determination

 , and
, and
Abstract
:1. Introduction
2. Materials and Methods
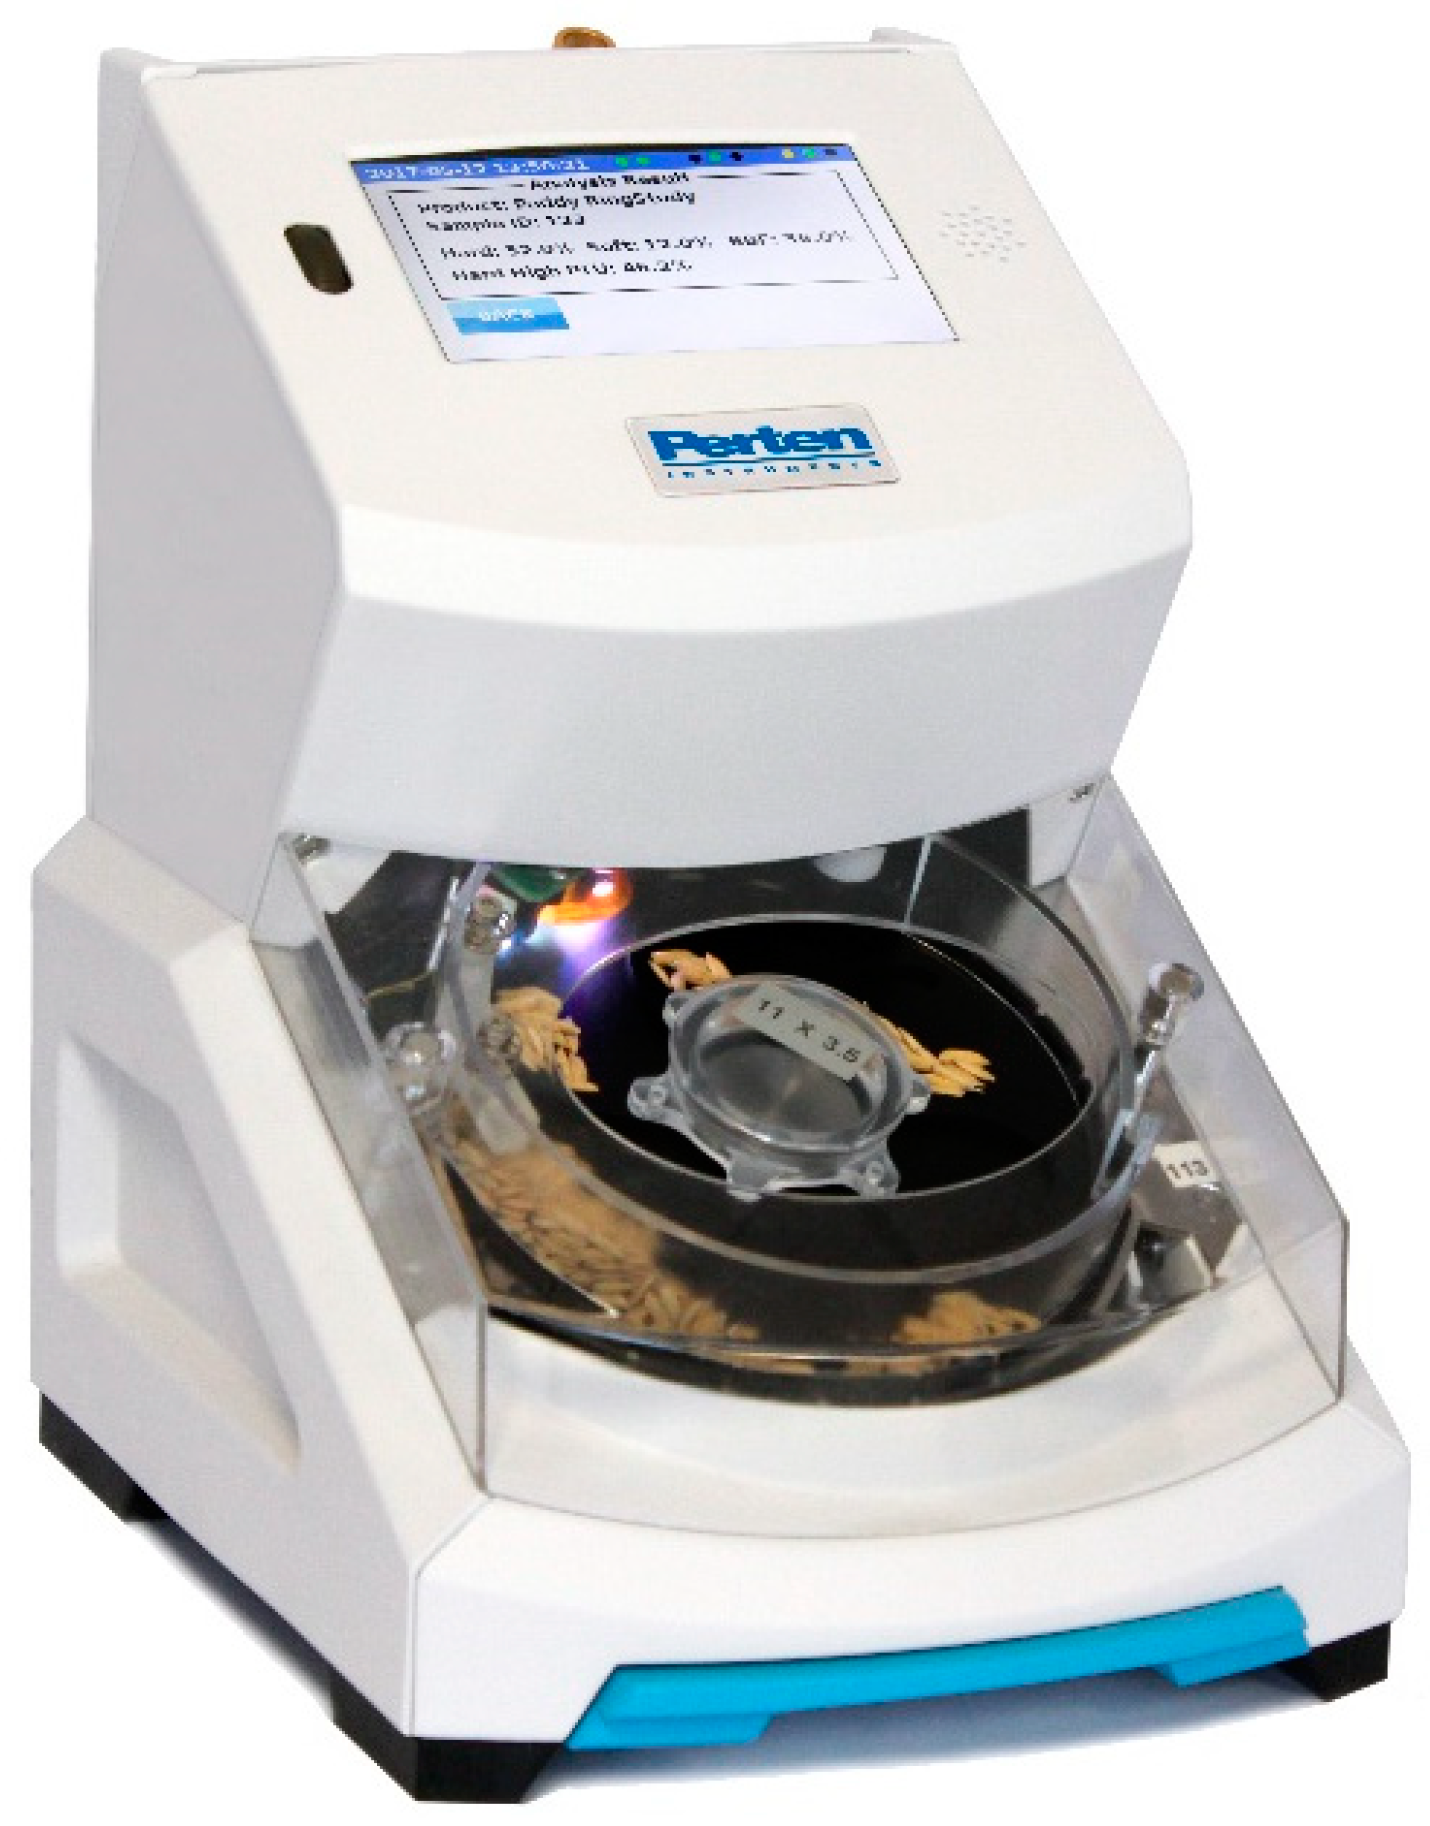
2.1. Mechanics
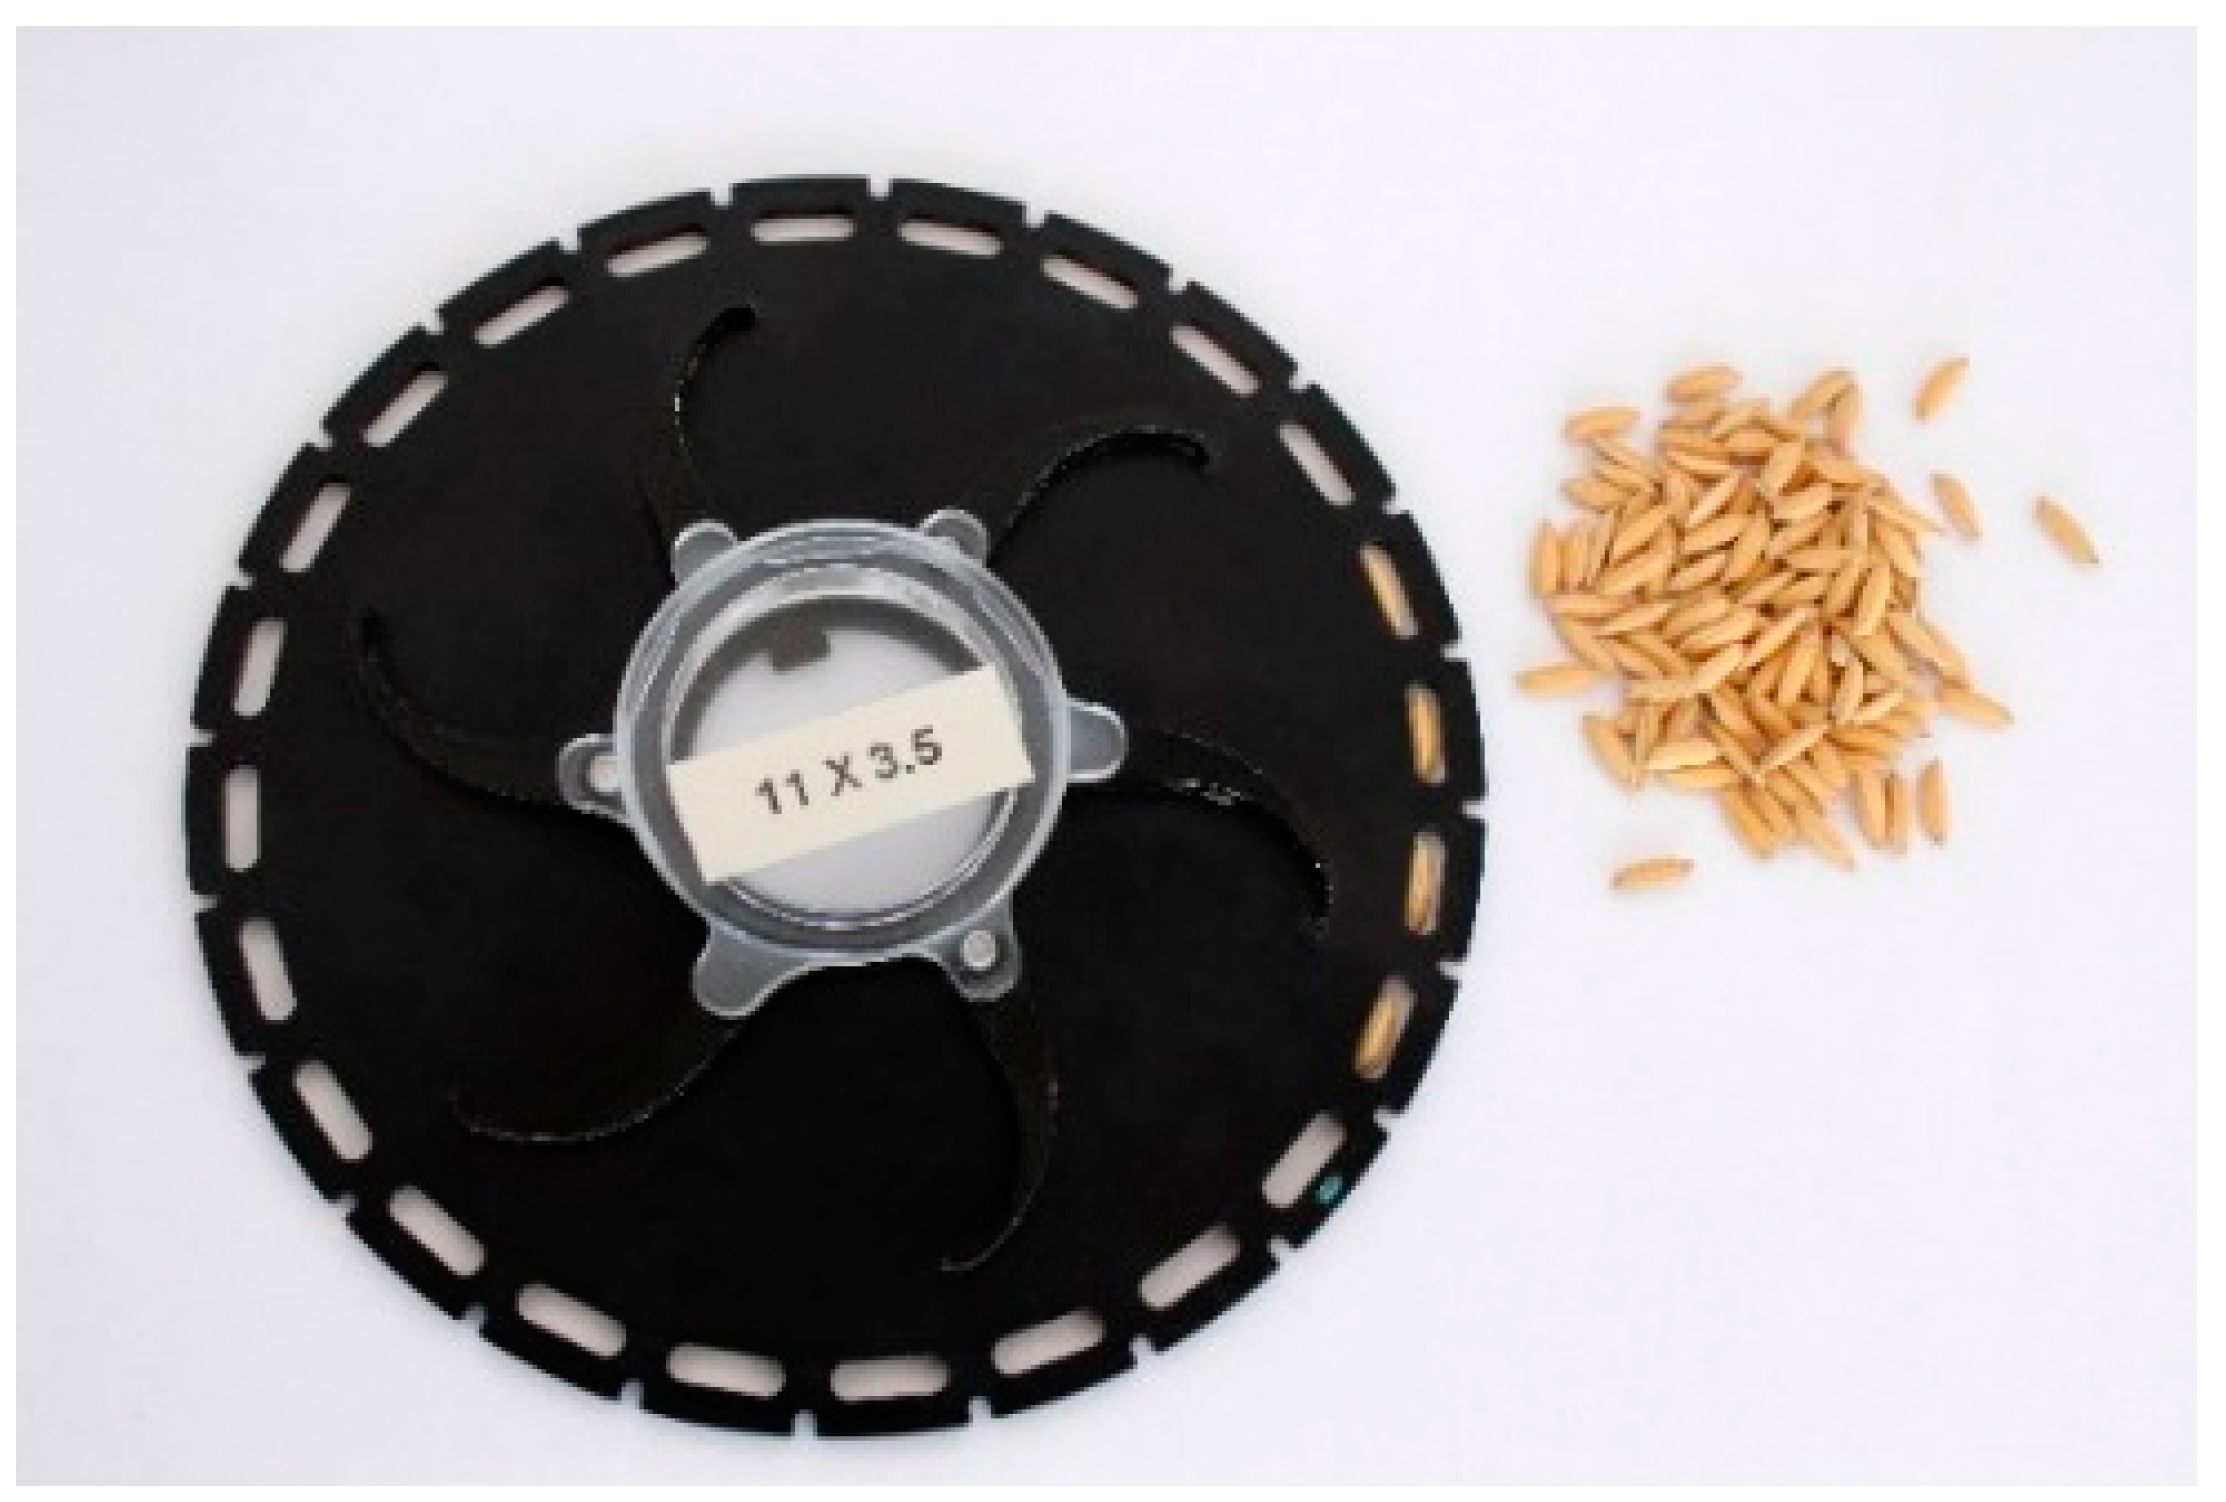
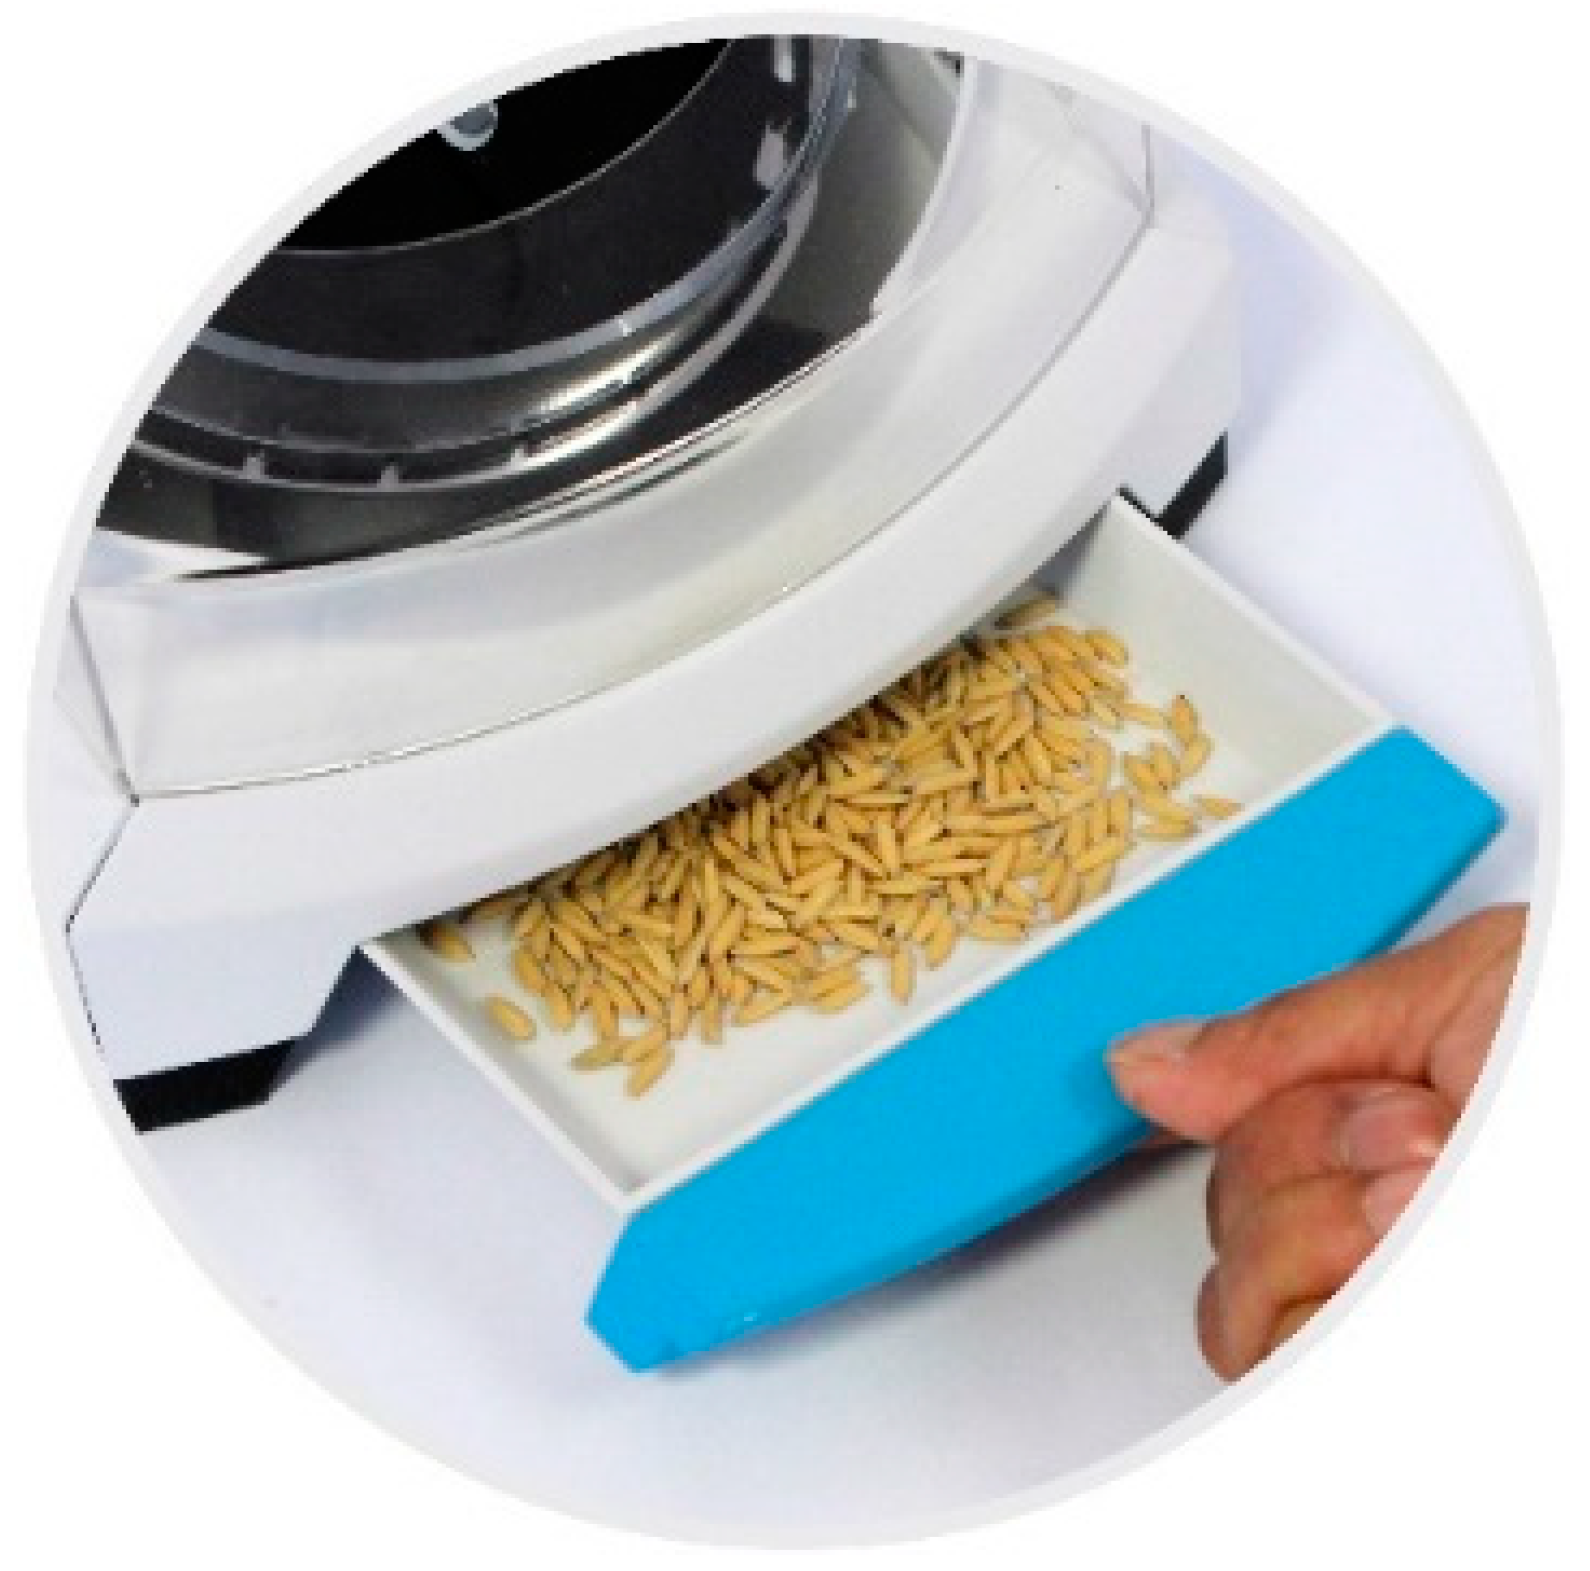
2.2. Singulation
2.3. Measurements
2.4. Calibration Procedure
2.5. Firmware
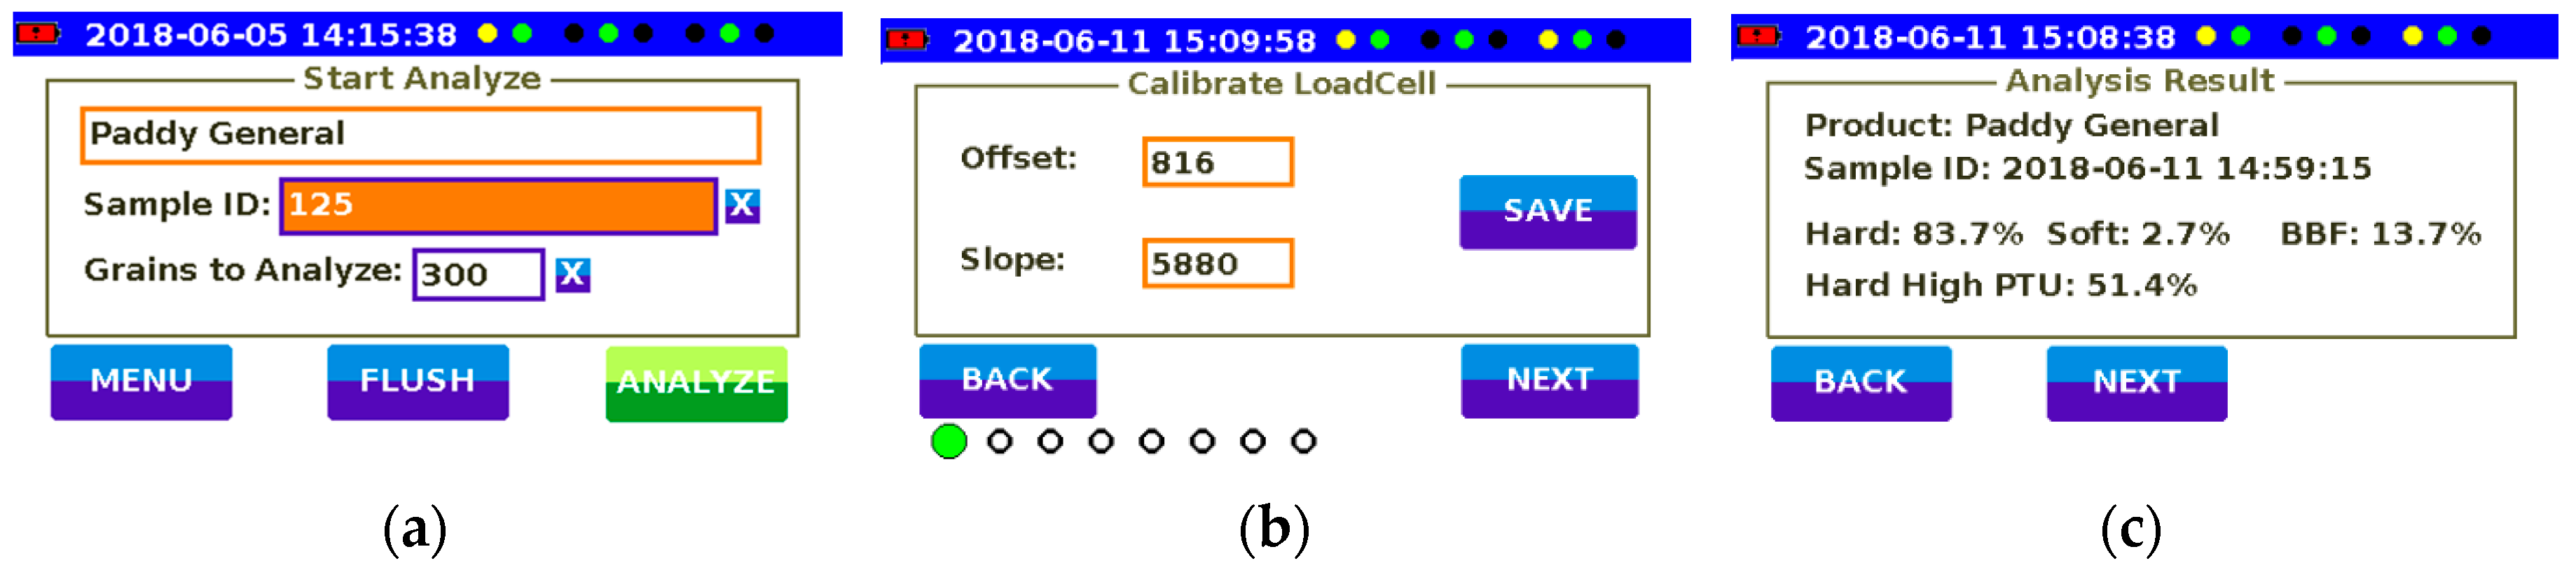
2.6. Software
3. Results
4. Discussion
Acknowledgments
Conflicts of Interest
References
- USDA Foreign Agricultural Service. Grain: World Markets and Trade; USDA Foreign Agricultural Service: Washington, DC, USA, 2018.
- Food and Agriculture Organization of the United Nations. Rice Market Monitor; Food and Agriculture Organization of the United Nations: Rome, Italy, 2017. [Google Scholar]
- Bhattacharya, K.R. Rice Quality—A Guide to Rice Properties and Analysis; Woodhead Publishing: Cambridge, UK, 2011. [Google Scholar]
- Fitzgerald, M. Rice: Grain-quality characteristics and management of quality requirements. In Cereal Grains—Assessing and Managing Quality, 2nd ed.; Wrigley, C., Batey, I., Miskelly, D., Eds.; Woodhead Publishing: Cambridge, UK, 2017; pp. 291–314. [Google Scholar]
- ISO Copyright Office. Rice—Determination of the Potential Milling Yield from Paddy and from Husked Rice; ISO Copyright Office: Berne, Switzerland, 2011. [Google Scholar]
- Bonazzi, C.; du Peuty, M.A.; Themelin, A. Influence of drying conditions on the processing quality of rough rice. Dry. Technol. 1997, 15, 1141–1157. [Google Scholar] [CrossRef]
- Cnossen, A.G.; Jiménez, M.J.; Siebenmorgen, T.J. Rice fissuring response to high drying and tempering temperatures. J. Food Eng. 2003, 59, 61–69. [Google Scholar] [CrossRef] [Green Version]
- Cooper, N.T.W.; Siebenmorgen, T.J. Correcting head rice yield for surface lipid content (degree of milling) variation. Cereal Chem. 2007, 84, 88–91. [Google Scholar] [CrossRef]
- Mobasher Amini, M.; Alizadeh, M.R.; Padasht, F.; Elahinia, S.A.; Khodaparast, S.A. Rice grain discoloration effect on physical properties and head rice yield in three rice cultivars. Q. Assur. Saf. Crops Foods 2016, 8, 283–288. [Google Scholar] [CrossRef]
- Aquerreta, J.; Iguaz, A.; Arroqui, C.; Vírseda, P. Effect of high temperature intermittent drying and tempering on rough rice quality. J. Food Eng. 2007, 80, 611–618. [Google Scholar] [CrossRef]
- Buggenhout, J.; Brijs, K.; Delcour, J.A. The breakage susceptibility of raw and parboiled rice: A review. J. Food Eng. 2013, 117, 304–315. [Google Scholar] [CrossRef]
- Goodman, D.E.; Rao, R.M. Effect of grain type and milled rice kernel hardness on the head rice yields. J. Food Sci. 1985, 50, 840. [Google Scholar] [CrossRef]
- Qin, G.; Siebenmorgen, T.J. Harvest location and moisture content effects on rice kernel-to-kernel breaking force distributions. Appl. Eng. Agric. 2005, 21, 1011–1016. [Google Scholar] [CrossRef]
- Zhou, L.; Liang, S.; Ponce, K.; Marundon, S.; Ye, G.; Zhao, X. Factors affecting head rice yield and chalkiness in indica rice. Field Crops Res. 2015, 172, 1–10. [Google Scholar] [CrossRef]
- Nagato, K. On the hardness of rice endosperm. Jpn. J. Crop Sci. 1962, 31, 102–107. [Google Scholar] [CrossRef]
- Ashida, K.; Iida, S.; Yasui, T. Morphological, physical and chemical properties of grain and flour from chalky rice mutants. Cereal Chem. 2009, 86, 225–231. [Google Scholar] [CrossRef]
- Lisle, A.J.; Martin, M.; Fitzgerald, M.A. Chalky and translucent rice ggrains differ in starch composition and structure and cooking properties. Cereal Chem. 2000, 77, 627–632. [Google Scholar] [CrossRef]
- Tashiro, T.T.; Wardlaw, I.F. The effect of high temperature on kernel dimensions and the type and occurrence of kernel damage in rice. Aust. J. Agric. Res. 1991, 42, 485–496. [Google Scholar] [CrossRef]
- Del Rosario, A.R.; Briones, V.P.; Vidal, A.J.; Juliano, B.O. Composition and endosperm structure of developing and mature rice kernel. Cereal Chem. 1968, 45, 225–235. [Google Scholar]
- Tashiro, T.; Ebata, M. Studies on white belly rice kernel iii. Effect of ripening conditions on occurrence of white belly kernel. Proc. Crop Sci. Soc. 1975, 44, 86–92. [Google Scholar] [CrossRef]
- Ikehashi, H.; Khush, G.S. Methodology of assessing appearance of the rice grain, including chalkiness and whiteness. In Proceedings of the Workshop on Chemical Aspects of Rice Grain Quality; International Rice Research Institute: Los Baños, Philippines, 1979; pp. 223–229. [Google Scholar]
- Guangrong, L. Detection of chalk degree of rice based image processing. In Proceedings of the International Conference on Intelligence Science and Information Engineering (ISIE), Wuhan, China, 20–21 August 2011; pp. 515–518. [Google Scholar]
- Lu, R.; Siebenmorgen, T.J. Correlation of head rice yield to selected physical and mechanical properties of rice kernels. Trans. ASAE 1995, 38, 889–894. [Google Scholar] [CrossRef]
- Fang, C.; Hu, X.; Sun, C.; Duan, B.; Xie, L.; Zhou, P. Simultaneous determination of multiple rice quality parameters using image analysis method. Food Anal. Methods 2015, 8, 70–78. [Google Scholar] [CrossRef]


| Length | Width | Thickness | |
|---|---|---|---|
| Paddy/Rough | 6–11 mm | 1–3.4 mm | 1–3.4 mm |
| Brown | 5–9 mm | 1–3.3 mm | 1–3.3 mm |
| Graphical Menus | |
| Gallery | All images from both the normal and polarized camera |
| Grain | The images and texture graph of the specific kernel chosen |
| Frequency Image | Histograms of the complete sample on length, width, thickness, dark pixels and RGB means for the red, green and blue channels from both cameras |
| Frequency Force/Image | Histograms and numbers of broken and hard kernels in the chosen sample folder; and circle diagrams of both high vs low PTU and of the ratio between hard, soft and broken kernels |
| Predicted Results | Circle diagrams of both high vs low PTU and of the ratio between hard, soft and broken kernels from the complete original sample |
| Numerical Menus | |
| Instrument Settings | Instrument id and serial number, force calibration data and firmware version |
| Sample Summary | Sample-id, starting date and time of measurement, numbers of kernels analysed, cavity fill ratio, numbers of kernels that are Hard, Soft, Broken by force and Hard High PTU |
| Grain data–#2 | Individual kernel results, such as number, date and time, for measurement, length, width and thickness; true/false indicator if the specific kernel is hard, soft or broken. For broken kernels, the breaking force is noted. Low/high PTU |
| Product Profile | Test profile and singulation disc settings |
© 2018 by the authors. Licensee MDPI, Basel, Switzerland. This article is an open access article distributed under the terms and conditions of the Creative Commons Attribution (CC BY) license (http://creativecommons.org/licenses/by/4.0/).
Share and Cite
Purhagen, J.; Loosme, R.; Wihlborg, N.; Fjällström, J.; Åberg, P.; Andrén, H.; Wihlborg, G.; Mikaelsson, T.; Lagerholm, M.; Lindwall, F. PaddyCheck—An Instrument for Rice Quality Determination. Instruments 2018, 2, 11. https://doi.org/10.3390/instruments2030011
Purhagen J, Loosme R, Wihlborg N, Fjällström J, Åberg P, Andrén H, Wihlborg G, Mikaelsson T, Lagerholm M, Lindwall F. PaddyCheck—An Instrument for Rice Quality Determination. Instruments. 2018; 2(3):11. https://doi.org/10.3390/instruments2030011
Chicago/Turabian StylePurhagen, Jeanette, Raivo Loosme, Nils Wihlborg, Jenny Fjällström, Peter Åberg, Henrik Andrén, Gunnel Wihlborg, Torbjörn Mikaelsson, Martin Lagerholm, and Frans Lindwall. 2018. "PaddyCheck—An Instrument for Rice Quality Determination" Instruments 2, no. 3: 11. https://doi.org/10.3390/instruments2030011