Instrumentation for Simultaneous Non-Destructive Profiling of Refractive Index and Rare-Earth-Ion Distributions in Optical Fiber Preforms


Optoelectronics Research Centre (ORC), University of Southampton B53, Southampton SO17 1BJ, UK
*
Author to whom correspondence should be addressed.
Instruments 2018, 2(4), 23; https://doi.org/10.3390/instruments2040023
Submission received: 19 October 2018
/
Revised: 1 November 2018
/
Accepted: 2 November 2018
/
Published: 7 November 2018
(This article belongs to the Special Issue Photonic Devices Instrumentation and Applications)
Abstract
:We present a non-destructive technique for a combined evaluation of refractive index and active-dopant distribution in the same position along a rare-earth-doped optical fiber preform. The method relies on luminescence measurements, analyzed through an optical tomography technique, to define the active dopant distribution and ray-deflection measurements to calculate the refractive index profile. The concurrent evaluation of both the preform refractive index and the active dopant profiles allows for an accurate establishment of the dopant distribution within the optical core region. This combined information is important for the optimization and development of a range of advanced fibers, used, for example, in a high-power fiber lasers and modern spatial-division-multiplexing optical communication systems. In addition, the non-destructive nature allows the technique to be used to identify the most appropriate preform segment, thus increasing fiber yield and reducing development cycles. We demonstrate the technique on an Yb3+-doped aluminosilicate fiber preform and compare it with independent refractive index and active-dopant measurements. This technique will be useful for quality evaluation and optimization of optical fiber preforms and lends itself to advanced instrumentation.
1. Introduction
Fiber lasers and amplifiers have reached out and truly transformed a number of diverse engineering sectors, such as industrial material processing (e.g., micromachining, welding, engraving, and cutting [1]), civil applications (e.g., telecommunications, medical imaging, and surgery [2]), environmental monitoring (e.g., temperature detection and radiation dosimetry [3,4]), and even devices suitable for space missions (e.g., gyroscopes and amplifiers [5,6]). The high performance achieved by these devices, such as high gain, near diffraction-limited beam quality, and unprecedented output stability, relies on the accurate control of physical characteristics of the optical fibers and the rare-earth (RE) dopants used as the active medium [7].
In order to further enhance the performance of RE-doped fiber-based devices, a number of features, such as advanced pumping schemes and fiber designs with improved optical properties, should be developed. In particular, improvement of the RE-doped fibers and fiber production scaling up are closely linked to the optimization of the manufacturing of the preforms from which the optical fibers are drawn. This is particularly relevant in the case of the conventional and widely used active fiber fabrication method, based on the modified-chemical vapor deposition (MCVD) combined with an RE-doping solution [8,9]. In fact, the applicability and efficiency of this method can be potentially compromised by the limited solubility of the RE-ions in the vitreous matrices and lack of uniformity of the physical properties along the preform length [10].
The physical properties to be evaluated in RE-doped optical fibers, which are important to predict the overall optical performance of the fiber-based devices, are the refractive index (RI) and the active dopant (AD) profiles of the optical core. This becomes more important in the case of fiber amplifiers for the emerging spatial-division-multiplexed optical telecommunication systems and high power lasers, where spatial overlap between supported modes and active dopants define the modal gain distribution [11,12], as well as the overall efficiency and stability [7]. A number of profiling techniques have been used so far to determine these distributions, both in fibers and in preforms [13,14]. Each measurement method has its own specific characteristics, such as spatial resolution, sources and detection schemes, sample preparation, sensitivity to different dopants, instrumentation costs, and complexity. Also, important to consider is the degree of invasiveness of the technique with respect to the sample to be tested. This aspect is particularly important for characterization carried out on preforms, as a non-destructive investigation allows identifying and preserving those parts of the preform best-suited for fiber drawing, thus improving the overall fiber yield and quality. In addition, the optimization process of novel optical fibers usually involves a number of fabrication iterations, and as such, it can be greatly facilitated by the availability of high quality characterization data at the preform level.
For the RI profile evaluation, transversal and non-destructive methods exist, based on ray-deflection measurements for preforms [15,16,17] or on quantitative phase microscopy [18] for optical fibers. Regarding the AD distribution measurements in preforms, several techniques have been employed, such as secondary ion mass spectroscopy (SIMS) [19], X-ray microprobe spectroscopy (XMS) [20], electron probe microanalysis (EPMA) combined with energy dispersive X-ray analysis (EDX) or wavelength dispersive X-ray analysis (WDX) [21], and micro-fluorescence-induced laser-scanning microscopy (LSM) [22]. However, all these methods are time-consuming and destructive, requiring cutting and polishing of preform slices.
In this work, we have applied emission computerized tomography (e-CT) to visualize the internal microstructure of optical preforms and derive the active dopant distribution. e-CT is a three-dimensional (3-D) image representation technique, which is widely used for plasma diagnostics [23] or combustion analysis [24], but is still underused in the materials science field. A similar technique has been applied in the study of the spatial distribution of gain in RE-doped optical fiber with good results [25]. However, the obtained information refers to a small length of fiber and does not provide the full picture along the entire preform length.
Our aim is to develop a combined technique, which can non-destructively extract both the RI and AD distributions from the same section of the optical preform. This technique will enable optical fiber manufacturers to select parts of the optical preform that meet their stringent wave guiding and amplification requirements. In Section 2, we illustrate our experimental set-up used for the combined RI and AD profile optical preform characterization. In addition, the physical principles behind the method and the mathematical framework, used for the RI and AD profile evaluation, are summarized. In Section 3 and Section 4, we demonstrate the application of the technique on an Yb-doped aluminosilicate optical preform. Finally, in Section 5, conclusions are provided.
2. Materials and Methods
The combined experimental set-up for the characterization of both the RI and the AD distribution profiles is schematically shown in Figure 1. It sequentially uses the vertical arm for refractive index profiling (by ray-deflection imaging) and the horizontal arm for the active-ion distribution (by dopant photoluminescence imaging) by analyzing the images taken by the same charge-coupled-device (CCD) camera with 3296 × 2472 active pixel area and 5.5 μm × 5.5 μm pixel size. By retrieving the two distributions using the same imaging optics, it ensures that the exact position of the active dopants within the RI profile is determined.
2.1. Refractive Index Profiling: Principle of Operation
The refractive index profile is determined by using a ray-focusing method [26]. The preform is transversally illuminated by a white-light (WL) source beam collimated by spherical lens L1. As the incoming parallel rays cross the sample, the variations in the refractive-index distribution encountered in their path generates a small deflection. The ray deflection was made visible and quantifiable by the insertion of a knife-edge filter, acting as spatial filter, in the optical path between the sample and the detector just before the focusing lens L4 [16]. The filtered image was detected by the CCD camera. Figure 2a shows a simplified schematic demonstrating the ray-deflection φ(ρ) through the core of an optical preform.
By assuming small core/cladding refractive index differences, the paraxial-ray model can be used to describe the ray trajectories through the core in Cartesian coordinates (x,z) as [26]:
where is the cladding refractive index and is the core refractive index variation with . For a ray entering the core at x = ρ, the total ray deflection φ(ρ) after the ray has traversed the core is obtained by integrating Equation (1), namely:
The integral in Equation (2) can be inverted to provide the core refractive index distribution in terms of the deflection distribution φ(ρ), as [26]:
From Equations (2) and (3), it is evident that Δn(r) and form a mathematical Abel pair, with the Δn(r) function derived by a direct Abel transform of .
The ray deflection can be quantified using a number of different methods [15,16,17]. We opted for the spatial filtering technique [16], because it is compatible and easily combined with the e-CT technique we used for the AD profile characterization. The spatial filtering technique involves the insertion of a knife-edge just before the focusing lens L4. Referring to Figure 2a and ignoring the additional deflection due to cladding/outer space interface, the ray deflection can be approximated as . It should be realized that, due to the axial invariance of the cylindrical core, all rays on the input plane x = ρ experience the same deflection Δx′. As shown in Figure 2b, rays deflected by Δx′ towards the angled knife-edge are blocked over a segment d(ρ) = Δx′/tan(α) and result in an additional shadow “spike” equal to d(ρ) (see Figure 2c). Ray deflection away from the angled filter edge, on the other hand, results in a shadow “indentation” −d(ρ) (see Figure 2c). Therefore, the ray deflections φ(ρ) are defined by measuring the knife-edge shadow excursions d(ρ) as imaged on the CCD camera. They are given by:
As shown in Figure 1, the preform is immersed into a container filled with index-matching oil to avoid additional refraction at the outer cladding surface. However, in calculating the core refractive index n(r) through Equation (3), the additional refraction at the container window/air interface should be taken into account. In this case, the core refractive index n(r) is given by Equation (3) with φ(ρ) now substituted by as given by Snell’s law, i.e.,:
where is the index-matching oil refractive index and φ(ρ) is given by Equation (4).
2.2. Active Dopant Distribution Profiling: Principle of Operation
The AD distribution was evaluated by performing photoluminescence (PL) measurements on the preform. Figure 3 shows a schematic highlighting the AD profiling principle of operation. Two pigtailed pump laser sources at 976 nm were collimated on the optical preform sample from opposite sides in order to achieve a uniform excitation of the doped core. The emitted PL was collected at 90° with respect to the excitation arm by the same cylindrical lens L4 and imaged on the same CCD camera used for the deflection measurements. In this case, the knife-edge filter was removed. The near-infrared (NIR)-emission of Yb3+-ions was monitored using a band-pass filter, centered at 1050 ± 10 nm at the CCD entrance (not shown in Figure 3).
The local PL is proportional to the local upper-state population N2(x,z), which in turn is proportional to the local dopant concentration f(x,z)N0, where f(x,z) is the normalized dopant distribution and N0 is the maximum dopant concentration. A fraction of the spontaneously emitted photons, propagating in a small solid angle in the +z direction, are collected by L4. The local contribution I(x,z) to the total PL is expressed as:
where k is a constant that depends on the dopant emission and absorption cross-sections, and the imaging system collection efficiency. The total PL F(ρ) along the line x = ρ is then approximated using:
where . The accumulated PL F(ρ) is imaged as F(ρ′′) on the CCD plane and used to derive the axially symmetric dopant distribution function f(r). By changing the integration coordinate according to , F(ρ) can be expressed as:
The constant k only scales the magnitude of the detected PL and does not affect its distribution. It is therefore set to one for simplicity. From Equation (8), it is evident that F(ρ) and f(r) are related by the Abel transform. The normalized dopant distribution f(r) is then given by:
The Yb3+-ion distribution f(r) was mathematically evaluated using a MATLAB (Release 2016a, The MathWorks, Inc., Natick, MA, USA) code using a Fourier transform followed by a Hankel transform of the projected PL F(ρ′′) [27], as recorded by the CCD camera and corrected for the imaging system magnification. In particular, the magnification factor (MF) for the NIR imaging was 1.37, while MF was 1.32 for the RI index measurements (visible range).
3. Results
To demonstrate the new technique, we used an optical fiber preform manufactured by a modified chemical vapor deposition (MCVD) process with an optical core made of aluminosilicate glass and doped with Yb3+ by the solution doping technique with a nominal Yb3+ concentration in the low 1026 m−3 range and a pure silica glass cladding of about 1 cm. The approximate nominal core diameter was about 1 mm. This sample was a standard preform for high power laser applications and it was used as a representative sample for demonstrating the application of the optical inspection technique discussed in this work.
The validity of the method was confirmed for both the RI and AD profiles by comparison with independent measurements. The RI profile was compared with that obtained using a commercial analyzer (PK 2600, Photon Kinetics, Beaverton, OR, USA) typically used in industrial refractive index profilers of optical preforms and based on deflection measurements [13]. The AD distribution was validated by a comparison with SIMS analysis carried out over the core of a polished slice of the preform. The characterization was performed in the same section of the optical preform, without moving any part of the experimental set-up, except a small translation of the CCD camera in order to adjust the chromatic dependence of the lens focal length.
3.1. Refractive Index Profiling
Figure 4 shows the results from the successive steps applied to derive the preform RI profile. Figure 4a reports the CCD image obtained with the preform illuminated by the WL source and half-obscured by the knife-edge filter. In the black-and-white edge, the edge modification due to the deflection of the rays traversing the sample is visible. The corresponding deflection angle function is shown in Figure 4b. The integration of that function gives the RI profiles of the core. Figure 4c shows the difference between the core/cladding refractive indices difference Δn(r), calculated using Equation (3). The core edges, which were defined by the first zero-deflection crossing points in the deflection curve (starting from the center), were also delineated using dashed vertical lines at −0.60 mm and +0.60 mm. The uncertainty in defining the core edges was about ±0.02 mm, which was mainly defined by the pixel size of the core CCD camera and the magnification factor of the imaging system. The deflection-angle excursions and the associated RI dipped outside these edges were due to the presence of residual chlorine used for the preparation of the pure silica cladding tube, before deposition, and they were not included in the core radius definition. The value and the associated error in the core edge location were given by averaging the left and right edge position of the optical core.
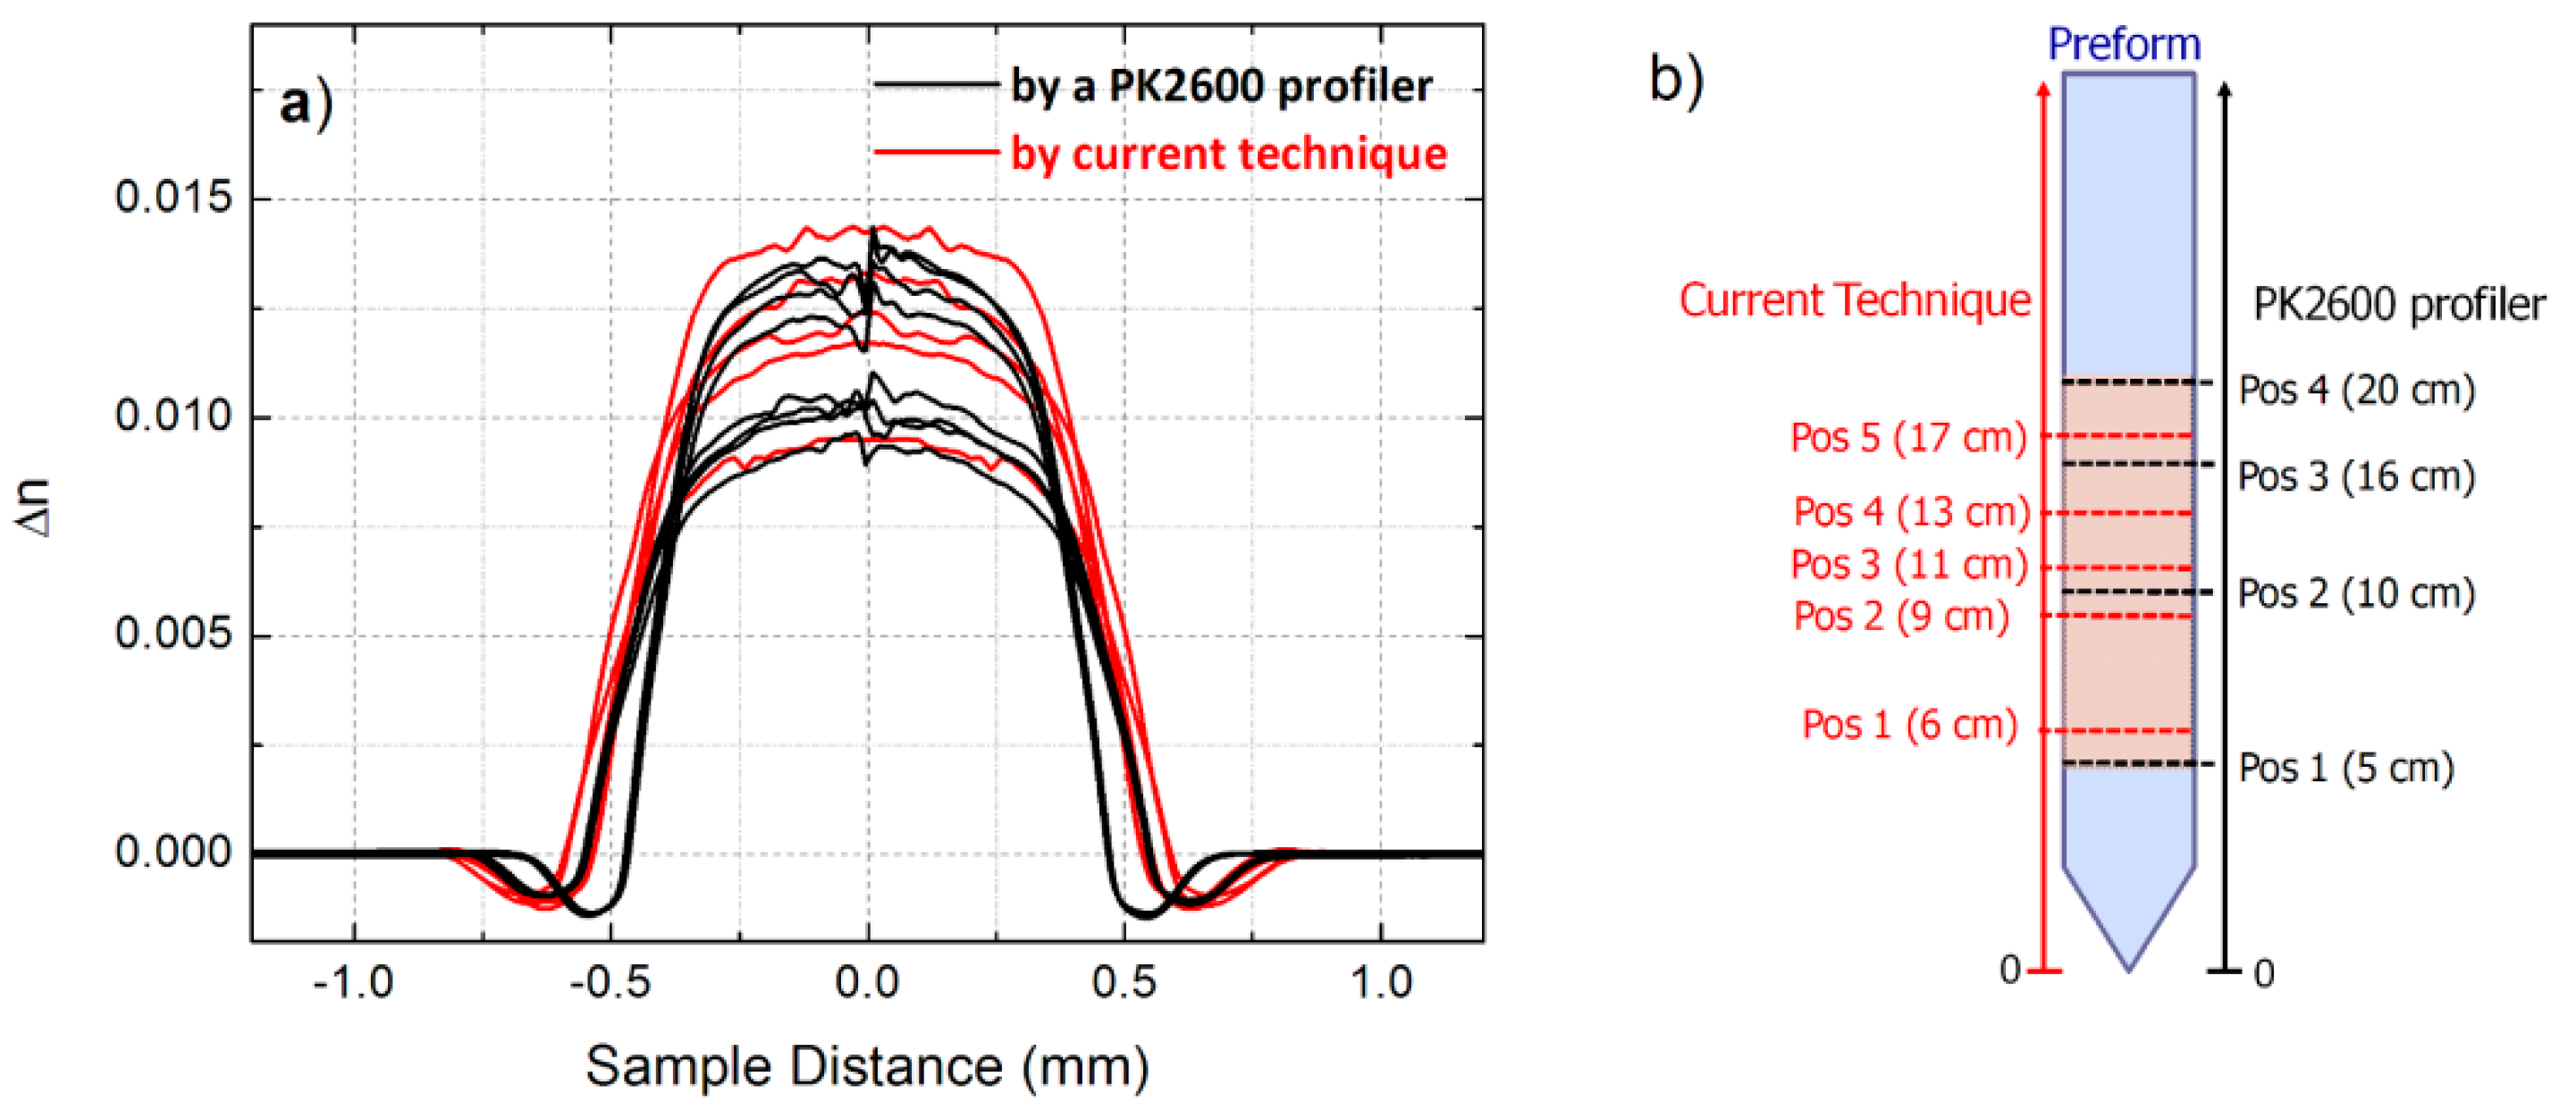
In Figure 5a, we compare the RI-profile obtained using the current technique and that acquired using the commercial analyzer (PK 2600). The set of curves were related to measurements performed in different points along the preform length and with different angles of acquisition, as shown in Figure 5b. Even if the correspondence between the different profiles were not strictly related to the same preform position (the exact position of the PK2600 profiles were not known to us at the time of experimentation), we found a good agreement between the two methods with comparable values for the core size, Δn, and its variability (±0.0025) observed along the preform. Such RI profile variability along the length of the preforms are known to occur with the MCVD fabrication technique.
3.2. Active-Dopant Distribution Profiling
To proceed with the AD profile determination, we first measured theYb3+ PL spectrum under 976 nm excitation with an optical spectrum analyzer (OSA). Figure 6 shows the observed NIR Yb3+ emission spectrum related to the transitions between the excited and the ground states 2F5/2→ 2F7/2. In the inset, the Yb3+ energy sublevels are included. The characteristic emission spectrum shape indicated a high degree of inversion and a lack of significant re-absorption effects, which are important for the accuracy of the AD profiling method.
Figure 7 shows the successive steps used for the AD profile determination. Figure 7a shows the CCD camera image of the filtered PL signal (1050 ± 10 nm) emitted from the pumped preform core. Figure 7b reports the normalized PL profile F(ρ′′) along the central dashed line of the CCD image. The marked core-edge locations correspond to the ones defined during the RI profile characterization (see Figure 4). The reconstruction of the AD profile f(r) across the preform core was carried out by the application of the inverse Abel transform (Equation (9)) using the experimentally obtained PL profile F(ρ′′), shown in Figure 7b. The spatial resolution of the current measurements, imposed by the high spatial frequency filtering during the inverse Abel transform calculation, was 30 μm. The Yb3+ profile follows a substantially uniform distribution across the entire preform core. The small ripples, observed also in the RI profile (see Figure 4c), were due to the multilayer preform deposition followed in the MCVD process. The uniform distribution of the Yb3+-ions was mostly due to the Al co-doping of the silica glass matrix, which is known to increase the RE-ion solubility in comparison with pure silica host matrix.
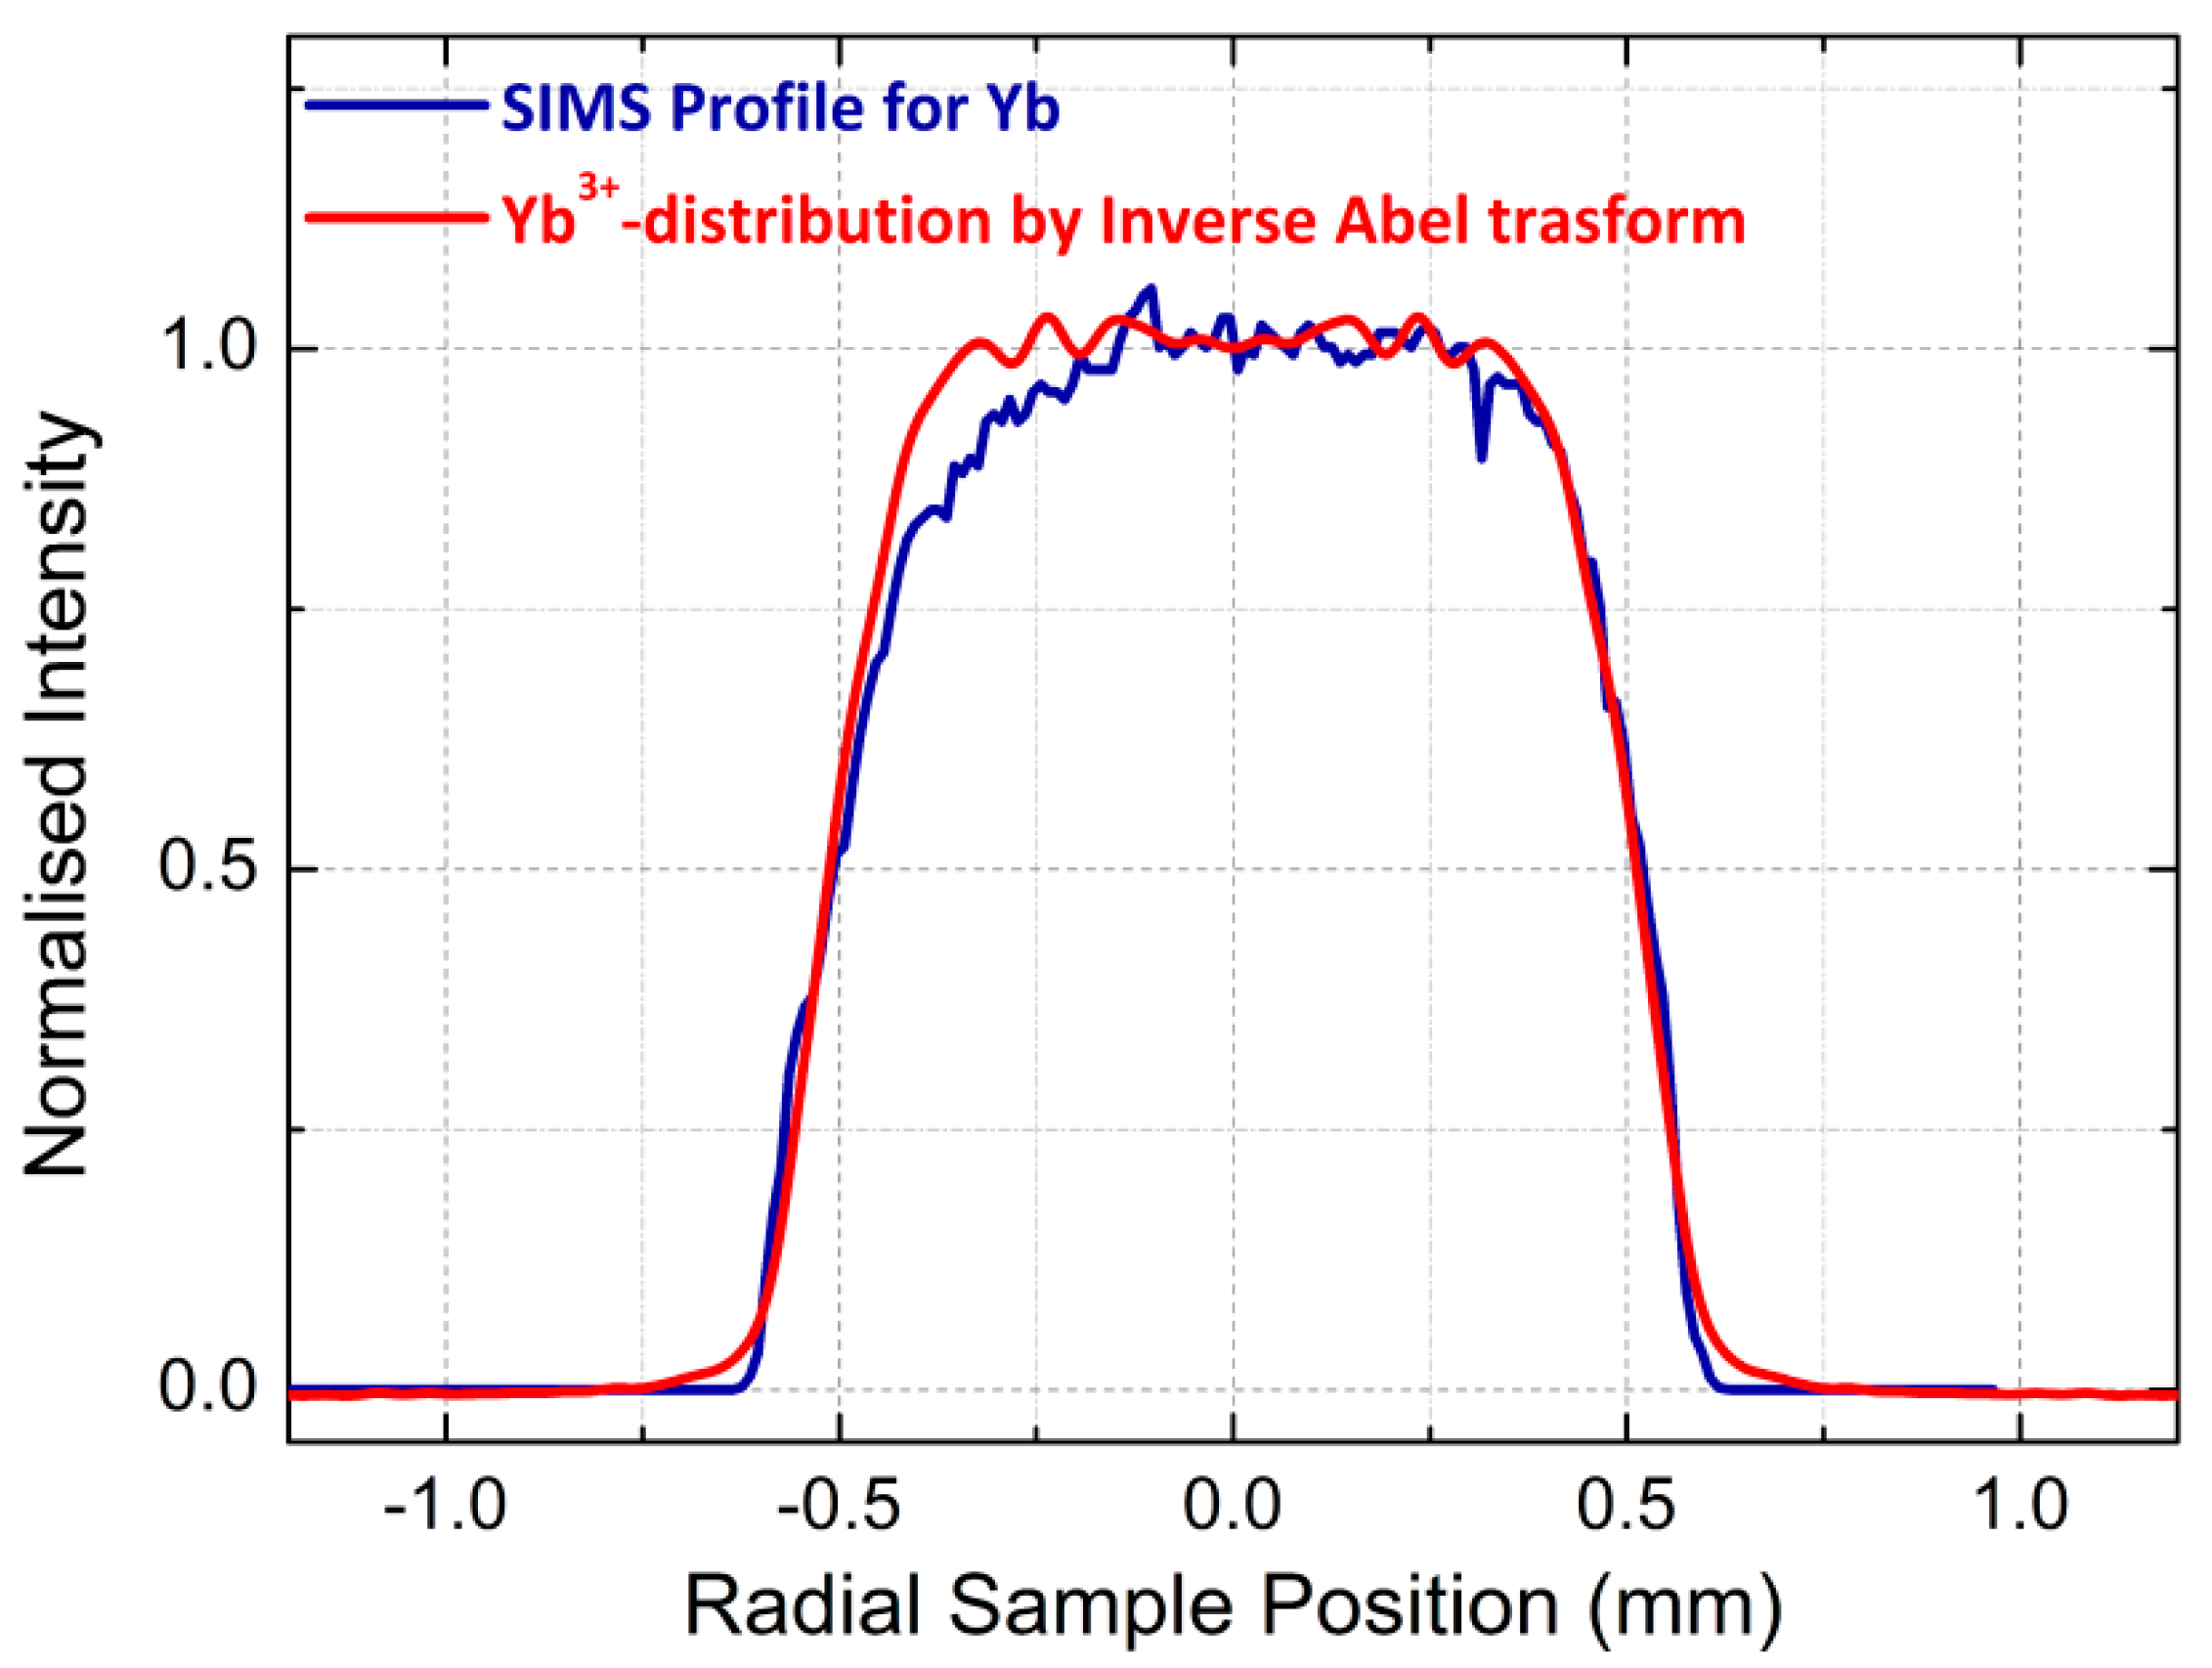
The validity of the current non-destructive AD profile reconstruction was evaluated via a comparison with a microstructural SIMS analysis carried out on the same optical preform after cutting a slice of the sample. The AD profile obtained using the current technique and the SIMS profile are compared in Figure 8, showing a very good agreement between the two techniques.
4. Discussion
The combined determination of the RI and AD profiles within optical preforms allows unambiguous definition of the core edge positions and places the AD distribution accurately within the optical core of the preform. This combined knowledge is particularly important for the optimization of optical fibers for advanced applications requiring novel active fiber designs [28,29,30]. The exact distributions of RI and dopants are critical for achieving modal gain equalization in spatial-division-multiplexing telecom systems [31,32] and novel fibers for mitigating transverse modal instabilities in high power fiber amplifiers [33,34].
The comparison of the RI and AD profiles obtained by the current technique with independent measurements has given a very good agreement, despite the approximations introduced in the models. First, the assumption of no internal NIR absorption in the resulting PL projections onto the CCD camera had a negligible effect on the AD profile reconstruction since the monitored NIR PL was centered around 1050 nm. Second, the assumption of near straight line-of-sight for the launched or emitted photons as they traverse the preform had a minimal impact in the case of samples with small RI variations, as in the case in this paper. For cores with large RI variations, a correction accounting for sizable deflections affecting the PL projection path can be considered [35].
Finally, the pumping arms could combine different pumping wavelengths, e.g., 1480 nm, 976 nm, and 793 nm, in order to simultaneously excite other dopants, such as Tm3+ and Er3+, and detect their emission via the insertion of appropriate band-pass filters in the detection arm. Also, the Yb3+-cooperative up-conversion, which is a signature of the clusters distribution, can be detected using a pump signal at 976 nm and filtering the emitted light in the visible region (~500 nm) of the spectrum [36].
5. Conclusions
In summary, we have developed a non-destructive technique to evaluate the RI and AD profiles inside the core of optical fiber preforms. We have demonstrated the technique by characterizing a typical Yb3+-doped optical preform fabricated using the MCVD and solution doping methods. Both profiles were validated via a comparison with independent measurements carried out using a commercial RI profiler (PK 2600) and a SIMS analysis for the active-dopant distribution. This technique is very useful for optical fiber manufacturers in order to select in advance the parts of the optical fiber preform that meets both the RI and AD distribution requirements. Such information can result in an increase of the drawn active fiber yield and cost reduction.
In addition, the technique can be used to obtain useful information of the distribution of active-ions with respect to the refractive-index profile, which can help in the development of new complex fiber designs, with advanced features such as dopants optimally confined in the core or doped rings surrounding the core. Finally, it is worth noting that this technique can be extended to characterize preforms with different dopants, such as erbium or thulium, by a simple change of excitation laser-line sources and emission filter in the experimental set-up.
Author Contributions
Conceptualization, M.N.Z., Methodology, M.V. and M.N.Z.; Software, M.V.; Validation, M.N.Z.; Formal Analysis, M.V. and M.N.Z.; Investigation, M.V.; Data Curation, M.V.; Writing-Original Draft Preparation, M.V.; Writing-Review & Editing M.V. and M.N.Z.; Visualization, X.X.; Supervision, M.N.Z.; Project Administration, M.N.Z.; Funding Acquisition, M.N.Z.
Funding
This research was funded by the Engineering and Physical Sciences Research Council (EPSRC) EP/M020770/1 and in-part by the Royal Academy of Engineering (RAEng) Research Chairs and Senior Research Fellowships Scheme. The data can be found in https://doi.org/10.5258/SOTON/D0701.
Acknowledgments
The authors would like to thank Jayanta K. Sahu for providing the sample preform and for useful discussions. Pranabesh Barua also acknowledged for sample preparation. The accession numbers will be provided during review.
Conflicts of Interest
The authors declare no conflict of interest. The funders had no role in the design of the study; in the collection, analyses, or interpretation of data; in the writing of the manuscript, or in the decision to publish the results.
References
- SPI Lasers. Available online: https://www.spilasers.com/ (accessed on 4 November 2018).
- Willner, A.E.; Byer, R.L.; Chang-Hasnain, C.J.; Forrest, S.R.; Kressel, H.; Kogelnik, H.; Tearney, G.J.; Townes, C.H.; Zervas, M.N. Optics and Photonics: Key Enabling Technologies. Proc. IEEE 2012, 100, 1604–1643. [Google Scholar] [CrossRef]
- Baek, S.; Jeong, Y.; Nilsson, J.; Sahu, J.K.; Lee, B. Temperature-dependent fluorescence characteristics of an ytterbium-sensitized erbium-doped silica fiber for sensor applications. Opt. Fiber Technol. 2006, 12, 10–19. [Google Scholar] [CrossRef]
- Vedda, A.; Chiodini, N.; Di Martino, D.; Fasoli, M.; Keffer, S.; Lauria, A.; Martini, M.; Moretti, F.; Spinolo, G.; Nikl, M.; et al. Ce3+-doped fibers for remote radiation dosimetry. Appl. Phys. Lett. 2004, 85, 6356–6358. [Google Scholar] [CrossRef]
- Yu, A.W.; Krainak, M.A.; Stephen, M.A.; Chen, J.R.; Coyle, B.; Numatam, K.; Camp, J.; Abshire, J.B.; Allan, G.R.; Li, S.X.; et al. Fiber lasers and amplifiers for space-based science and exploration. Proc. SPIE 2012, 8237, 823713. [Google Scholar] [CrossRef]
- Girard, S.; Vivona, M.; Laurent, A.; Cadier, B.; Marcandella, C.; Robin, T.; Pinsard, E.; Boukenter, A.; Ouerdane, Y. Radiation hardening techniques for Er/Yb-doped optical fibers and amplifiers for space application. Opt. Express 2012, 20, 8457–8465. [Google Scholar] [CrossRef] [PubMed]
- Zervas, M.N.; Codemard, C.A. High Power Fiber Lasers: A Review. IEEE J. Sel. Top. Quantum Electron. 2014, 20, 0904123. [Google Scholar] [CrossRef]
- Nagel, S.R.; Mac Chesney, J.B.; Walker, K.L. An overview of the modified chemical vapor deposition (MCVD) process and performance. IEEE J. Quantum Electron. 1982, 18, 459–476. [Google Scholar] [CrossRef]
- Townsend, J.E.; PooleS, B.; Payne, D.N. Solution-doping technique for fabrication of Rare Earth-doped optical fibres. Electron. Lett. 1987, 23, 329–331. [Google Scholar] [CrossRef]
- Schuster, K.; Unger, S.; Aichele, C.; Lindner, F.; Grimm, S.; Litzkendorf, D.; Kobelke, J.; Bierlich, J.; Wondraczek, K.; Bartelt, H. Material and technology trends in fiber optics. Adv. Opt. Technol. 2014, 3, 447–468. [Google Scholar] [CrossRef]
- Krummrich, P.M. Spatial multiplexing for high capacity transport. Opt. Fiber Technol. 2011, 17, 480–489. [Google Scholar] [CrossRef]
- Richardson, D.J.; Fini, J.M.; Nelson, L.E. Space-division multiplexing in optical fibres. Nat. Photonics 2013, 7, 354–362. [Google Scholar] [CrossRef] [Green Version]
- Stewart, W.J. Optical fiber and preform profiling technology. IEEE Trans. Microw. Theory Technol. 1982, 30, 1439–1454. [Google Scholar] [CrossRef]
- Sidiroglou, F.; Roberts, A.; Baxter, G. Contributed Review: A review of the investigation of rare-earth dopant profiles in optical fibers. Rev. Sci. Instrum. 2016, 87, 041501. [Google Scholar] [CrossRef] [PubMed] [Green Version]
- Sasaki, I.; Payne, D.N.; Adams, M.J. Measurement of refractive-index profiles in optical-fibre preforms by spatial-filtering technique. Electron. Lett. 1980, 6, 219–221. [Google Scholar] [CrossRef]
- Okoshi, T.; Nishimura, M.; Kosuge, M. Non-destructive measurement of axially non-symmetric refractive-index distribution of optical fibre preforms. Electron. Lett. 1980, 16, 722–723. [Google Scholar] [CrossRef]
- Saekeang, C.; Chu, P.L.; Whitbread, T.W. Nondestructive measurement of refractive index profile and cross-sectional geometry of optical fiber preforms. Appl. Opt. 1980, 19, 2025–2030. [Google Scholar] [CrossRef] [PubMed]
- Roberts, A.; Ampem-Lassen, E.; Barty, A.; Nugent, K.A.; Baxter, G.W.; Dragomir, N.M.; Huntington, S.T. Refractive-index profiling of optical fibers with axial symmetry by use of quantitative phase microscopy. Opt. Lett. 2002, 27, 2061–2063. [Google Scholar] [CrossRef] [PubMed]
- Kagi, N.; Oyobe, A.; Nakamura, K. Gain Characteristics of E3+ doped fiber with a quasi-confined structure. J. Lightwave Technol. 1990, 8, 1319–1322. [Google Scholar] [CrossRef]
- Bowron, D.T.; Newport, R.J.; Rigden, J.S.; Tarbox, E.J.; Oversluizen, M. An X-ray absorption study of doped silicate glass, fibre optic preforms. J. Mater. Sci. 1996, 32, 485–490. [Google Scholar] [CrossRef]
- Aljamimi, S.M.; Yusoff, Z.; Abdul-Rashid, H.A.; KhairulAnuar, M.S.; Muhamad-Yasin, S.Z.; Zulkifli, M.I.; Hanif, S.; Tamchek, N. A fabrication of aluminum doped silica preform using MCVD and solution doping technique: Soot analyses and solution concentration effect. Adv. Mater. Res. 2014, 896, 197–202. [Google Scholar] [CrossRef]
- Perry, I.R.; Tropper, A.C.; Barr, J.R.M. Micro-fluorescence profiling of erbium-doped fibre preforms. J. Lumin. 1994, 59, 39–49. [Google Scholar] [CrossRef]
- Hino, M.; Aono, T.; Nakajima, M.; Yuta, S. Light emission computed tomography system for plasma diagnostics. Appl. Opt. 1987, 26, 4742–4746. [Google Scholar] [CrossRef] [PubMed]
- Uchiyama, H.; Nakajima, M.; Yuta, S. Measurement of flame temperature distribution by IR emission computed tomography. Appl. Opt. 1985, 24, 4111–4116. [Google Scholar] [CrossRef] [PubMed]
- Yablon, A.D. New transverse techniques for characterizing high-power optical fibers. Opt. Eng. 2011, 50, 111603. [Google Scholar] [CrossRef]
- Marcuse, D. Refractive Index determination by focusing method. Appl. Opt. 1979, 18, 9–13. [Google Scholar] [CrossRef] [PubMed]
- Deans, S.R. Radon and Abel Transforms. In The Transforms and Applications Handbook, 2nd ed.; Alexander, D.P., Ed.; CRC Press: Boca Raton, FL, USA, 2000. [Google Scholar]
- Nilsson, J.; Paschotta, R.; Caplen, J.E.; Hanna, D.C. Yb3+-ring-doped fiber for high-energy pulse amplification. Opt. Lett. 1997, 22, 1092–1094. [Google Scholar] [CrossRef] [PubMed]
- Quimby, R.S.; Morse, T.F.; Shubochkin, R.L.; Ramachandran, S. Yb3+ Ring Doping in High-Order-Mode fiber for High-Power 977-nm Lasers and Amplifiers. IEEE J. Quantum Electron. 2009, 15, 12–19. [Google Scholar] [CrossRef]
- Kokki, T.; Koponen, J.; Laurila, M.; Ye, C. Fiber amplifier utilizing an Yb-doped large-mode-area fiber with confined doping and tailored refractive index profile. Proc. SPIE 2010, 7580, 758016. [Google Scholar] [CrossRef]
- Kang, Q.; Lim, E.-L.; Jung, Y.; Sahu, J.K.; Poletti, F.; Baskiotis, C.; Alam, S.; Richardson, D.J. Accurate modal gain control in a multimode erbium doped fiber amplifier incorporating ring doping and a simple LP01 pump configuration. Opt. Express 2012, 20, 20835–20843. [Google Scholar] [CrossRef] [PubMed]
- Ip, E. Gain equalization for few-mode fiber amplifiers beyond two propagating mode groups. IEEE Photonics Technol. Lett. 2012, 24, 1933–1936. [Google Scholar] [CrossRef]
- Hansen, K.R.; Alkeskjold, T.T.; Broeng, J.; Lægsgaard, J. Thermally induced mode coupling in rare-earth doped fiber amplifiers. Opt. Lett. 2013, 37, 2382–2384. [Google Scholar] [CrossRef] [PubMed]
- Robin, C.; Dajani, I.; Pulford, B. Modal instability-suppressing, single-frequency photonic crystal fiber amplifier with 811 W output power. Opt. Lett. 2014, 39, 666–669. [Google Scholar] [CrossRef] [PubMed]
- Vest, C.M. Interferometry of strongly refracting axisymmetric phase objects. Appl. Opt. 1975, 14, 1601–1606. [Google Scholar] [CrossRef] [PubMed]
- Vivona, M.; Kim, J.; Zervas, M.N. Non-destructive characterization of rare-earth-doped optical fiber preforms. Opt. Lett. 2018, 37, 2382–2384. [Google Scholar] [CrossRef] [PubMed]
Figure 1.
Experimental setup for combined profiling of refractive index (vertical arm) and active-ion (horizontal arm) profiles of optical preforms. (BP = band-pass, L = lens, WL = white light).
Figure 1.
Experimental setup for combined profiling of refractive index (vertical arm) and active-ion (horizontal arm) profiles of optical preforms. (BP = band-pass, L = lens, WL = white light).

Figure 2.
(a) Simplified schematic of collimated-ray deflection φ(ρ) through the core of an optical preform, (b) deflection visualization by the use of a spatial filter (knife-edge) placed at an angle α between the filter edge and the y′-axis, and (c) geometric shadow modifications d(ρ) as a result of ray deflections. L is the distance between the preform core center and the filter.

Figure 3.
Working principle for the determination of the active dopant distribution f(r) in the preform core. An inverse Abel transform was used on the detected projected curve F(ρ′′) related to the Yb-ion emission signal.
Figure 3.
Working principle for the determination of the active dopant distribution f(r) in the preform core. An inverse Abel transform was used on the detected projected curve F(ρ′′) related to the Yb-ion emission signal.

Figure 4.
(a) Charge-coupled-device (CCD) image of the sample as-illuminated with a half-part obscured by a knife-edge filter, (b) deflection angle function extrapolated by the black-and-white profile in the CCD acquisition, and (c) refractive-index profile calculated using an integration of the deflection function.

Figure 5.
(a) Comparison between the refractive index profiles obtained using the current technique (solid red curves) and the ones obtained using PK 2600 (solid black curves) in different preform positions according to the scheme reported in (b). For the PK2600 profiler, each measurement was performed at two different angles (0° and 90°).

Figure 6.
OSA measurement of theYb3+-emission in the NIR region. The scheme of the sublevel Yb3+ transitions between the ground and the excited state is also shown.
Figure 6.
OSA measurement of theYb3+-emission in the NIR region. The scheme of the sublevel Yb3+ transitions between the ground and the excited state is also shown.
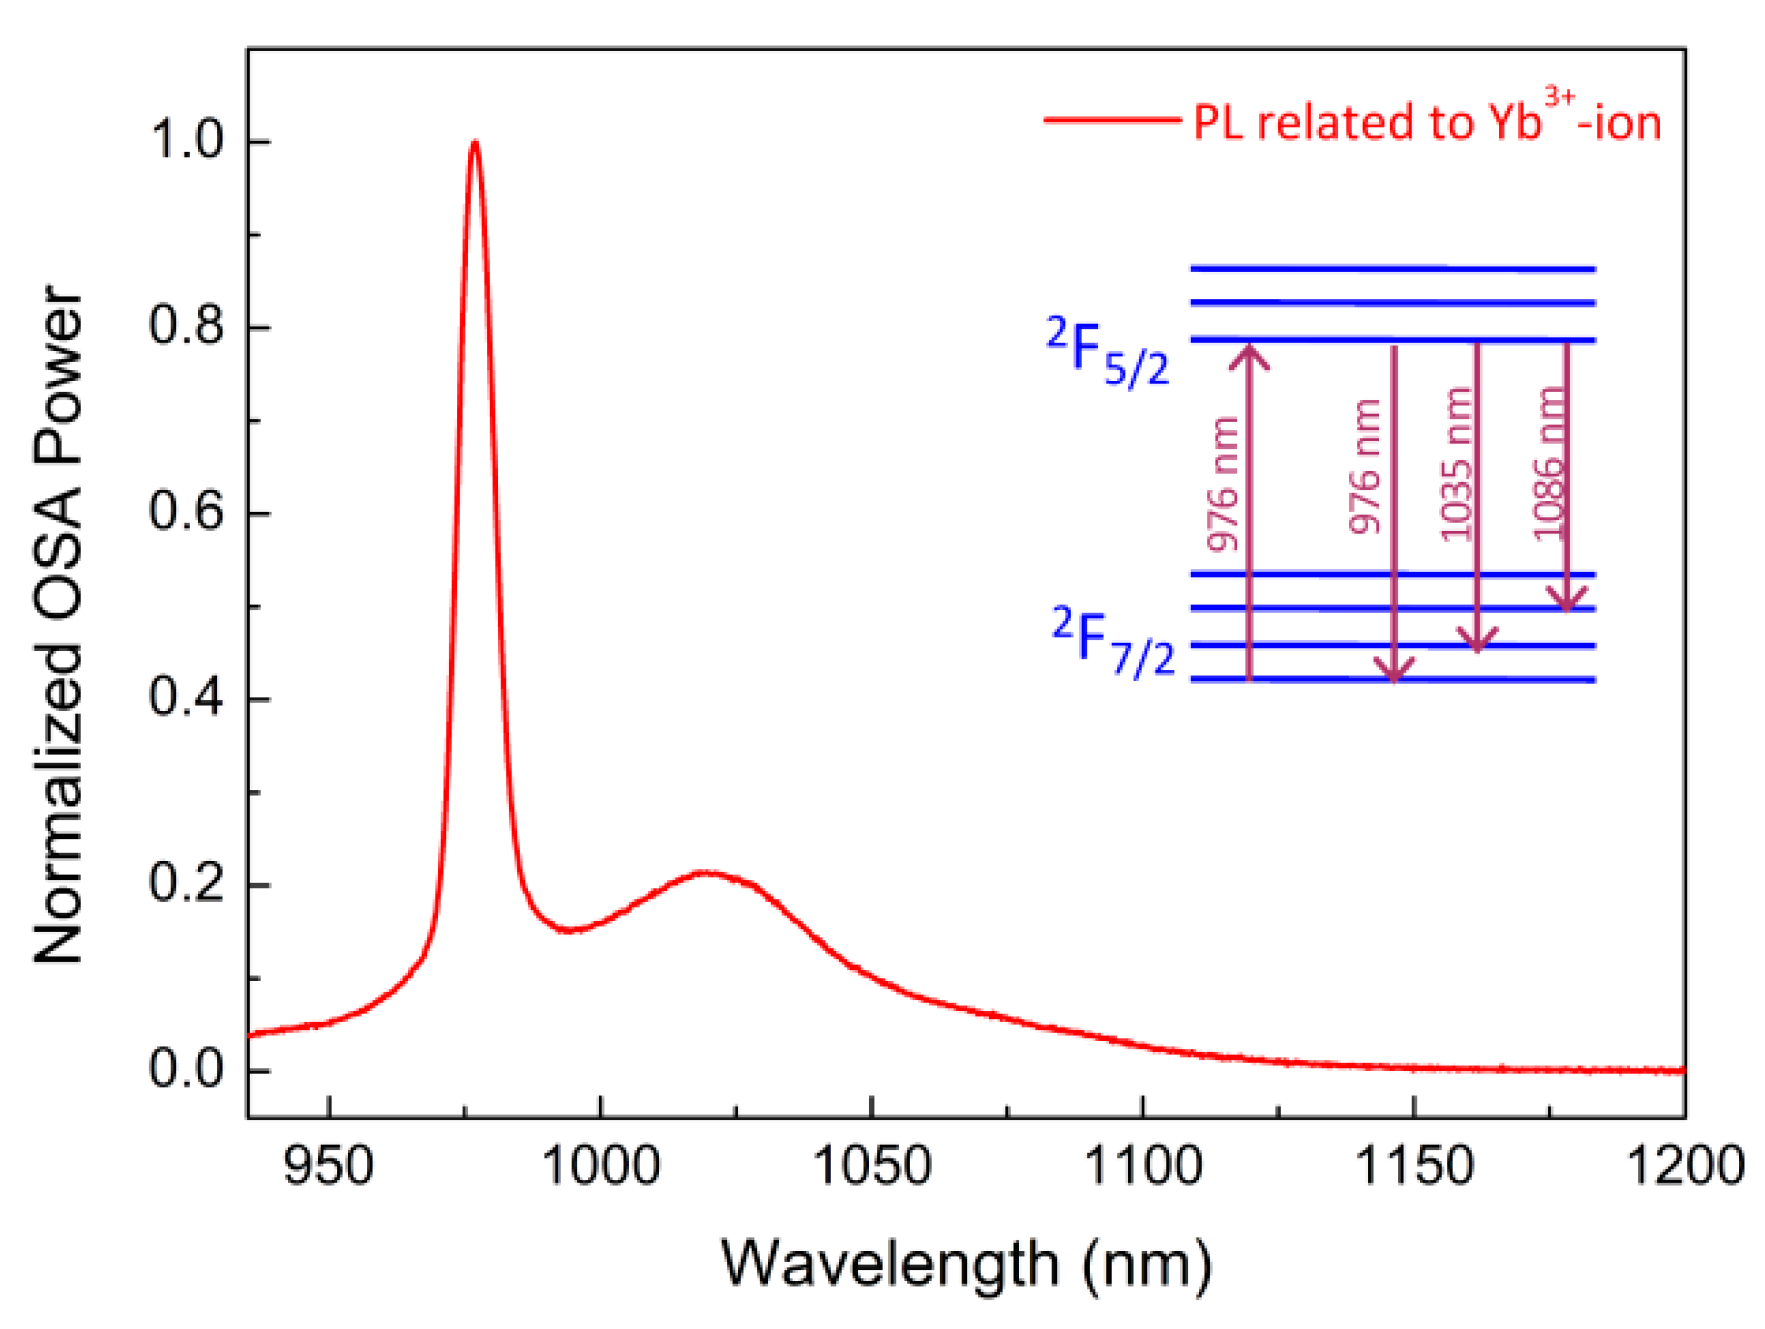
Figure 7.
(a) CCD image of the projection of the NIR signal emitted from the preform under a double-sided laser excitation at 976 nm, (b) normalized PL signal profile along the central dashed line in (a), and (c) active-ion distribution reconstructed by the application of an inverse Abel transform of the projection curve in (b).

Figure 8.
Comparison between the active-dopant profile obtained with the current method (red curve) and the profile measured by a SIMS analysis (blue curve).
Figure 8.
Comparison between the active-dopant profile obtained with the current method (red curve) and the profile measured by a SIMS analysis (blue curve).
© 2018 by the authors. Licensee MDPI, Basel, Switzerland. This article is an open access article distributed under the terms and conditions of the Creative Commons Attribution (CC BY) license (http://creativecommons.org/licenses/by/4.0/).
Share and Cite
MDPI and ACS Style
Vivona, M.; Zervas, M.N. Instrumentation for Simultaneous Non-Destructive Profiling of Refractive Index and Rare-Earth-Ion Distributions in Optical Fiber Preforms. Instruments 2018, 2, 23. https://doi.org/10.3390/instruments2040023
AMA Style
Vivona M, Zervas MN. Instrumentation for Simultaneous Non-Destructive Profiling of Refractive Index and Rare-Earth-Ion Distributions in Optical Fiber Preforms. Instruments. 2018; 2(4):23. https://doi.org/10.3390/instruments2040023
Chicago/Turabian StyleVivona, Marilena, and Michalis N. Zervas. 2018. "Instrumentation for Simultaneous Non-Destructive Profiling of Refractive Index and Rare-Earth-Ion Distributions in Optical Fiber Preforms" Instruments 2, no. 4: 23. https://doi.org/10.3390/instruments2040023