

Opportunities for Bright Beam Generation at the Argonne Wakefield Accelerator (AWA)
by
 , , , and
Emily Frame
1,*, 
Afnan Al Marzouk
1,
Oksana Chubenko
1,
Scott Doran
2,
Philippe Piot
1,2,
John Power
2 and
Eric Wisniewski
2 1
Northern Illinois Center for Accelerator & Detector Development and Department of Physics, Northern Illinois University, DeKalb, IL 60115, USA
2
Argonne National Laboratory, Lemont, IL 60439, USA
*
Author to whom correspondence should be addressed.
Instruments 2023, 7(4), 48; https://doi.org/10.3390/instruments7040048
Submission received: 1 October 2023
/
Revised: 1 November 2023
/
Accepted: 21 November 2023
/
Published: 28 November 2023
(This article belongs to the Special Issue Selected Papers from the Workshop on Physics and Applications of High Brightness Beams)
Abstract
:Bright electron beams have played a critical role in many recent advances in accelerator technology. Producing bright beams via photo-emission is ultimately limited by the mean transverse energy (MTE), which is determined by the photocathode. This paper discusses the opportunity to generate bright electron beams using an upgraded version of the Argonne Wakefield Accelerator (AWA) photo-injector. The focus of this study is to examine the optimal configurations of the AWA photo-injector to produce 100 pC with a ∼100 nm transverse emittance (corresponding to a 5D brightness A·m). The numerical optimization of the AWA photo-injector operating point, including realistic electromagnetic field maps, is presented for the different types of photocathodes under consideration.
1. Introduction
High-quality, high-brightness electron beams have played an important role in many recent developments in accelerator technology, including free electron lasers (FELs) and ultrafast electron diffraction (UED) or microscopy (UEM) applications. The beam brightness is , where Q is the beam charge, and is the emittance for the combined three degrees of freedom (DOF), which, for uncoupled motion, can be written as the product of emittances associated with one DOF as with for , with being the momentum conjugated to position i. The quantities m and c are the electron mass and the speed of light, respectively.
Often, one can consider a reduced brightness in 5D (ignoring the impact of energy spread), defined as , where is the peak current associated with the bunch. In practice, assuming a cylindrical-symmetric bunch, the smallest achievable emittance is set by the thermal emittance, which is limited by the cathode mean transverse energy (MTE) following . Consequently, the 5D brightness is ultimately limited by
where is the laser’s rms transverse size on the photocathode surface, is the peak current, and is the transverse emittance. In practice, the equality in Equation (1) is never achieved for electron bunches as collective effects (e.g., space-charged and image-charged effects during the emission and low-energy transport) along with beamline imperfection (aberrations and misalignments), which yields final emittances larger than the intrinsic emittances set by the MTE.
In this paper, we explore the formation of a 100 pC electron bunch using the Argonne Wakefield Accelerator (AWA) photo-injector [1]. The focus is to understand the compromise between the final electron bunch duration and transverse emittance , considering the impact of the MTE associated with several photocathodes under consideration. These optimizations were performed using an upgraded version of the AWA photo-injector, which is planned for operation within the next couple of years.
2. The AWA Upgraded Photoinjector
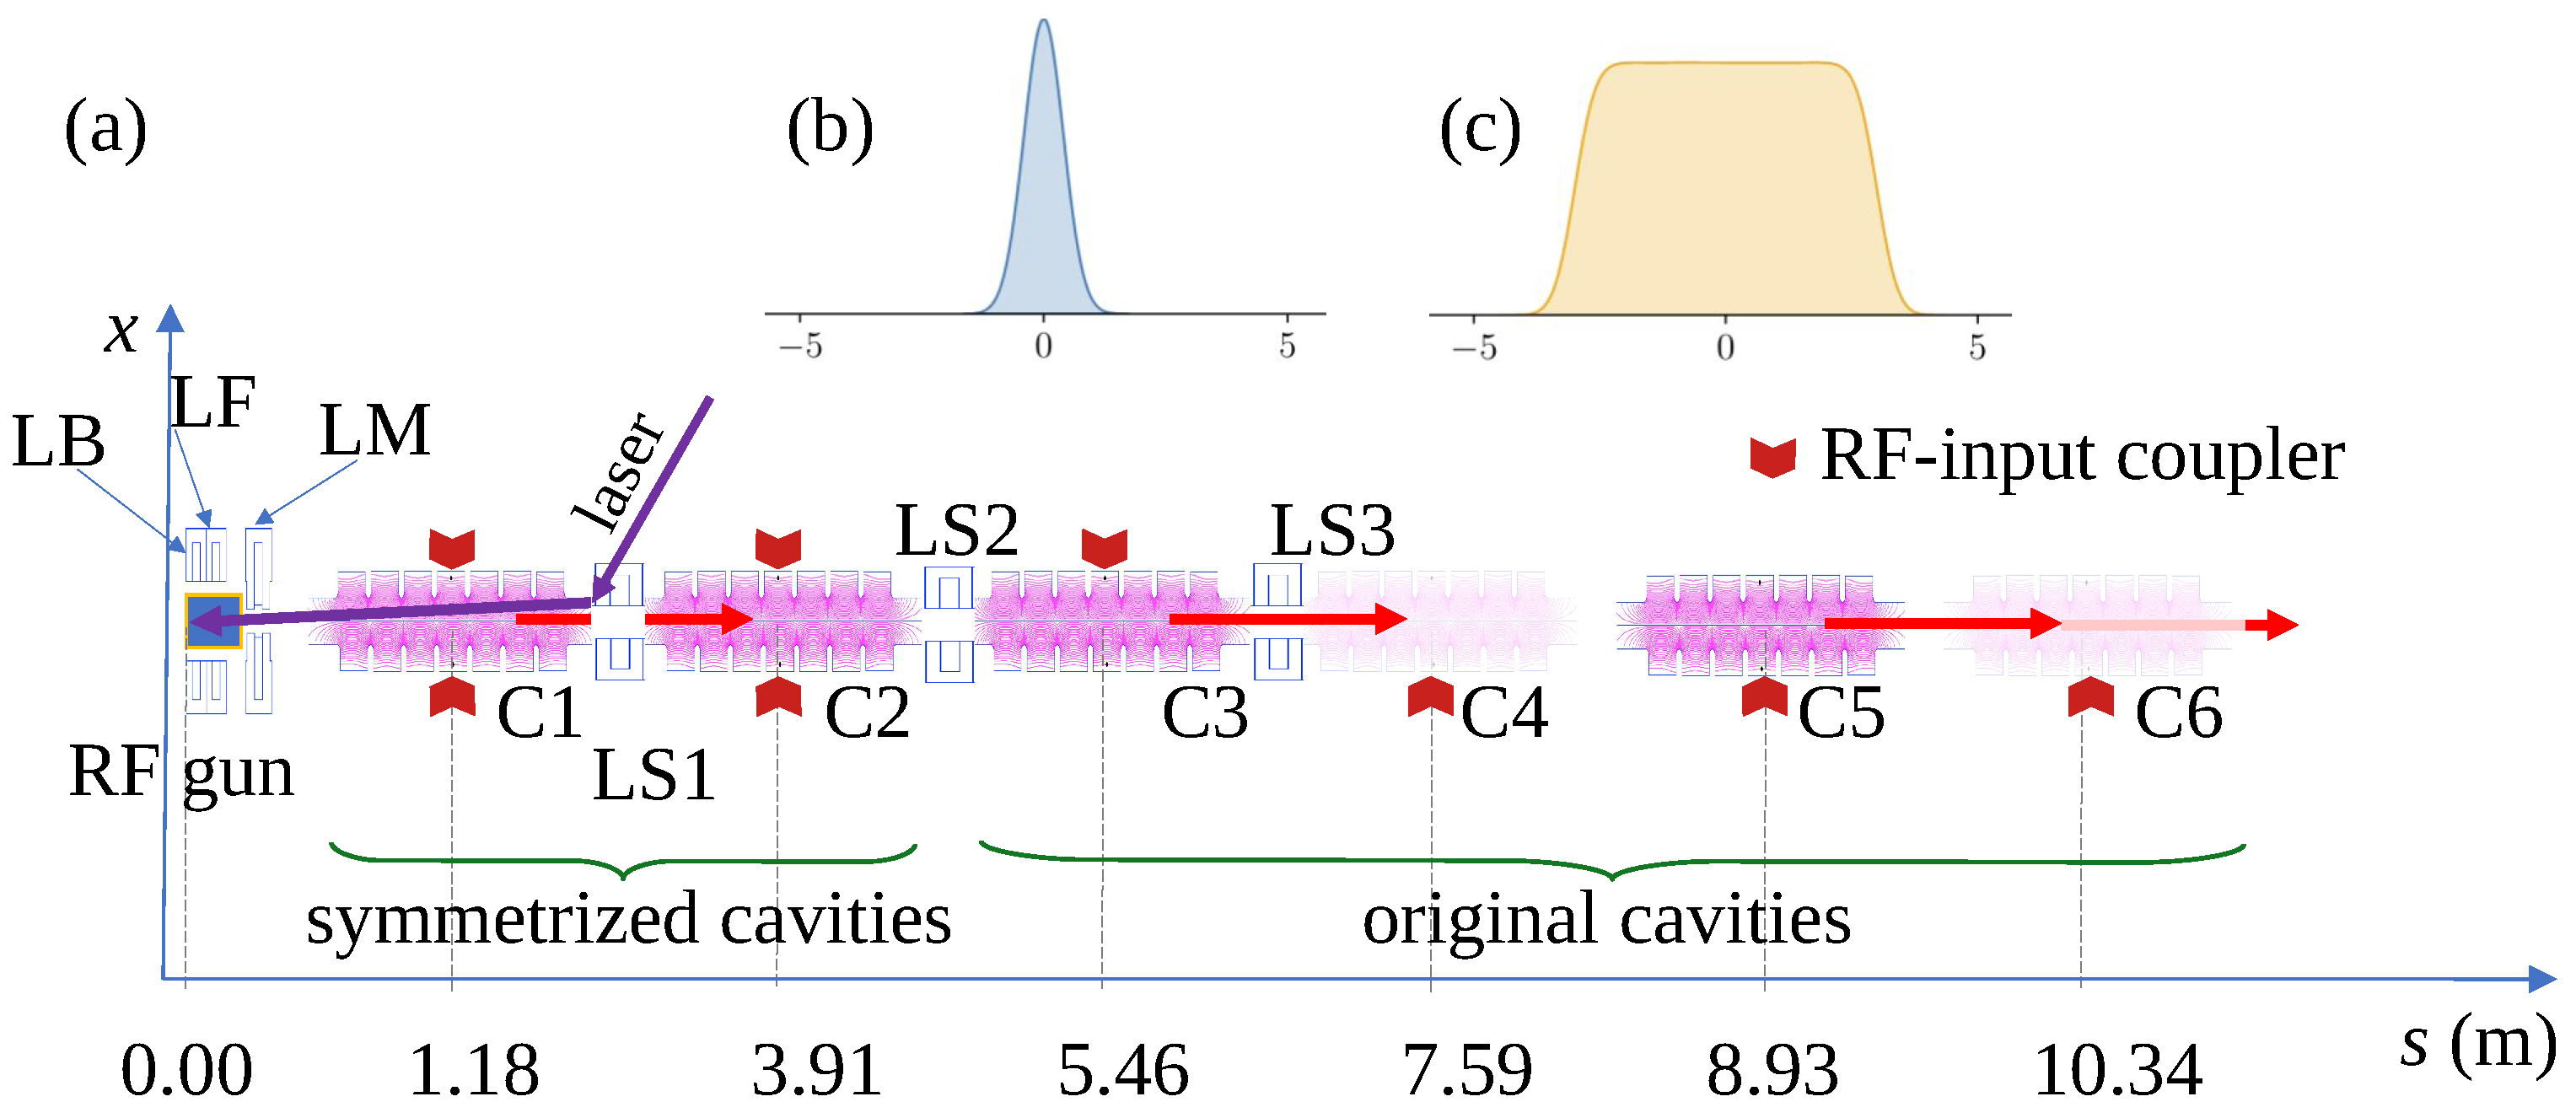
The AWA drive beam accelerator consists of a 1.3 GHz, 1 + cell radiofrequency (RF) gun with a CsTe photocathode mounted on its backplate. The photo-emission is triggered by a 292 nm ultraviolet laser pulse with a radially uniform distribution and a nominal temporal shape, with a ∼400 fs (RMS) Gaussian distribution. An optical pulse stacker allows for the stacking of 32 laser pulses to form a 6 ps duration flat-top pulse. The RF gun is followed by a linear accelerator comprised of six accelerating cavities, boosting the beam energy to ∼70 MeV; see the diagram in Figure 1. The accelerator can accommodate a wide range of bunch charges: nC. High-charge bunches are usually employed to explore two-beam acceleration concepts and test high-gradient accelerating structures, whereas lower-charge bunches are used in beam dynamics experiments related to, e.g., beam shaping or emittance control. Most recently, there has been interest in exploring the possible use of the AWA facility to support the generation of low-charge (100 pC) bright bunches with transverse emittance nm. In the process, the beamline will be upgraded with a new RF gun (with a symmetrized RF field to mitigate head-tail emittance growth due to a time-dependent transverse dipole-like field). Likewise, the linac cavities C1 and C2 will be upgraded with symmetrized cavities designed for the APEX project [2]. It is anticipated that such an upgraded beamline will support the generation of low-emittance bunches, possibly leveraging low-MTE photocathodes under development [3].
3. Beam Brightness Optimization
3.1. Methods
Throughout this paper, we investigate the lowest attainable emittance for a bunch charge of 100 pC using the beamline recently designed to improve the transport of a high bunch charge ( nC) [4]. The operating points of this beamline were optimized using the deap [5] multi-objective optimization framework interfaced with the astra beam dynamics program [6]. The deep framework can simultaneously optimize multiple objective functions when given a set of control parameters using a nondominated sorting technique. Nondominated points are solutions where further improvement in one objective function degrades another objective function [7]. The tradeoff between the objective functions is referred to as a Pareto front. In our investigation, the objective functions are the transverse emittance and bunch duration . The set of control parameters is summarized in Table 1, along with their allowable range.
For this set of optimizations, the beamline model implemented in astra considers cylindrical-symmetric external fields for the solenoid lenses and accelerating cavities. Such an approximation allows for the field to be described solely by its on-axis longitudinal component, e.g., for a TM cavity. The transverse fields are computed within astra using the paraxial approximation up to the third order in the radial displacement r.
Additionally, the astra simulations were performed with pC for only four out of the six accelerating cavities turned on to reflect one of the nominal operation modes of AWA, resulting in a final energy of ∼40 MeV.
In order to quantify how the final beam parameters are impacted by different types of photocathodes, the optimizations were performed for three values of the MTEs: (i) 250 meV, corresponding to a CsTe photocathode, which is currently used at AWA, (ii) 60 meV, which is expected from CsSb photocathodes [3], and (iii) 5 meV, corresponding to the case of an atomically flat copper crystal [8]. It should be stressed that the latter value was selected as an idealized limit as its implementation requires cryogenic cooling, which would not be possible at AWA.
3.2. Results
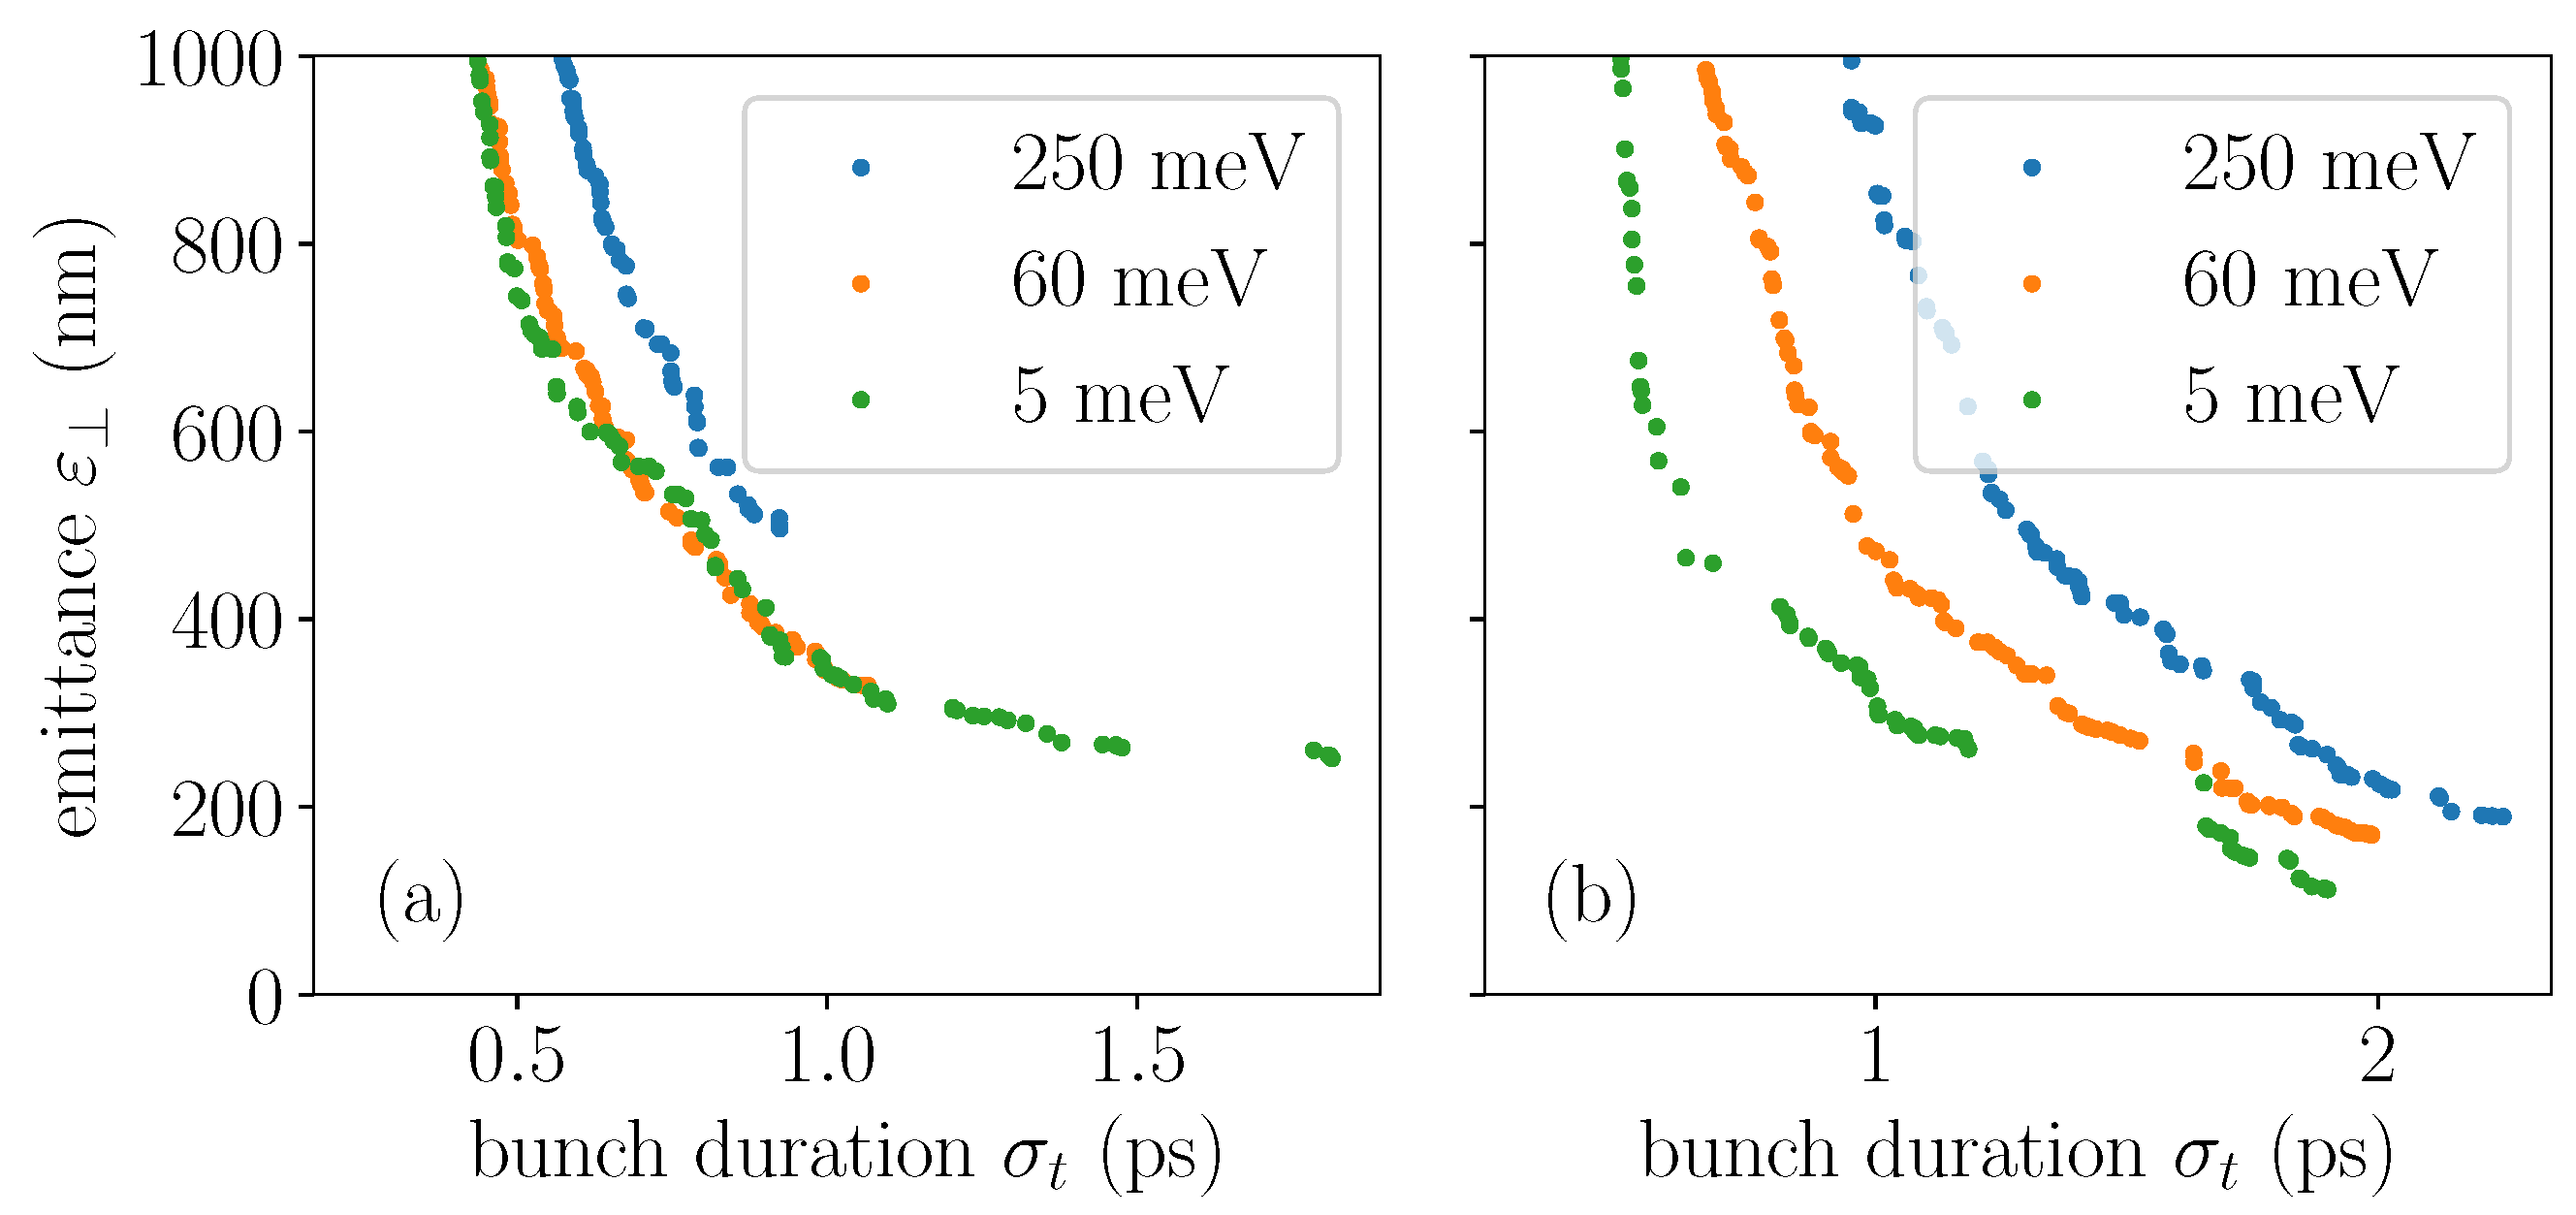
The Pareto fronts for rms normalized transverse emittance, , and bunch duration, , appear in Figure 2. The lowest emittances were attained for the flat-top photocathode laser pulse, culminating with nm for the 250-meV MTE, nm for the 60-meV MTE, and nm for the 5-meV MTE. The Pareto fronts associated with a Gaussian laser pulse indicate worse emittance values. In general, the flat-top laser pulse favors smaller emittance at the expense of an increase in bunch duration.
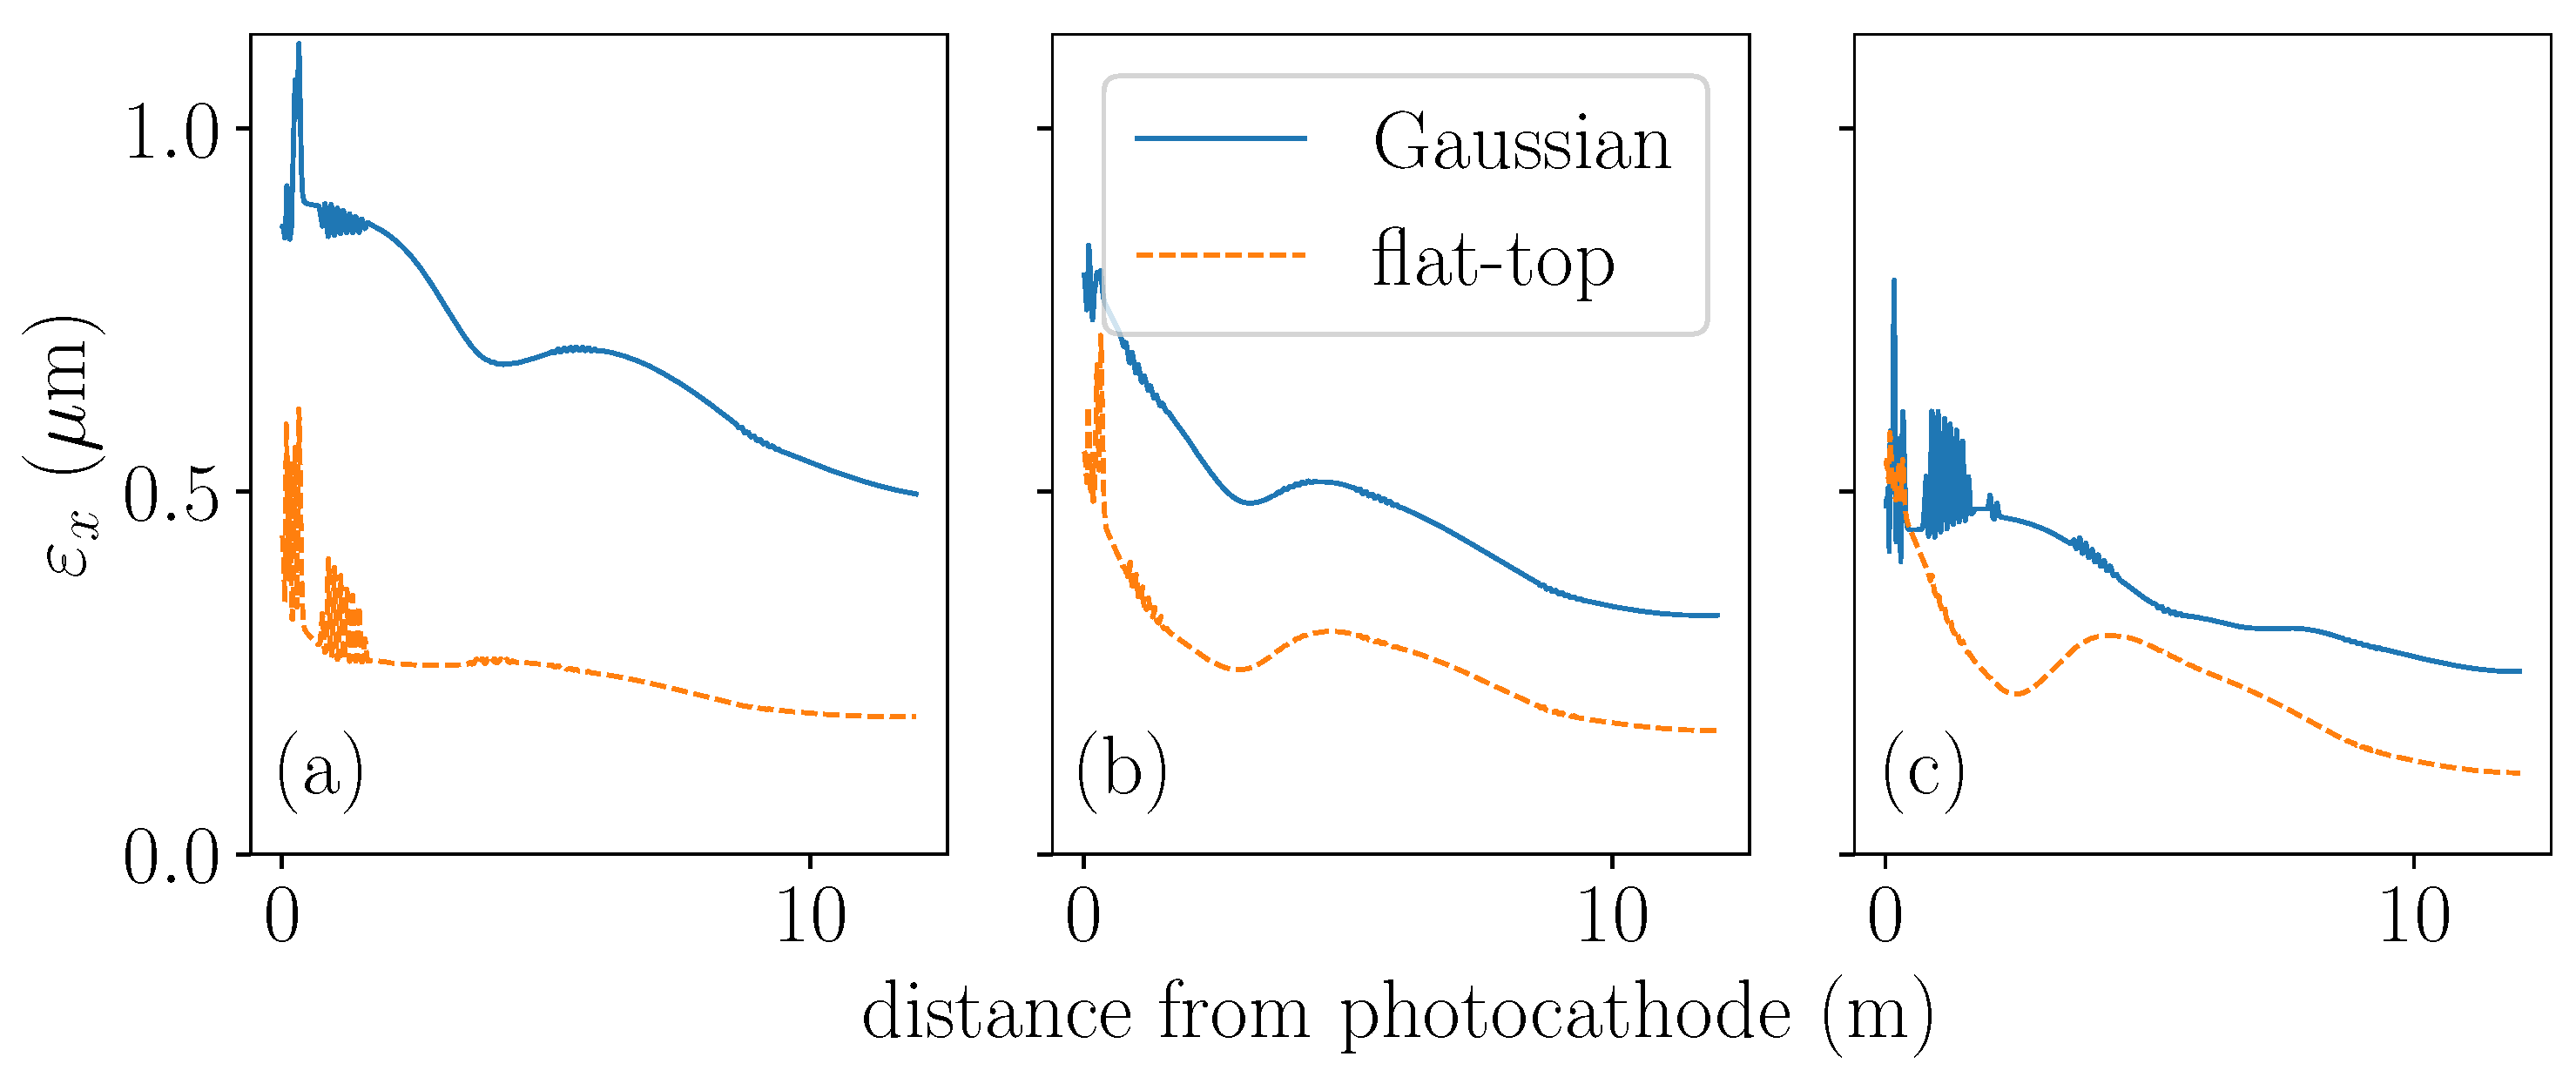
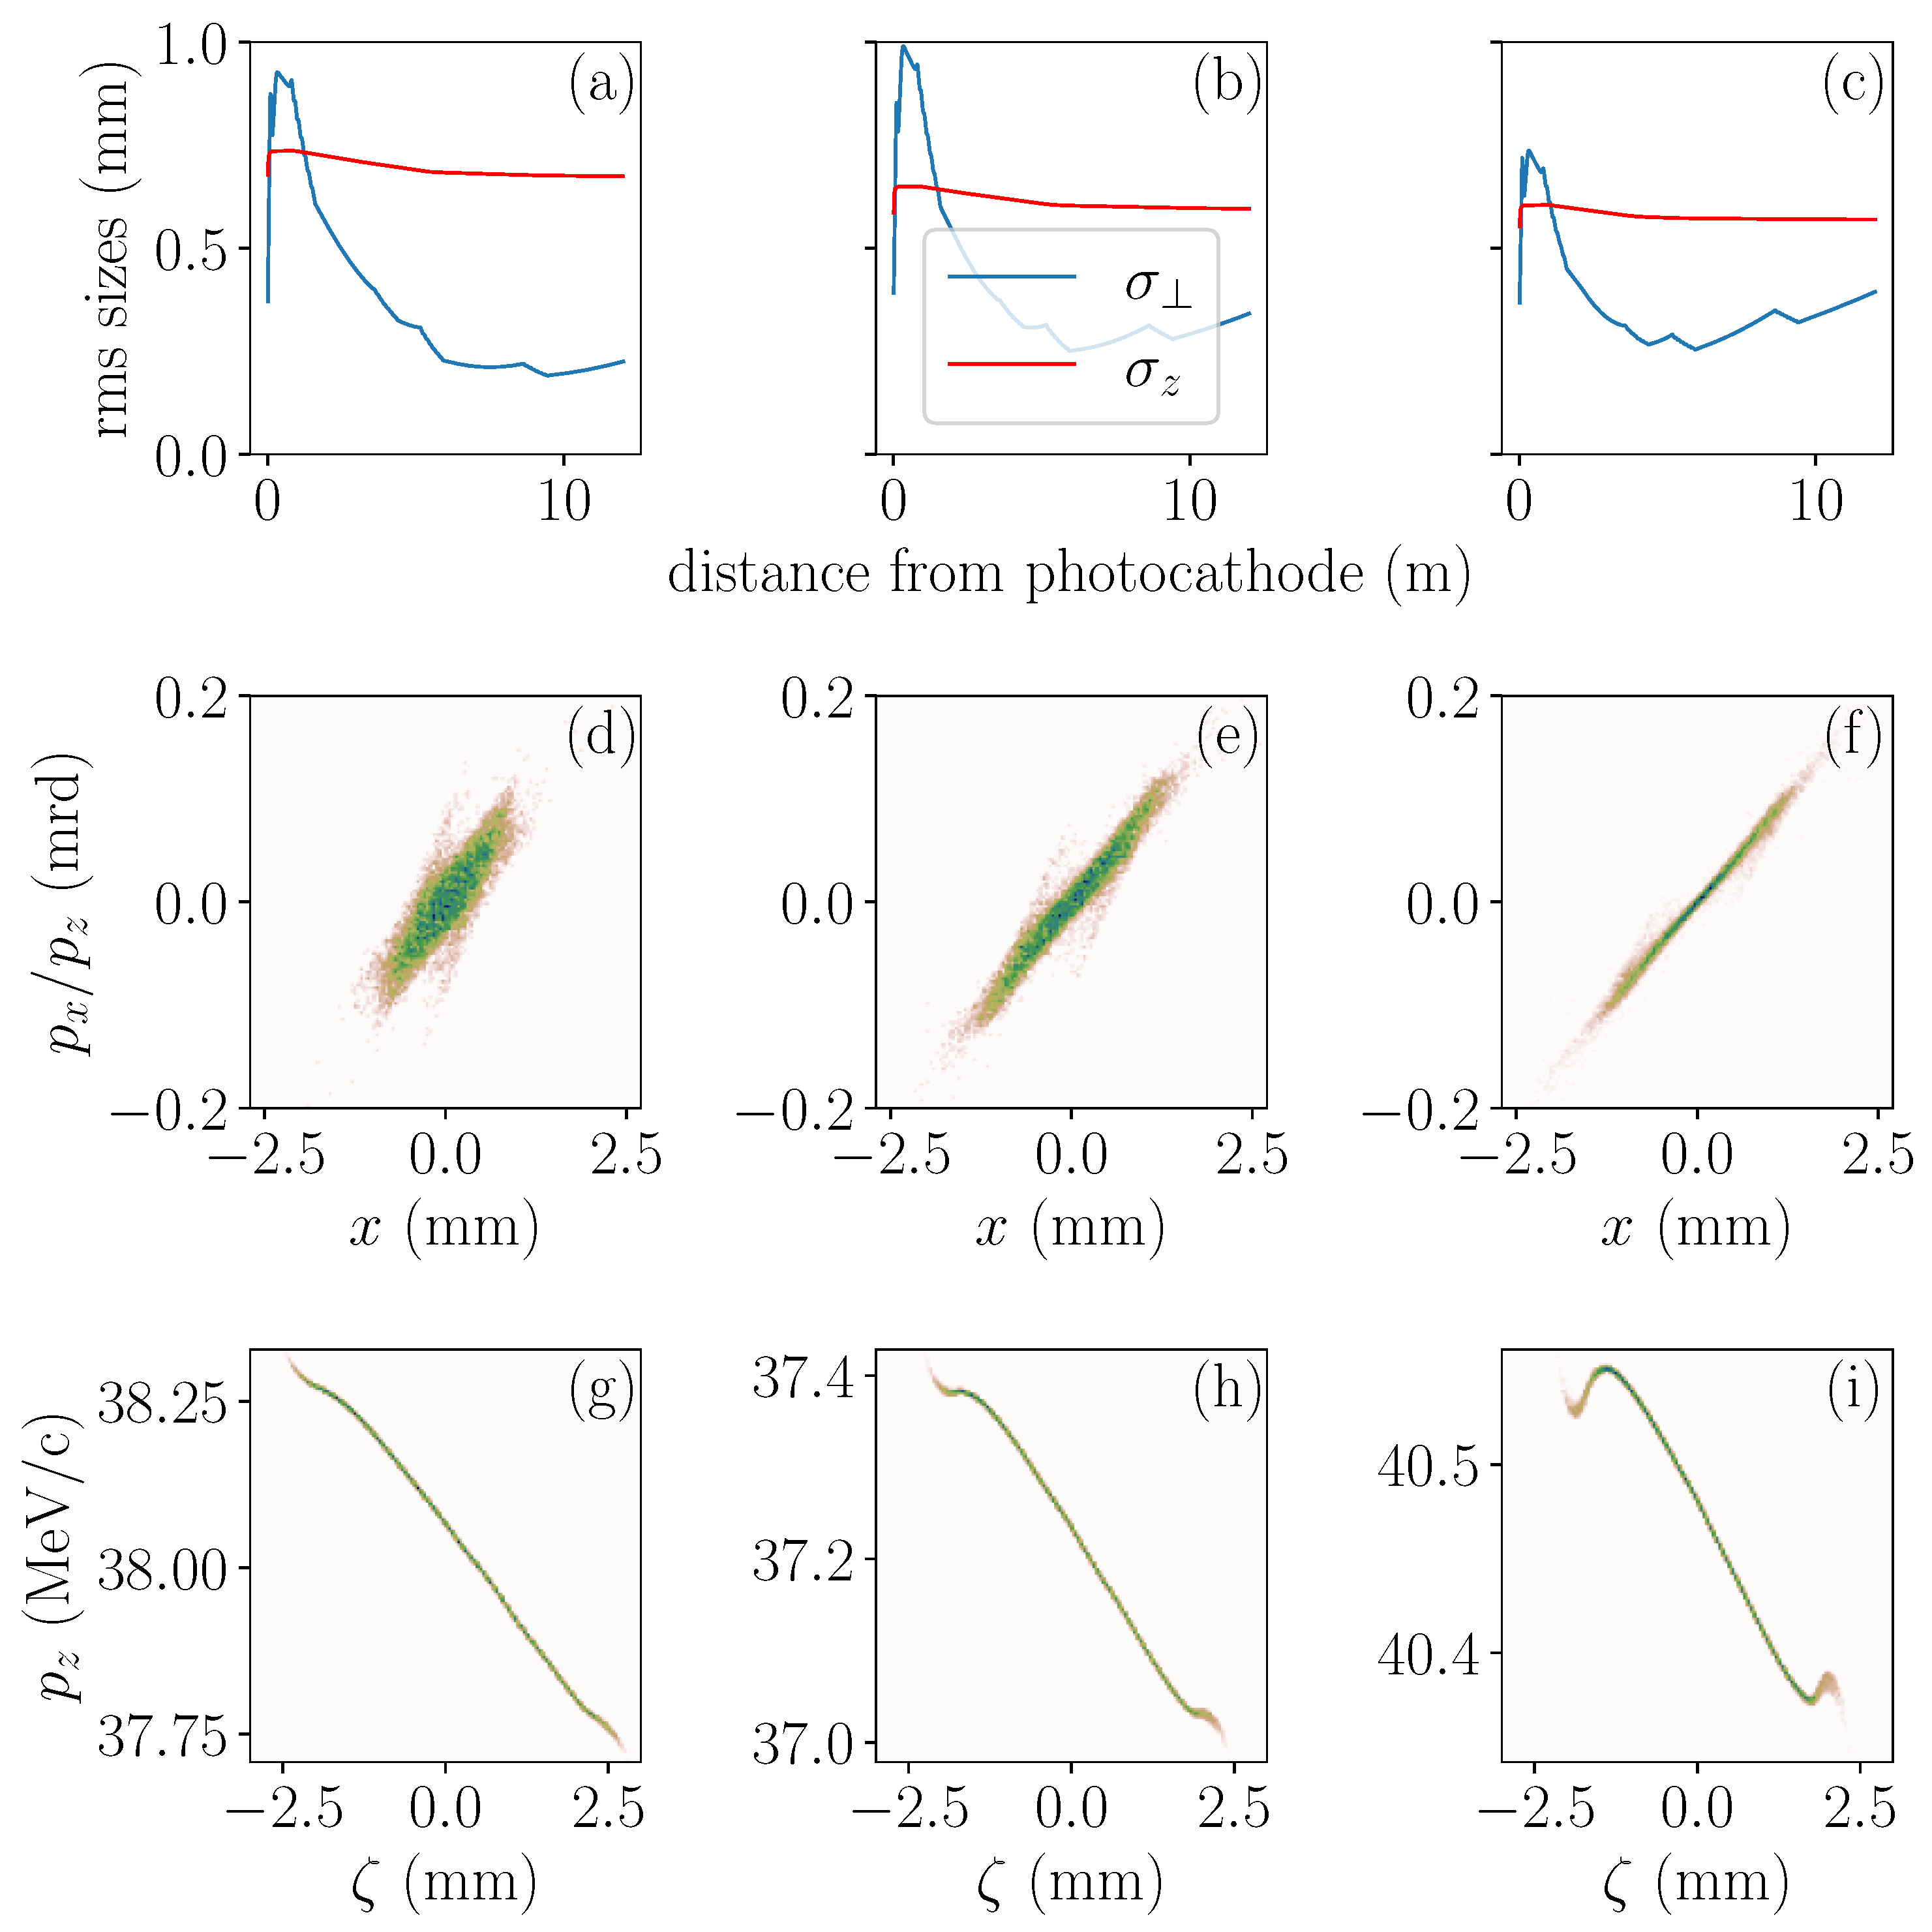
Some of the operating points on the Pareto front were examined in more detail. Table 2 summarizes the optimized operating parameters and resulting beam parameters for the three flat-top laser-distribution cases mentioned previously (which gives brighter bunches compared to the short laser-pulse distribution). Figure 3 compares the transverse emittance evolution along the accelerator for the two laser configurations for each of the three MTEs, confirming that the flat-top photocathode laser pulse consistently provides superior performances, with emittances of ∼two-fold smaller than the Gaussian laser pulse. This can partially be explained by the short pulse laser and low charge involved, resulting in a condition for the blow-out regime to be marginally satisfied [9]. Figure 4 depicts the transverse rms beam sizes ( and ) and longitudinal rms length, , for the flat-top laser pulse case. It is worth noting that in these configurations, the bunch length decreases during acceleration in the first two cavities via velocity bunching. Additionally, the lower MTE generally leads to a working point that favors shorter bunch lengths. For lower MTEs, the longitudinal phase-space distribution has more prominent nonlinear correlations that become more pronounced (resulting in a “S” shape correlation) as the MTE is lowered; see Figure 4g–i. This effect most likely originates from the finite rise- and fall-time associated with the flat-top laser distribution (see Figure 1c) and increases as the MTE decreases due to longitudinal space charge increases coming from the shorter bunch length explored by the optimizer.
These optimizations are promising as they indicate that sub-200 nm transverse emittances can be attained using the AWA. However, the model assumes the fields are cylindrical-symmetric. A significant source of emittance dilution is the impact of the asymmetric RF-field topology due to the RF-input ports located in the middle cell of the cavities. Generally, we expect the transverse emittance to grow due to the corresponding time-dependent transverse kick. Such an effect is also expected to scale linearly with bunch length [10].
3.3. Impact of 3D Fields
In this section, we investigate the impact of realistic electromagnetic fields in the linac. AWA incorporates seven-cell accelerating cavities that are operated in the TM mode. In the original design, the RF power is fed to the middle cell using a single-sided waveguide [1], and a subsequent modification to the linac introduces a dual feed in an attempt to symmetrize the middle cell and cancel the dipole kick [2]. In the proposed upgrade, the first two cavities are symmetrized, whereas the other follows the original design. Specifically, cavity C3 has its input coupler located in the direction, and all the following cavities have their input couplers oriented in the direction (here, we take to run along the beam direction and to point in the upward (vertical) direction). In order to quantify the impact of these realistic fields, we performed 3D electromagnetic simulations using an omega3p frequency domain eigen solver [11]. The electromagnetic field maps were interpolated on a 3D Cartesian grid with cells and were imported into astra for tracking. The omega3p simulations were performed using a mesh with quadratic, tetrahedral elements and fourth-order basis functions.
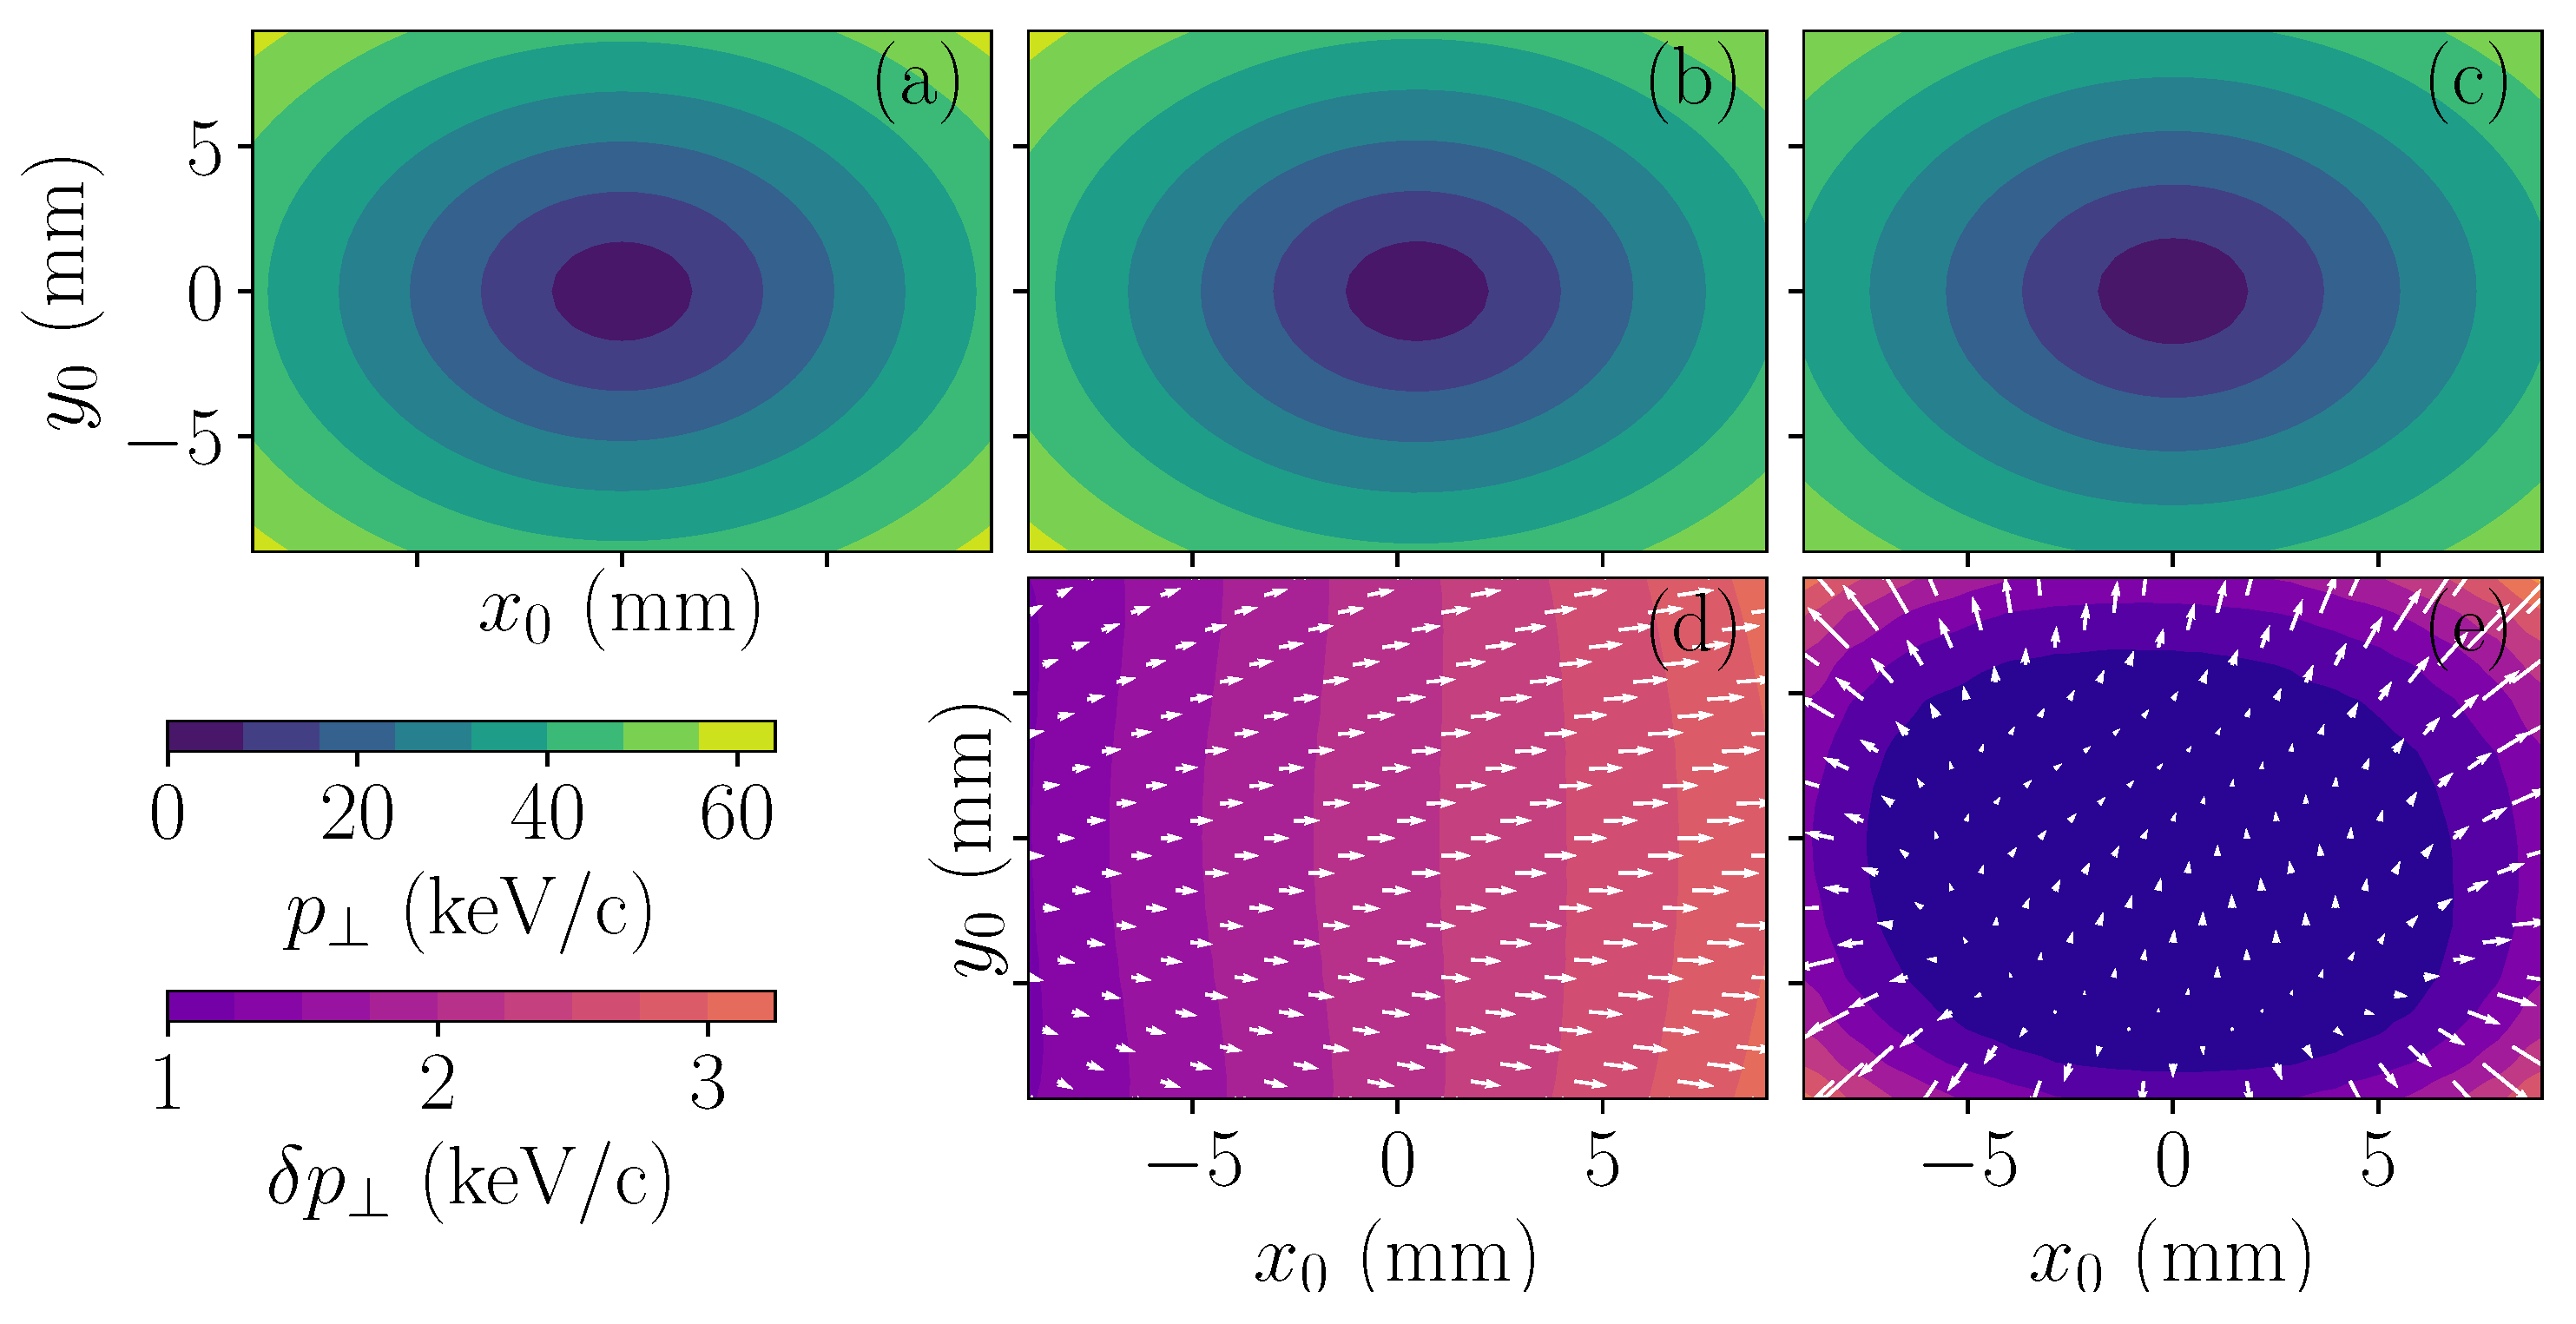
In order to understand the impact of the field, we first performed simulations using a bunch composed of mono-energetic macroparticles (with a kinetic energy of MeV) organized as a 2D transverse grid in with vanishing transverse momentum . The bunch is tracked in the two 3D-field maps (associated with the single- and dual-coupler configuration cavities) and by using the 1D model described above, where the electromagnetic field components are received from the on-axis field . The three cases are compared in Figure 5. As expected, the single-side RF input coupler introduces a significant dipole-like kick (see Figure 5d), which is strongly suppressed in the case of the dual-coupler configuration; see Figure 5e. In the latter case, we find that the relative deviation in transverse momentum compared to the paraxial approximation using the axial electric field is keV/c.
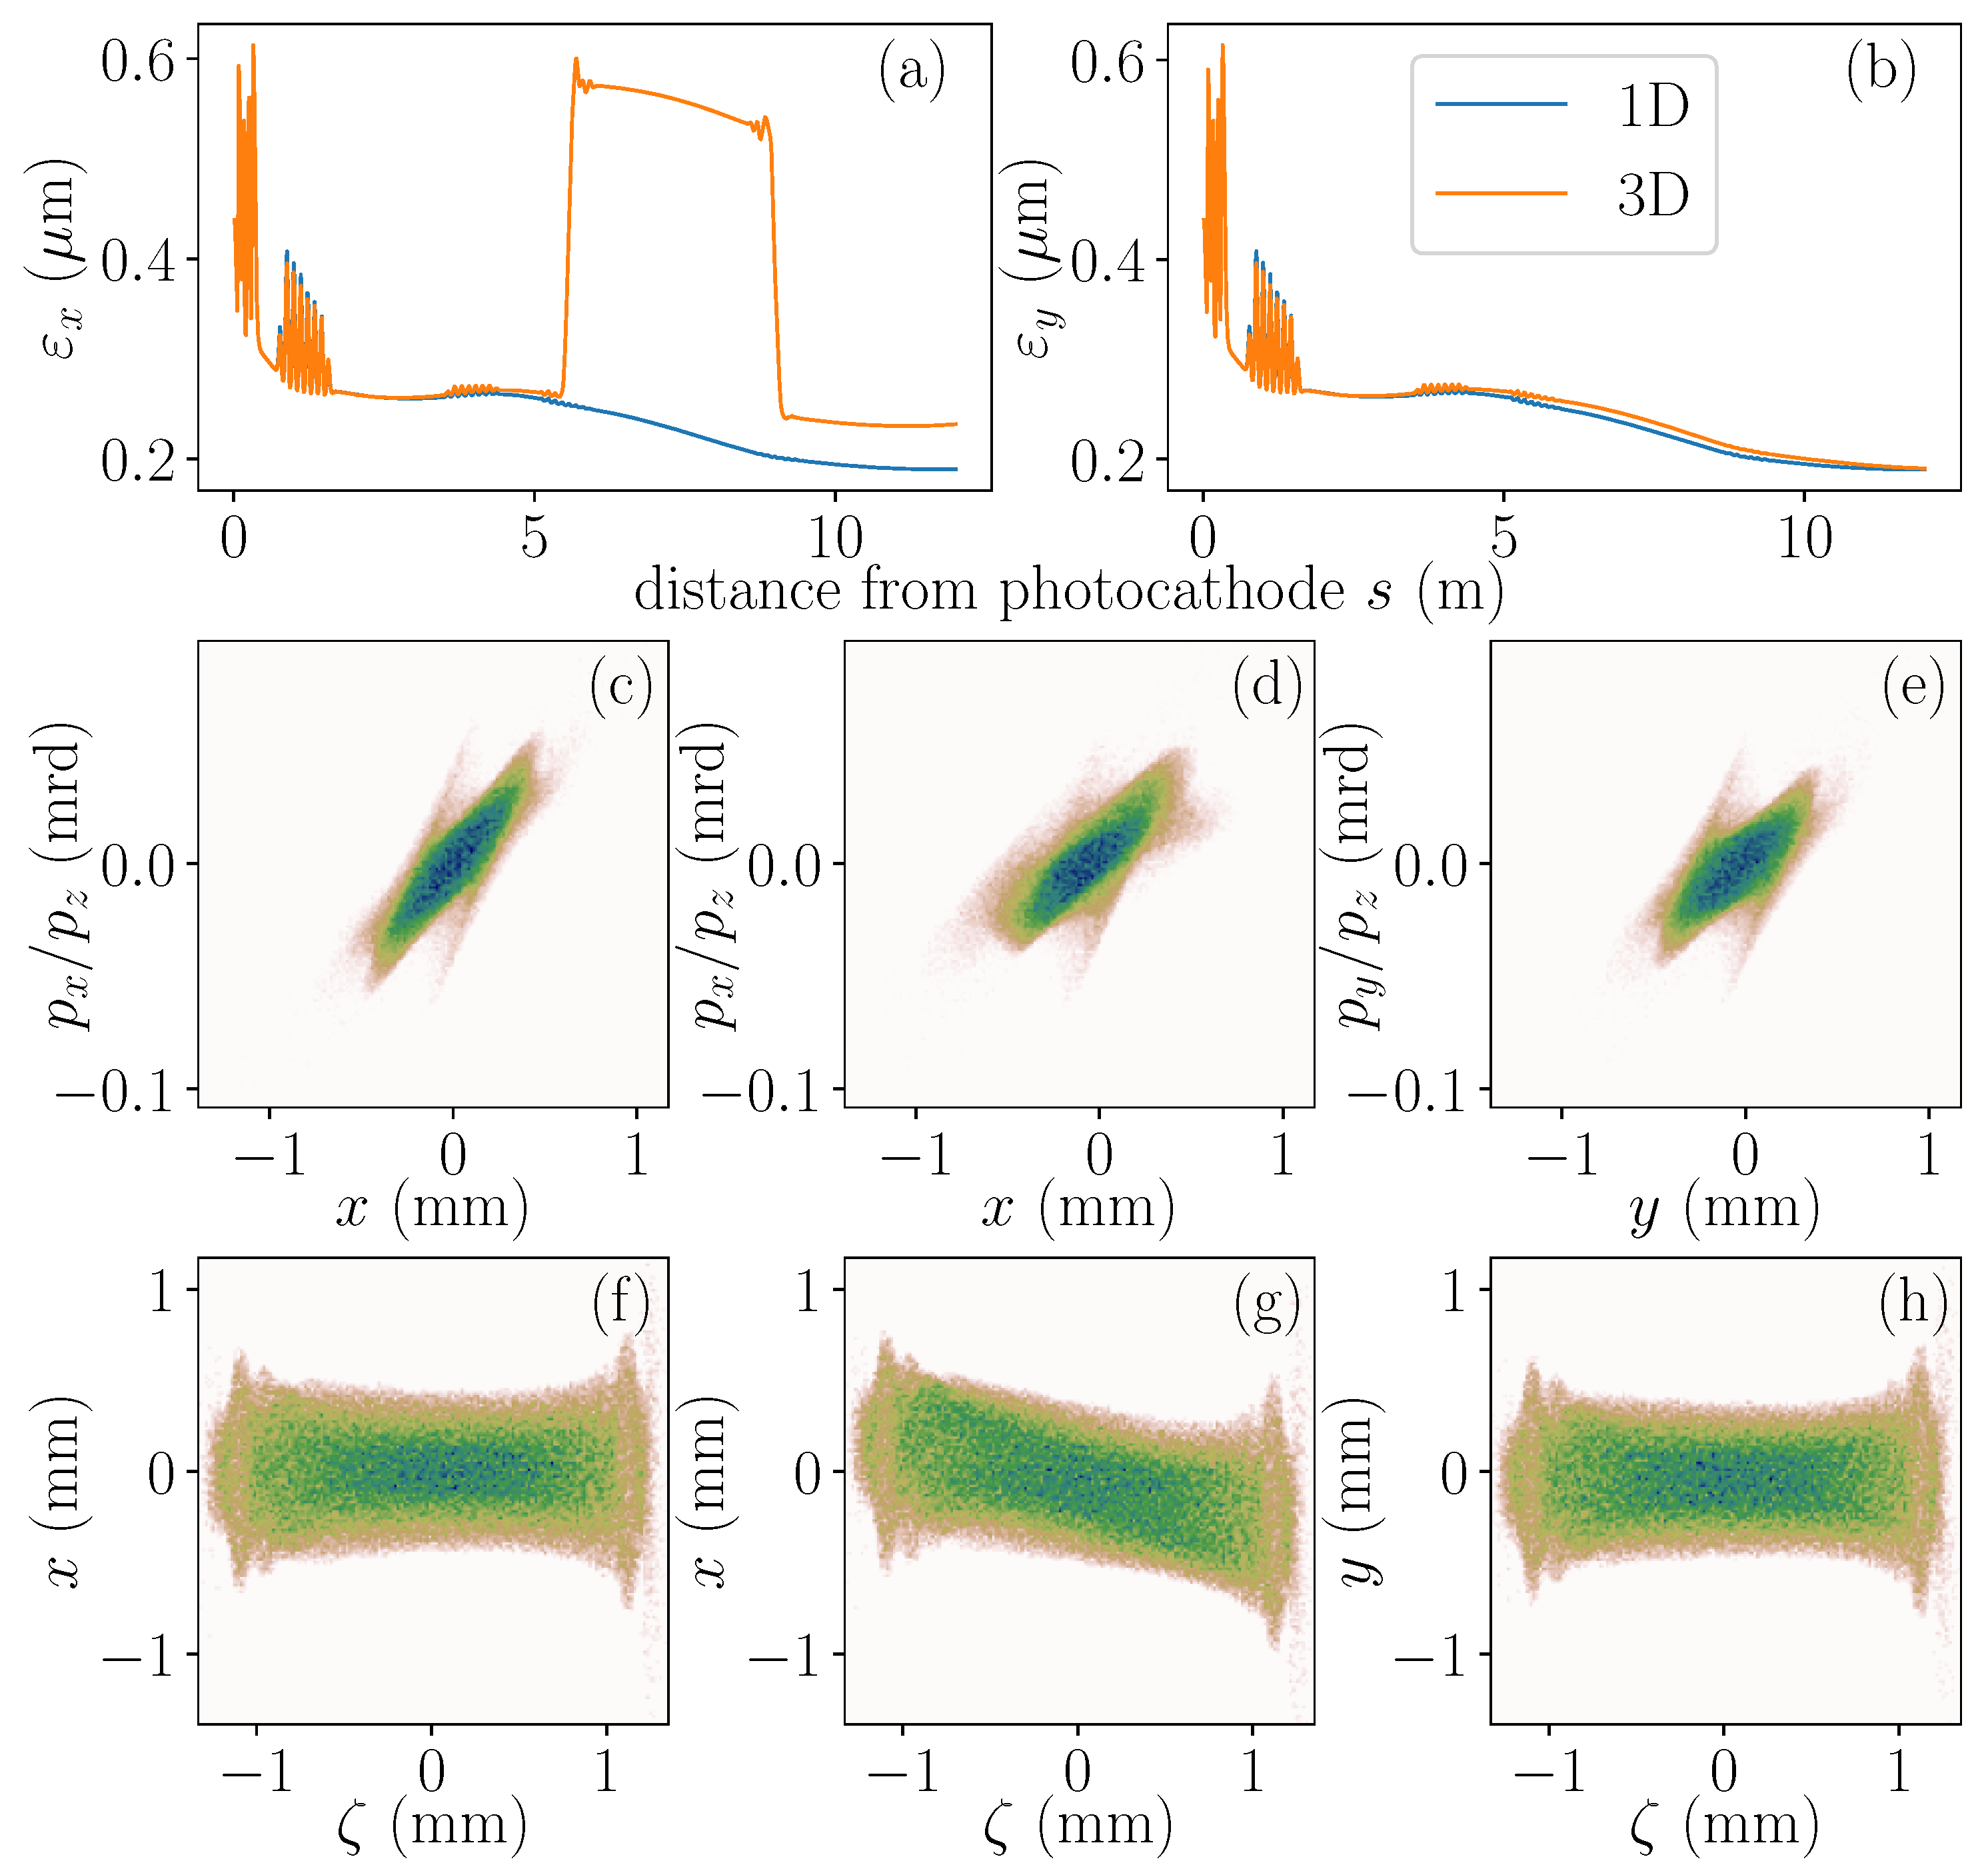
The 3D fields associated with the configuration planned for the AWA upgrade depicted in Figure 1 were used to examine the impact on the beam emittance for one of the optimized cases. For this study, we considered the case of an MTE of 250 meV optimized for the lowest emittance corresponding to the orange trace in Figure 3a. Figure 6a compares the evolution of the transverse emittance for the cases when the fields are considered to be cylindrical-symmetric (as assumed in Section 3.2 and when the omega3p 3D field maps are employed). First, as already indicated in Figure 5, the dual-coupler configuration cavities (centered at 1.8 and 4 m) do not degrade beam emittance (the 1D and 3D versions are in very good agreement up to the exit of C2 at a distance of m from the photocathode). As the beam passes through the middle cell of cavity C3 (with the RF input coupler in the direction), it receives a strong kick, which results in a ∼2-fold emittance increase in the horizontal plane. Finally, as the beam passes through the last power cavity C4 (with its RF input coupler in the direction), the reverse time-dependent kick cancels the emittance growth induced in C3, resulting in the final emittance within ∼10% of the emittance computed for the case, assuming axisymmetric cavities. Further examination of the spatiotemporal distribution confirms that the correlations are not exactly compensated for, leading to a head-tail displacement in the horizontal plane; see Figure 6g. Further optimization using the realistic 3D map, including control of the beam trajectory (offset and angle of injection in the cavities), could provide further improvements.
It should be noted that our simulations do not include a 3D field map for the RF gun at this point. However, the RF gun was modified to have a four-fold symmetry (suppression of dipolar- and quadrupolar-kick components), and we expect its effect on the beam dynamics to be minimal.
3.4. Opportunity for Peak Current Enhancement via Magnetic Bunch Compression
The use of a magnetic bunch compressor to increase the peak current, , and thus, the brightness (see Equation (1)), was explored. The chicane geometry is highly constrained as it reuses the first part of an already installed beamline associated with a transverse-to-longitudinal phase-space exchanger [12]; see Ref. [13]. The compressor reuses an available beamline and is arranged as an achromatic chicane composed of four dipole magnets with bending angles . When a beam propagates through the bending dipoles of the chicane, it emits coherent synchrotron radiation (CSR), which interacts with the bunch and generally impacts the beam brightness. Simulations were performed to examine the possibility of enhancing the peak current and to quantify the emittance dilution during the bunch compression process. These simulations were performed using the self-consistent version of the lw3d code, which is a large-scale parallel program that computes the Liénard-Wiechert fields from first principles and applies them to the macroparticles at each time step [14].
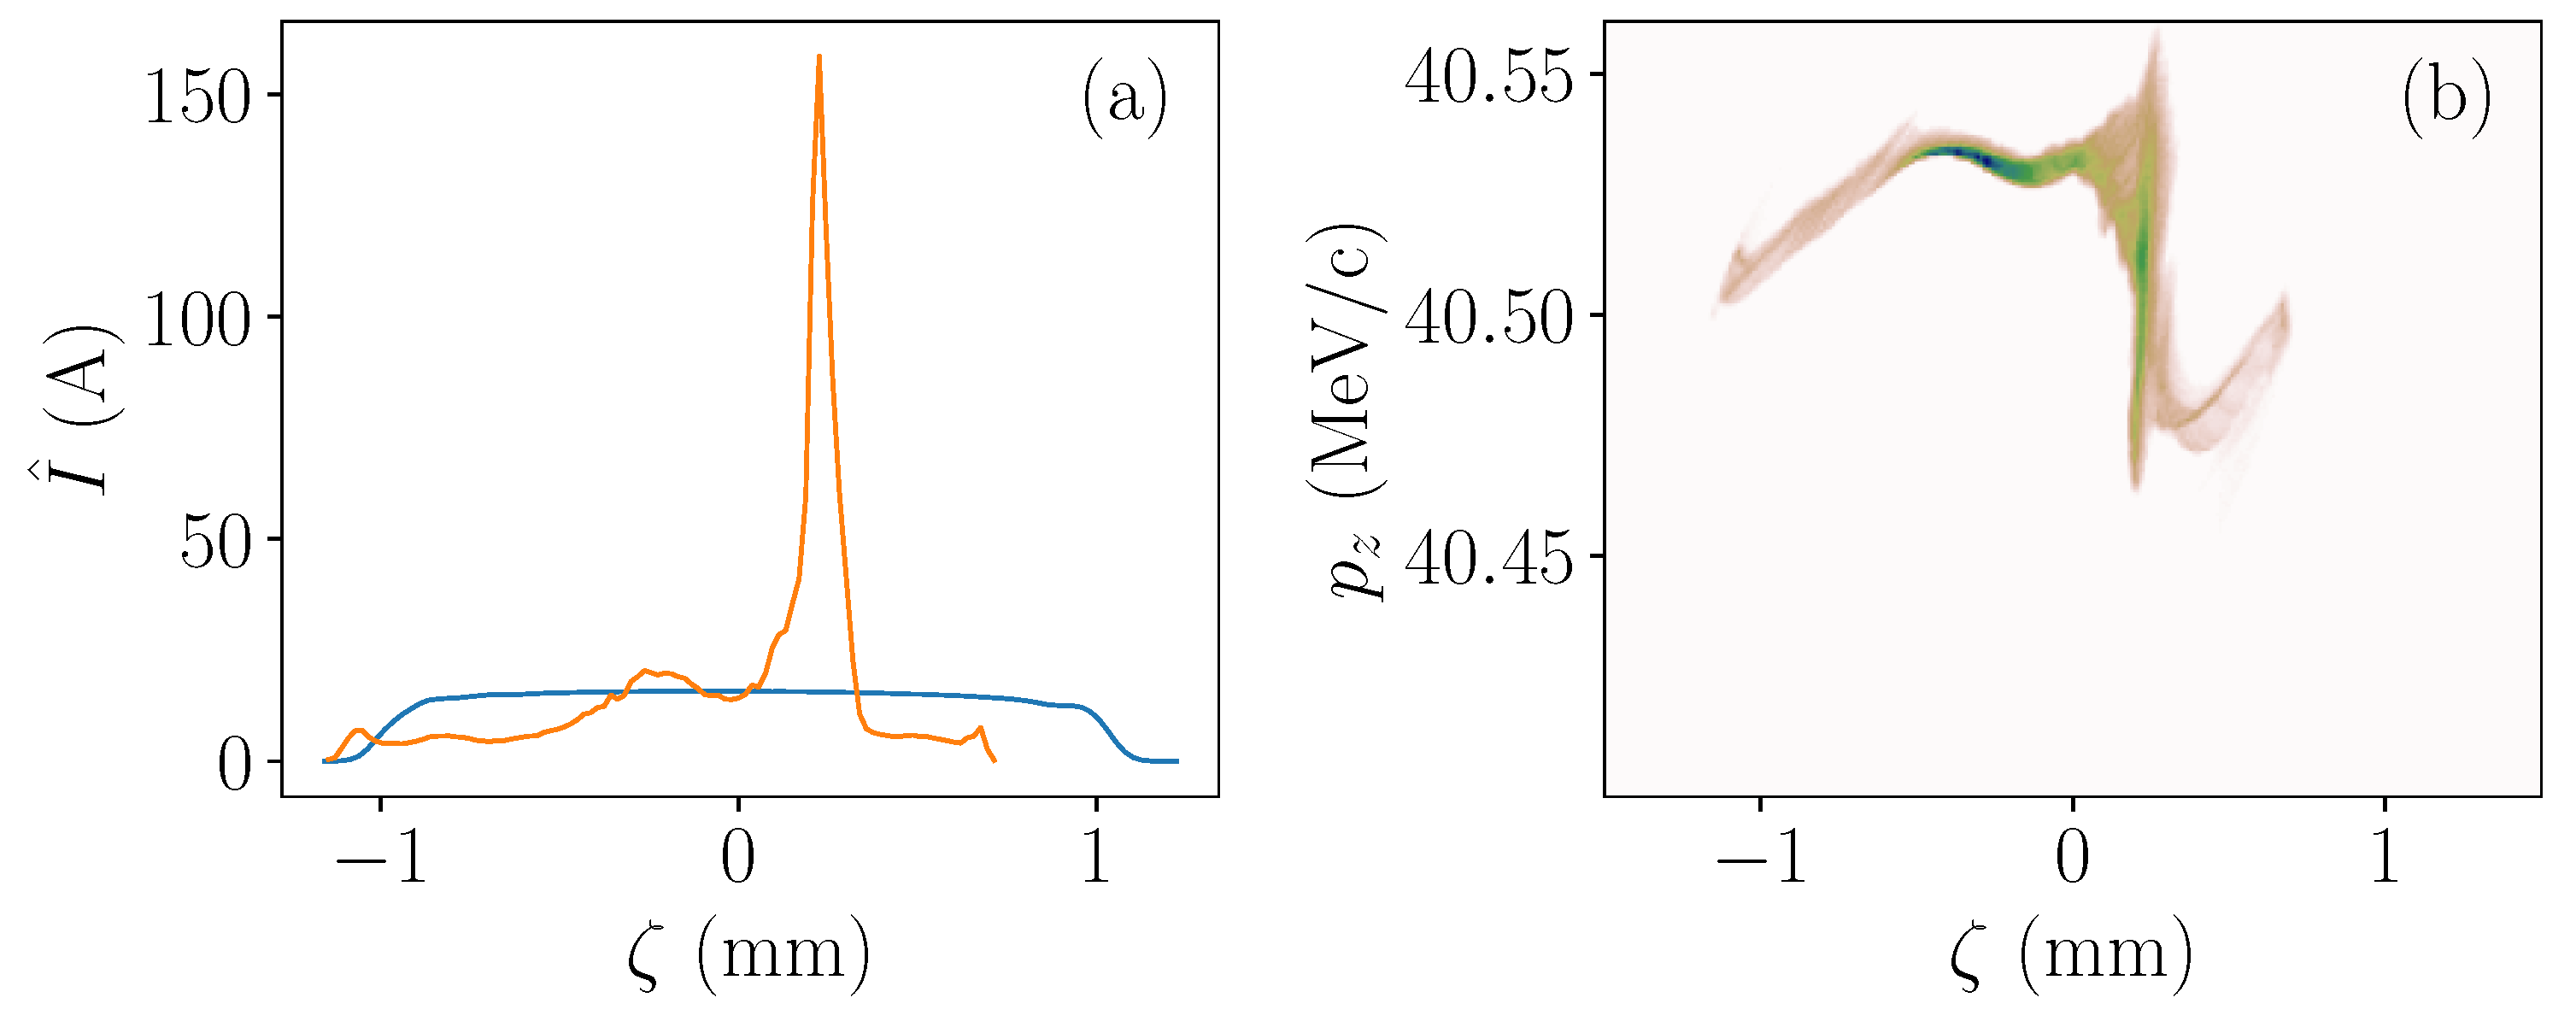
In Section 3.2, we considered the distribution to be optimized for the 5-meV MTE and flat-top laser distribution. The initial and final beam currents appear in Figure 7a, along with the final (b) longitudinal phase-space distribution. The peak current increases by a factor of ∼seven during compression and the longitudinal phase space is highly disrupted.
The final horizontal (bending-plane) emittance is found to increase by more than one order of magnitude, i.e., from 126 nm to µm. Considering the eigen emittances, we find the final horizontal emittance to be µm, which is ∼40% smaller than . Such a discrepancy between the projected and eigen emittances indicates that linear cross-plane correlations are present in the final beam distribution, and the proper correction of this coupling could further improve the projected emittance.
4. Discussion
The simulations presented in this paper indicate that obtaining low-emittance 100 pC bunches using the AWA drive beam accelerator is possible. Specifically, low emittance can be obtained using a flat-top laser pulse. In the near term, this model will be validated against experiments at the AWA. These experiments could present some challenges, as a stable beam and high-resolution diagnostics will also be required.
These simulations also confirm that the photocathode MTE does have an impact on the final transverse emittance of the electron beam in the considered photo-injector. Therefore, reducing the MTE of the photocathode would be beneficial to produce brighter bunches from the AWA photo-injector. A transverse emittance close to 100 nm was obtained for the 5 meV MTE. Consequently, we are planning an experimental campaign to explore the generation of bright bunches at AWA. In the first phase, and once the photo-injector is upgraded with a symmetrized RF gun for the first two accelerating cavities, the current photocathode (CsTe with 250-meV MTE) will be employed to validate the working point devised in this paper. Specifically, a digital-twin model of the AWA linac will be developed to precisely calibrate the operating parameters with physical quantities (e.g., RF input power set in the control room with a peak field in the RF gun or RF cavity). Such a model will ease the practical implementation of the optimum working point devised in this paper. The beam parameters (emittance and bunch length) will be measured and further optimized experimentally. These initial results will provide further guidance on the benefit of using lower MTE photocathodes as they become available from the Center for Bright Beam Collaborations. A second experimental phase will be dedicated to directly investigating the performances of lower MTE photocathodes within the AWA photo-injector. However, these photocathodes will first need to go through extensive characterization in a standalone L-band gun, which is available at the AWA facility.
Author Contributions
Conceptualization, P.P. and O.C.; investigation, E.F., A.A.M., P.P. and J.P.; resources, J.P., S.D. and E.W.; writing—original draft preparation, P.P., E.F. and A.A.M.; writing—review and editing, all; funding acquisition, P.P. and O.C. All authors have read and agreed to the published version of the manuscript.
Funding
This work was supported by the US National Science Foundation, under award PHY-1549132 to Cornell University and NIU, and by the US Department of Energy, Office of Science, under contract DE-AC02-06CH11357 with ANL. This research used the resources of the National Energy Research Scientific Computing Center, a DOE Office of Science User Facility supported by the Office of Science of the US Department of Energy under Contract No. DE-AC02-05CH11231 using NERSC awards BES-ERCAP0020725 and HEP-ERCAP0023031.
Data Availability Statement
The data presented in this study are available upon request from the corresponding author.
Conflicts of Interest
The authors declare no conflict of interest.
References
- Power, J.; Conde, M.; Gai, W.; Li, Z.; Mihalcea, D. Upgrade of the Drive LINAC for the AWA Facility Dielectric Two-Beam Accelerator. Conf. Proc. C 2010, 100523, THPD016. [Google Scholar]
- Qian, H.; Kwiatkowski, S.; Papadopoulos, C.; Paret, Z.; Sannibale, F.; Staples, J.; Wells, R. Analysis and optimization of coupler kick in APEX. In Proceedings of the 2013 Particle Accelerator Conference (PAC’13), Pasadena, CA, USA, 29 September–4 October 2013; pp. 607–609. [Google Scholar]
- Parzyck, C.T.; Galdi, A.; Nangoi, J.K.; DeBenedetti, W.J.I.; Balajka, J.; Faeth, B.D.; Paik, H.; Hu, C.; Arias, T.A.; Hines, M.A.; et al. Single-Crystal Alkali Antimonide Photocathodes: High Efficiency in the Ultrathin Limit. Phys. Rev. Lett. 2022, 128, 114801. [Google Scholar] [CrossRef] [PubMed]
- Frame, E.; Kim, S.; Lu, X.; Piot, P.; Power, J.; Scott, D.; Wisniewski, E. Simulations of the Upgraded Drive-Beam Photoinjector at the Argonne Wakefield Accelerator. In Proceedings of the International Particle Accelerator Conference (IPAC’22), Bangkok, Thailand, 12–17 June 2022; JACoW Publishing: Geneva, Switzerland, 2022; pp. 2015–2018. [Google Scholar] [CrossRef]
- Fortin, F.A.; Rainville, F.M.D.; Gardner, M.A.; Parizeau, M.; Gagné, C. DEAP: Evolutionary Algorithms Made Easy. J. Mach. Learn. Res. 2012, 13, 2171–2175. [Google Scholar]
- Floettmann, K. ASTRA—A Space Charge Tracking Algorithm. 2017. Available online: http://www.desy.de/~mpyflo/ (accessed on 1 June 2023).
- Gunantara, N. A review of multi-objective optimization: Methods and its applications. Cogent Eng. 2018, 5, 1502242. [Google Scholar] [CrossRef]
- Karkare, S.; Adhikari, G.; Schroeder, W.A.; Nangoi, J.K.; Arias, T.; Maxson, J.; Padmore, H. Ultracold Electrons via Near-Threshold Photoemission from Single-Crystal Cu(100). Phys. Rev. Lett. 2020, 125, 054801. [Google Scholar] [CrossRef] [PubMed]
- Luiten, O.J.; van der Geer, S.B.; de Loos, M.J.; Kiewiet, F.B.; van der Wiel, M.J. How to Realize Uniform Three-Dimensional Ellipsoidal Electron Bunches. Phys. Rev. Lett. 2004, 93, 094802. [Google Scholar] [CrossRef] [PubMed]
- Kim, K.J. Rf and space-charge effects in laser-driven rf electron guns. Nucl. Instruments Methods Phys. Res. Sect. A Accel. Spectrometers Detect. Assoc. Equip. 1989, 275, 201–218. [Google Scholar] [CrossRef]
- Xiao, L.; Ge, L.; Li, Z.; Ng, C.K. Advances in Multiphysics Modeling for Parallel Finite-Element Code Suite ACE3P. IEEE J. Multiscale Multiphysics Comput. Tech. 2019, 4, 298–306. [Google Scholar] [CrossRef]
- Ha, G.; Cho, M.H.; Namkung, W.; Power, J.G.; Doran, D.S.; Wisniewski, E.E.; Conde, M.; Gai, W.; Liu, W.; Whiteford, C.; et al. Precision Control of the Electron Longitudinal Bunch Shape Using an Emittance-Exchange Beam Line. Phys. Rev. Lett. 2017, 118, 104801. [Google Scholar] [CrossRef]
- Marzouk, A.A.; Piot, P.; Ryne, R. First-Principle Simulations of Electron-Bunch Compression Using a Large-Scale Liénard-Wiechert Solver. In Proceedings of the 2022 Advanced Accelerator Conference, Hauppauge, NY, USA, 6–11 November 2022. [Google Scholar]
- Ryne, R.D.; Mitchell, C.E.; Qiang, J.; Carlsten, B.E.; Yampolsky, N.A. Large-Scale Simulation of Synchrotron Radiation using a Lienard-Wiechert Approach. In Proceedings of the IPAC’12, NewOrleans, LA, USA, 2–25 May 2012; JACoW Publishing: Geneva, Switzerland, 2012; pp. 1689–1691. [Google Scholar]
Figure 1.
Diagram of the AWA photo-injector (a) and available Gaussian (b) and flat-top (c) temporal laser pulse distributions (the horizontal scale is in ps). In (a), the labels LB, LF, LM, and LSi represent solenoids, and Ci represents the accelerating cavities. The red chevron symbols indicate the direction of the RF input couplers.

Figure 2.
Pareto fronts of transverse normalized emittance and bunch duration for different MTEs using a Gaussian laser pulse (a) and a flat-top laser pulse (b). The optimization considers a 100 pC bunch charge.
Figure 2.
Pareto fronts of transverse normalized emittance and bunch duration for different MTEs using a Gaussian laser pulse (a) and a flat-top laser pulse (b). The optimization considers a 100 pC bunch charge.

Figure 3.
Emittance evolution along the AWA beamline for an MTE value of 250 (a), 60 (b), and 5 meV (c). The solid and dash traces correspond, respectively, to the case of a Gaussian and flat-top temporal shape for the photocathode laser pulse.
Figure 3.
Emittance evolution along the AWA beamline for an MTE value of 250 (a), 60 (b), and 5 meV (c). The solid and dash traces correspond, respectively, to the case of a Gaussian and flat-top temporal shape for the photocathode laser pulse.

Figure 4.
Example of bunch length () and transverse size () evolution (a–c) with the corresponding final transverse (d–f) and longitudinal (g–i) phase spaces simulated using a flat-top laser pulse for an MTE of 250 (a,d,g), 60 (b,e,h), and 5 meV (c,f,i). Only the horizontal phase space is shown, given that the beam is cylindrical-symmetric. The colormap in the density plots (d–i) represents the particle density with blue (resp. orange) corresponding to a higher (resp. lower) charge density.

Figure 5.
Change in transverse momentum, , as a particle with the initial co-ordinates passes through an accelerating cavity, as described using the 1D model (a) and the 3D field maps associated with a single (b), and dual RF-input coupler (c). Contours (d) and (e) represent the difference map between, respectively, (b) and (a) and between (c) and (a). The color map for contour (e) is scaled by so that the maximum value is about keV/c.

Figure 6.
Horizontal (a) and vertical (b) emittance evolution along the beamline for the 1D (blue) and 3D (orange) field map model and the associated transverse phase-space (c–e) and spatiotemporal (f–h) distributions. The density plots (c,f) give the phase space associated with the 1D model (cylindrical symmetry), whereas the plots (d,g) and (e,h) give the distributions along the horizontal and vertical direction, respectively, for the 3D map model. The colormap used in the density plots (c–h) is the same as employed in Figure 4.

Figure 7.
Initial (blue curve) and final (orange curve) peak current (a), along with the final longitudinal phase-space distribution (b), after magnetic bunch compression. The colormap used in the density plot (b) is the same as employed in Figure 4.
Figure 7.
Initial (blue curve) and final (orange curve) peak current (a), along with the final longitudinal phase-space distribution (b), after magnetic bunch compression. The colormap used in the density plot (b) is the same as employed in Figure 4.


Table 1.
Parameters considered during the optimization with their range of values.
| Parameter | Range |
|---|---|
| Laser rms spot size | 0.02–5 mm |
| Laser launch phase | −40–40 |
| Peak field on photocathode | 40–80 MV/m |
| Linac C1 and C2 phase | −50–50 |
| Linac C1 and C2 amplitude | 10–20 MV/m |
| Solenoid LB peak magnetic field | 0–0.4 T |
| Solenoid LF peak magnetic field | −0.4–0 T |
| Solenoid LM peak magnetic field | −0.4–0 T |
| Solenoid LS1 peak magnetic field | 0–0.5 T |
Table 2.
Values of optimized parameters “Beamline Settings” for the optimized flat-top cases for each photocathode MTE along with the resulting final beam parameters “Beam Parameters”.
Table 2.
Values of optimized parameters “Beamline Settings” for the optimized flat-top cases for each photocathode MTE along with the resulting final beam parameters “Beam Parameters”.
| Photocathode MTE (meV) | 250 | 60 | 5 |
|---|---|---|---|
| Beamline Settings | |||
| Laser rms spot size (mm) | 0.146 | 0.239 | 0.255 |
| Laser launch phase () | −2.88 | 5.30 | −3.08 |
| Peak field on photocathode (MV/m) | 75.12 | 64.62 | 72.37 |
| Cavity C1 phase () | −49.82 | −43.17 | −49.52 |
| Cavity C1 amplitude (MV/m) | 19.96 | 17.73 | 19.97 |
| Cavity C2 phase () | −49.96 | −48.25 | 11.21 |
| Cavity C2 amplitude (MV/m) | 10.18 | 11.01 | 13.53 |
| LB peak magnetic field (T) | 0.34 | 0.25 | 0.32 |
| LF peak magnetic field (T) | −0.34 | −0.26 | −0.32 |
| LM peak magnetic field (T) | −0.25 | −0.25 | −0.24 |
| LS1 peak magnetic field (T) | 0.02 | 0.04 | 0.08 |
| Beam parameters | |||
| Kinetic energy K (MeV) | 37.53 | 36.71 | 39.96 |
| Transverse emittance (µm) | 0.190 | 0.170 | 0.112 |
| Bunch length (mm) | 0.674 | 0.596 | 0.570 |
| Peak current (A) | 16.85 | 17.43 | 16.95 |
| Brightness (TA·m) | 466.63 | 603.16 | 1350.93 |
Disclaimer/Publisher’s Note: The statements, opinions and data contained in all publications are solely those of the individual author(s) and contributor(s) and not of MDPI and/or the editor(s). MDPI and/or the editor(s) disclaim responsibility for any injury to people or property resulting from any ideas, methods, instructions or products referred to in the content. |
© 2023 by the authors. Licensee MDPI, Basel, Switzerland. This article is an open access article distributed under the terms and conditions of the Creative Commons Attribution (CC BY) license (https://creativecommons.org/licenses/by/4.0/).
Share and Cite
MDPI and ACS Style
Frame, E.; Al Marzouk, A.; Chubenko, O.; Doran, S.; Piot, P.; Power, J.; Wisniewski, E. Opportunities for Bright Beam Generation at the Argonne Wakefield Accelerator (AWA). Instruments 2023, 7, 48. https://doi.org/10.3390/instruments7040048
AMA Style
Frame E, Al Marzouk A, Chubenko O, Doran S, Piot P, Power J, Wisniewski E. Opportunities for Bright Beam Generation at the Argonne Wakefield Accelerator (AWA). Instruments. 2023; 7(4):48. https://doi.org/10.3390/instruments7040048
Chicago/Turabian StyleFrame, Emily, Afnan Al Marzouk, Oksana Chubenko, Scott Doran, Philippe Piot, John Power, and Eric Wisniewski. 2023. "Opportunities for Bright Beam Generation at the Argonne Wakefield Accelerator (AWA)" Instruments 7, no. 4: 48. https://doi.org/10.3390/instruments7040048