Article

The Performance Analysis of Smartphone-Based Pedestrian Dead Reckoning and Wireless Locating Technology for Indoor Navigation Application

Department of Geomatics, National Cheng Kung University, 1 University Road, Tainan 701, Taiwan
*
Author to whom correspondence should be addressed.
Inventions 2016, 1(4), 25; https://doi.org/10.3390/inventions1040025
Submission received: 1 August 2016 / Revised: 6 November 2016 / Accepted: 25 November 2016 / Published: 5 December 2016

Abstract

:
Recent developments in smartphone technology have increased user demand for indoors applications. The Global Navigation Satellite System (GNSS) and the Inertial Navigation System (INS) are the two advanced systems for navigation technology. However, it is still difficult for GNSS to provide an accurate and practical navigation solution, especially in environments with little or no signal availability. These failings should be easy to overcome; because of their portability and multiple embedded hardware sensors, smartphones seem well positioned to make pedestrian navigation easy and convenient in any environment. Pedestrian Dead Reckoning (PDR) is one of the most commonly used technologies used for pedestrian navigation, but it is not always accurate because its positioning errors tend to accumulate over time. Therefore, this research introduces a new tool to overcome this failing; a Bluetooth Low-Energy (BLE) beacon can maintain and improve the accuracy of PDR. Moreover, a BLE beacon can be initialized from any user position in an indoor environment. The random and unpredictable positions of pedestrians inevitably result in the degradation of navigation guidance systems’ data. To rectify this problem, we have implemented activity recognition technology to notify the proposed system so as to provide a more accurate heading estimate. This study proposes a Personal Navigation System (PNS) based on this technology; it can estimate navigation solutions in real time and combines the advantages of PDR and Bluetooth positioning technology. A series of experiments were conducted to evaluate the accuracy of the system and the efficacy of our proposed algorithms. Preliminary results show the average relative precision of PDR to be about 2.5%, when using a mobile hand-held device. The error of initial position from 2-D beacon positioning is less than two meters. The proposed system works well without post-processing, and the multi-sensor activity recognition system can determine the placement of the device when it is being carried or used by someone with close to 100% accuracy.

Graphical Abstract

1. Introduction

Over the past twenty years, various kinds of indoor navigation systems have been developed based upon different theories and equipment [1]. These days, mobile communications technology has caused mobile devices to become nearly ubiquitous because they are multi-functional, easy to carry and are no longer very expensive. They have changed our lives in substantial ways. There are many brands of competing smartphones, using a wide variety of internal micro-electro mechanical system (MEMS) sensors, which are the basic components of indoor navigation technologies, such as Global Navigation Satellite System (GNSS) chips, accelerometers, gyroscopes, magnetometers, barometers, Bluetooth chips, and Wi-Fi chips. This makes the smartphone a potentially ideal mobile navigator. Liu et al. propose a smartphone indoor positioning engine that only uses the built-in sensor and computational resources [2]. Though the accuracy of such MEMS-grade sensors leaves much to be desired, thanks to constant technological innovation, no one doubts that smaller size and better performance could be expected in the near future.
The Pedestrian Dead Reckoning (PDR) has been extensively studied as an effective approach for estimating two-dimensional position for pedestrian navigation. It uses inertial sensors to detect human movement patterns, noting each step and estimating heading direction. However, unavoidable errors crept in due to the algorithm itself as well as the hardware sensors. MEMS sensors are often not very accurate, humans frequently alter speed, posture, and direction, and there is no fixed relationship between the sensors in the device and the human body. In addition, possible errors in step-count caused by an inadequately tuned threshold are hard to avoid due to inconsistencies in the behavior of the user. For example, when the threshold peak detection is used along with time interval, lower energy and duration may fail to detect the user’s steps [3], which lead to an accumulated position error. This problem is compounded because empirical formulas for estimating stride generally fail to accurately estimate users’ step-length because of various individual characteristics and walking habits. In an attempt to overcome this problem, Ho et al. have proposed an adaptive step-length estimator based on a fast Fourier transform smoother and a set of rules to estimate step length accurately [4]. In addition, some advance methods of detecting steps and estimating their length accurately, such as waist-attached accelerometers [5] and knee-attached gyroscope [6]. Although these devices can measure movement much more accurately than other methods, to function correctly, the sensors need to be mounted on specific parts of the body, which general users will not be willing to do. In addition to the above errors, there is still another error source: heading (azimuth). Magnetometers and gyros are able to provide magnetic heading and angular rate, respectively, and the derived heading from a magnetometer is based upon the measurement of the Earth’s magnetic field, so no errors will accumulate with time. However, the measured magnetic field will be significantly affected by the ambient indoor environment, including magnetic materials and obstacles that interrupt smooth readings and can even block them completely [7]. Gyroscopes, on the other hand, are relatively environment-independent sensors. Their measurement will not be affected by environmental conditions the way magnetometers can be. However, the nature of gyros causes them to require an initial heading, and their errors accumulate with time.
As stated in the previous paragraph, PDR errors accumulate step-by-step because of inaccurate step count, step length and heading estimates. In order to maintain navigational accuracy, a PDR integrated with another external positioning system is needed. Indoor RF-based localization can be considered as the external positioning system for PDR because Bluetooth and Wi-Fi chips are generally embedded in smartphones. The RF-based localization systems commonly used for indoor positioning include Wi-Fi, RFID and Bluetooth. In most studies the received signal strength index (RSSI) has been used as the main measurement to navigate an indoor environment. Mohammadi and Boonsriwai et al. all used signal strength to locate a pedestrian in indoor environments [8,9]. Because of the wide signal area, Wi-Fi based indoor positioning system are also employed. Fingerprinting, the pattern matching algorithm commonly used for Wi-Fi positioning, uses signal power strength to estimate position. The deployment of the fingerprinting method involves both a training and positioning phase. In the training step, signal power strength data (the location fingerprint) are collected and saved to a database. In the positioning step, the user’s signal power strength is compared to the values stored in the database, after which the algorithm compares the real-time measurement to the fingerprints obtained in training and determines a position that best fits the fingerprints. Although a Wi-Fi installation has a broad coverage, the location of the Wi-Fi service is limited by the availability of a power supply. Other disadvantages are volume, a lack of privacy, and the distribution geometry. On the other hand, the newest version is Bluetooth 4.0, which includes Bluetooth Low-Energy (BLE) technology. Traditional Bluetooth has a significantly long scan time, which limits its value for localization. However, BLE has overcome the limitations of a long scan time and is supported by most current smartphones. In addition, BLE beacons also have the following advantages: lower power consumption (usually battery powered), low cost, lower air data rate, small size, and light weight. Faragher et al. analyzed the accuracy of WiFi and BLE fingerprinting in a large indoor space with a highly accurate ultrasonic ground truth referencing system [10]. Zhuan et al. propose an algorithm comprised of PDR and BLE beacons to improve stable performance [11].
Activity recognition has been developed to obtain contextual information that characterizes the situation of the user, such as activity, location, preferences, and operating environment [12]. Contextual information can be adapted to the operation environment and provides useful information to the system without user intervention. As previously mentioned, human movement, variations in device placement, and the relation between the sensor body frame and the pedestrian frame not being fixed can all lead to additional errors. Thus, reconstruction of relative relations is significant in this study. The accelerometer is one of the most commonly used sensors for activity recognition. Kern et al. used a wired and wearable accelerometer to collect contextual information of subjects sitting, standing, walking, etc. [13]. However, a wired sensor is quite impractical for general use with a mobile device. Moschetti et al. developed a system using wearable hand and wrist sensors that recognizes nine different daily activities based on gestures [14]. Though most of the studies have use accelerometers, some have made use of other sensors. Lara et al. used several inertial sensors, such as accelerometers and gyroscopes, to classify gestures such as eating and drinking [15]. Altun et al. even used the intensity of the earth’s magnetic force in relation to a magnetometer as support for activity recognition. Fortunately, smartphones generally contain such embedded hardware [16].
Though there are several algorithms for pedestrian navigation that can significantly improve navigation accuracy, these approaches generally require inconvenient preparation or have additional limitations. The main objective of this study is the development of an application that uses low cost MEMS sensors found in typical smartphones for pedestrian navigation. The proposed PNS is based on PDR, activity recognition, and RF-based localization.

2. Materials and Methods

2.1. System Calibration

Compensating for errors and making correct calibrations are always key steps for inertial sensors. MEMS inertial sensor errors are often changeable and unstable, but the preliminary analysis of errors is still valuable for performance verification and compensation [17]. Accelerometers and gyroscopes have their own errors, including deterministic errors and random errors. Deterministic errors include biases, scale factors and non-orthogonality. The following equations are for measurements from gyros and accelerometers [18]:
l ω = ω + b ω + S ω ω + N ω ω + ϵ ( ω ) l f = f + b f + S f f + N f f + ϵ ( f ) + δ g
All of these variables are directly linked to the gyroscope and accelerometer: l ω and l f are the measurements; ω and f are the corrected measurements; b ω and b f are the bias; S ω and S f are the scale factor; N ω and N f are the non-orthogonality; ϵ ( ω ) and ϵ ( f ) are the noise; and δ g is the deviation from theoretical gravity.
The influences of deterministic errors are usually larger than random errors that are determined by calibration and then removed from the raw measurements. The six-position method calibrates those deterministic errors easily. The basic idea is to use symmetrical positions to get the bias by eliminating the reference value; the scale factor can also be obtain from the ratio with respect to the reference value. The equations for solving the bias and scale factor error are given below [17]:
b = l u p + l d o w n 2 s = l u p l d o w n 2 q 2 q
Where b is the bias; s is the scale factor error; l u p is the measurement of the upward axis; l d o w n is the measurement of the downward axis; and q is the reference value.
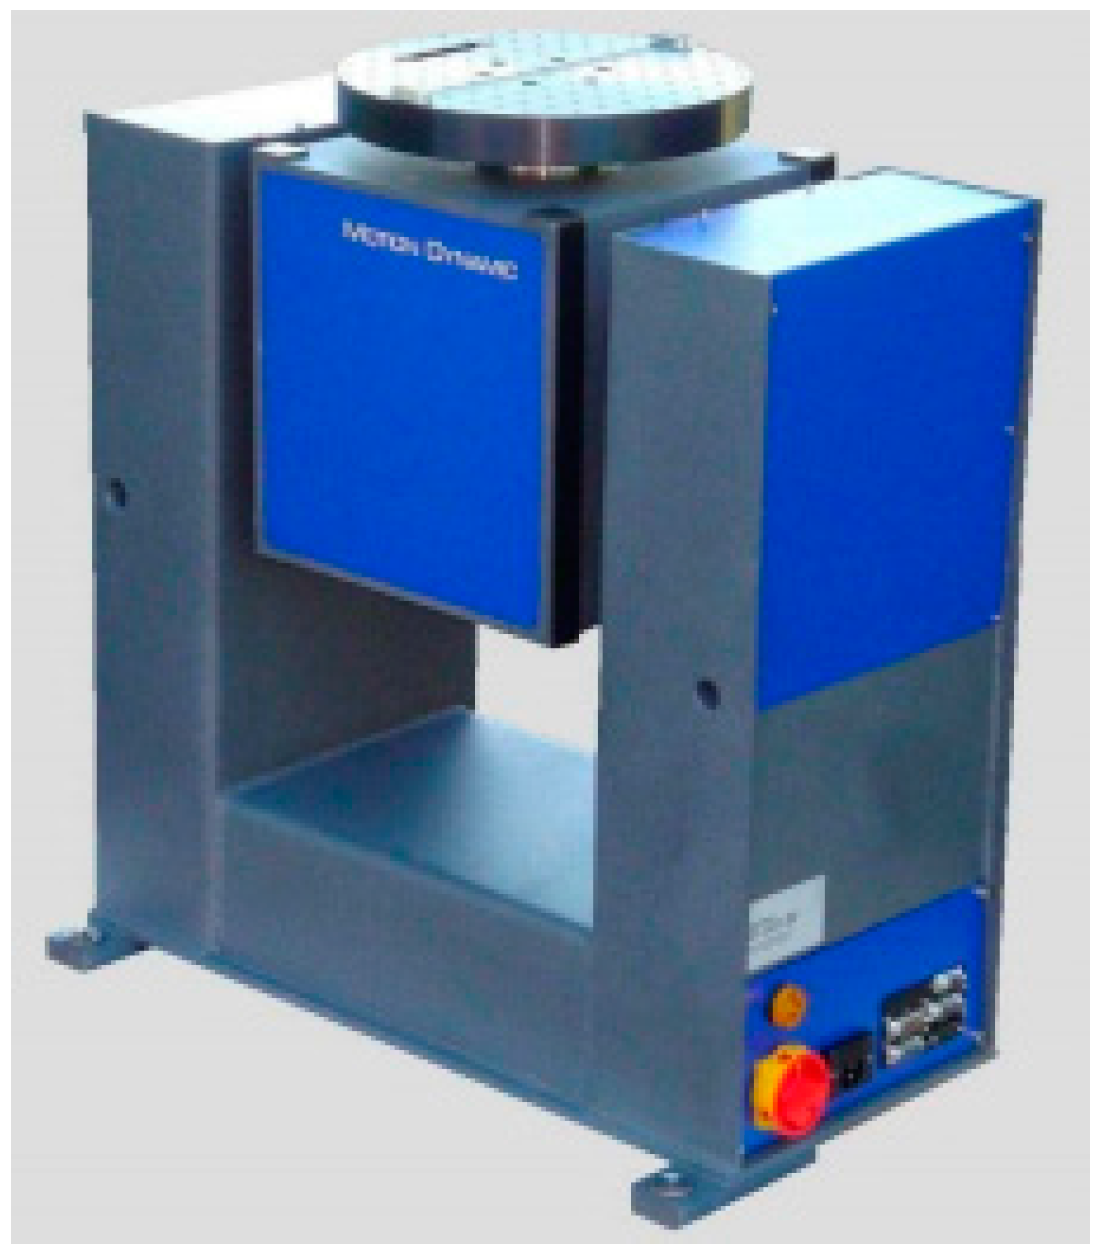
The six-position method can be implemented for both static cases and dynamic cases using a MEMS gyroscope that do not use the earth’s rotation as a reference value. Symmetrical positions in dynamic cases become symmetrical rotations. The simplified test fixes the inertial sensors on the top of a table for the three axes; the table has a fixed motion rate of 30 degrees. A static test for the accelerometer and a dynamic test for the gyro have been performed for this research using a turntable that has been leveled to the best degree possible so it can provide a constant rotation. The turntable used in this research is shown in Figure 1. The TES-3T (Motion Dynamic, Altendorf, Switzerland) was designed for angular positioning, precise uniform rate, and angular motion profiling.

2.2. Activity Recognition

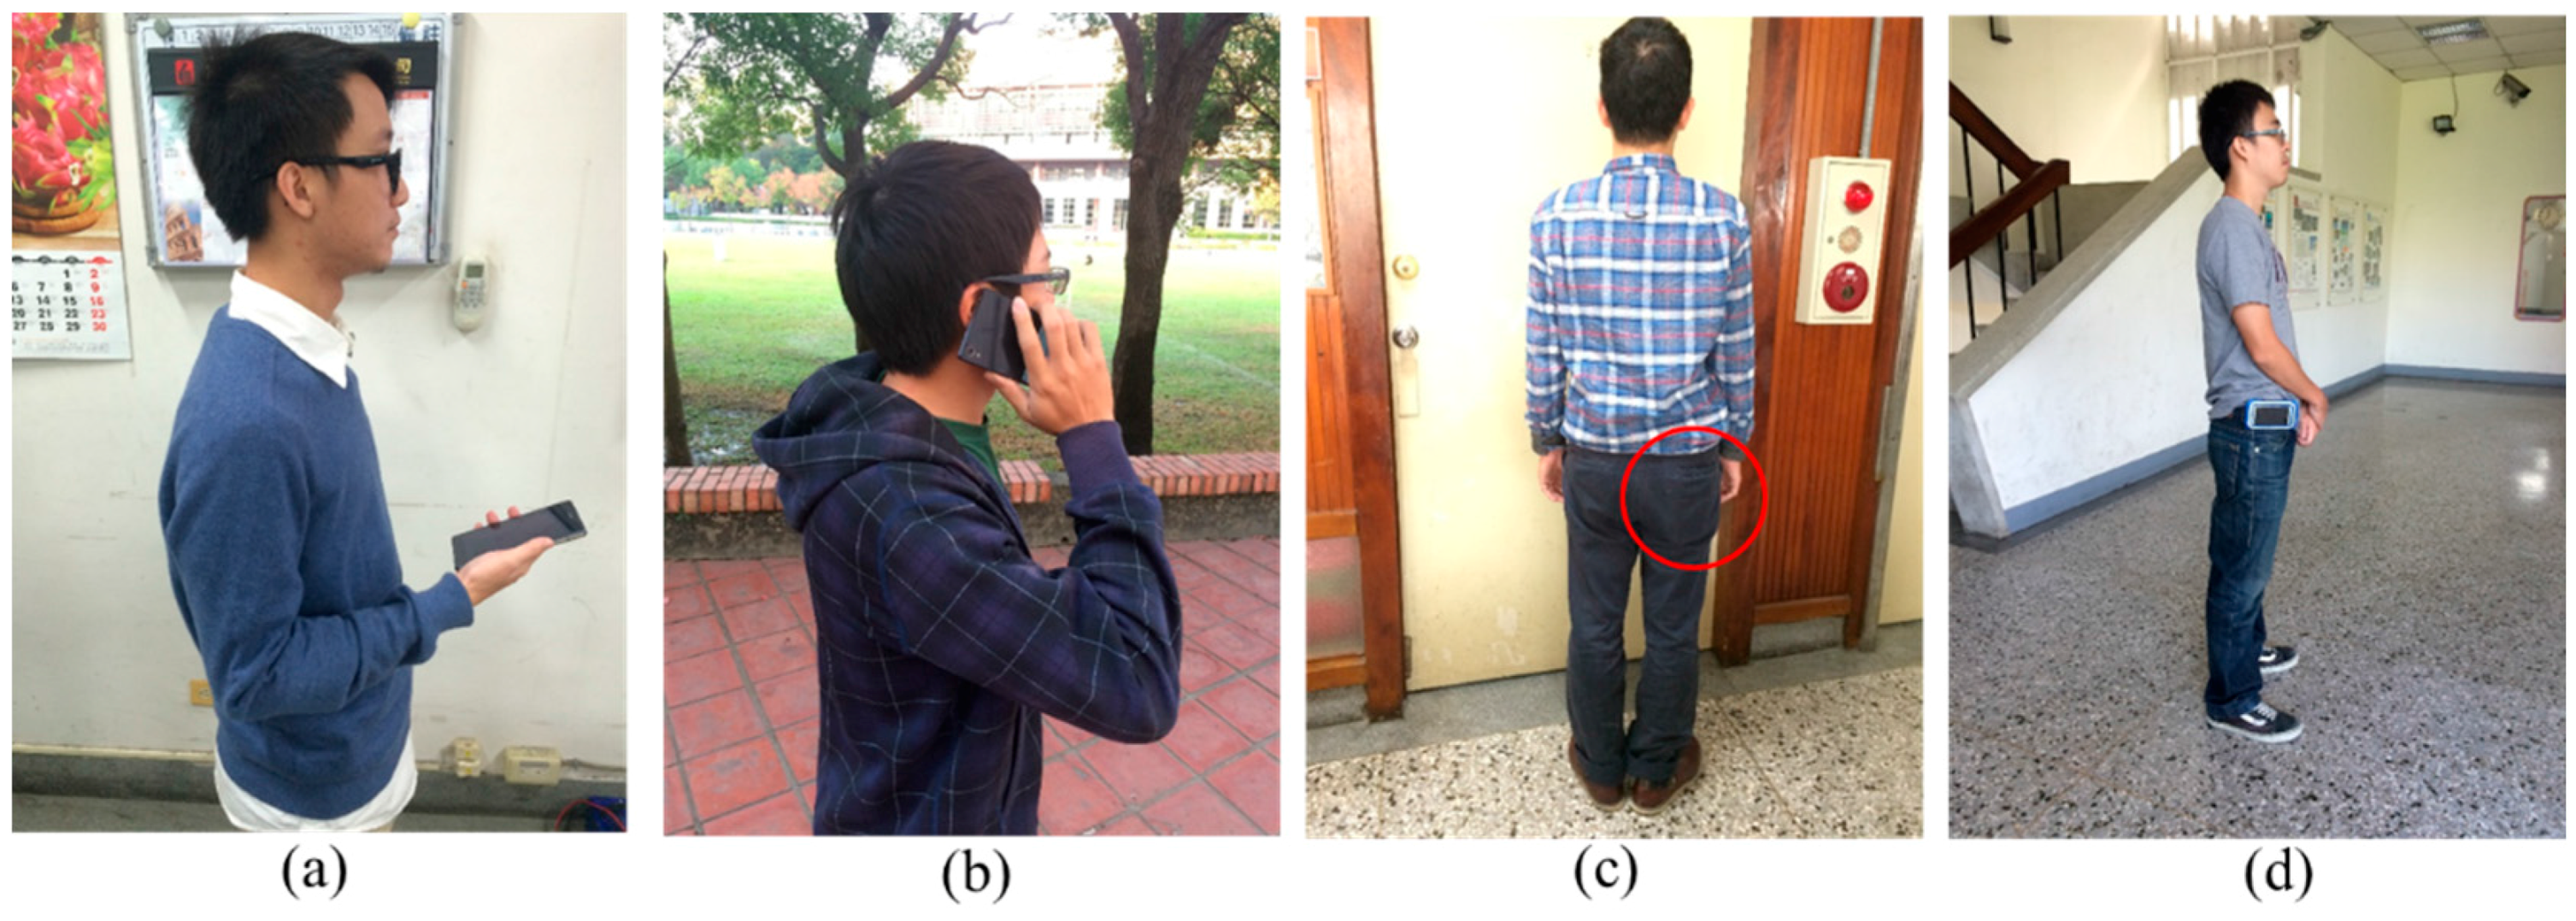
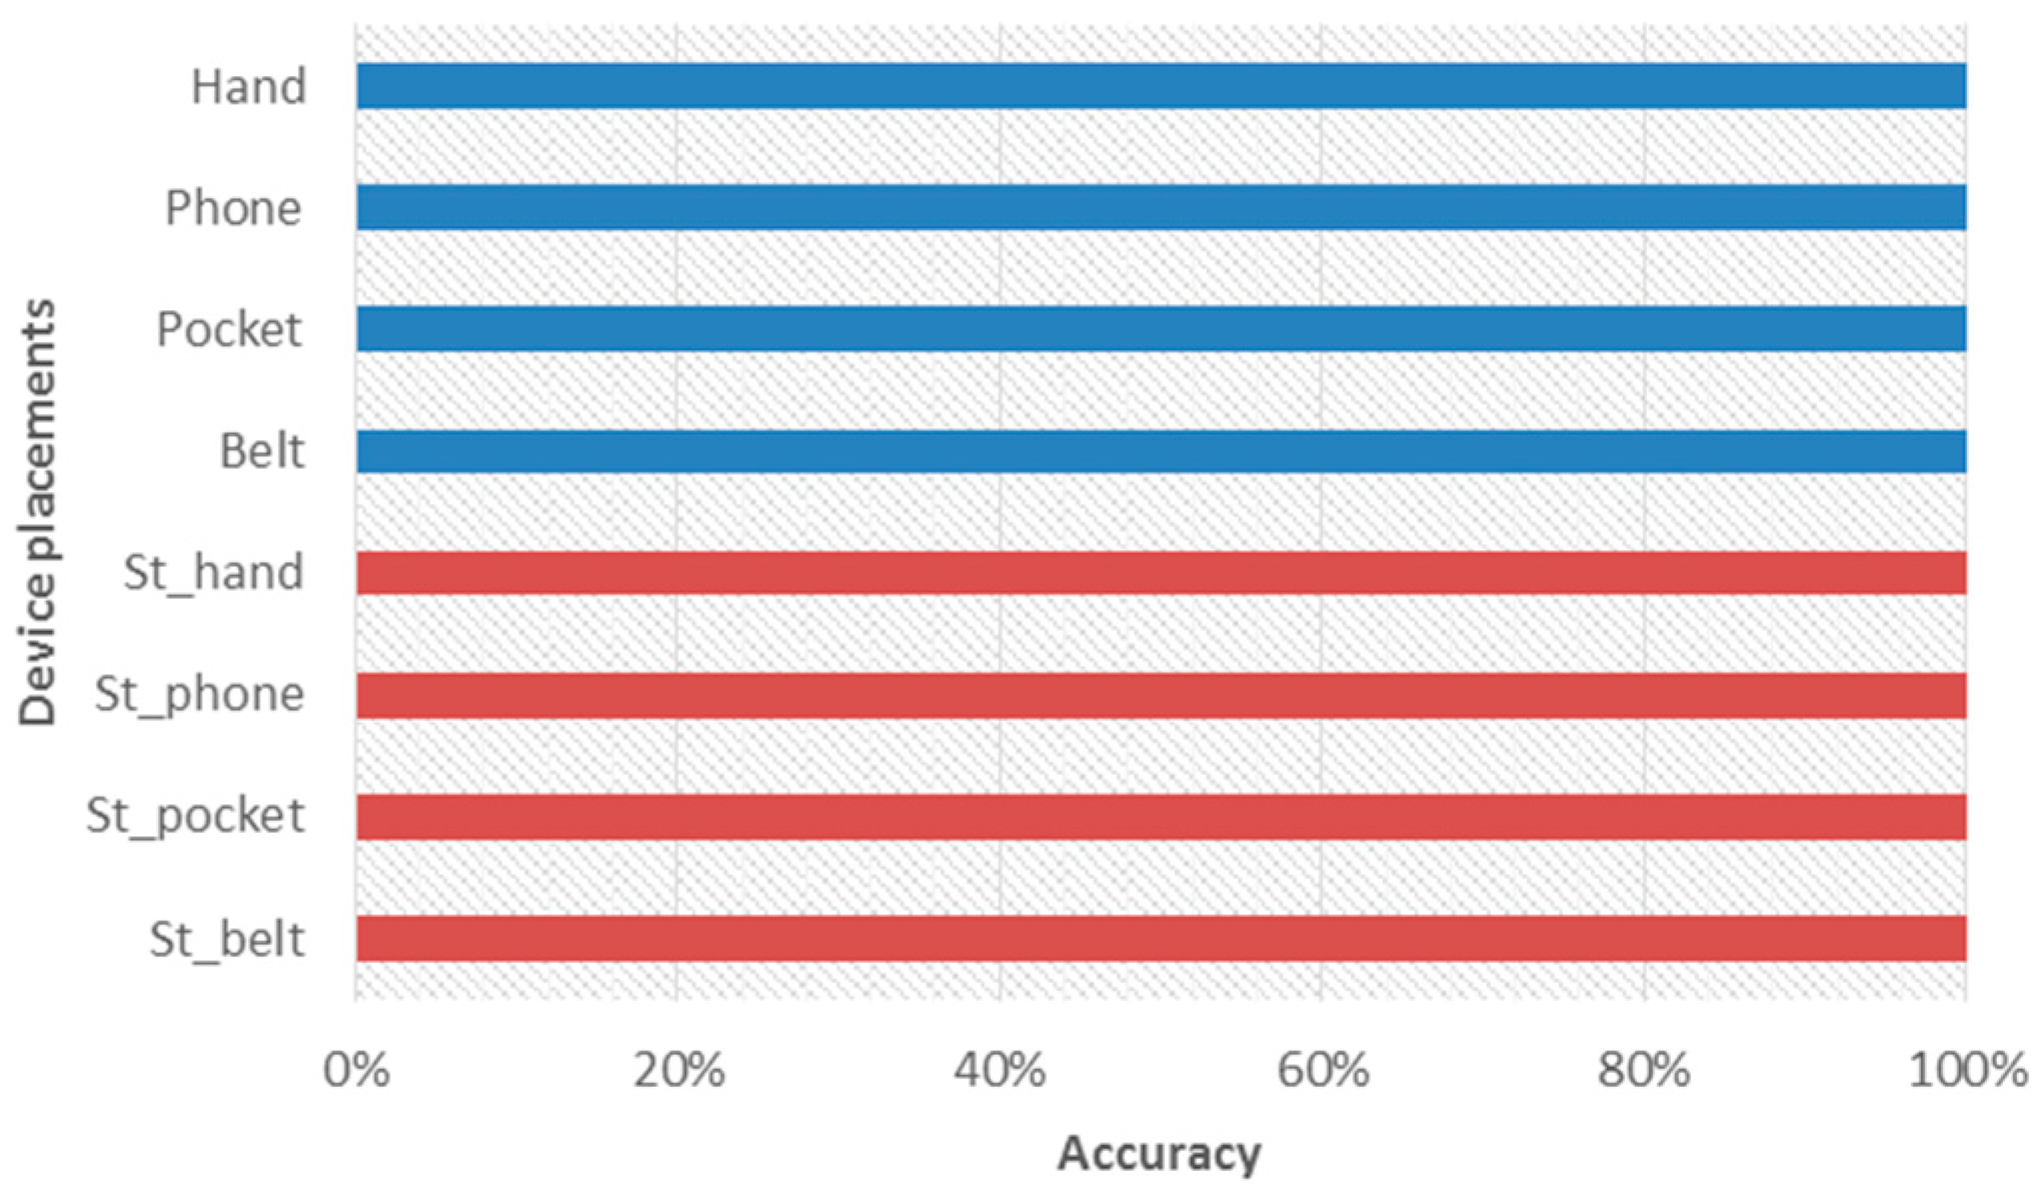
Activity recognition is used to choose the appropriate heading estimation algorithm based on the different relationships between each frame. Because phones may be hand-held, held close to the ear, attached to a belt, or kept in the pocket, tests were performed for each of these four physical situations. The basic processing flow of the activity recognition follows an approach proposed by Avci [19], which includes signal preprocessing, segmentation, feature extraction, and classification, as shown in Figure 2.
Training and testing data were collected from the accelerometer, proximity sensor, and the light sensor embedded in the smartphone at a sampling rate of 20 Hz. These MEMS-based sensors commonly generate some noise, so the development of a well-established low-pass filter and calibration are necessary. The proximity sensor and light sensor can both improve the accuracy of activity recognition because they can help the system to recognize the characteristics that generated by typical events in daily life. For example, if the smartphone is close to the ear, the algorithm will detect the decreasing distance between the smartphone and user based upon the declining luminance. Therefore, the recognition accuracy of close-to-ear will be enhanced. The segmentation of the signal is a major step before feature extraction. There must be enough data for signal segmentation to be executed completely. The sliding window size impacts the results of activity recognition. In order to develop pattern recognition using smartphones for real-time applications, processing time, sampling frequency, and data overlap are constrained. In this research, a sliding window containing five records is used to segment data with 80% overlap between successive windows to avoid losing information.
By analyzing these signals, features can be extracted from the data segmentation. Features can be defined as the main characteristics of data segments. In general, features can be defined as the abstraction of raw data, and the purpose of feature extraction is to find the main characteristics of data segments that accurately represent the original data [20]. In particular, the following features have been evaluated for each phone position: mean, standard deviation, and root mean square. Features are used to classify the different positions using a Decision Tree (DT). The DT is a low-complexity logic system for decision making, and has a hierarchical structure and rules. The classification continues until a decision is reached. The necessary conditions, or rules, can be obtained through a training process using a sample dataset. Finally, this study uses rule-based algorithms, as a decision tree, to detect context information based on knowledge from previous training. DT is widely used in activity recognition problems. In practice, when the system detects a difference in device placement, the algorithm identifies the phone’s physical position (in the hands, close to the ear, on the belt, or in the pocket), and then provides the appropriate heading information. The core algorithm is based on frame transformation. Frame transformation allows the system to calculate the heading of the user for the different device locations.

2.3. Bluetooth Positioning

Bluetooth positioning technology is used for both to initialize and update the user’s location by Bluetooth beacon (THLight Co. Ltd., New Taipei City, Taiwan) in this research. The methods of initialization include proximity and bounding box. In the bounding box method, the distance between the object and a minimum of three reference points are used for initialization. The distances are determined by the measurements of the Received Signal Strength Indicator (RSSI).
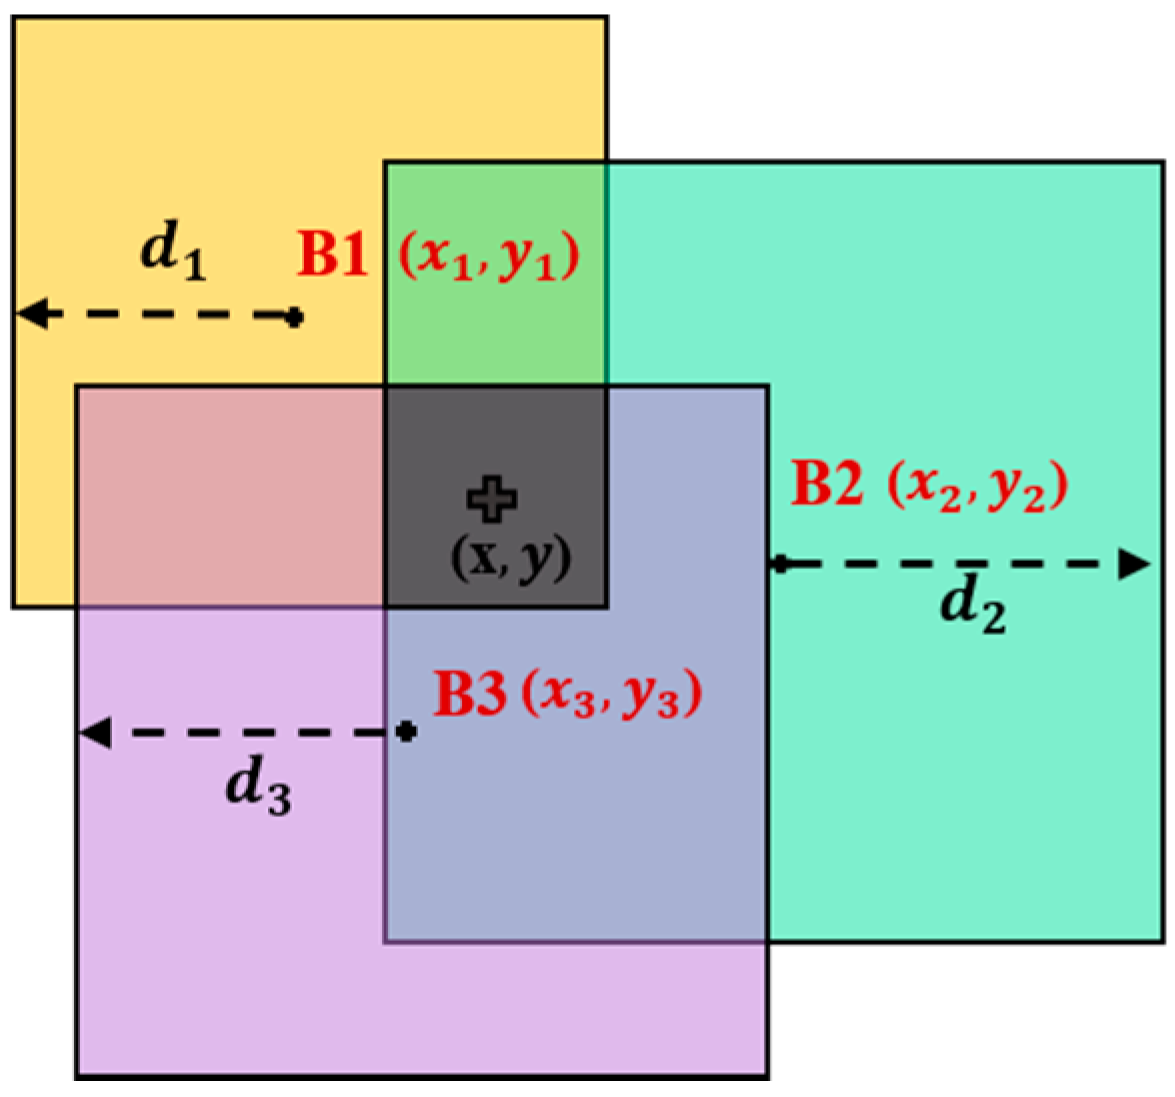
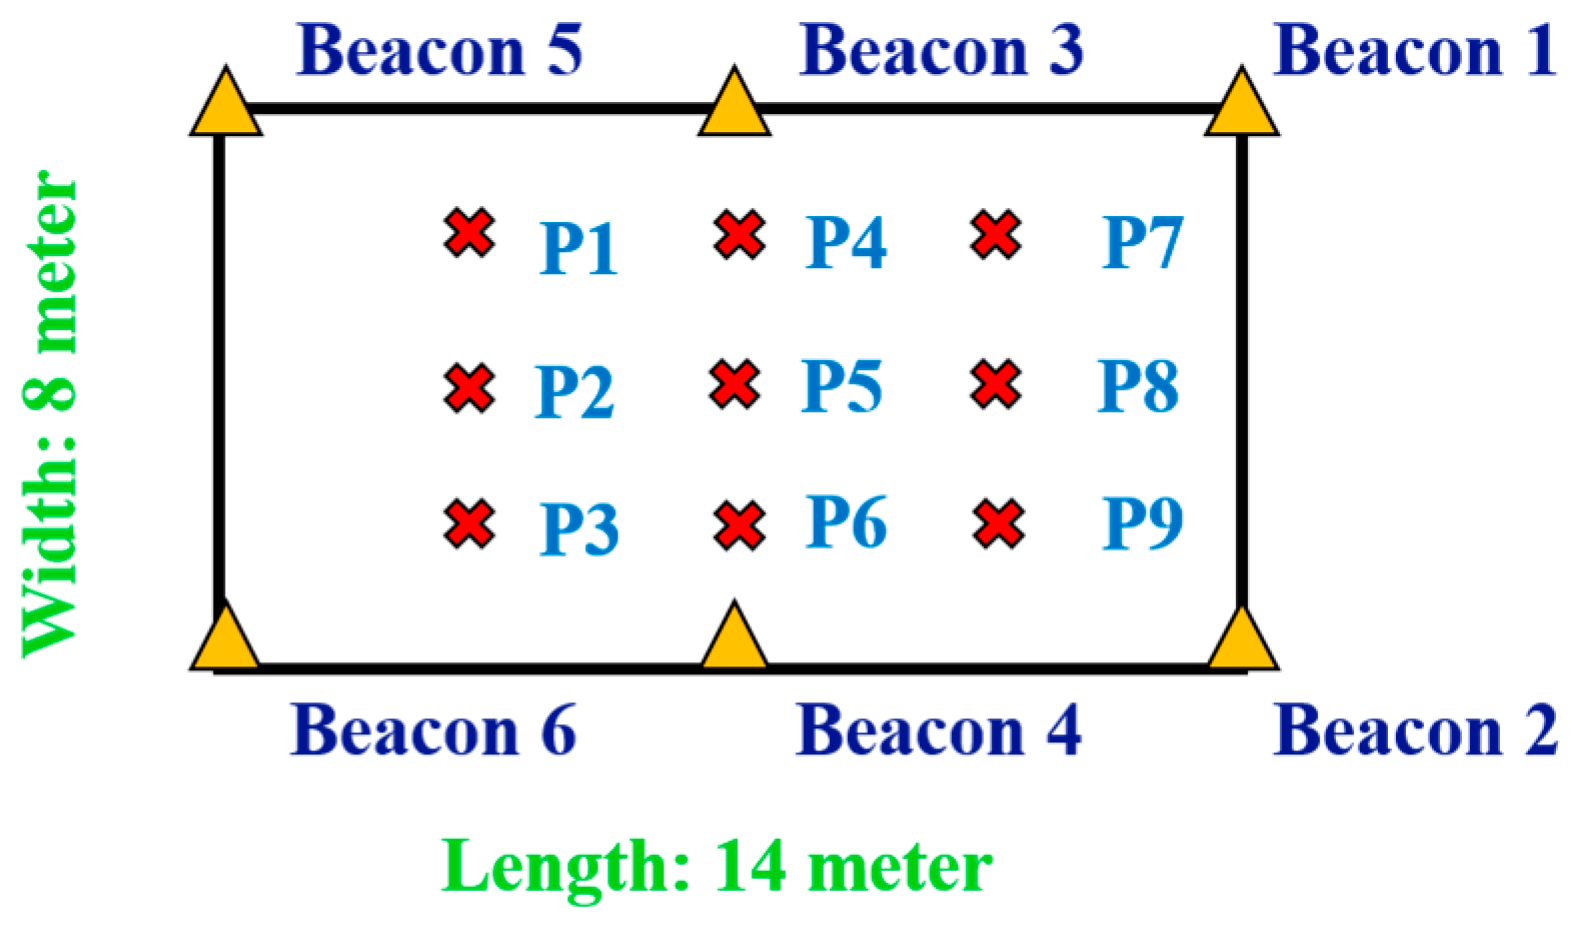
The bounding box method, proposed by Boukerche et al (2007), uses squares to establish the boundaries of the possible position of a node [21]. As shown in Figure 3, B1, B2 and B3 are three beacons; ( x 1 ,   y 1 ), ( x 2 ,   y 2 ) and ( x 3 ,   y 3 ) are the known coordinates of each beacon, respectively; d 1 , d 2 and d 3 are the estimated distances of corresponding beacon. For each beacon, a bounding box is defined as a square (the squares with different colors shown in Figure 3) with its center at the known position ( x i , y i ), and sides of size 2 d i (where d is the estimated distance), and with a lower left coordinate ( x i d i , y i d i ) and an upper right coordinate ( x i + d i , y i + d i ). The intersection of all bounding boxes can be easily computed by taking the maximum of the low coordinates and the minimum of the high coordinates of all bounding boxes in Equation (3).
x m a x = max ( x 1 d 1 , x 2 d 2 , x 3 d 3 ) y m a x = max ( y 1 d 1 , y 2 d 2 , y 3 d 3 ) x m i n = min ( x 1 + d 1 , x 2 + d 2 , x 3 + d 3 ) y m i n = min ( y 1 + d 1 , y 2 + d 2 , y 3 + d 3 ) x = x m a x + ( x m i n x m a x ) / 2 y = y m a x + ( y m i n y m a x ) / 2
In the proximity method, when the system scans and detects the beacons, an algorithm identifies each one by its ID setting. If the signal received is from a proximity-type beacon with an RSSI larger than the threshold, the system obtains the initial location based upon the position of the proximity-type beacon that is recorded in the database. Only proximity method is used to update the location of the user in the following experiments.

2.4. Pedestrian Dead Reckoning

The PDR that has been developed includes step detection, stride length estimation, and heading estimation. Based on the physiological characteristics of the pedestrian, the waveform for the three-axis accelerometer output values can be obtained for the formation of cyclical changes [22]. The cyclical changes and characteristic values can be used for step detection. According to Mladenov et al., the periodic up and down motion of the human body during each step is the strongest indicator [23]. However, the axes of the smartphone may be not perfectly aligned and fixed for the moving subject. Therefore, calculating the magnitude of acceleration vector is generally the best method for detecting individual steps. In addition, the accelerometer records the raw data, which includes gravity and motion acceleration. Before step detection, gravity must be separated, as in Equation (4).
a ( t ) = a x 2 ( t ) + a y 2 ( t ) + a z 2 ( t ) g
Here, a ( t ) is the magnitude of acceleration vector at time t ; a x ( t ) , a y ( t ) and a z ( t ) are the output data of tri-axial accelerometer in the x , y , and z directions at time t ; g is gravity (9.81 m / s 2 ).
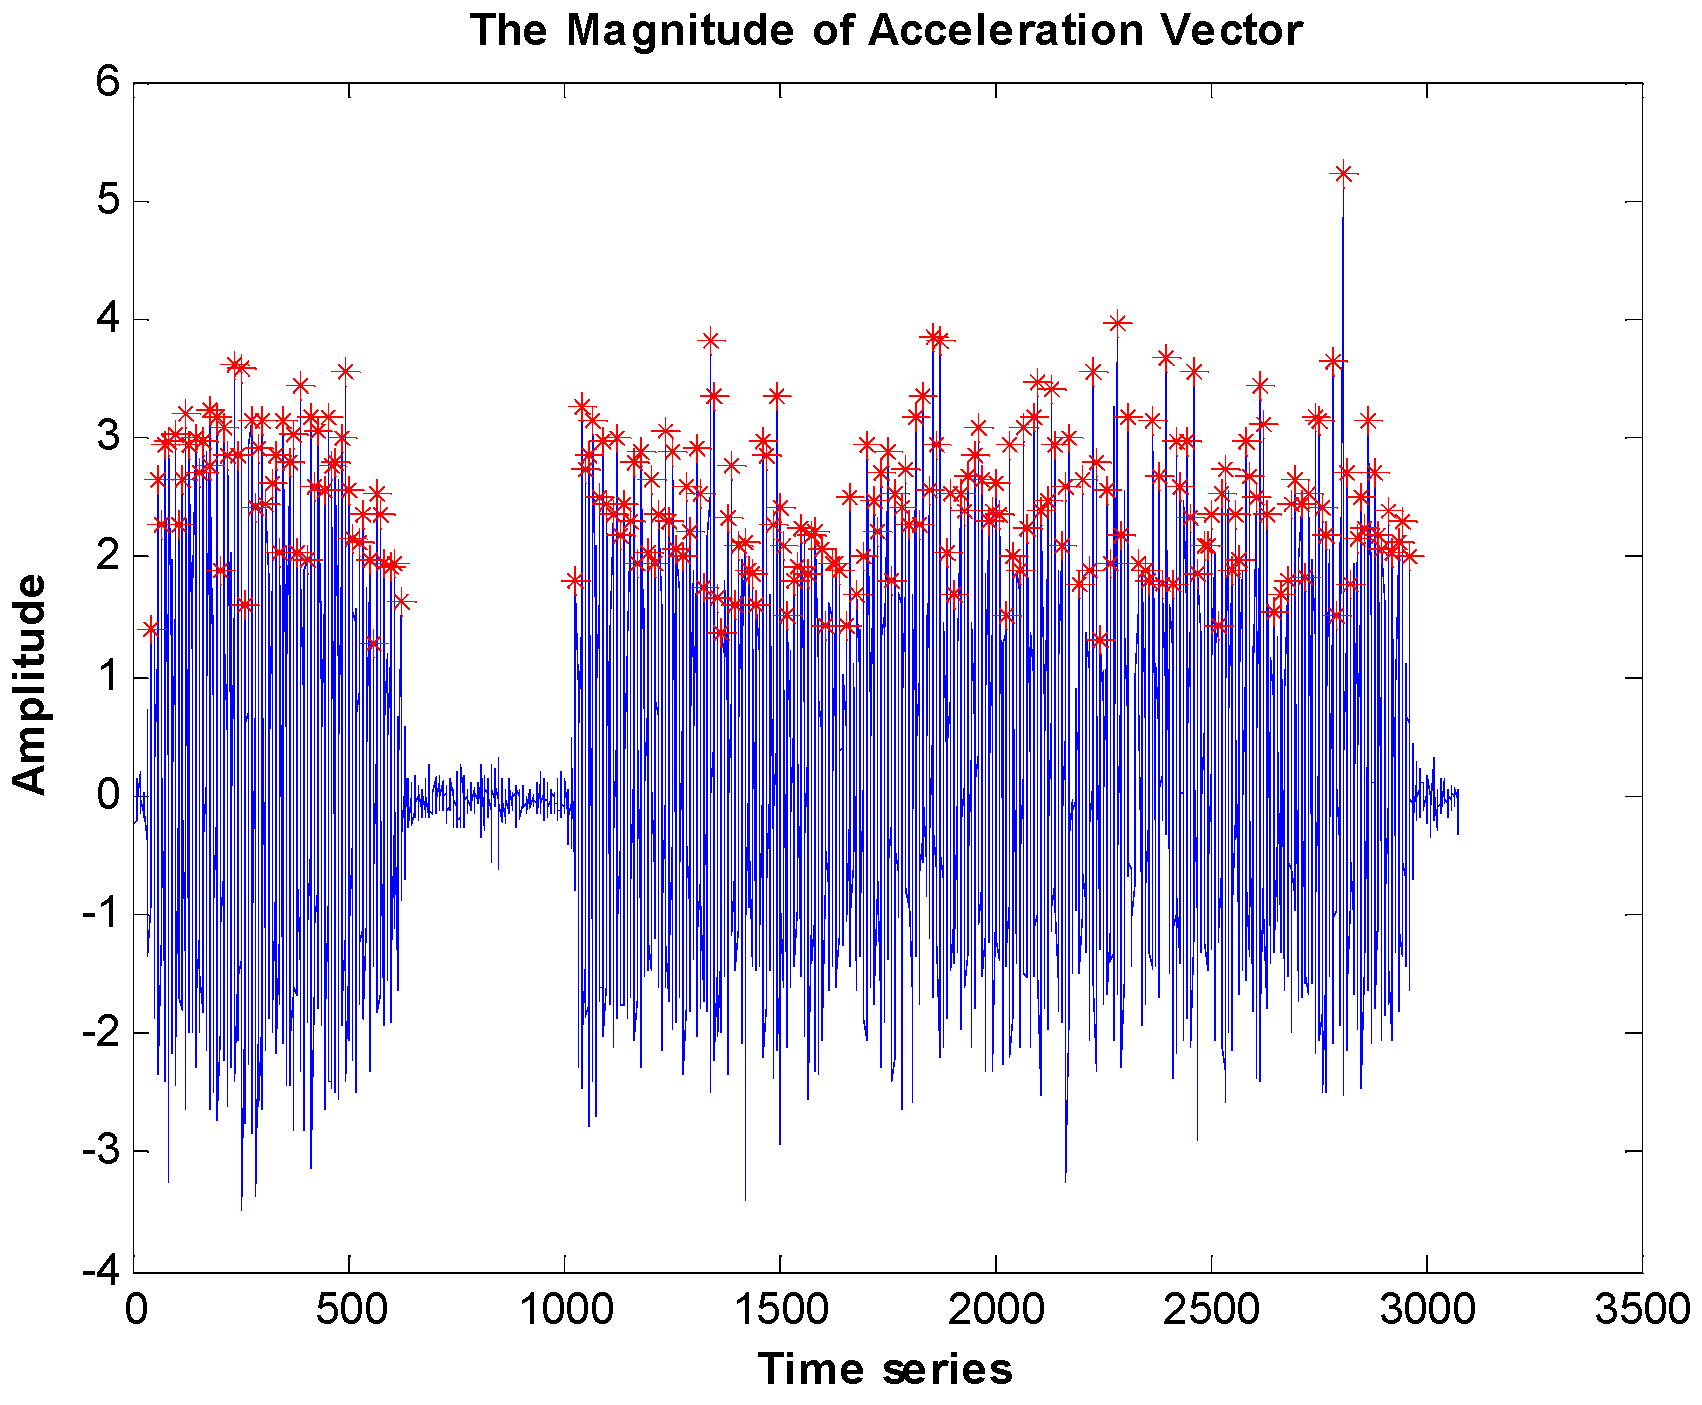
In this study, step detection is based on peak detection with setting thresholds of maximum peak value and time intervals. These are a useful way to reduce the detection of redundant peaks. The threshold of a maximum peak means the peak should be larger than the threshold; this ensures the value is a peak. The threshold of a time interval is able to reduce the peaks, assuming that the step interval between each step is larger than the threshold. In this research, the values of the two thresholds are fixed during the whole experiment. An example of step detection depicting the results of step detection is shown in Figure 4, where the red points are the maximum peak and the blue lines are the magnitude of the acceleration vector.
Next, stride length is estimated using an empirical model [24].
S L = [ 0.7 + a ( H 1.75 ) + b ( ( S F 1.79 ) H 1.75 ) ] k
Where, S L is the estimated stride length; S F is the step frequency; and H is the height of the user. The known coefficients a and b are 0.371 and 0.227, respectively, and k is the personal factor.
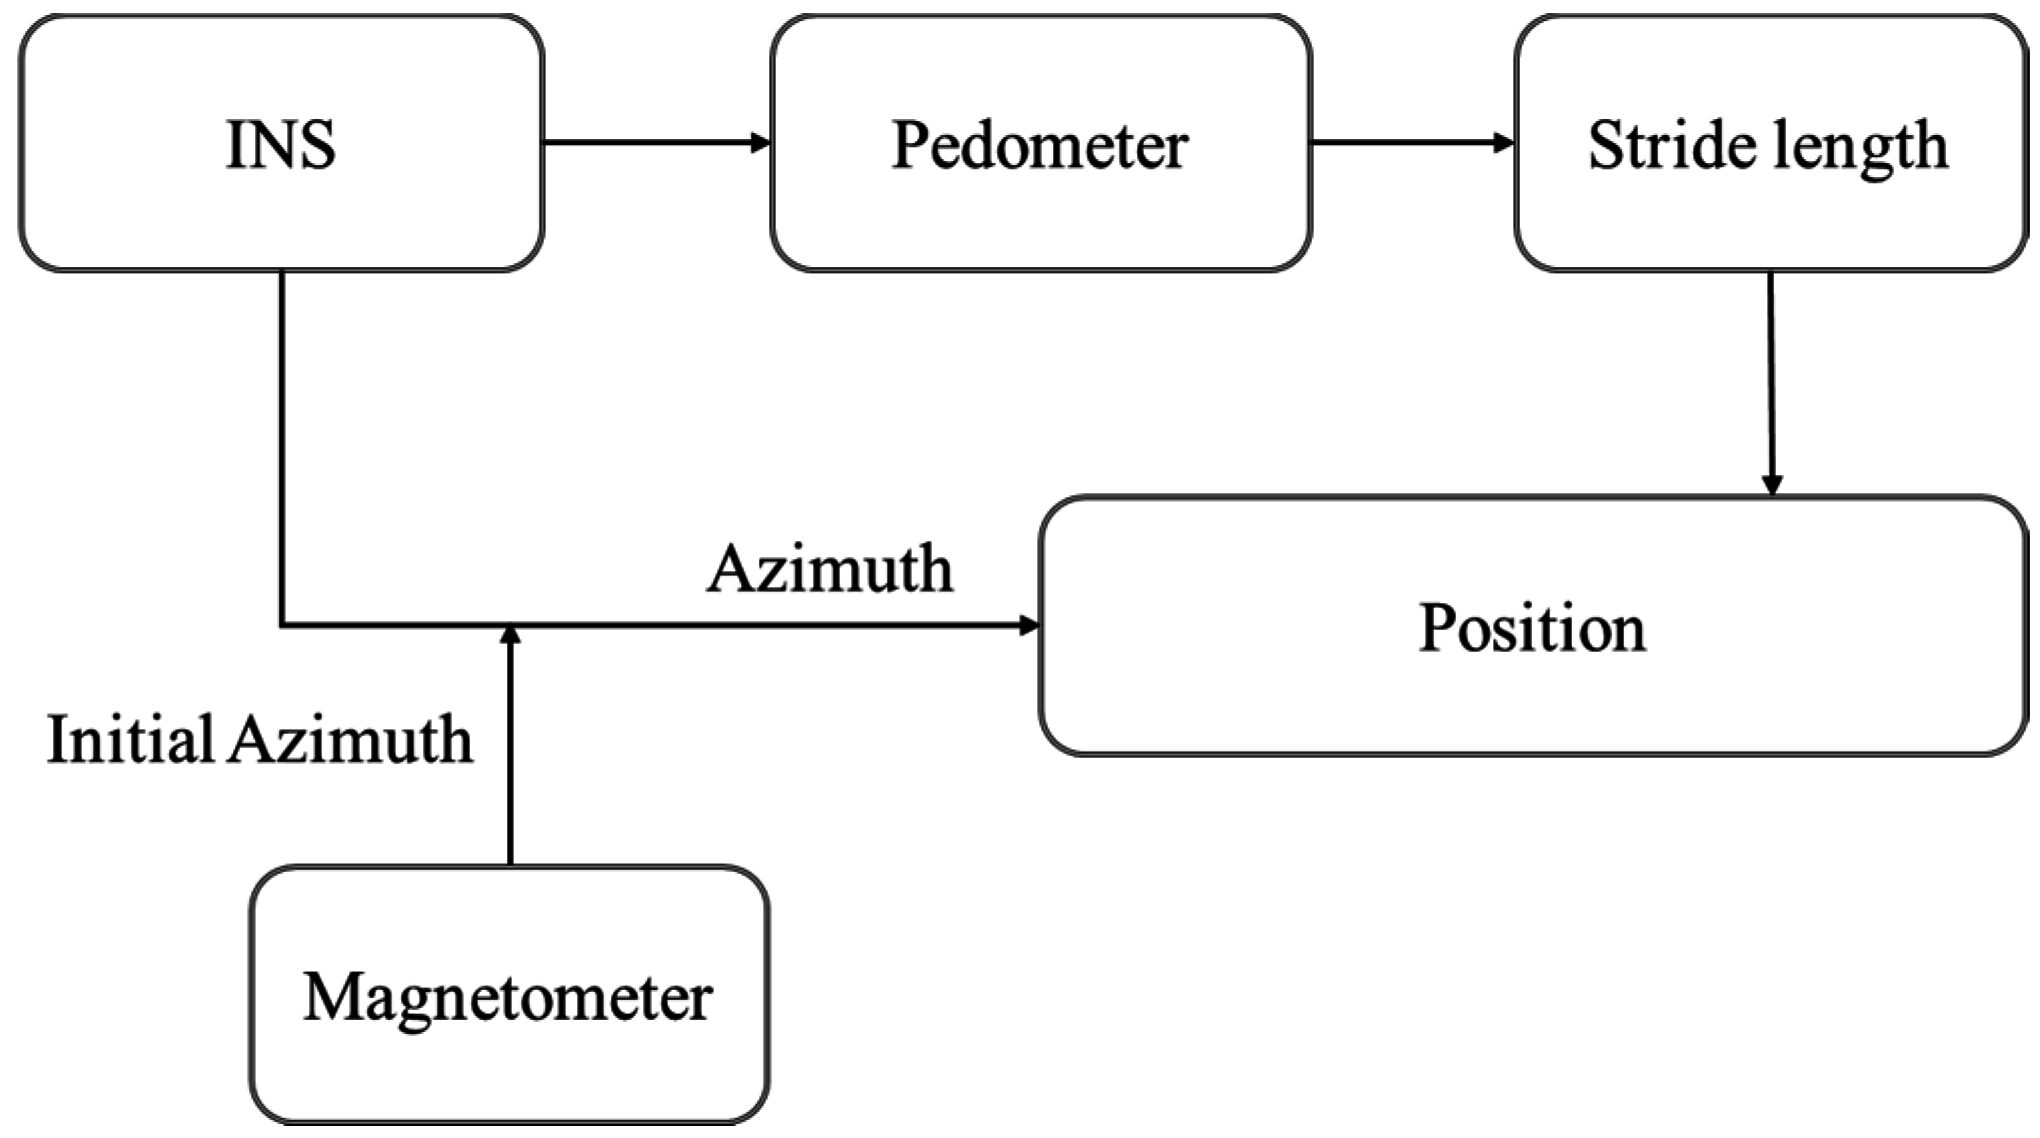
Finally, the heading measurements (angular rates and magnetic field in the x, y and z directions) are derived from the gyroscope and magnetometer. The magnetometer provides the magnetic heading and the gyroscope provides the angular difference, which is obtained by integrating the angular rates at each step interval. Basing this on the gyros characteristics requires an initial heading from the magnetometer. Figure 5 shows the PDR scheme used in this study.

2.5. Proposed Pedestrian Navigation System (PNS)

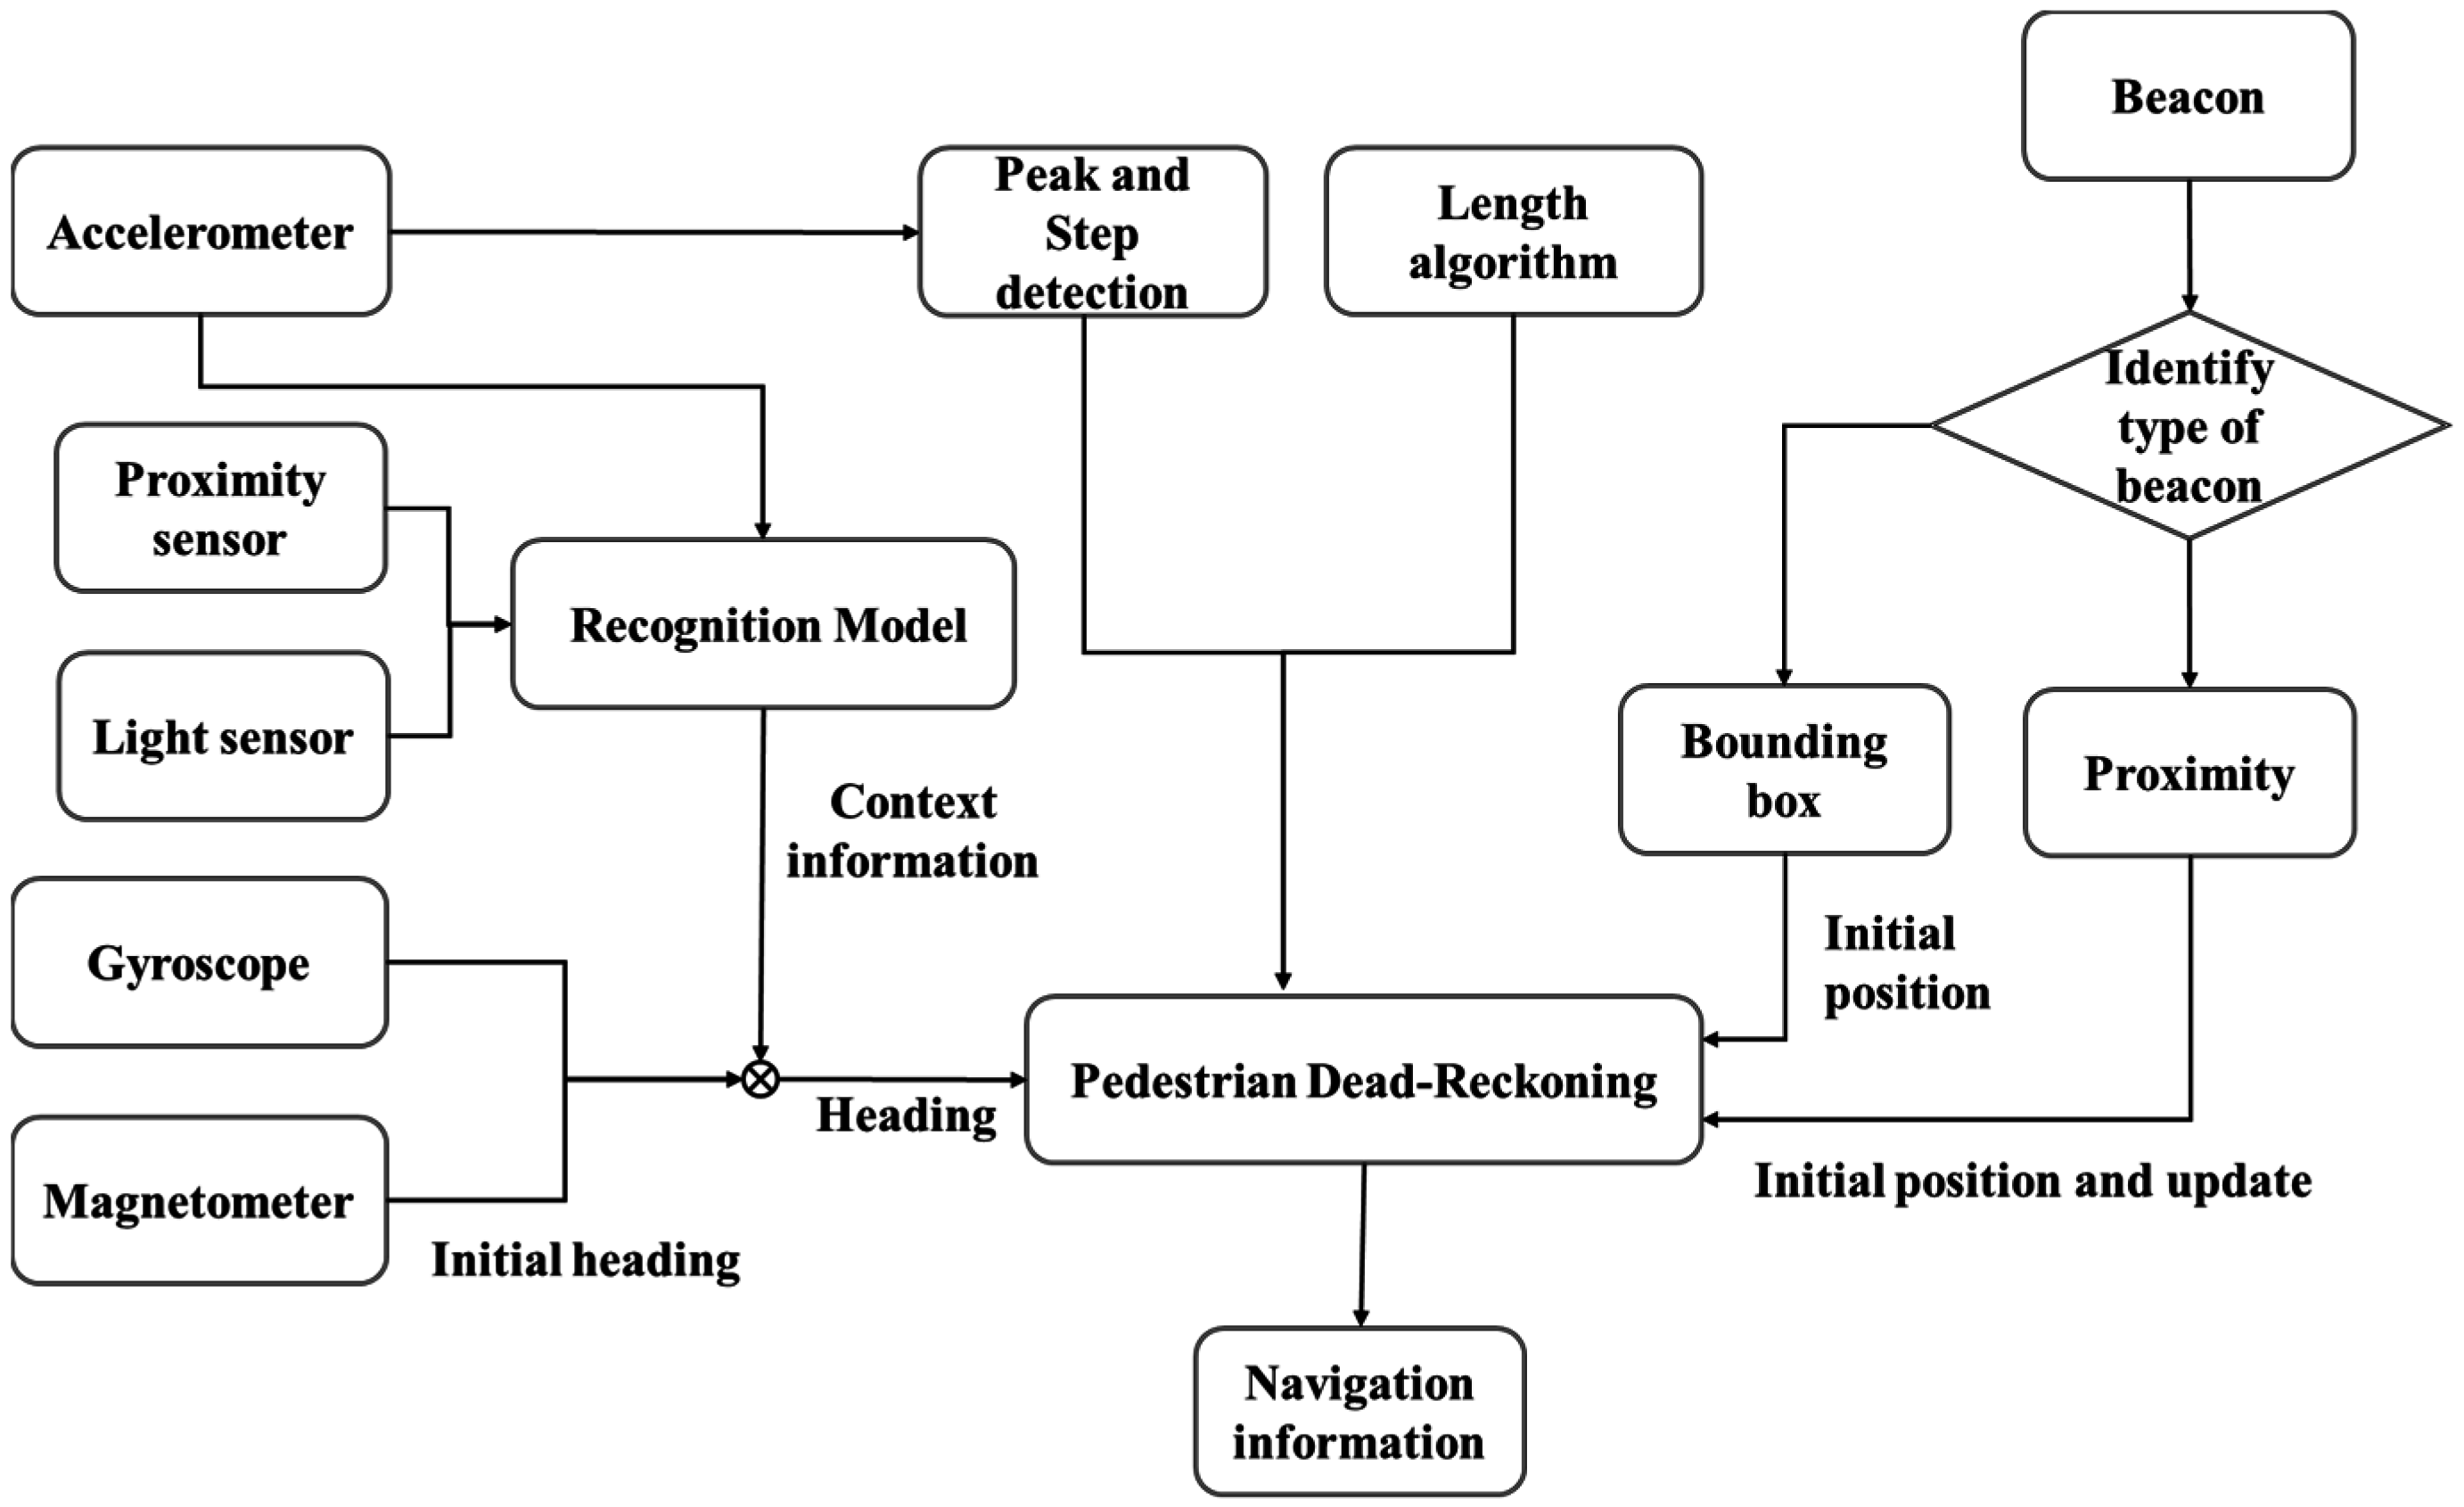
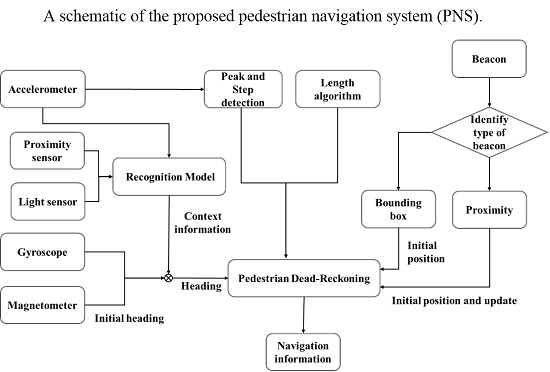
The scheme of the proposed PNS combined with PDR algorithm, RF-based Bluetooth technology, and activity recognition technology, is shown in Figure 6. The design of the pedometer is described in Section 2.4. Both the proximity and bounding box approaches are implemented based on the different setting IDs. The application first loads the map data and establishes a database that is composed of coordinates, the parameters of transformation and some specific local settings. The stride length can be seen in the reference proposed in [25], which is complete and detailed. In this research, in order to achieve real-time application, only one of the step length models is considered.
The system first detects the beacon signals and decides whether to use the proximity method or bounding box method based on the setting IDs. If the signal received is from a proximity-type beacon with an RSSI larger than the threshold, the system obtains the initial location. If the signals received are from three beacons with an RSSI larger than the threshold using bounding box method, the system obtains the initial location using that approach. When the system finishes the initialization, it moves to the next stage. The output of the accelerometer is used for step detection and activity recognition. In step detection, the magnitude of acceleration is calculated to detect peaks. At the same time, features (mean, standard deviation and root mean square) are extracted from the accelerometer, proximity sensor, and light sensor to determine device placement. The algorithm estimates the most optimal heading information using the information received regarding the phone’s most likely position (hand held, close to ear, on belt, or in pocket), after which the system calculates the two dimensional position of the user based on step count, stride length, and heading information. However, if the system finishes the initialization and detects the signal from proximity-based beacons and the signal received has an RSSI larger than the threshold, the system updates the position of the user using reference coordinates saved in the database.

3. Results and Discussions

3.1. Experimental Settings and Calibrated Results

Five different subjects walked the experimental route carrying smartphones in each of four different ways: hand-held, held close to the ear, in the pocket, and on the belt. The physical characteristics of the selected subjects were different with respect to gender, height and weight. The experimental field used was a route containing classrooms and laboratories in the Geomatics department building of National Cheng Kung University, Tainan, Taiwan. The smartphone used in the test was a SONY Z3 (Sony Corporation, Tokyo, Japan). An Android application with the proposed PNS, developed and implemented for the experiment, was used to process the data in real time. The experimental results are presented in the following paragraphs. The data was sampled at a rate of 20 Hz. At first, the used smartphone has been calibrated to improve the performance of sensors. Table 1 shows the calibrated results, which can correct the raw measurements using Equations (1) and (2).

3.2. The Performance Analysis of Activity Recognition

A wide variety of data were collected from the different participants, who were specifically chosen to represent physical variety: 10 males and 5 females with heights between 155 and 185 cm and weights between 50 and 100 kg were used to evaluate the performance of the activity recognition structure. Each of the users walked through a set course, which included both stopping and walking. A dataset was collected to build a recognition model in the training phase and to recognize the placements of the users’ devices in the classification phase. Figure 7 shows a participant carrying the phone in the four different positions examined in this research. The data of each person was collect for 80 s. The testers were given some freedom in the position and orientation in which they carried their smartphones, to mirror real-life usage as much as possible. In addition, training and testing data were prepared independently. One-third of the data was selected as the training data and the remainder was selected as the testing data.
Figure 8 shows the overall mean accuracy of recognition to be nearly 100% for the various device placements. Table 2 shows the confusion matrix of the results. The confusion matrix provides detailed information on the results of context recognition. Overall, the rule-based activity recognition algorithms using data from the smartphone sensors seem to offer reliable and consistent information with respect to device placement.

3.3. The Performance Analysis of Beacon Positioning

Figure 9 shows the experimental field for the evaluation of beacon positioning using the bounding box method. The yellow triangles represent proximity-beacons and red crosses represent the regularly distributed locations that were selected to collect data from the beacons. Each position collects data four times to evaluate the accuracy of beacon positioning. The error analyses of different transmission powers are listed in Table 3. Red values indicate an error larger than 3 m. To capitalize on the optimal transmit power for indoor positioning applications, in this study the transmission power was adjusted to 10 and 20 m. The results show an accuracy of about 2 m in N and E directions.

3.4. The Performance Analysis of PDR

Figure 10 shows the experimental trajectories taken by each participant when the device was hand-held. The solid red line in the Figure 10A represents the reference trajectory; The cross represents the check point. All the check points were surveyed by total station with centimeter-level accuracy. Green and yellow colors mean passed once and twice, respectively. As shown in Figure 10B–F, the blue dotted line represents the solution with the usage of heading information from the magnetometer; the red dotted line represents the solution with the usage of the heading information from gyroscope; Symbols B, C, D, E and F represent the five different participants. The route starts at the end of a corridor and is initialized by a proximity-based beacon. It then goes down corridors, into a classroom, and then back the same way to the start (blue circle). The route is 138.2 m long. The relative error used commonly to evaluate the accuracy of PDR is:
R e l a t i v e   e r r o r = ( x e n d x i n i t ) 2 + ( y e n d y i n i t ) 2 D
Where, x i n i t and y i n i t are the initial point coordinate; x e n d and y e n d are the terminal point coordinate; D is travel distance.
In addition, the check point has also been used to evaluate the accuracy of the PDR; the equation of RMSE (Root Mean Square Error, RMSE) is shown as follows.
R M S E = i = 0 n 1 ( x i μ ) n
Where, x i is the coordinate of pedestrian; μ are the check point coordinates and n is the check point number.
The results show the solution obtained from the PDR system using a gyroscope is more stable than the solution using the magnetometer. Table 4 shows that the mean relative precision for the magnetometer is 4.926%, while that of the gyroscope is 2.458%. The average RMSE obtained with the magnetometer is 4.48 m while that with the gyroscope is 2.22 m. The relative precision is calculated based on the users’ initial and terminal positions, using Equation (6). This equation focuses on the final location of the user after having travelled the whole trajectory, not on the relationships between each user’s position and the true position on the map. Therefore, the average RMSE of check points are estimated for the evaluation of whole trajectory. The mean estimated travel distance is 137.202 m, as calculated using Equation (5). Table 4 suggest solutions of PDR using the magnetometer are generally inferior to those using the gyroscope. As mentioned previously, the readings of the magnetometers are affected significantly by the ambient indoor environments.
Figure 11 shows the experimental trajectories with the smartphone in various positions: close to the ear, in the pocket, and on the belt, respectively. The experimental route is the same with Figure 10A. As shown in Figure 10, the heading from gyroscope is more stable (red dotted line), therefore here only use the gyro heading for positioning with different positions of device. The blue circle is the start location. Figure 11A indicates the better close loop error for the case of close to ear. The experimental results for a device placed in a pocket or on a belt are generally stable and good, but sometimes worse than hand-held due to increased jolting and vibration, as shown in Figure 11B,C.

3.5. Performance of the Proposed PNS

As mentioned, inertial measurements suffer a certain amount of error accumulation and when a smartphone is not cushioned by being hand-held it is subject to more intense vibration, causing additional errors. Therefore, in this study, the increasingly popular RF-based Bluetooth technology has been integrated with PDR. Figure 12 shows the experimental trajectories of each participant. The red and blue (return) solid lines represent the reference trajectory and the yellow triangles represent proximity-beacons used to update the users’ position. Only Beacons 4 and 5 are used in this experiment; the other beacons show on the map are in standby mode. Crosses represent checkpoints; green and yellow mean passed once and passed twice, respectively. The green dotted line stands for the solutions from the proposed PNS and headings from the gyroscope. The route starts at the end of a corridor shown as a blue circle; the position is initialized by a proximity-based beacon and goes sequentially into classrooms and then back to the start. The experimental route is 205.2 m long. Symbols B, C, D, E and F represent the five different participants.
As shown in Table 5, the average relative precision and average RMSE of the proposed PNSs are 2.308% and 1.83 m. The average estimated distance travelled was 205.66 m. From Figure 12, we can see that the user’s position, when corrected by a proximity-type beacon, is closer to the true position on the map. There are also cases of inaccurate angle integration; these are due to the many turns made during the experiment. The red boxs show the epoch when the position were updated by beacon. It is obvious that the position of user is wrong when the user leaves the classrooms and walks back to the origin, as indicated by the red arrow in red box. However, when users are close to a proximity-based beacon (Beacons 4 and 5), the position of user is updated and improves the accuracy.

4. Conclusions

This research proposes a multi-sensor activity recognition system based on a pattern recognition algorithm. It is able to detect how a smartphone is being carried by a user—in the hand, close to the ear, in the pocket, or on the belt—with nearly 100% accuracy. The average relative precision of PDR using a gyro is about 2.5%, and the RMSE of PDR is about 2.22 m with check points. RF-based Bluetooth technology is another important tool that helps to both initialize and update the position of the user. The RMSE of the initial position from a 2-D beacon position is about two meters, when using the bounding box method. After the position of the user is corrected by a proximity-type beacon, the position is better synchronized with the true position on the map. The average relative precision and average RMSE of the proposed PNS based upon PDR, RF-based Bluetooth technology, and activity recognition for more complex experimental routes are 2.308% and 1.83 m, respectively. The experiments clearly show that the proposed PNS performs well for real-time pedestrian indoor navigation.

Acknowledgments

The authors would like to acknowledge the financial support provided by the Ministry of Science and Technology (MOST 104-2923-M-006-001-MY3), all of the technical assistance from our supervisor, Kai-Wei Chiang, and field support from National Cheng Kung University.

Author Contributions

Kai-Wei Chiang conceived and designed the experiments; Jhen-Kai Liao and Zhi-Ming Zhou developed the algorithm and program, performed the experiments, and wrote the paper.

Conflicts of Interest

The authors declare no conflict of interest.

References

  1. Mautz, R. Indoor Positioning Technologies. Habilitation Thesis, Eidgenössische Technische Hochschule Zürich, Zurich, Switzerland, 2012. [Google Scholar]
  2. Liu, J.; Chen, R.; Pei, L.; Guinness, R.; Kuusniemi, H. A hybrid smartphone indoor positioning solution for mobile lbs. Sensors 2012, 12, 17208–17233. [Google Scholar] [CrossRef] [PubMed]
  3. Agata, B.; Robert, H. Walk detection and step counting on unconstrained smartphones. In Proceedings of the 2013 ACM International Joint Conference on Pervasive and Ubiquitous computing, Zurich, Switzerland, 8–12 September 2013.
  4. Ho, N.H.; Truong, P.H.; Jeong, G.M. Step-detection and adaptive step-length estimation for pedestrian dead-reckoning at various walking speeds using a smartphone. Sensors 2016, 16, 1423. [Google Scholar] [CrossRef] [PubMed]
  5. Lan, K.C.; Shih, W.Y. On calibrating the sensor errors of a PDR-based indoor localization system. Sensors 2013, 13, 4781–4810. [Google Scholar] [CrossRef] [PubMed]
  6. Liu, Z.; Aduba, C.; Won, C.-H. In-plane dead reckoning with knee and waist attached gyroscopes. Measurement 2011, 44, 1860–1868. [Google Scholar] [CrossRef]
  7. Afzal, M.H. Use of Earth’s Magnetic Field for Pedestrian Navigation. Ph.D. Thesis, University of Calgary, Calgary, AB, Canada, 2011. [Google Scholar]
  8. Mohammadi, E. Indoor Location Based Services. Master Thesis, Department of Geomatics Engineering, University of Calgary, Calgary, AB, Canada, 2011. [Google Scholar]
  9. Boonsriwai, S.; Apavatjrut, A. Indoor Wi-Fi Localization on Mobile Devices. In Proceedings of the 10th International Conference on Electrical Engineering/Electronics, Computer, Telecommunications and Information Technology (ECTI-CON 2013), Krabi, Thailand, 15–17 May 2013; pp. 1–5.
  10. Faragher, R.; Harle, R. An analysis of the accuracy of bluetooth low energy for indoor positioning applications. In Proceedings of the 27th International Technical Meeting of The Satellite Division of the Institute of Navigation (ION GNSS+ 2014), Tampa, FL, USA, 8–12 September 2014.
  11. Zhuang, Y.; Yang, J.; Li, Y.; Qi, L. El-Sheimy, Naser. Smartphone-based indoor localization with Bluetooth low energy beacons. Sensors 2016, 16, 596. [Google Scholar] [CrossRef] [PubMed]
  12. Saeedi, S. Context-Aware Personal Navigation Services Using Multi-level Sensor Fusion Algorithms. Ph.D. Thesis, University of Calgary, Calgary, AB, Canada, 2013. [Google Scholar]
  13. Kern, N.; Schiele, B.; Schmidt, A. Recognizing Context for Annotating a Live Life Recording. Pers. Ubiquitous Comput. 2007, 11, 251–263. [Google Scholar] [CrossRef]
  14. Moschetti, A.; Fiorini, L.; Esposito, D.; Dario, P.; Cavallo, F. Recognition of Daily Gestures with Wearable Inertial Rings and Bracelets. Sensors 2016, 16, 1341. [Google Scholar] [CrossRef] [PubMed] [Green Version]
  15. Lara, O.; Labrador, M. A survey on human activity recognition using wearable sensors. IEEE Commun. Surv. Tutor. 2012, 15, 1–18. [Google Scholar] [CrossRef]
  16. Altun, K.; Barshan, B. Human Activity Recognition Using Inertial/Magnetic Sensor Units. In Human Behavior Understanding; Springer: Berlin, Heidelberg, Germany, 2010; pp. 38–51. [Google Scholar]
  17. Artese, G.; Trecroci, A. Calibration of a Low Cost MEMS INS Sensor for an Integrated Navigation System. Int. Arch. Photogramm. Remote Sens. Spat. Inf. Sci 2008, XXXVII, 877–882. [Google Scholar]
  18. Hayal, A.G. Static Calibration of the Tactical Grade Inertial Measurement Units. Master’s Thesis, The Ohio State University, Columbus, OH, USA, 2010. [Google Scholar]
  19. Avci, A.; Bosch, S.; Marin-Perianu, M.; Marin-Perianu, R.; Havinga, P. Activity Recognition Using Inertial Sensing for Healthcare, Wellbeing and Sports Applications: A Survey. In Proceedings of the 23rd International Conference on Architecture of Computing Systems (ARCS), Hannover, Germany, 2010; pp. 1–10.
  20. Krishnan, N.C.; Panchanathan, S. Analysis of Low Resolution Accelerometer Data for Continuous Human Activity Recognition. In Proceedings of the IEEE International Conference on Acoustics, Speech and Signal Processing, Las Vegas, NV, USA, 31 March–4 April 2008; pp. 3337–3340.
  21. Boukerche, A.; Oliveira, H.A.; Nakamura, E.F.; Loureiro, A.A. Localization Systems for Wireless Sensor Networks. IEEE Wirel. Commun. 2007, 14, 6–12. [Google Scholar] [CrossRef]
  22. Tian, Z.; Zhang, Y.; Zhou, M.; Liu, Y. Pedestrian Dead Reckoning for MARG Navigation Using a Smartphone. EURASIP J. Adv. Signal Proc. 2014, 1, 1–9. [Google Scholar]
  23. Mladenov, M.; Mock, M. A Step Counter Service for Java-enabled Devices Using a Built-in Accelerometer. In Proceedings of the 1st International Workshop on Context-Aware Middleware and Services: Affiliated with The 4th International Conference on Communication System Software and Middleware (COMSWARE 2009), Dublin, Ireland, 16 June 2009; pp. 1–5.
  24. Chen, R.; Pei, L.; Chen, Y. A Smart Phone Based PDR Solution for Indoor Navigation. In Proceedings of the 24th International Technical Meeting of the Satellite Division of the Institute of Navigation (ION GNSS+ 2011), Portland, OR, USA, 20–23 September 2011; pp. 1404–1408.
  25. Tsai, G.-J.; Liao, J.-K.; Chu, H.-J.; Chiang, K.-W. The performance analysis of a smartphone based three dimension pedestrian dead-reckoning and map-matching algorithm for indoor navigation applications. In Proceedings of the 27th International Technical Meeting of The Satellite Division of the Institute of Navigation (ION GNSS+ 2014), Tampa, FL, USA, 8–12 September 2014.
Figure 1. The turntable MOTION DYNAMIC TES-3T.
Inventions 01 00025 g001
Figure 2. The flow chart of activity recognition.
Inventions 01 00025 g002
Figure 3. The bounding box method.
Inventions 01 00025 g003
Figure 4. An example of step detection: where the blue line is the acceleration measurement and the red dots are the detected steps.
Inventions 01 00025 g004
Figure 5. The pedestrian dead reckoning (PDR) scheme.
Inventions 01 00025 g005
Figure 6. A schematic of the proposed pedestrian navigation system (PNS).
Inventions 01 00025 g006
Figure 7. Experimental data collection and device placement. (a) Smartphone held in the hand (reading); (b) Smartphone close to the ear; (c) Smartphone in the pocket; (d) Smartphone on the belt.
Inventions 01 00025 g007
Figure 8. Accuracy of activity recognition.
Inventions 01 00025 g008
Figure 9. The testing field for the evaluation of beacon positioning.
Inventions 01 00025 g009
Figure 10. The experimental trajectories of PDR. Subfigure (A) shows the experimental route and check points; Subfigures (BF) are the results of five participants, respectively. The blue and red dotted line represent the solution with the usage of heading information from the magnetometer and gyroscope, respectively. The numbers indicate the different classrooms.
Inventions 01 00025 g010aInventions 01 00025 g010bInventions 01 00025 g010c
Figure 11. The experimental trajectories of PDR for different placements: (A) Smartphone close to the ear; (B) Smartphone in the pocket; (C) Smartphone on the belt. The numbers indicate the different classrooms.
Inventions 01 00025 g011
Figure 12. The experimental trajectories of the proposed PNS. Subfigure (A) shows the experimental route and check points; Subfigures (BF) are the results of five participants, respectively. The blue circle is the start location, and the green dotted line represents the solution with the usage of heading information from the gyroscope. The red box is the position updated by beacon. The numbers indicate the different classrooms.
Inventions 01 00025 g012aInventions 01 00025 g012bInventions 01 00025 g012c
Table 1. The result of calibration.
Deterministic ErrorXYZ
Accelerometers
Bias (m/s2)Mean−0.07990.00650.1658
STD0.00390.003800056
Scale (ppm)Mean−17613.67−11997.30−21427.35
STD469.12519.40388.89
Gyros
Bias (deg/s)Mean−0.00260.0075−0.0029
STD0.00620.03080.0043
Scale (ppm)Mean1898.67−2233.746268.04
STD516.041339.71209.22
Table 2. Confusion matrix of different phone positions using decision tree (DT).
Predicted ClassActual Class
Hand HeldIn the PocketClose to EarOn the BeltTotal
Hand held745002747
In the pocket075900759
Close to ear007480748
On the belt000759759
Total7457597487613013
Table 3. The error analysis of bounding box: N and E represent the errors in meters corresponding to north and east directions; Red value indicates an error larger than 3 m.
SubjectTransmit Power 10 mTransmit Power 20 m
NENE
Position 10.381.841.681.16
Position 20.991.071.050.63
Position 31.682.140.580.83
Position 40.690.421.342.42
Position 51.823.550.164.11
Position 61.880.591.051.93
Position 71.793.922.122.64
Position 83.053.300.791.42
Position 90.882.621.352.47
Mean1.462.161.121.97
Table 4. The result of relative precision for all subjects.
SubjectsEstimated Distance (m)Relative Precision (%)Check Point Root Mean Square Error (RMSE) (m)
MagnetometerGyroscopeMagnetometerGyroscope
1134.388.452.374.812.67
2140.937.511.934.762.01
3135.352.762.751.762.11
4137.732.323.637.202.89
5137.653.591.613.881.40
Mean137.204.932.464.482.22
Table 5. The results of relative precision for all subjects.
SubjectsEstimated Distance (m)Relative Precision (%)Check Point RMSE (m)
1208.121.601.09
2195.622.711.58
3205.812.361.57
4210.002.753.49
5208.752.121.42
Mean205.662.311.83

