Review of Tidal Lagoon Technology and Opportunities for Integration within the UK Energy System


College of Engineering, Swansea University, Swansea SA1 1EP, UK
Inventions 2017, 2(3), 14; https://doi.org/10.3390/inventions2030014
Submission received: 15 May 2017
/
Revised: 13 July 2017
/
Accepted: 15 July 2017
/
Published: 28 July 2017
(This article belongs to the Special Issue Inventions and Innovation in Integration of Renewable Energy Systems)
Abstract
:The number of distributed resources for renewable energy installed worldwide has been increasing rapidly in the last decade, and the great majority of these installations consist of solar panels and wind turbines. Other renewable sources of energy are not exploited to the same level: for instance, tidal energy is still a minute portion of the global energy capacity, in spite of the large amount of potential energy stored in tidal waves, and of the successful experience of the few existing plants. The world’s second largest tidal range occurs in the UK but at the moment tidal installations in this country are limited to a few prototypes. More recently, there has been a renewed interest in harnessing tidal energy in the UK, and a few tidal lagoon projects have been evaluated by the UK government. This paper provides an overview of the historical and current developments of tidal plants, a description of operation of tidal lagoons, challenges and opportunities for their integration within the UK energy systems and solutions to improve the dispatchability of tidal energy. The concepts described in the paper are applied to a tidal project proposed for South Wales.
1. Introduction
In the last decades, most of the western countries have been changing the nature of the energy generation mix, moving from traditional to renewable energy sources. Among the latter, wind plants and photovoltaic panels are the technologies which have been growing more rapidly, both in terms of number of installations and of technological development. For example, in the US, the total amount of solar and wind energy installed in 2013 was 44% of the new energy capacity, while in 2014 was 53% [1]. At the end of 2015, the combined solar and wind power installed worldwide was 433 GW and 230 GW, respectively [2].
The oceans are a source of energy which has not been exploited to the same level [3]. According to [4], the world’s theoretical wave power resource is estimated to be 2 TW, while [5] reports that the harvestable power is approximately 1 TW. Similar estimates can be found in [6,7,8]. In spite of this potential, ocean energy contributes only to a small percentage of worldwide power generation: at the end of 2015, the total tidal power installed was only 530 MW (not including pilot and demonstration projects) [9].
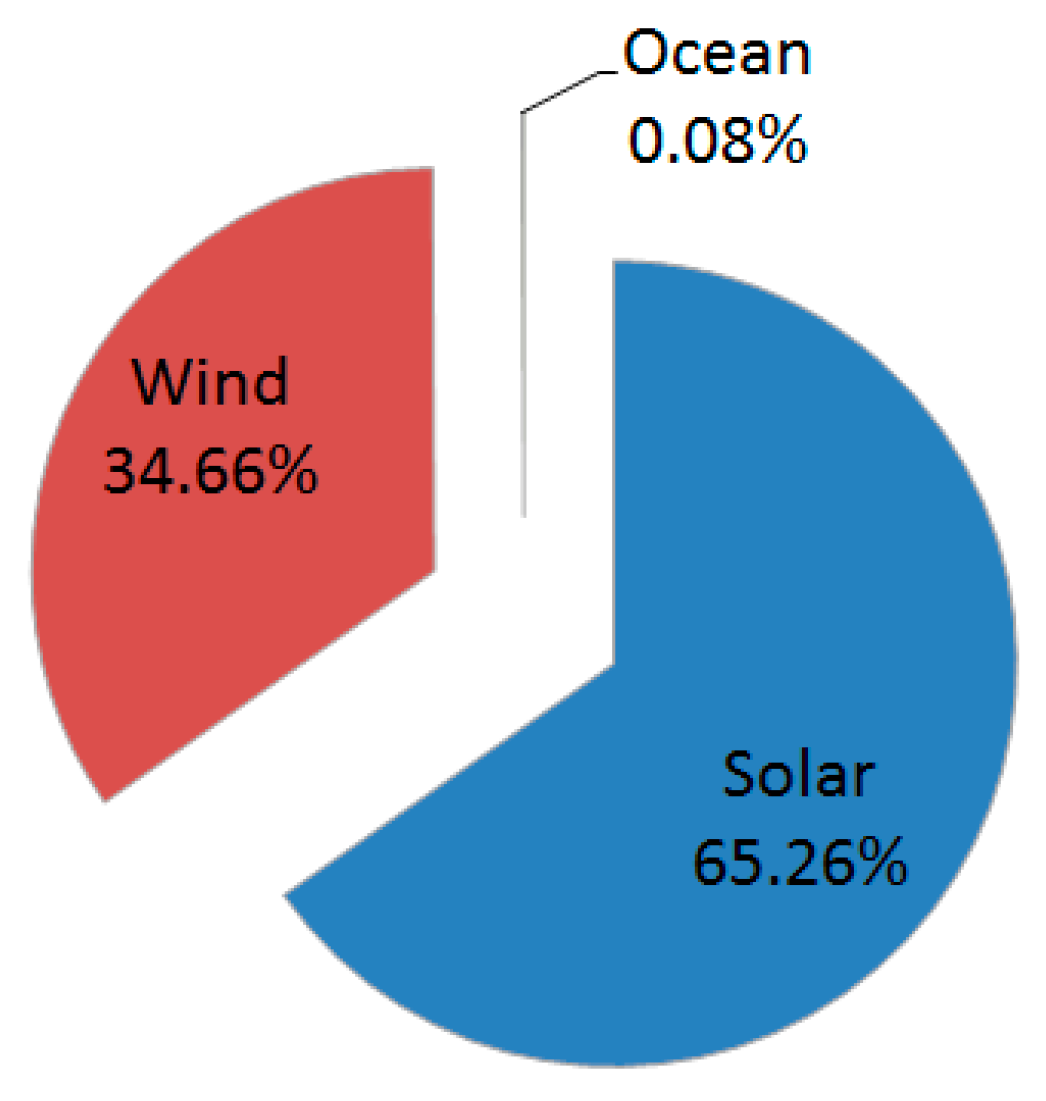
Figure 1 shows the contribution of wind, solar and ocean energy to the total renewable energy capacity installed worldwide in 2015, and indicates clearly that the percentage of ocean energy is negligible.
The main challenges to the development of technologies to harness ocean energy include: the high upfront cost, the requirement of high maintenance, the concerns related to the impact on the marine environment and the availability of cheapest energy sources [5,10,11,12,13,14,15,16,17].
In the UK, the trend is similar to other Western countries: the government has set very ambitious targets of reducing CO2 emissions by 80% of 1990 levels by 2050, and therefore has been promoting the growth of renewable energy installations, in particular solar energy and wind energy. According to [18], tidal energy could supply up to 29% of the UK demand. In spite of this, at the end of 2016, ocean energy contributed only 0.05% to the installed capacity [19], as shown in Figure 2.
In the last decade, there has been a renewed interest in harnessing the tidal resource in the UK, and a few pioneering projects have been successfully deployed [20]. Large projects (in the MW or GW rated power range), consisting mostly of “tidal lagoons”, are at the moment under consideration by the UK government [21].
This paper will focus on the description of tidal lagoons, because of their impact on the local energy system. Other technologies for harnessing tidal energy, such as tidal stream, are at the moment at a prototype stage, and they won’t play a significant role in the energy mix, at least in the near future. The paper is divided in two parts:
- (1)
- The first part provides a description of the mechanism behind the generation of tides, an overview of tidal plants currently in service and a description of tidal lagoons. The characteristics of energy generated by tidal lagoons (variability and intermittency) are then described. Methodologies to reduce both variability and intermittency of energy generated are discussed.
- (2)
- The second part addresses the integration of tidal energy within the UK energy mix. This section starts with a comparison between the characteristics of solar, wind and tidal energy, and then shows the current levels of energy generation in the UK, divided by energy source. A tidal project proposed for South Wales is used as an example to quantify the impact of this form of energy on the UK energy system.
2. Terminology
A summary of the elementary terminology that will be used in the paper is as follows:
- Ebb tide: The period between high tide and low tide, during which water flows away from the shore.
- Flow tide: The period between low tide and high tide, during which water flows to the shore.
- Spring tide: maximum tidal range, obtained at full moon or new moon (see Section 4 for more details on this definition).
- Neap tide: minimum tidal range, obtained at first moon quarter or last moon quarter (see Section 4 for more details on this definition).
- Lunar day: the interval of time between two successive crossings of the meridian by the moon (approximately 24 h and 50 min).
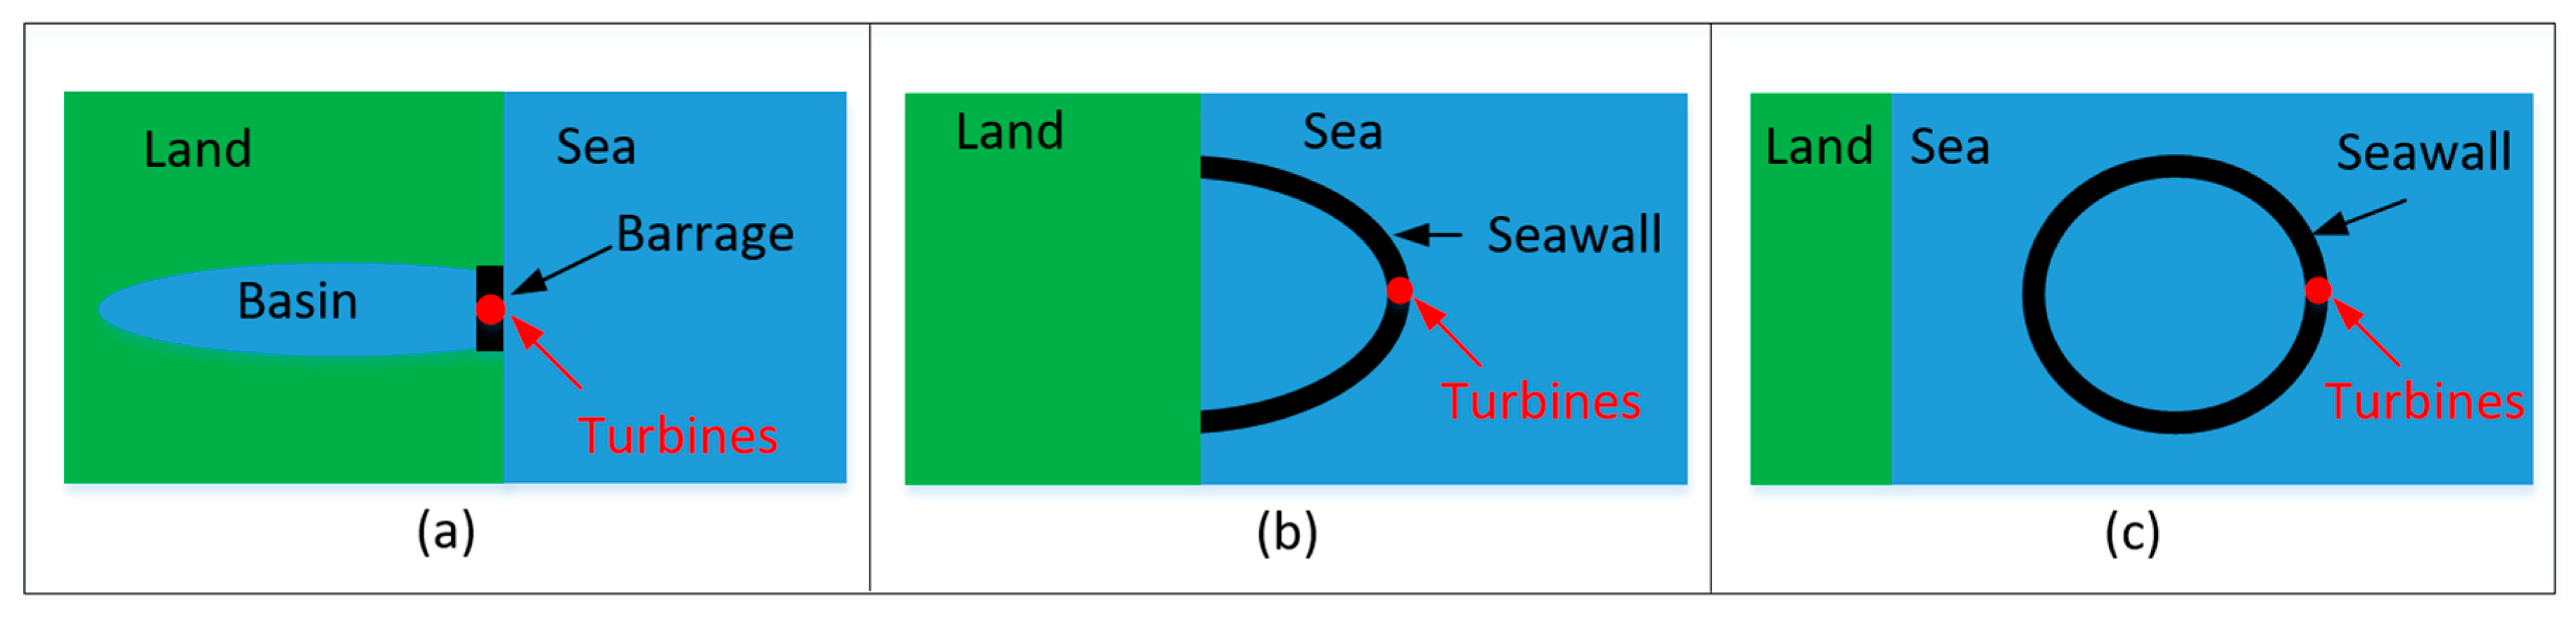
- Tidal barrage: it is the most common method used to harness tidal energy, and consists in creating a barrage across an existing basin, such as the estuary of a river. This system is schematically shown in Figure 3a
- Tidal stream: this technology consists of installing turbines inside the water and allowing generation of energy by the tidal wave. This type of generation is still at the research stage and is not addressed in this paper. One limitation of this technology is the low energy density of the tidal stream.
3. The Generation of Tides and the Tidal Range Variability
Tides are generated by the combined effect of gravity and of water inertia [22,23,24]. Gravity is due to the attractive force of the moon and the sun, and the moon has the largest effect on tides due to its proximity to the Earth. According to [25], the tidal force due to the sun is approximately half of the force caused by the moon.
The side of the Earth which is closer to the moon experiences the highest force of gravity. Therefore, the water on this side is attracted to the moon, thus causing a rise on the sea level, as shown in Figure 4. On the opposite side of the Earth’s surface, the effect of gravity is smaller, and inertia prevails: the water tends to go in a ‘straight’ line, and this effect causes a second rise in water levels.
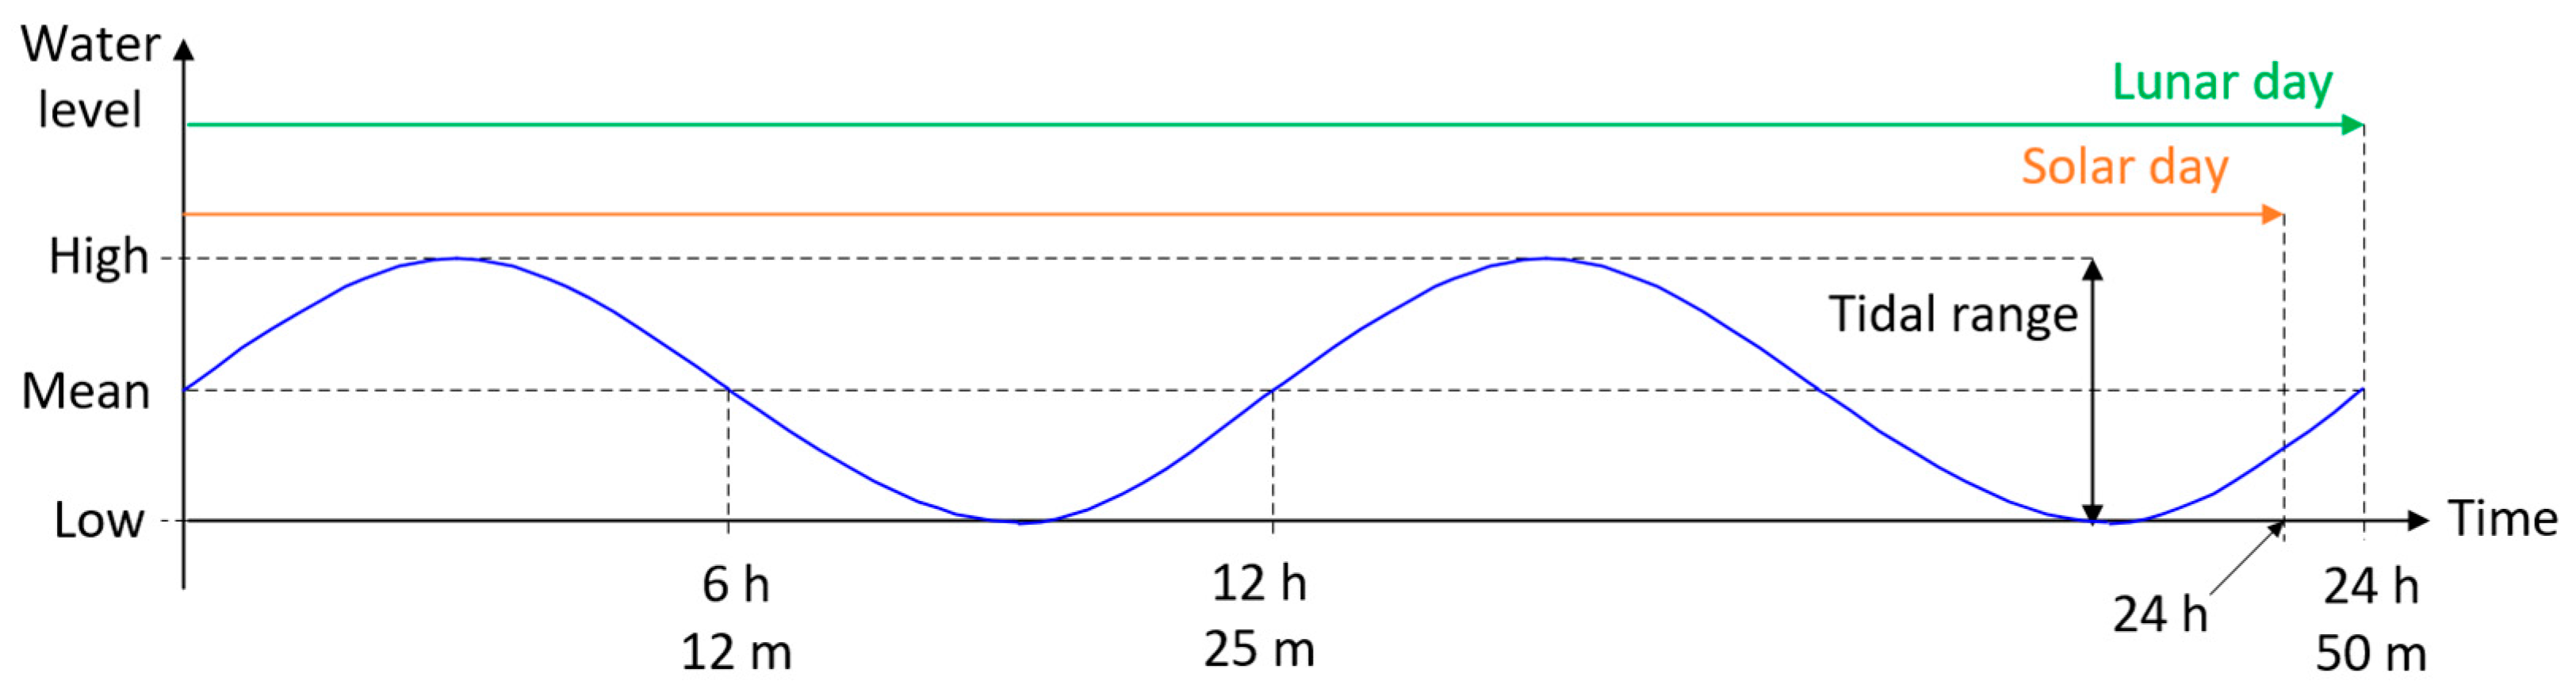
The position of the “rises” changes during the day, due to the combined effect of the rotation of the Earth around itself and of the rotation of the moon around the Earth. When the effects of those two rotations are combined, each point on Earth takes approximately 24 h and 50 min to return to the same position under the moon: the “lunar day” is 50 min longer than the solar day because the moon revolves around the Earth in the same direction as the Earth rotates around its axis. The comparison between the length of the lunar day and the length of the solar day is shown in Figure 5. The x-axis shows time, while the y-axis shows the water level; the blue curve indicates the variation of the sea water level for a lunar day. This curve illustrates that each point on Earth experiences two high tides and two low tides every lunar day.
The tidal current accompanies the rising and falling of the tide. The incoming tide along the coast and into the bays and estuaries is called a flood current; the outgoing tide is called ebb current.
The difference in height between the high tide and the low tide is called “tidal range”. The tidal range changes daily due to two main effects: the changing relative position of the sun, the moon and the Earth, and the elliptical orbits of the Earth around the sun and of the moon around the Earth.
At full moon and new moon, when the sun, the Earth and the moon are aligned, the effect of gravity is higher than usual, and results in above-average tidal ranges—referred to as “spring tides”. At first quarter and third quarter, the effect of sun and moon gravity cancel each other, and the tidal ranges are less than average—thus resulting in “neap tides”.
The above effects are further modulated by the elliptical orbits: when the moon is closest to the Earth (at perigee), the gravitational forces are higher. About two weeks later, when the moon is farthest from the Earth (at apogee), the gravitational forces are smaller. In a similar way, when the Earth is closest to the sun (perihelion), the tidal ranges are enhanced. When the Earth is furthest from the sun (aphelion), the tidal ranges are reduced [25]. Wind and atmospheric pressure also cause variations in the range of the tides, up to 2 m in regions which are prone to this effect [26].
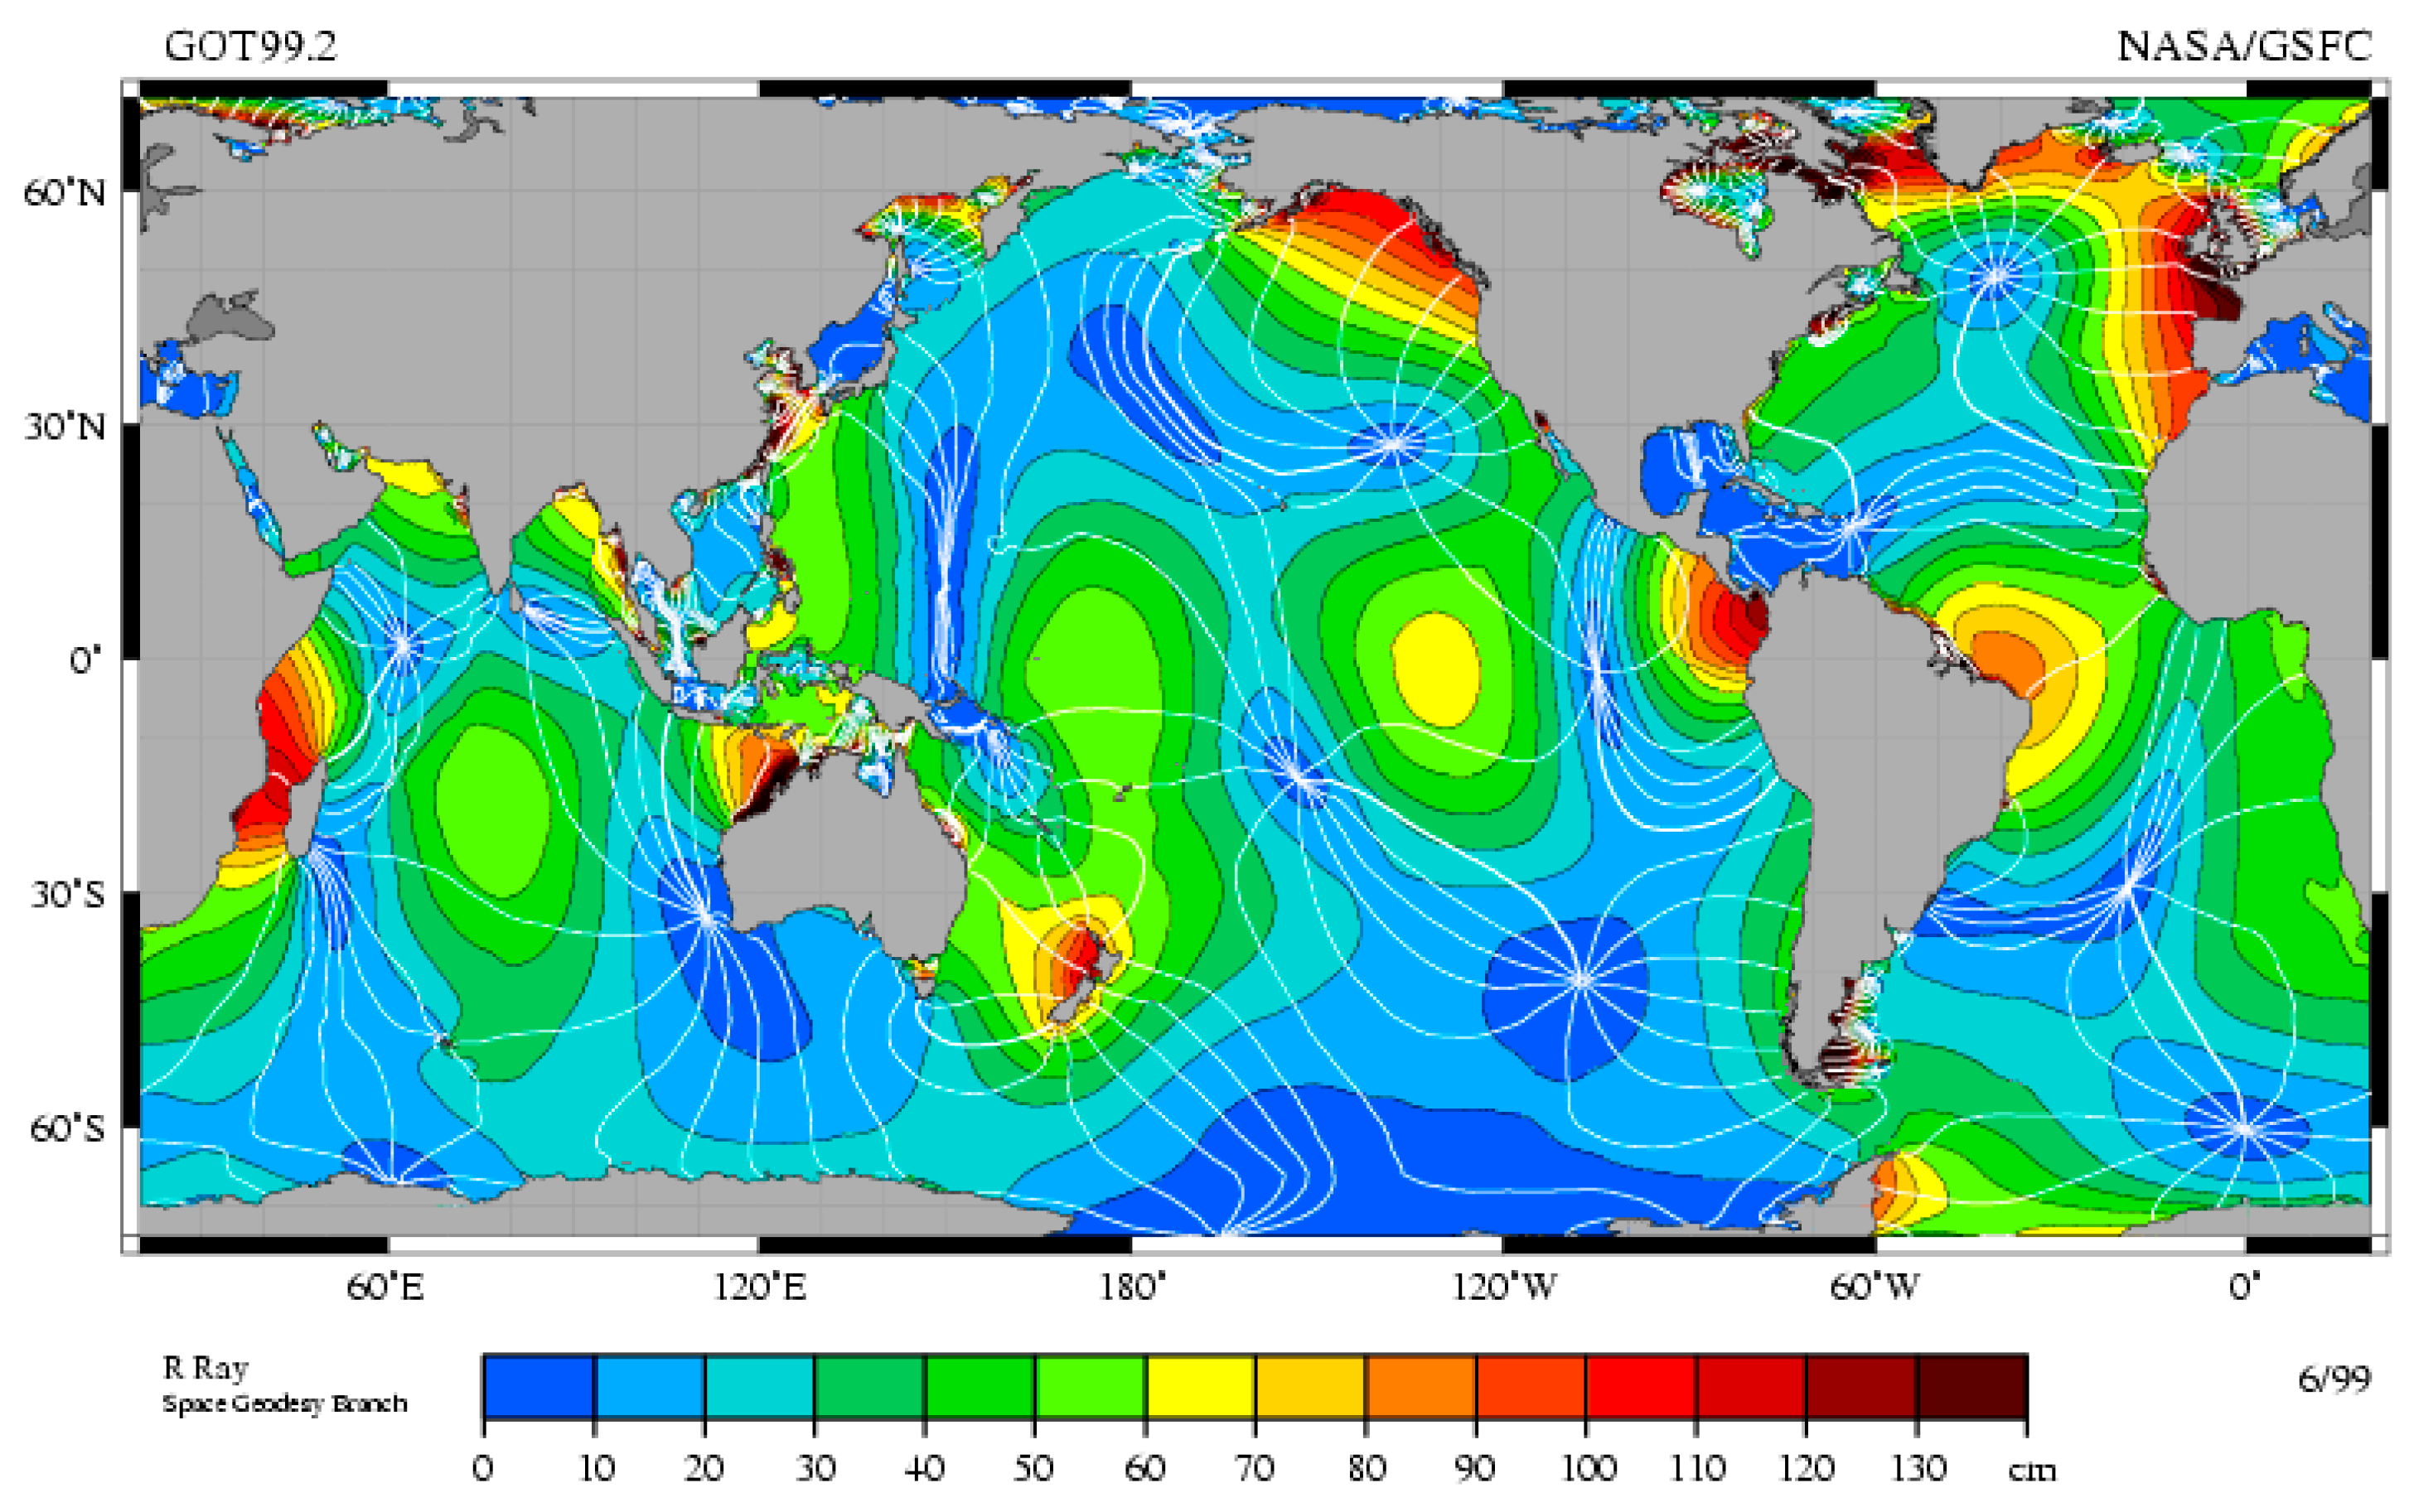
In addition to the phenomena described above, the amplitude of the tidal range varies significantly between different points on Earth due to the shape of the oceans and of the coasts [27]. Figure 6 shows the variation of tidal range on the surface of the oceans: the blue colour corresponds to the smaller tidal range, and the red colour to the larger tidal range [28].
The points on Earth with zero tidal range are called “Amphidromic” and they are typically located in the middle of the oceans, while higher tidal ranges are found on the coasts [29].
One factor that contributes to higher tidal range on the coast is related to the reduced speed of tidal waves. Further enhancement of the tidal range may occur for two reasons: (1) resonant coupling between the natural frequency of the area and the tidal frequency [30] and (2) funneling [31,32].
The effect of resonance can be explained by referring to the case of Severn Estuary (in the UK) [33]: the natural frequency of the estuary is 36,400 m1/2, while the tidal frequency is 36,000 m1/2. The similarity of these two numbers explains the high tidal ranges in this area.
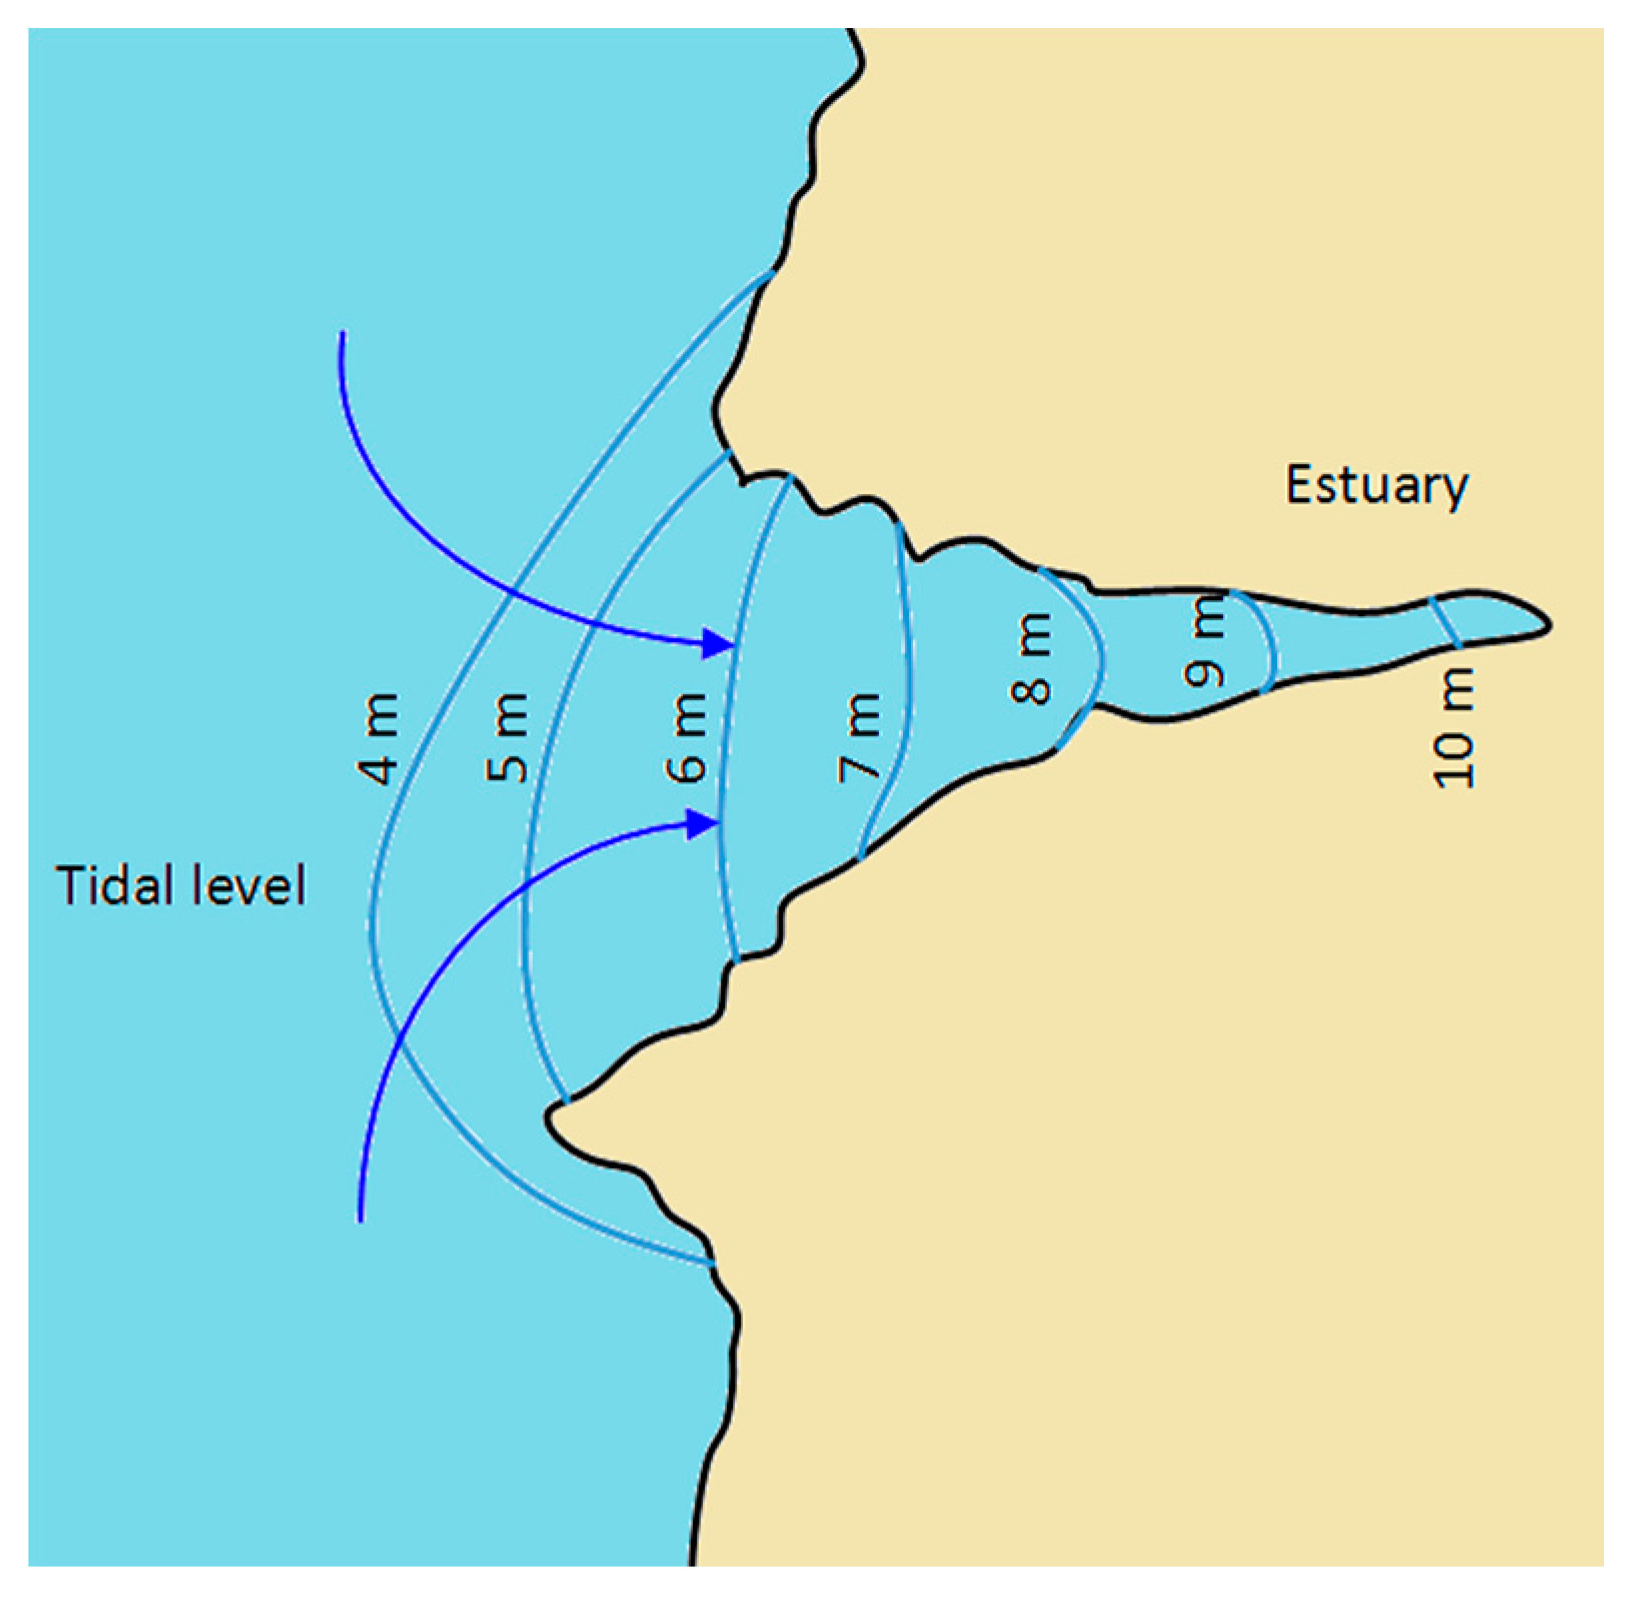
The effect of funnelling is due to the upward gradient of the sea bed within estuaries [33]. As a result of funnelling, the height of the sea level inside the estuaries may increase by several meters, as it is being pushed forward by the incoming sea water. This principle is illustrated in Figure 7.
4. Overview of Existing Tidal Plants and of the Projects Proposed for the Bristol Channel
The first, most famous (and for many decades, the only) tidal plant is La Rance Tidal Power Station, located in Brittany, northwestern France [20]. La Rance Tidal Power Station was commissioned in 1967 after three years of constructions, and it took almost 20 years to recover the initial capital cost. This plant required building a 700 m dam which houses 24 turbines, for a total installed capacity of 240 MW. The annual average electricity generation is approximately 540 GWh, and the cost of energy generated by this plant is currently 1.5 p/kWh.
In 2011, the Sihwa Lake Tidal Power Station was commissioned in South Korea along the northwest coast near Seoul [5]. The total installed capacity is 254 MW and, at the moment, this is the largest existing tidal plant. Construction time was 8 years (in spite of using an existing dam), and the energy production cost is currently 0.6 p/kWh. The annual electricity generation is 552 GWh: this figure is quite close to the value reported for La Rance, indicating that the efficiency of the two plants is similar, in spite of the time lapse between the two developments. Due to the large success of this project, South Korea is planning for additional barrages.
The sum of the total installed power at La Rance Tidal Power Station and Sihwa Lake Tidal Power Station is 494 MW, which is close to the total installed power of 530 MW reported in Section 2. This implies that the other existing tidal barrages are significantly smaller: the rated power of the Annapolis Royal Generating Station (Canada, 1984) is 20 MW, and the average annual energy generated is 50 GWh. Kislaya Guba Tidal Power Station (Russia) is rated 1.7 MW. The UK is characterized by a large tidal range [34,35], as shown in Figure 6, but all of the existing tidal installations are at the prototype stage [36]. In 2016, two 100 kW tidal turbines were commissioned in Shetland, Scotland, and they will be part of a larger tidal array [37]. Similar pilot projects are under constructions or testing [38,39].
The Severn Estuary is one of the largest estuaries in Britain, and is well known for having the second largest tidal range in the world [40,41]. Figure 8 shows the location of the Severn Estuary in South West UK, between England and Wales. There is no defined boundary between the Severn Estuary and the Bristol Channel, and the two names are sometimes used interchangeably.
Given its high tidal ranges, this area has been the subject of many feasibility studies for tidal projects, the first dating back to 1849 [42]. Due to a combination of environmental concerns and availability of more economical energy sources (mostly coal), all projects have been abandoned. In 2008 and 2009, a number of exploratory studies were undertaken regarding a tidal barrage in the Severn Estuary. In 2010, the UK government decided that the barrage would be too risky due to high costs and environmental issues [5].
More recently, a few projects of “tidal lagoons” have been proposed for the Severn Estuary/Bristol Channel region [20]. While the tidal barrage is a structure which blocks the estuary of a river, a tidal lagoon is confining a part of the sea by means of seawalls, as shown in Figure 3.
In February 2016, the UK government commissioned an independent review to assess the case for tidal lagoons and whether they could play a cost-effective role as part of UK energy mix. The result of the review was published in January 2017, and one of the main conclusions is that “there is a very strong case for a small scale pathfinder project (less than 500 MW) as a soon as is reasonably practicable” [21]. In the same document, the Swansea Bay Tidal Lagoon is indicated as the most likely pathfinder, due to the small size (320 MW) and the advanced state of development. According to the review, other larger projects should be considered only after the pathfinder will be commissioned and operational for a reasonable period.
In spite of the conclusions reported above, there are still concerns regarding the tidal lagoon projects. The first major concern is related to environmental impact on habitats, fish movements, birdlife and deposit of silt [43,44]. The environmental concern has been in part mitigated by the comprehensive assessments which are part of the development consent process [21], and by the adjustments which have been done to the design to minimize the impact on migrating birds and on fishes [43]. Under the UK “Conservation of Habitats and Species Regulations” [45], the lagoon developers are obliged to implement measures to minimize disruption during construction, to continuously monitor the environmental impact, and to provide compensatory habitats to replace designated features. In spite of these efforts, the developers are still waiting for a marine license from environment body Natural Resources Wales.
A second concern is the cost of the structure and the amount of government funding required to make the project commercially viable [46]. At the moment of this writing (July 2017), no decision has been made by the UK government on the funding agreement.
5. Tidal Lagoon Operation
5.1. Single-Basin Operation
Tidal lagoons create a confined space where a mass of water is stored and released in a controlled manner. In the simplest forms, tidal lagoons consist of a single basin that is created by a seawall, as shown in Figure 3b. The turbines are located in water passages and are designed to convert the potential energy of the water into rotational energy first (by the blades), and then into electric energy (by the generators). The turbines are located in openings within the seawall, which are fitted with control gates, referred to as “sluice gates”, used to regulate the flow of water in and out of the lagoon [47].
Figure 9 illustrates the principle of operation of single-basin tidal lagoons. In this figure, the turbines are indicated by the red circle. Based on the water level, the position of the sluice gates and the spinning direction of the turbines, four operation modes can be identified.
Figure 9a: At high tide, the sluice gates are open and water is allowed to flow inside the lagoon, thus spinning the turbines clockwise and generating electric power. This process is referred to as “flow tide generation”.
Figure 9b: When the maximum water level inside the lagoon is reached, the sluice gates are closed and water flow is interrupted.
Figure 9c: At low tide, the sluice gates are open, and water is allowed to flow outside the lagoon, thus spinning the turbines counterclockwise. This process is referred to as “ebb tide generation”.
Figure 9d: When the minimum water level inside the lagoon is reached, the gates are closed, until the next tide, which will cause the generation cycle to start again.
The potential energy stored in the lagoon is a function of the mass of water, and can be expressed as follows [48]:
where A is the area of the surface enclosed by the walls, is the water density, is gravitational acceleration (9.8 m/s2) and is the differential height between the water level inside the lagoon and the sea water level. The average electric power generated by the lagoon depends on the generation time and of the efficiency of the energy conversion process :
The efficiency depends on several factors, including energy losses and the operating point of the turbines [49,50,51]. According to [52], Kaplan turbines will be deployed for the tidal lagoon projects: this technology is the same used at other tidal plants, with modifications such as “triple regulation” that allows a more optimized efficiency curve [46].
The capacity factor (CF) is a coefficient used to quantify the efficiency of energy sources. The CF is defined as the ratio between the electricity generated for a certain time and the energy that could be generated at continuous full-power operation during the same period:
The CF of tidal lagoons has been estimated in publications such as [44,53]. In spite of applying different models and assumptions, all references indicate that a CF around 0.2 (20%) is realistic for tidal lagoons. This value is similar to the one obtained at existing tidal plants, such as La Range (All references agree that generating energy in both directions yields overall less efficiency than generating only on ebb tide [53]). Even if this statement may seem counterintuitive, it has been confirmed by the operational experience at La Range, where initially generation was bi-directional, and later on the scheme was modified to generate energy only on the ebb tide [54]).
One phenomenon which reduces the CF is the variation of differential height while the basin is filled or emptied. The highest power generation is theoretically obtained at maximum differential height, and this would require emptying the basin instantaneously. In the practice, the basin would be emptied across a few hours, and the amount of energy generated would depend on the instantaneous differential height.
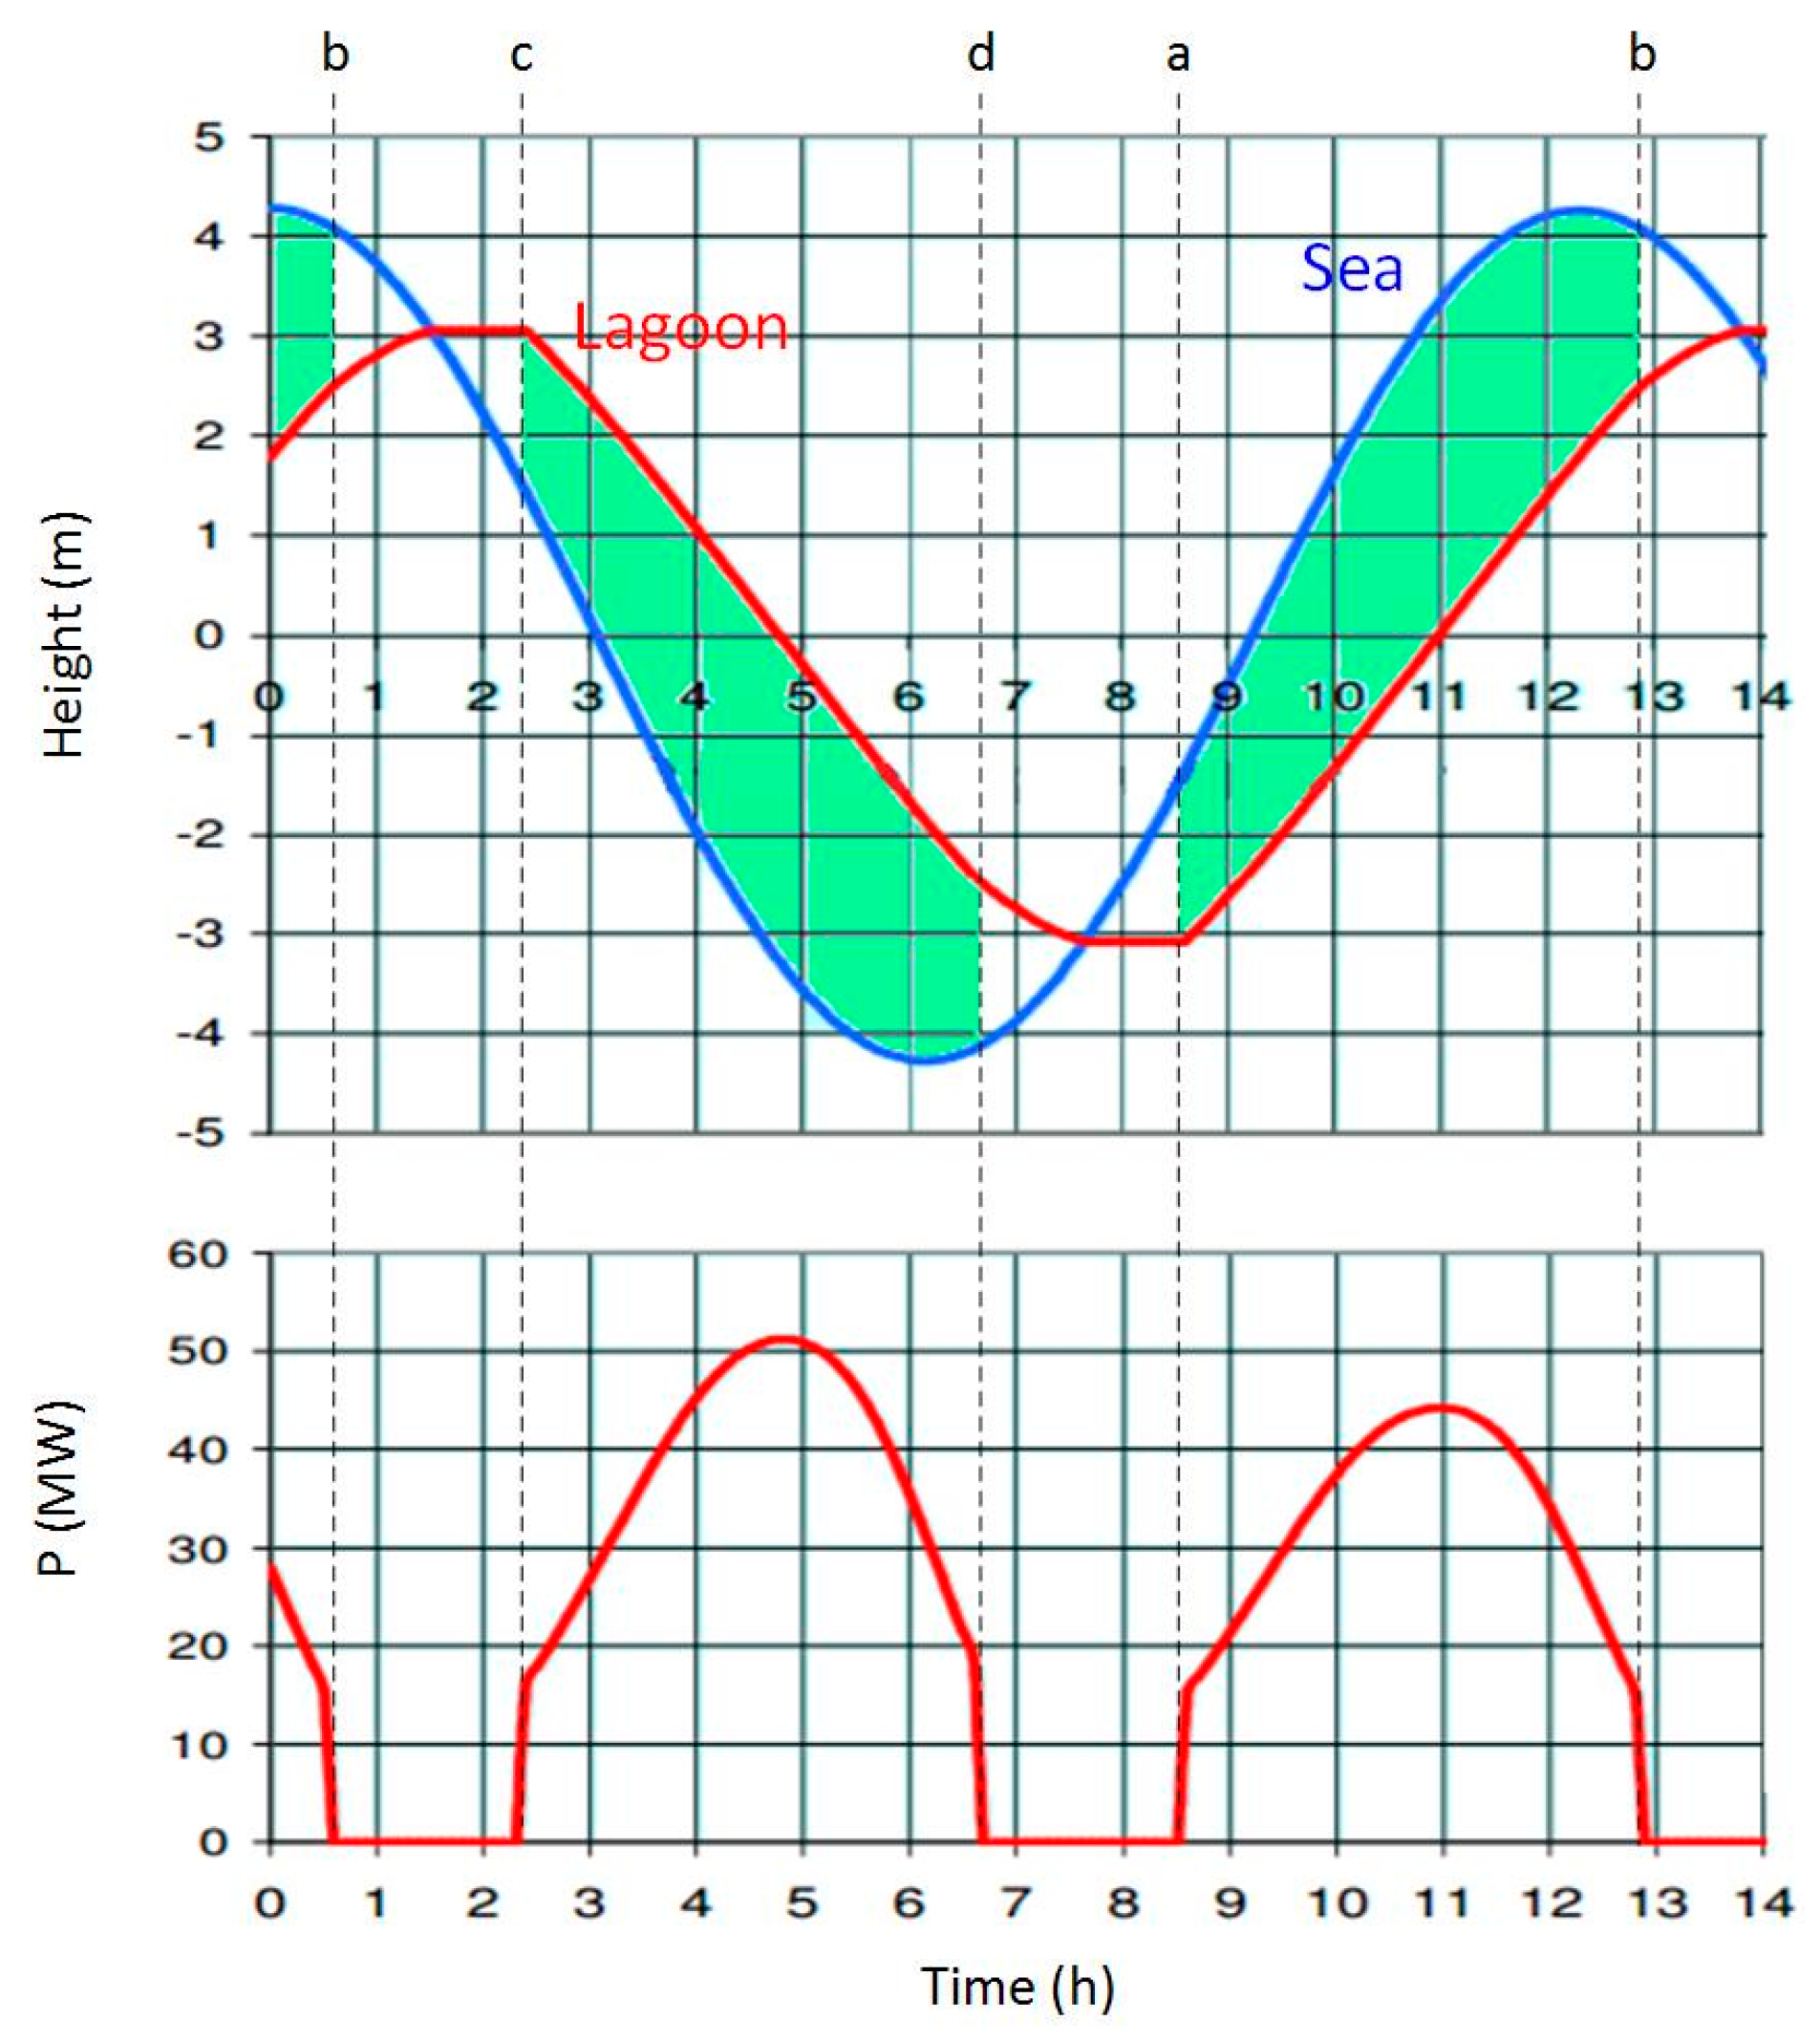
This concept is visualized in Figure 10. The top graph shows the sea water level (blue curve) and the lagoon water level (red curve) over time (hour). The green shades indicate the time ranges when electrical energy generation takes place. The letters at the top of the graph correspond to the operating modes shown in Figure 9. The lower graph plots the power generated versus time, for a 60 MW rated lagoon. Power generation is both intermittent (as there are times where the differential height is too low to be used for generating electricity) and variable (as the power output changes with time).
Based on the above, there is a small window of time which allows maximum power generation, and the opening and closing of the gates cannot be adjusted based on the demand and generation levels, but rather, on the water levels. Additionally, the lagoon operation needs to resemble the natural flow of water to limit the impact on the local ecosystem, therefore, the emptying and filling cycle cannot be altered significantly [10,40].
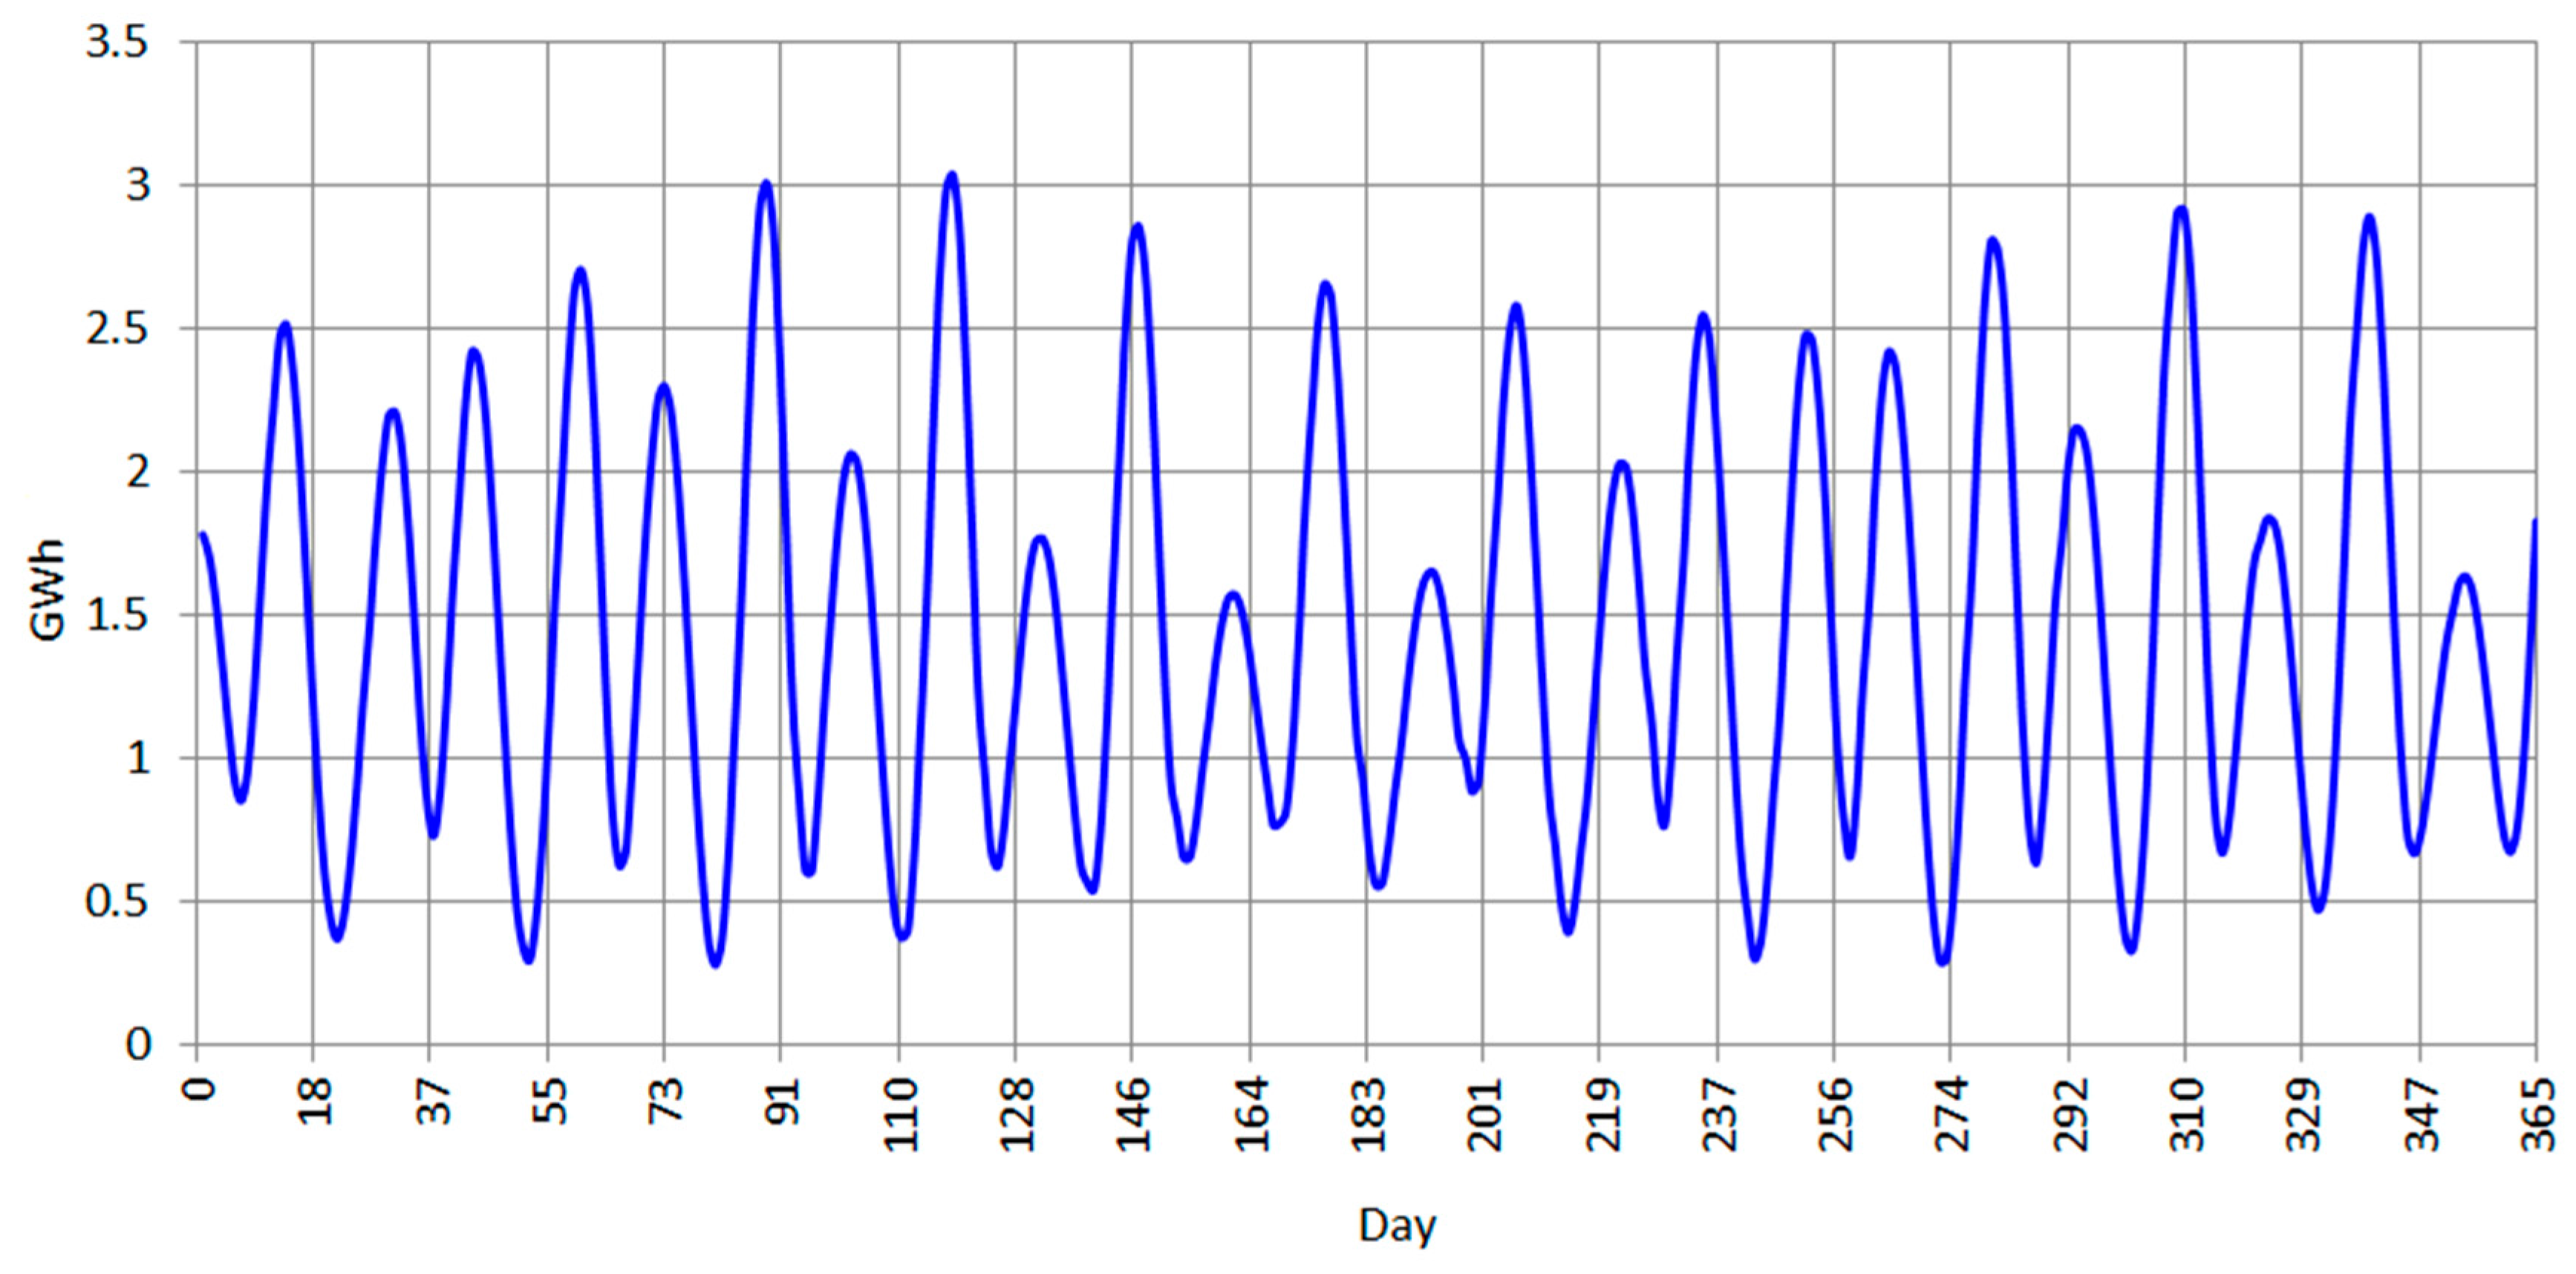
Due to the effect of neap and spring tides, power generation peaks vary during a lunar month. Figure 11 shows the daily energy generation over tidal period for a 25 kW rated plant.
The power generation cycles shown in Figure 10 and Figure 11 illustrate the main limitations of the single-basin system:
- -
- -
- The optimal time for power generation is dependent on the tidal cycle, and cannot be adjusted to follow power demand levels.
- -
- The amount of power generated is at peak only when maximum differential height is obtained.
- -
- The amount of power generated is dependent on the maximum height reached by the water and on the tide level, therefore, the same basin will yield more energy at spring tide than at neap tide.
To overcome the above-mentioned limitations, a few mitigating solutions will be described in the next sections.
5.2. Solutions to Improve Energy Generation
One solution to mitigate the lower generation levels at neap tide consists in pumping additional water inside the basin when the water level is below the maximum. In this way, the highest power generation can be achieved consistently through the month [56]. This solution is implemented at La Rance power station, and has proved to yield an additional 10% power [54].
The effectiveness of this mechanism can be demonstrated by modifying equation (1) [57]. It is assumed that pumping allows increasing the water level inside the lagoon by the height “b”. Since pumping water inside the lagoon requires a negative input power, (1) is modified as follows:
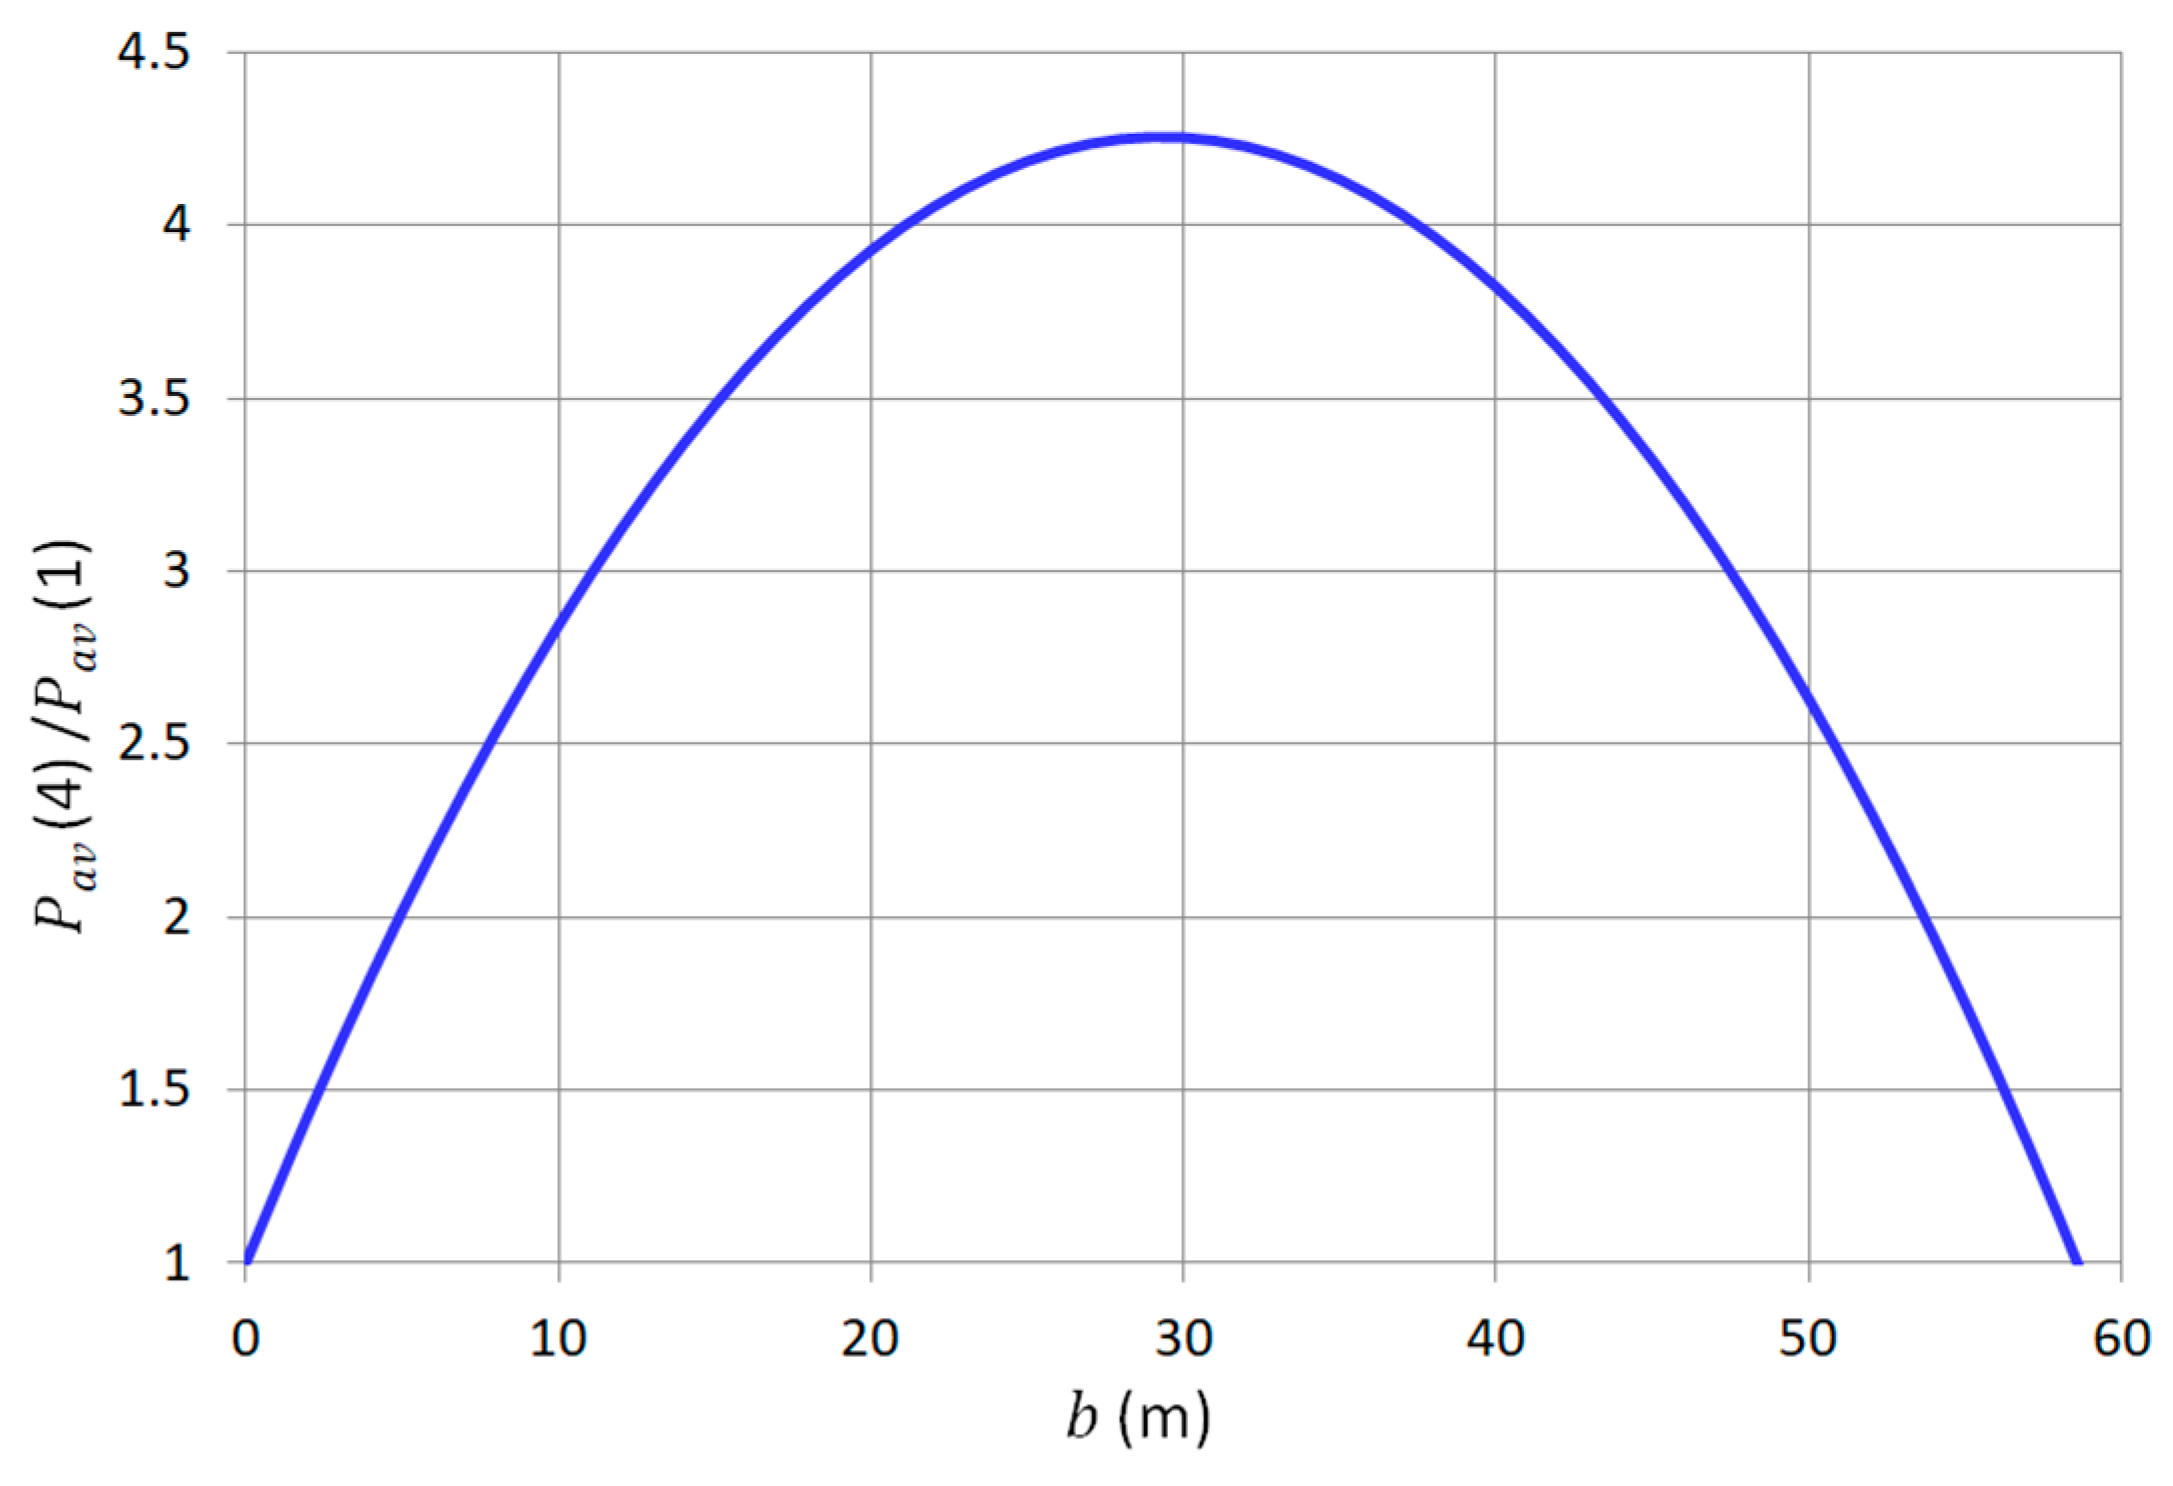
where is the efficiency of pumping. In [57], it is stated that for a tidal range of 4 m, with = 0.85 and = 0.9, the optimal height “b” is around 26 m, which is unfeasible, due to the cost of building such a high wall and the visual impact of this structure.
Even if the optimal height is not practical, (4) can be used to demonstrate the effect of increasing the water height inside the lagoon at neap tide. The normalized power generated is expressed as a function of “b” in Figure 12. This figure is obtained by calculating according to (4) and with the parameters listed above ( = 4 m, = 0.85 and = 0.9), and by normalizing the result with respect to the ones obtained from (1).
The first region of the plot is of practical interest since it reflects the increased power obtained at neap tide, when the water levels are a few meters below the maximum. For example, assuming b = 0.5 m yields a power boost of about 10%. The expression (4) assumes that the cost of energy at pumping and at generating is the same. Clearly, if pumping is done at a lower cost (for example, when there is an excess of generation from renewable sources), the solution above is even more attractive.
A second and more sophisticated solution that allows constant power generation consists in building a two-basin system.
The operation of a two-basin system has been described in early publications referring to tidal energy generation [26], but to the knowledge of the Author, it has been implemented only in a small tidal plant in China (Haisan Tidal Power Plant), where the rated installed power is 250 kW. As a result of the two-basin design, the plant generates electricity continuously, with an average output power equal to 39 kW [56].
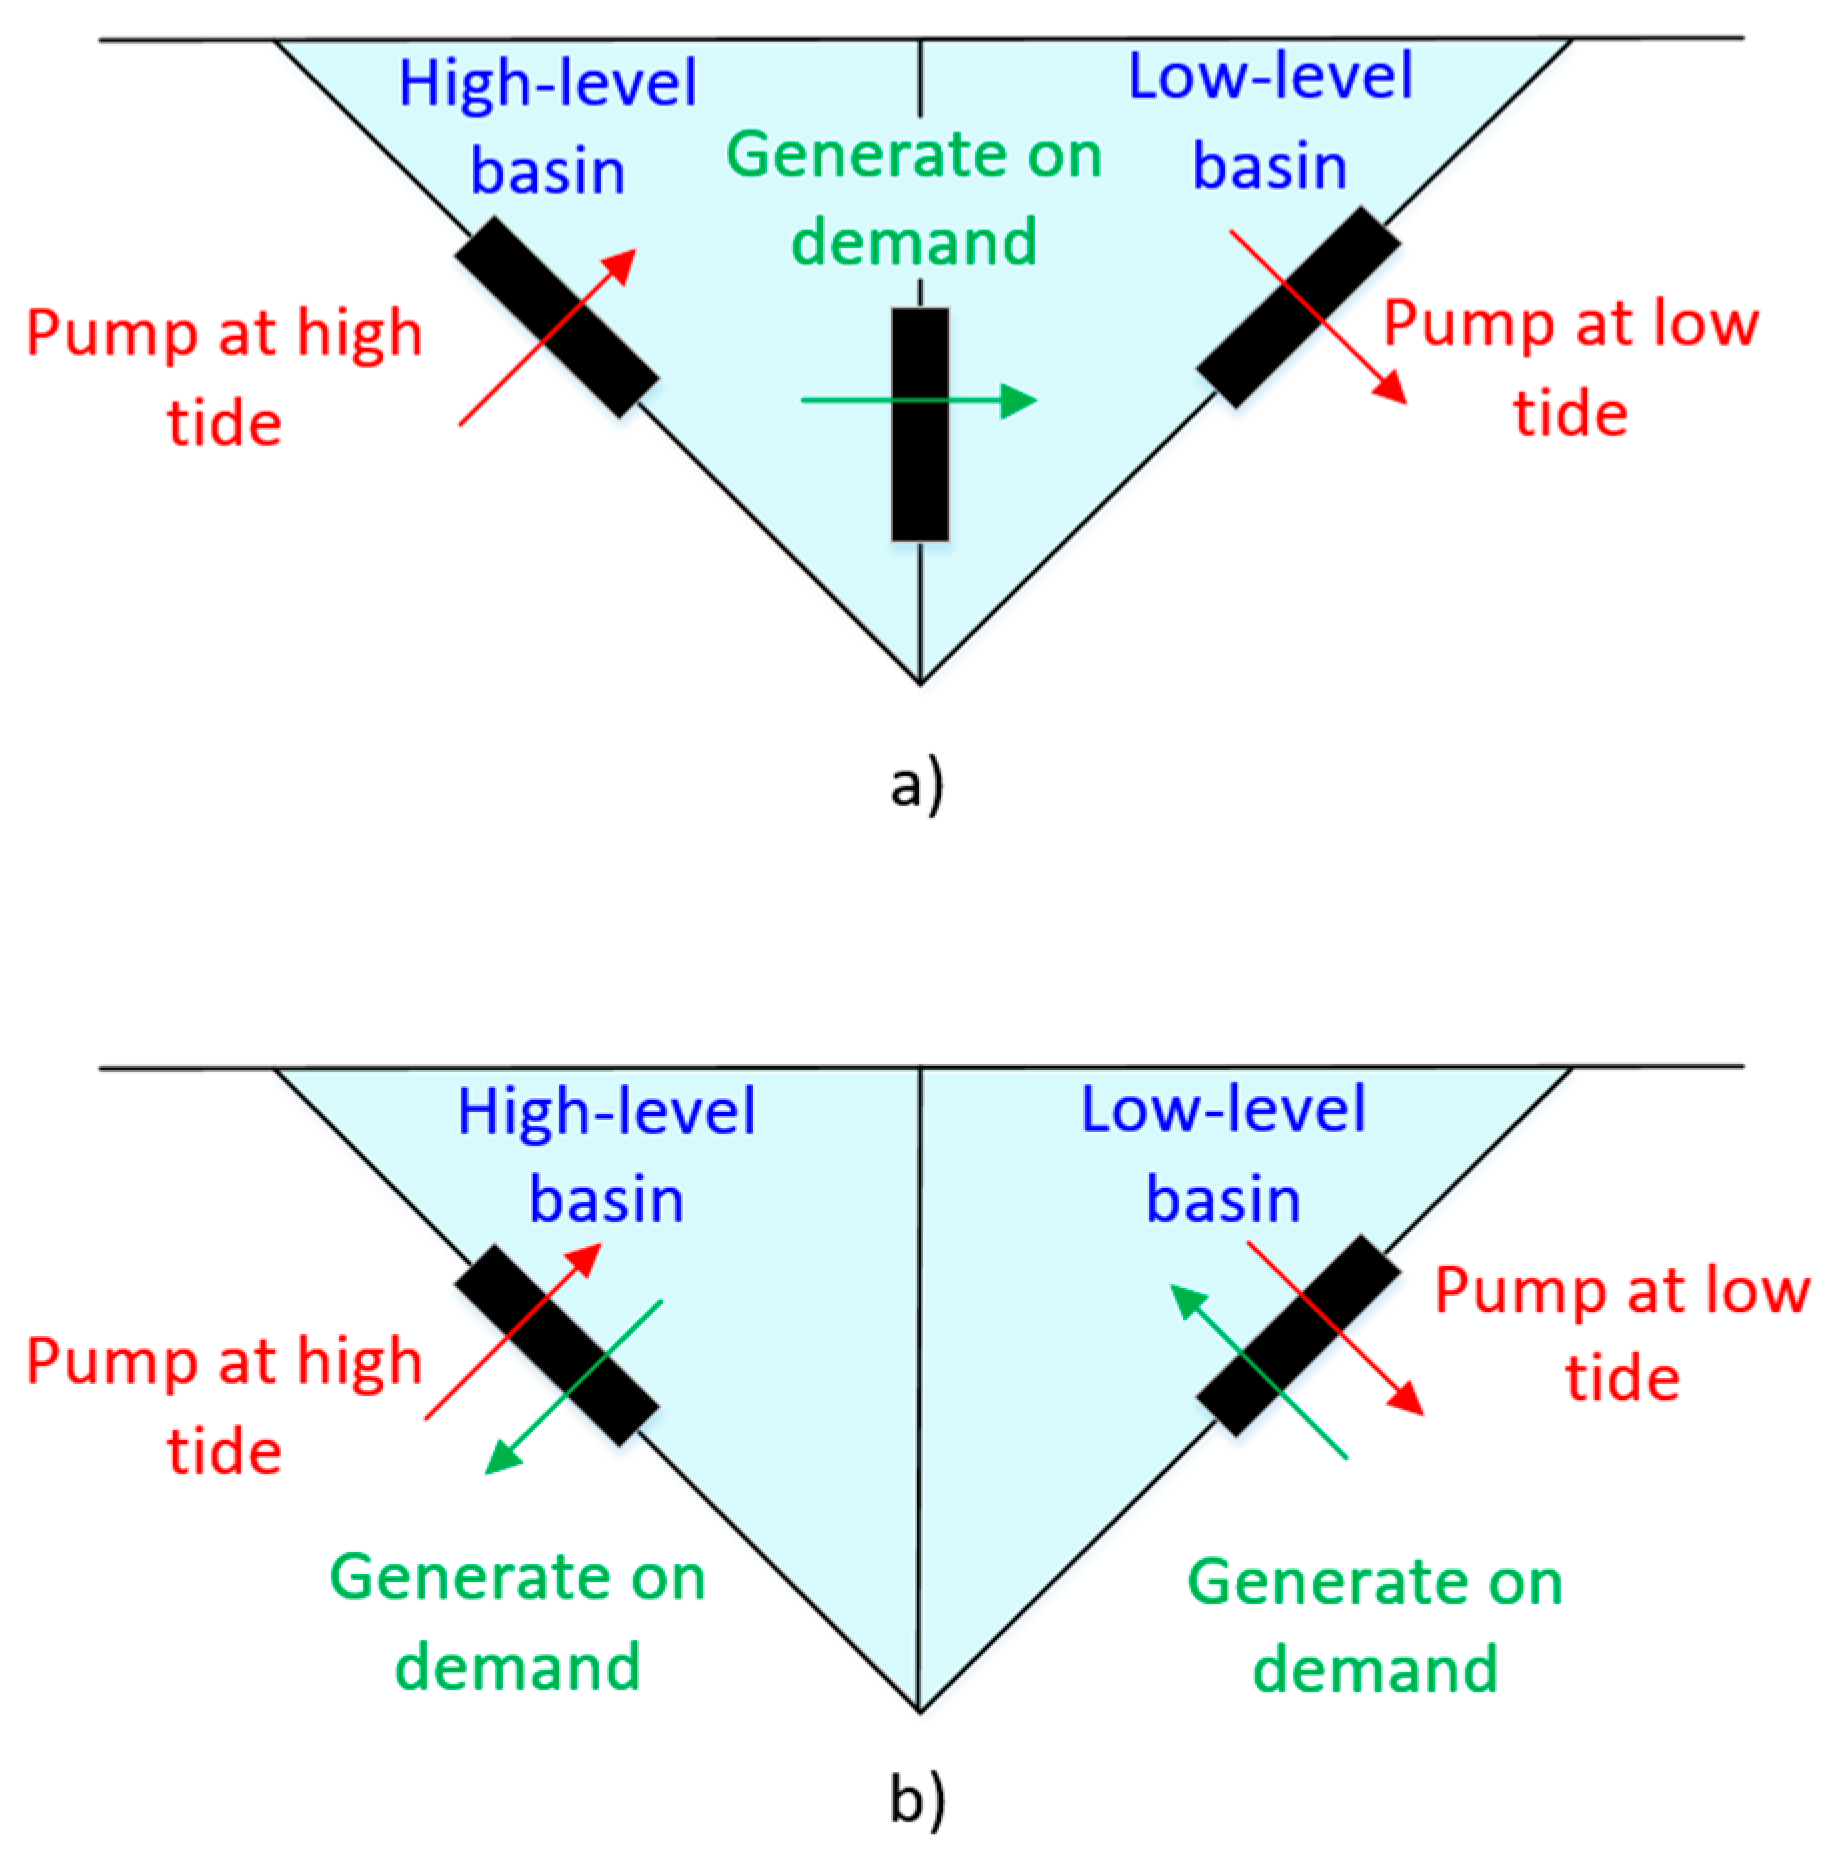
Two configurations are possible, as shown in Figure 13 [26,47,57]. In both cases, the two basins are separated by a wall, and one is used as “high-level basin”, the other as “low-level basin”. The main difference between the two solutions consists in allowing water to flow between the two basins (Figure 13a), or in allowing water to flow between each basin and the sea only (Figure 13b).
Figure 14 illustrates different operational modes for the system shown in Figure 13a; the notation is similar to the one used in Figure 9. In this case, the turbines generate power continuously and rotate always in the same direction, from the “high” basin to the “low” basin. The dotted green arrows indicate pumping, while the continuous blue arrows indicate the direction of water flow.
The calculations in [57] show that a two-lagoon system in a location with a tidal range of 4 m can deliver a constant power of 4.5 W/m2. The power density of 4.5 W/m2 is 50% larger than the maximum possible average power density of a single-basin system in the same location (3 W/m2).
The capital cost of a two-basin scheme is higher because of the need for extra walls; the advantage of this solution is that power generation is fully dispatchable (A power plant capable of providing required amounts of power on demand at the request of power grid operators, in a manner similar to a pumped hydro-system). The steady power generation of the two-basin system is more valuable than the intermittent and less-flexible power from the single-basin solution. A cost-benefit analysis for each site allows determining if the highest initial costs are justified.
6. Integration of Tidal Energy in the UK Energy Generation Mix
6.1. Characteristics of Solar, Wind and Tidal Energy
Energy generation from renewable sources depends on the availability of natural elements, and therefore it is in general not dispatchable [9,39].
This section will compare the characteristics of three forms of renewable energy: solar energy, wind energy and tidal lagoon generation. Other sources of renewable energy are not discussed in this section since they represent a small portion of installed capacity, as shown in Figure 2.
The variability of energy generated from renewable sources depends not only on the natural element under consideration (wind, sun or tide), but also on the location and on the technology used. In spite of this, some common trends can be observed.
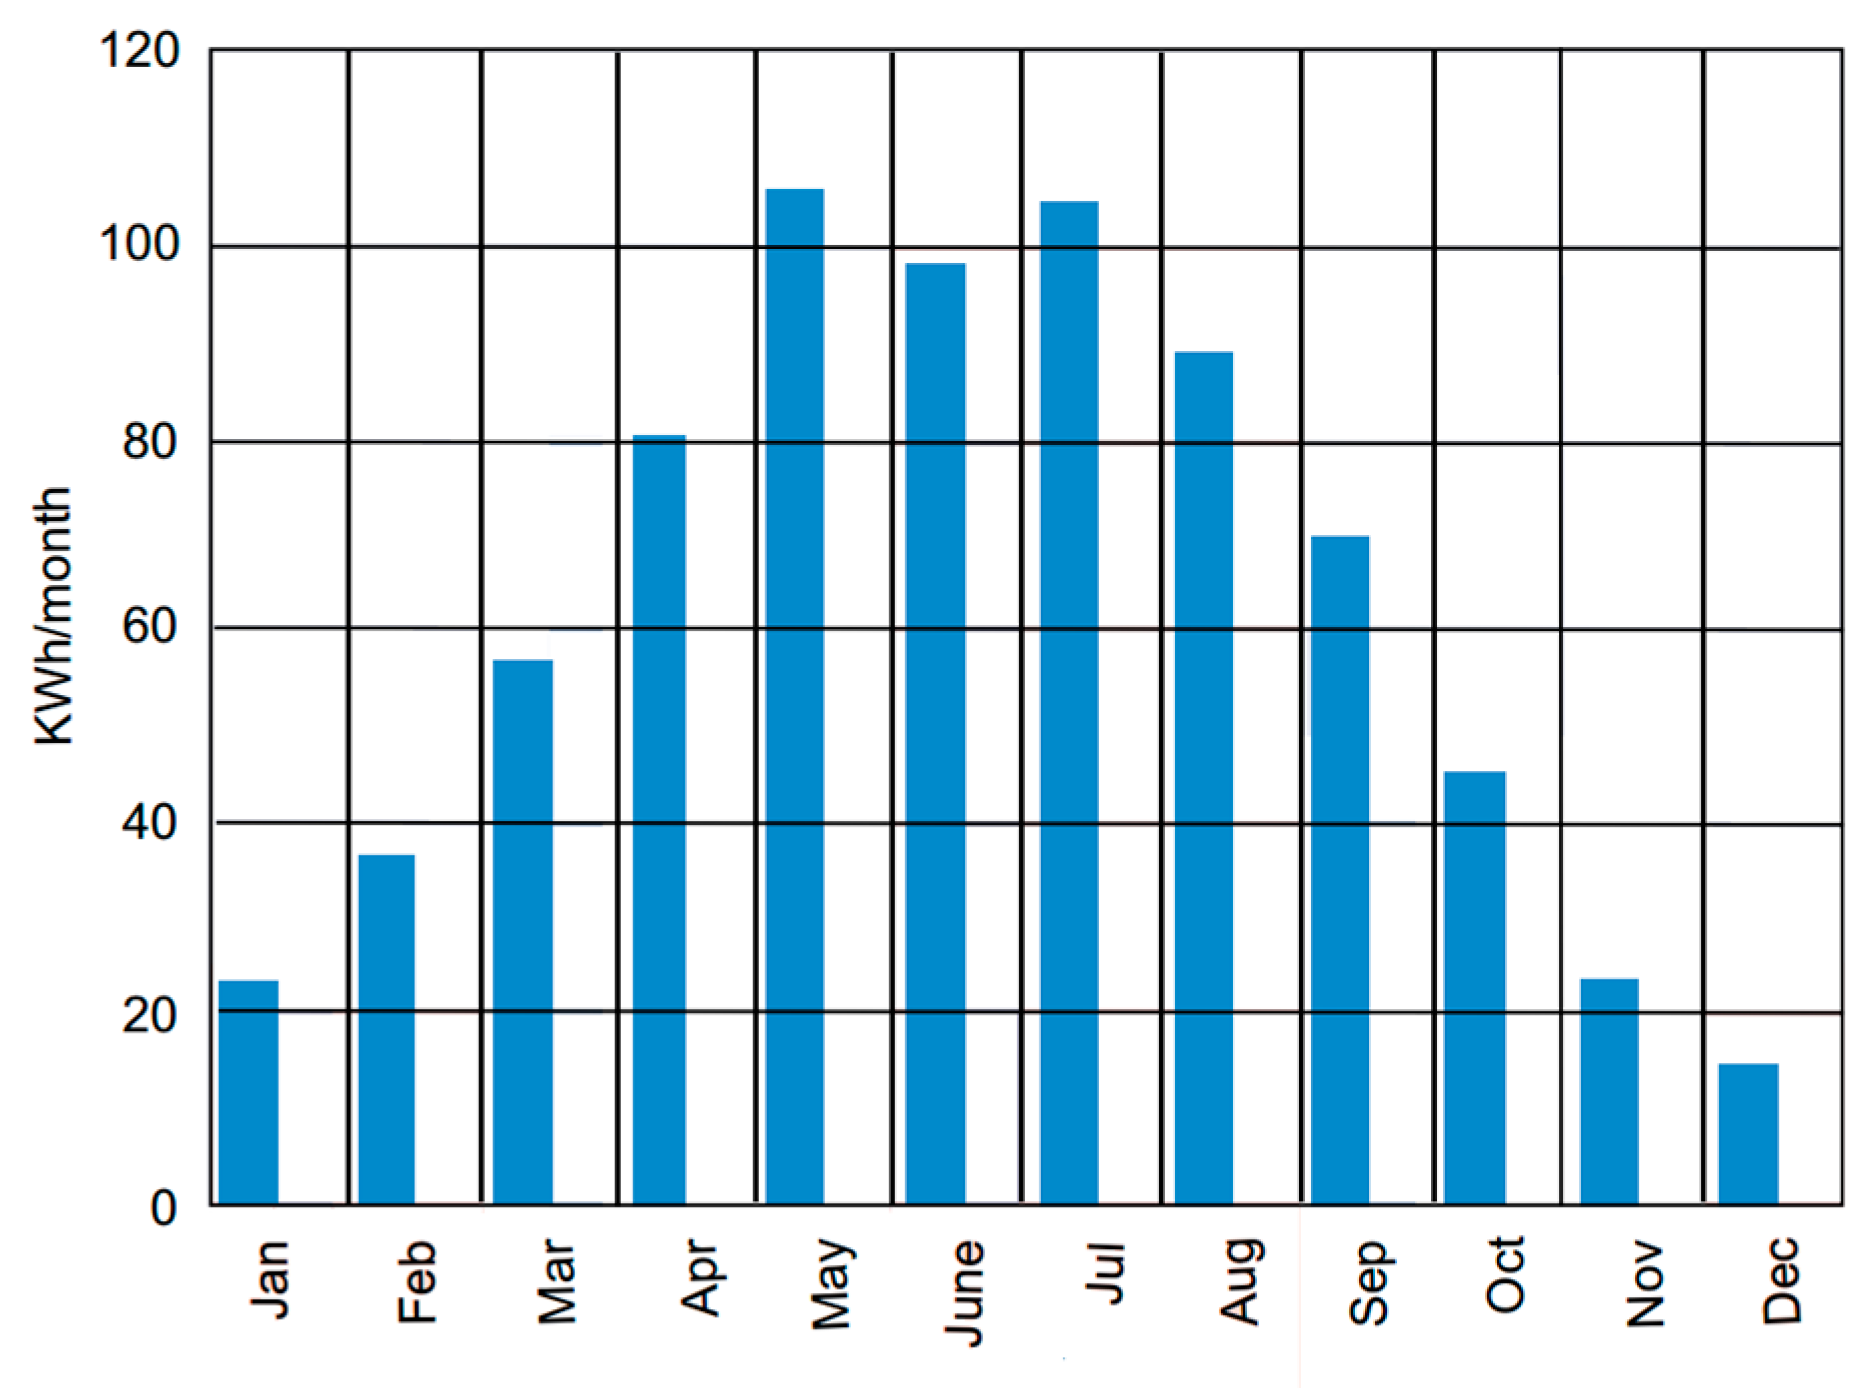
Figure 15 shows the typical pattern of power generated by a solar panel in the UK on a cloudless day [60]. The peak power generated in January is approximately 60% of the peak power generated in July and April. In the winter, power generation takes place for 8 h a day, while in the summer it takes place up to 16 h a day. As a result, the energy generated in the winter months is only 20% of the energy generated in the summer months, as shown in Figure 16. In April and July the power generation curve (Figure 15) is very similar, and this can be explained by the higher efficiency of the solar panels at lower temperatures in April, although irradiance is higher in July.
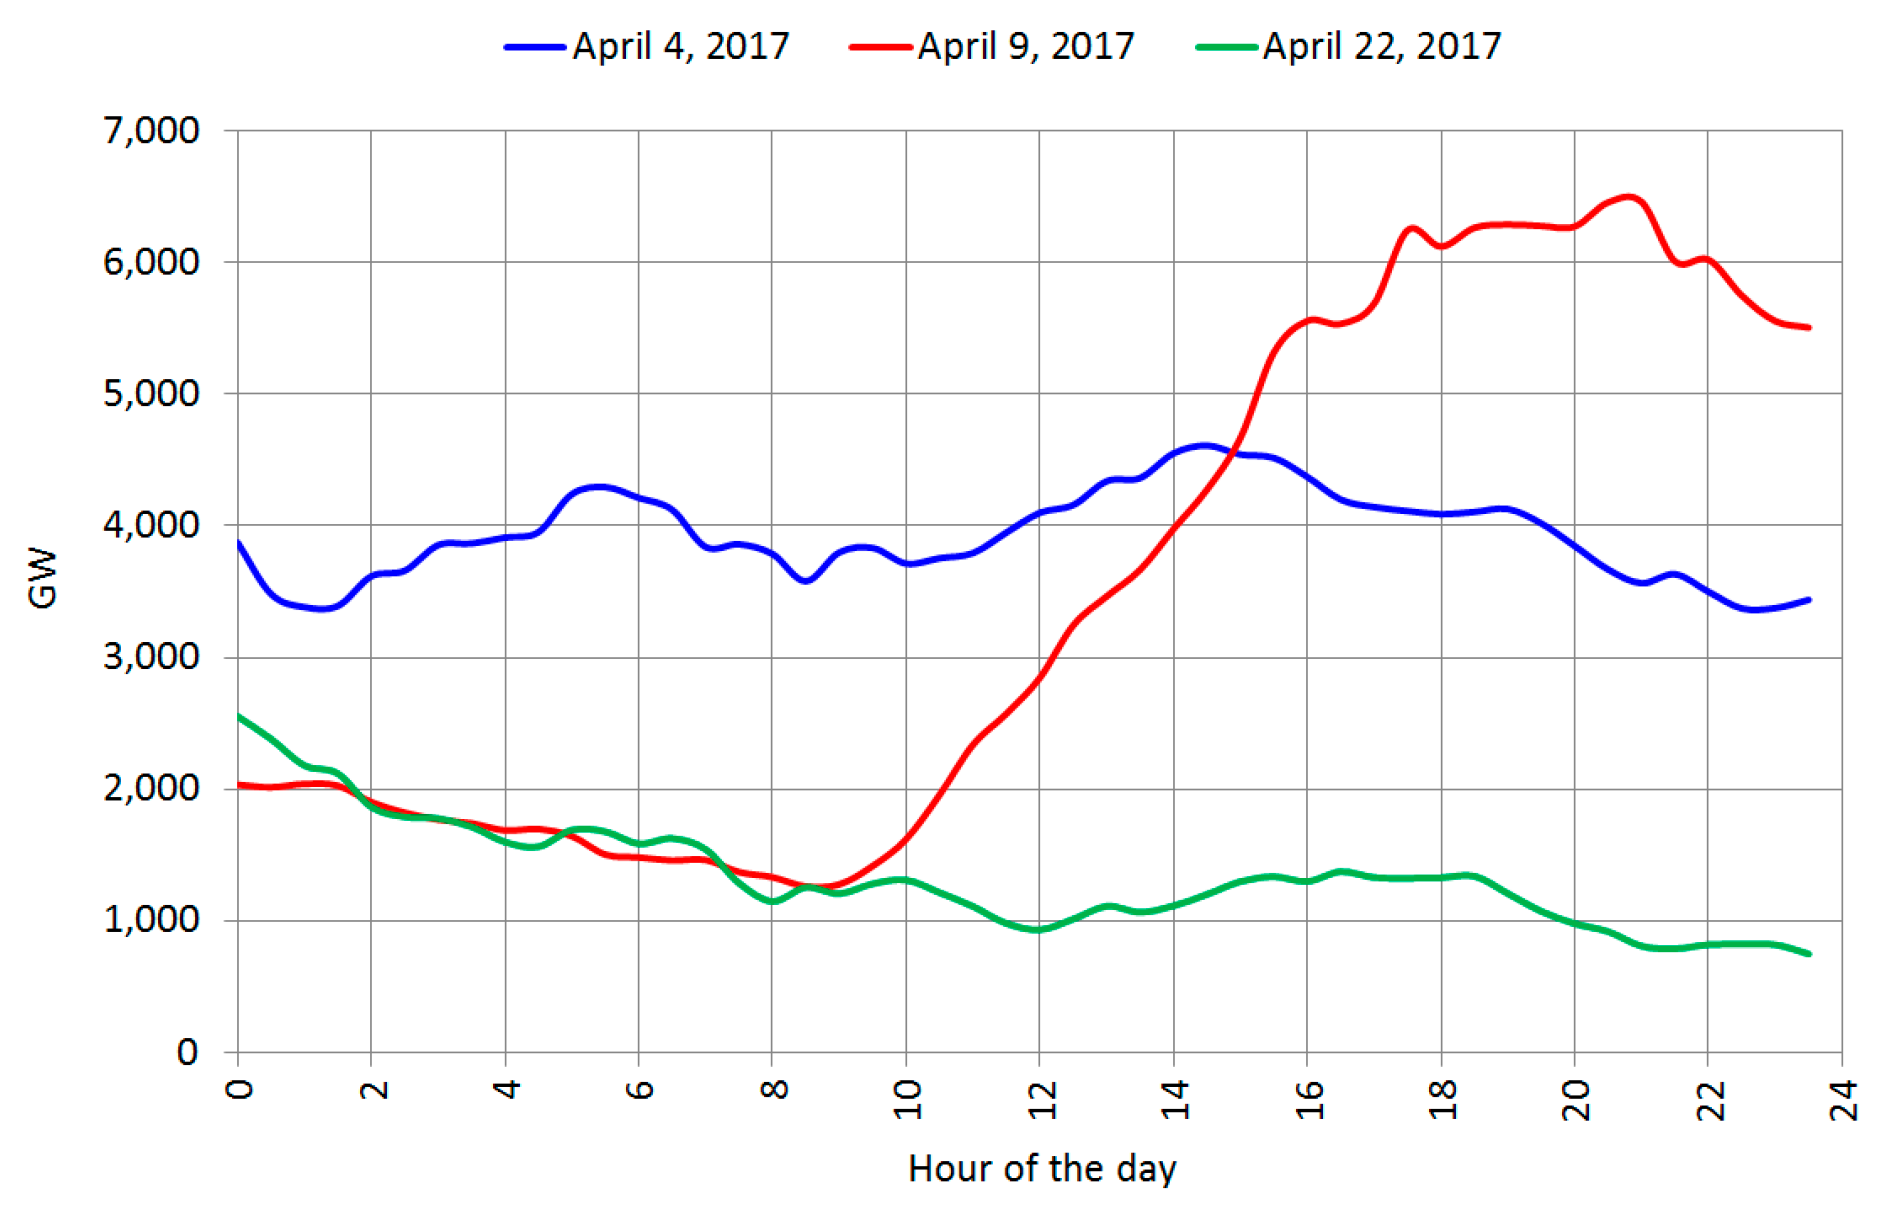
Figure 17 shows wind power generation in the UK for three sample days in April 2017. These graphs indicate that wind generation is quite difficult to forecast, compared to solar generation, due to the high variability of wind speed in consecutive days.
Figure 18 shows monthly wind energy generation in the UK between January 2013 and April 2017. The generation curve shows that peak values are reached in January, therefore complementing energy generation from solar panels. It is also possible that wind generation is curtailed in other months due to lower demand.
6.2. The Role of Tidal Lagoons
The developers of the tidal lagoons claim that a set of projects distributed across the UK coast may be able to provide a constant “base load”, due to the different times the tides take place at these locations [63,64]. However, no supporting evidence of this claim has been provided. The analysis carried out in [65] shows instead that base-load generation is difficult to achieve, given the proximity of these projects and the lack of sufficient spatial diversity. The analysis carried out in [21] reinforces this conclusion, stating that “it is not realistic” for tidal lagoons to provide base load.
Rather than geographical diversity, high predictability seems to be the most profitable characteristic of tidal lagoons. Since it is possible to predict accurately and in advance the times and levels of tidal generation, this source of energy can be accurately integrated in the forecast; therefore, rather than being used as ‘base-load’, it can be integrated more in the form of “spinning reserve”.
In the UK, the transmission system operator keeps a number of power stations (mainly gas-fired) running at less than their full capacity, thus providing about 1 GW of spinning reserve: this capacity can automatically respond to any shortfall in generation within seconds [66].
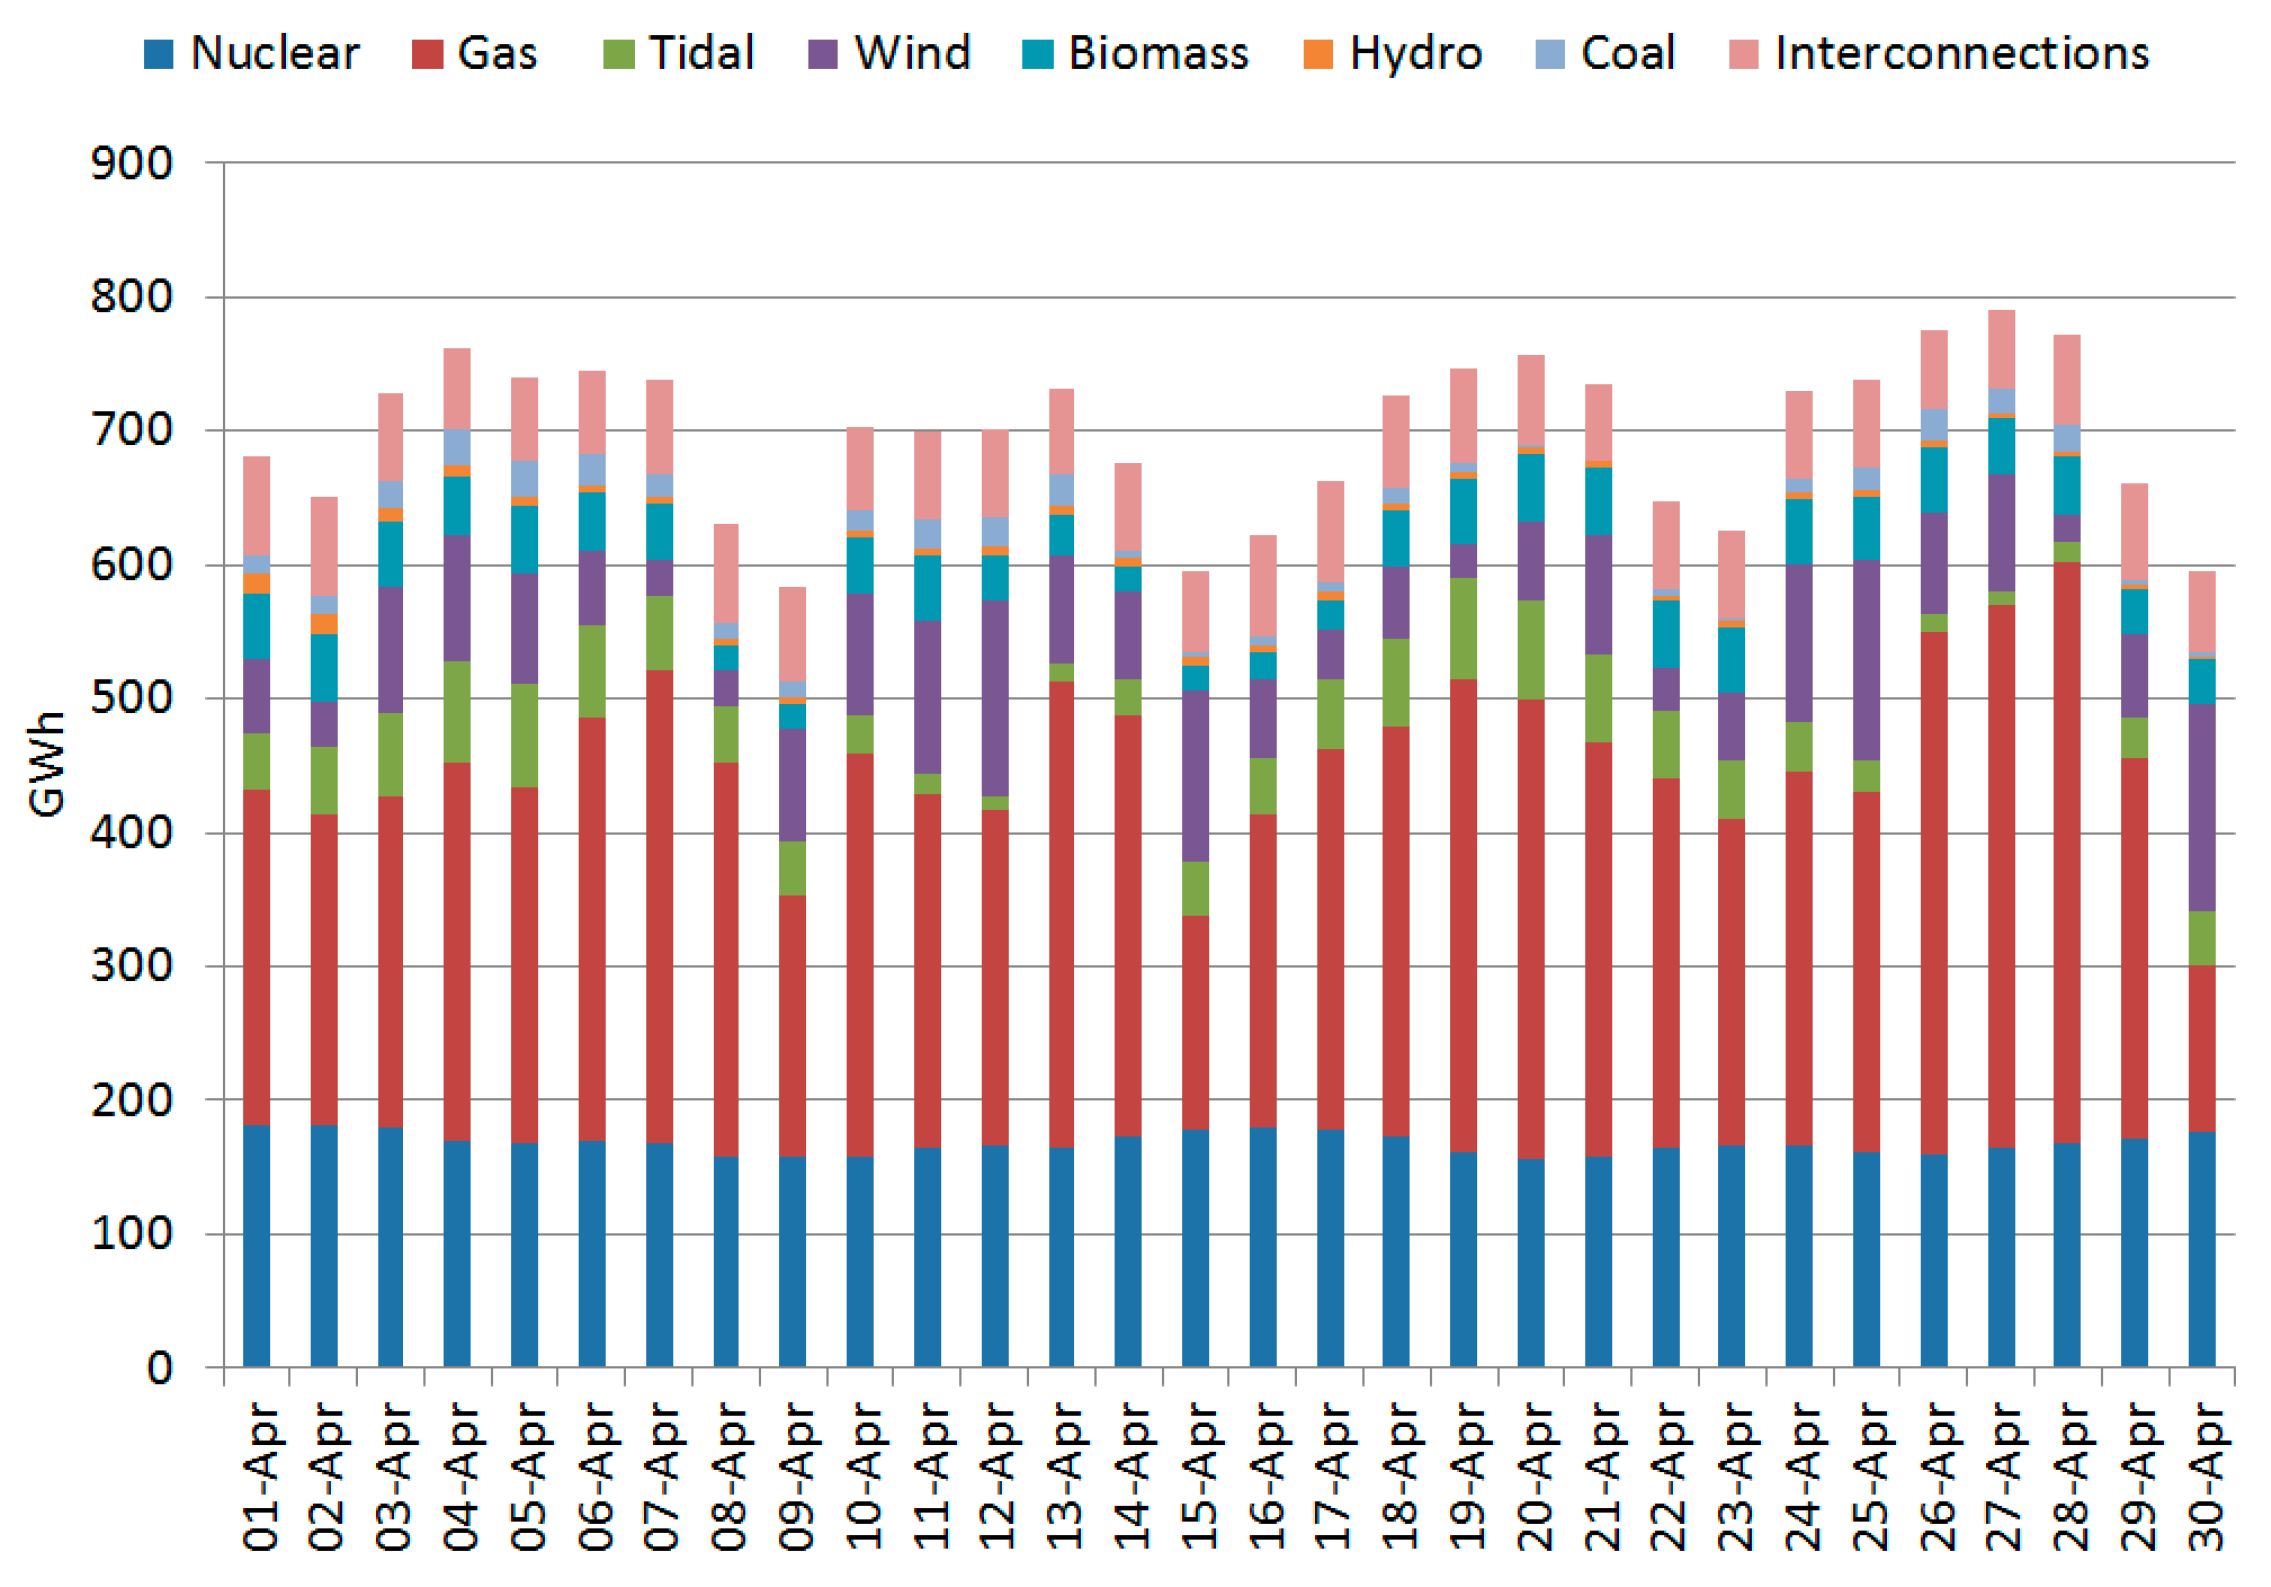
The use of spinning reserves is exemplified in Figure 19, which shows daily energy generation in the UK for April 2017, divided per energy source. Base-load generation is currently provided by nuclear energy, while gas generation is variable, and seems to compensate for the variability of wind generation, as the two bars vary asynchronously (where wind energy generation is larger, gas generation is lower).
The use of gas generation to provide spinning reserve is expensive and polluting, since operating gas turbines intermittently is an inefficient process which generates high levels of CO2. Since tidal lagoons are going to be connected to the transmission system, and their output power can be easily predicted, it can be argued that they may be used for providing spinning reserve. This possibility can be verified only by means of accurate integration studies, and may provide justification to improve the generation pattern of tidal plants and reduce output power fluctuations.
Section 7.2 will show a modified version of the graph shown in Figure 19 when tidal lagoons are integrated within the energy system. In order to address this topic, it is first necessary to quantify the generation pattern expected from tidal lagoons.
7. Quantitative Analysis
This section will consider one of the proposed tidal projects in South Wales as an application example. Some of the formulae shown in Section 5 will be applied to a real project, thus quantifying the expected power generation, based on available data.
7.1. Estimated Annual Energy Generation
The Swansea Tidal Lagoon is considered a “pathfinder” project, due to its small size and advanced state of development (Section 3). This project consists of a single-basin system, with 16 bi-directional 20 MW hydro turbines for a total 320 MW power rating. The seawall is 9.5 km long, and the total area enclosed in the lagoon is 11.5 km2 [52]. The Swansea Tidal Lagoon will be connected to the 275 kV Baglan substation, which is a part of the National Grid system [21].
To estimate the total energy by this project over a year, the tidal data for Swansea Bay is required: this information can be retrieved from online databases, such as [67]. The 2017 tidal data indicate a maximum tidal range between 2.1 m (average range neap tide) and 8.5 m (average range spring tide). The average tidal range for 2017 is expected to be 5.3 m.
The potential energy stored inside the lagoon can be calculated as follows by applying (1), where the average tidal range as differential height:
Since their basin is filled twice a day and emptied twice a day, the annual potential energy can be calculated as follows:
As discussed in Section 5.1, the annual energy generated by the lagoon will be significantly lower than the energy potential stored in the water. Since tidal lagoons are generally only at the design stage, the annual yearly energy generation can be only estimated. The developers [52] expect an annual energy generation of approximately 530 GWh. An independent study carried out in [44] estimates the annual energy generation for different operating modes. For the dual-mode energy generation scheme with no pumping (which is the operating mode currently under consideration for Swansea Tidal Lagoon), the calculated energy generation is approximately 480 GWh, which is 9.4% less than the value reported by the lagoon developers (This is the lowest amount of energy production reported in the paper: both ebb-generation and pumping would lead to significantly higher energy generation. La Range and Sihwa use ebb-generation only [5]).
The calculation of the CF gives some further insights on the validity of the energy generation levels estimated by the developers. By substituting this value in (3), the following is obtained:
The above capacity factor is aligned with the values reported in the literature for tidal plants (Section 5.1), which is approximately 0.2.
Assuming that generation takes place 14 h a day, the average power generation can be estimated as follows:
Other sources report a lower value; for example, [68] estimates the output power to be approximately 1/3 of the figure above (36 MW). Only the operational experience will be able to quantify figures such as capacity factor and output average power, however, the figures above allow assessing the impact of this project on the local energy system.
Relating the average power generation to the load consumption in South Wales helps in understanding the impact of the proposed project in the region. According to the local distribution system operator (Western Power Distribution), the maximum load in South Wales is expected to be approximately 2200 MW for 2017, and remain quite constant for a few years [69]—this trend is similar to the rest of the UK. The minimum load is projected to be around 1000 MW.
If the highest average power generation value (103.7 MW) is assumed, the Swansea Tidal Lagoon could generate about 5% of the maximum load demand and 10% of the minimum load demand. If the more conservative estimate is used, the contribution to the local demand will be less than 2% for maximum load and less than 3% at minimum load.
7.2. Integration of Tidal Lagoons within the UK Energy Mix
The daily energy generation pattern for the Swansea Tidal Lagoon can be estimated using the tidal data provided in [67]. Figure 20 shows estimated daily energy generation for 2017.
Since generation data for South Wales divided by energy source is not available, it is not possible to quantify the impact of the Swansea Tidal Lagoon for this region. Therefore, the analysis is extended to the UK, using the data available in [61]. It is assumed that the total tidal power installed in the UK is 10 GW, based on the total size of the projects proposed in [52,65]. The energy generated by Swansea Tidal Lagoon (Figure 20) is scaled accordingly, since it has been discussed in Section 6.2 that geographic diversity won’t result in a significant smoothing of power output of the different proposed projects. Figure 21 is a modified version of Figure 19, where tidal energy is included while keeping the same total energy generation. This is accomplished by reducing the amount of energy generated by gas-fired power plants. The amount of tidal energy varies significantly through the month; however, this variation is predictable and therefore allows for planning the use of other energy sources.
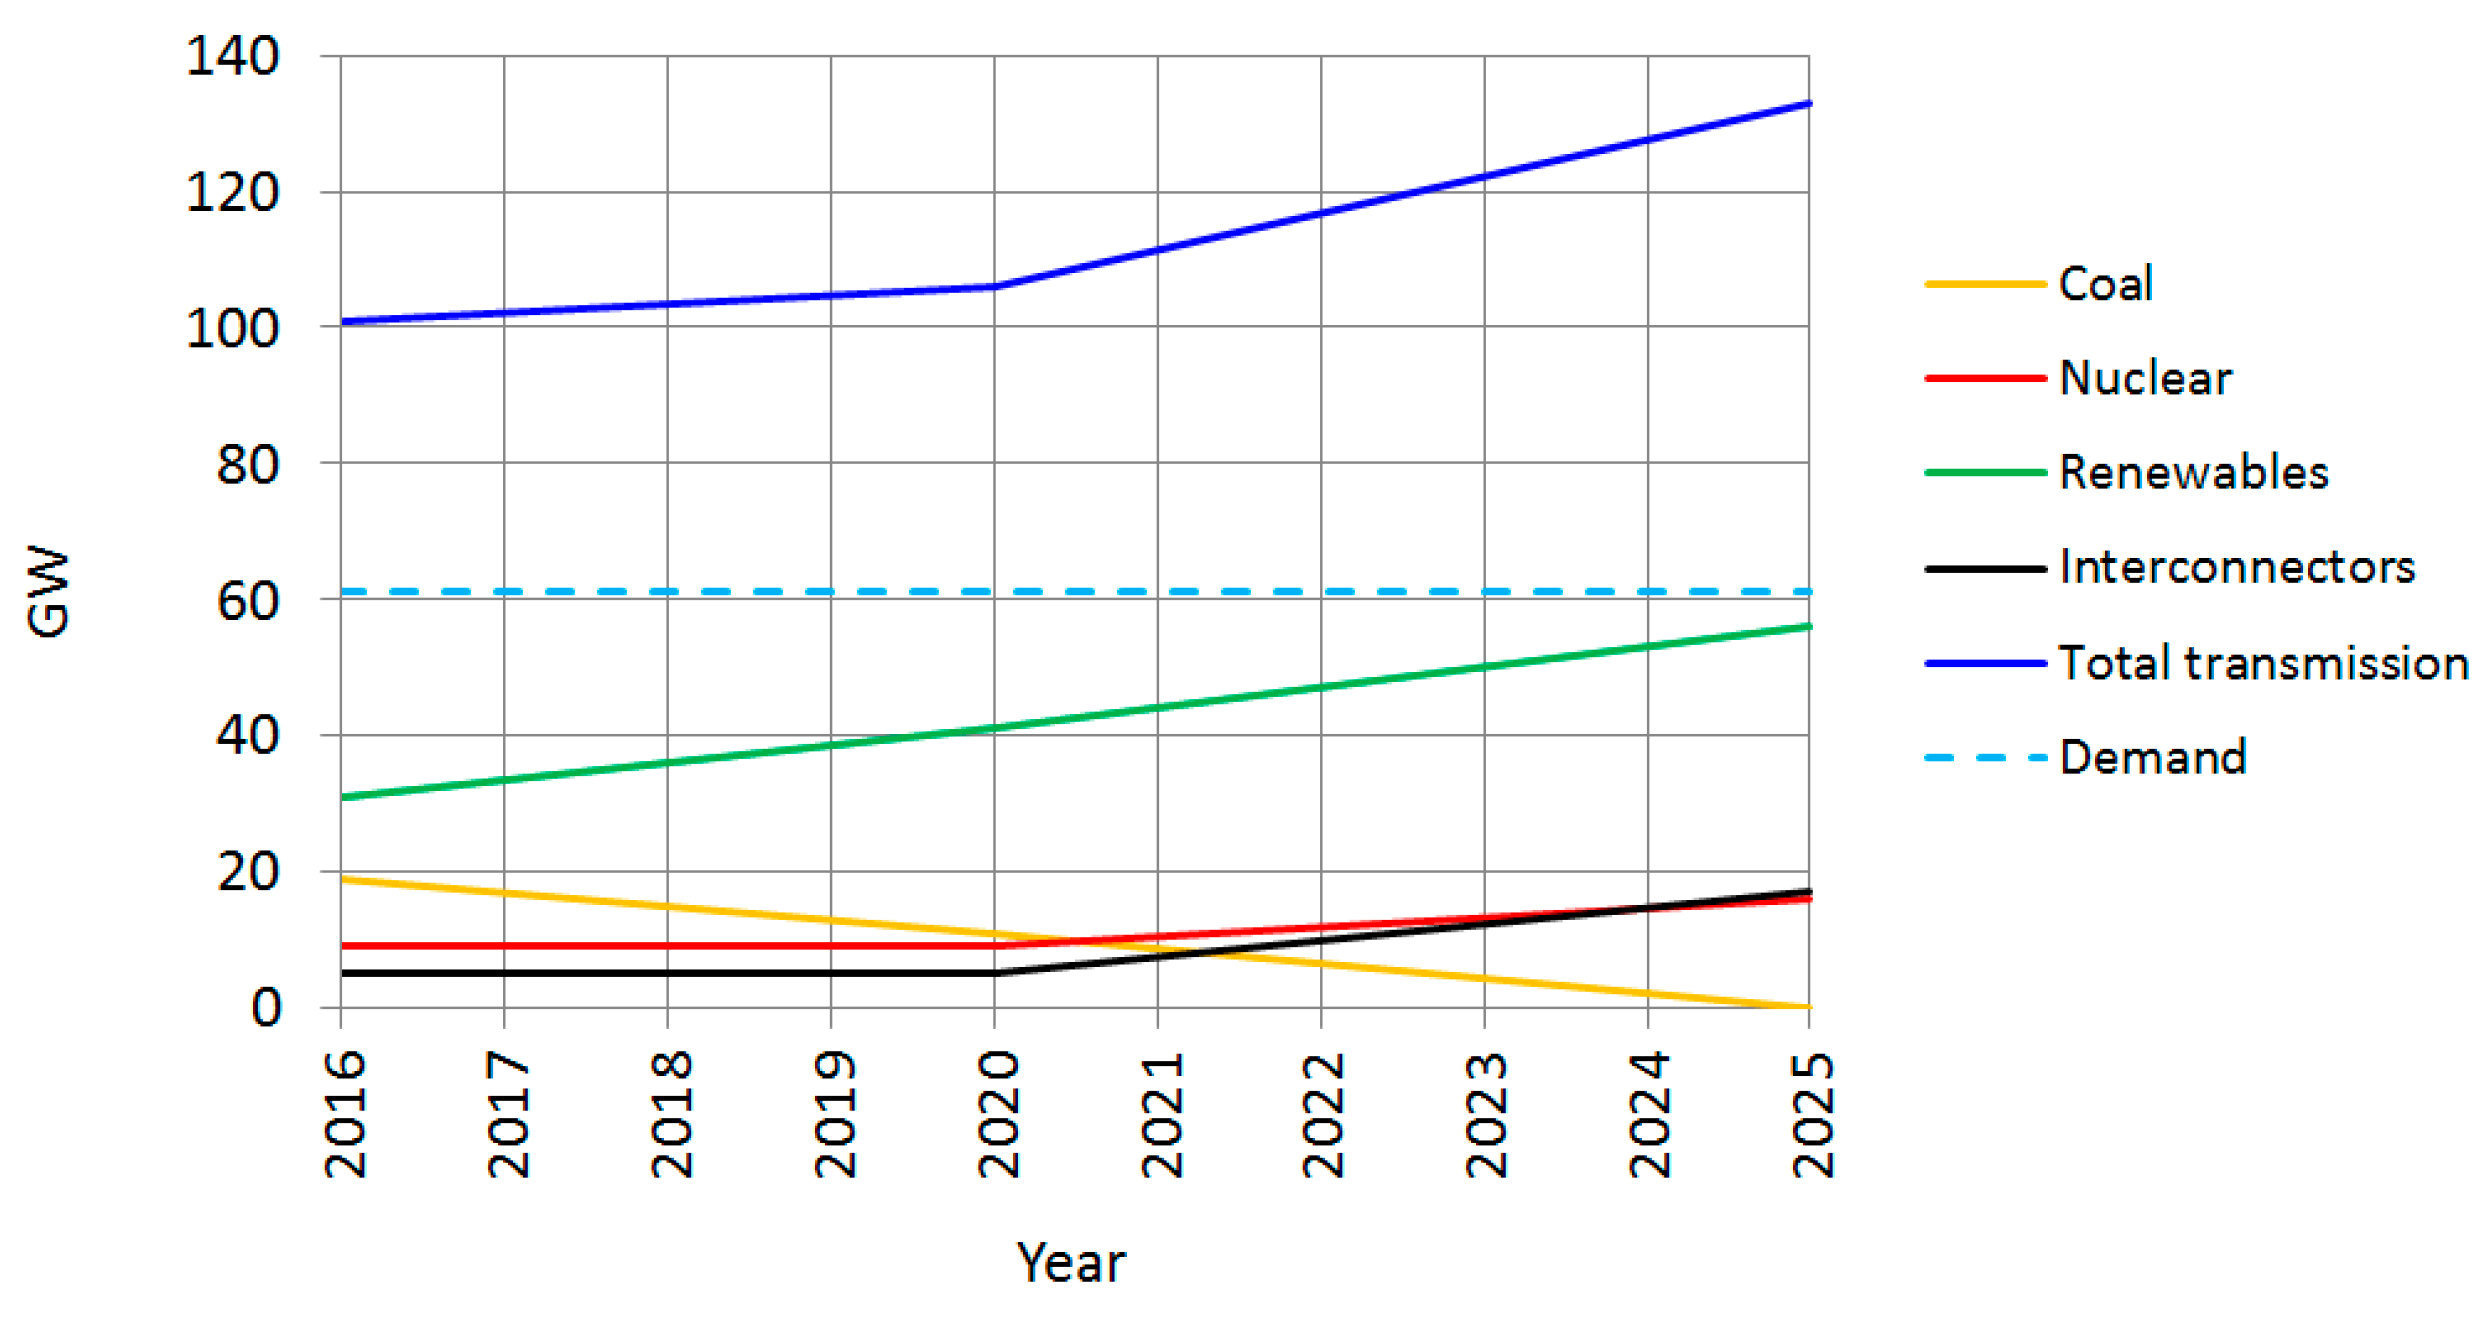
The role of tidal lagoons may become even more important in the next decade. The UK government has set as an objective to phase out all coal plants by 2025 [18,70], due to environmental concerns, CO2 emission targets, and the increasing cost of running coal plants, when compared to other technologies. In the last few years, several coal plants have already been closed, and the trend will continue. Figure 22 shows the installed capacity per technology for the UK transmission system. While at the end of 2016 the installed coal generation was approximately 18 GW, it is scheduled to decrease to 0 GW by the end of 2025 [71]. Renewable generation is projected to grow from 31 to 56 GW, and nuclear from 9 to 16 GW. Energy demand is expected to remain constant [19]. The trends shown in Figure 22 seem to indicate a discrepancy between the increase in installed generation, and the constant value of demand. However, renewable sources do not generate continuously and their output power is most of the time well below the rated value [33,72,73]. The monthly CF used by the UK government to estimate Feed in Tariff generation ranges between 1.4% to 17% for solar energy and between 15.2% and 45.3% for wind energy [74]. This means that in order to replace existing capacity from fossil fuels, a larger amount of generation based on renewable sources needs to be installed.
8. Conclusions
This paper provided a review of the tidal lagoon technology and discussed the integration of this renewable source within the UK energy mix. A summary of existing tidal projects and of projects proposed for the UK has been presented. The principles of operation of tidal lagoons have been described, and the example of the Swansea Tidal Lagoon has been used to quantify the possible impact of a tidal lagoon project on the local energy system. The paper ended with a discussion for the potential integration of tidal lagoons within the UK energy mix.
Given the current plans to retire coal plants in the UK, an energy deficit is expected in the next decade, and tidal energy may help in filling this gap, particularly given the predictability of this energy source.
At the moment, capital cost for these plants is still a major hurdle, and substantial government incentives are required to make these projects financially viable. The environmental impact of these infrastructures is also of concern.
Implementing measures to mitigate the variability will make tidal lagoons more valuable, but will cause a further increase of the initial capital cost.
More studies are required to fully understand the interaction of tidal lagoons with the local power system [75,76,77] and with the marine environment; however, it seems that there is an opportunity for the integration of this technology given the expected deficit in energy generation in the UK in 2025.
Acknowledgments
The authors would like to thank the European Regional Development Fund (ERDF) and the Welsh Government for funding this research through FLEXIS project.
Conflicts of Interest
The authors declare no conflict of interest.
References
- Boston, T.; Baker, S. Energy Storage: Balancing the 21st Century Power Grid. IEEE Electr. Mag. 2015, 3, 52–57. [Google Scholar] [CrossRef]
- Hansen, J.P.; Narbel, P.A.; Aksnes, D.L. Limits to growth in the renewable energy sector. Renew. Sustain. Energy Rev. 2017, 70, 769–774. [Google Scholar] [CrossRef]
- Lynn, P.A. Electricity from Wave and Tide: An Introduction to Marine Energy; Wiley: Chichester, UK, 2013. [Google Scholar]
- Gunn, K.; Stock-Williams, C. Quantifying the global wave power resource. Renew. Energy 2012, 44, 296–304. [Google Scholar] [CrossRef]
- International Renewable Energy Agency (IREA). Tidal Energy—Technology Brief; IRENA Innovation and Technology Centre: Bonn, Germany, 2014; pp. 1–36. Available online: http://www.irena.org/DocumentDownloads/Publications/Tidal_Energy_V4_WEB.pdf (accessed on 18 July 2017).
- Black and Veatch Consulting Ltd. Europe and Global Tidal Stream Energy Resource Assessment; Peer Review Issue 107799/D/2100/05/1; Carbon Trust: London, UK, 2004. [Google Scholar]
- Blunden, L.S.; Bahaj, A.S. Tidal energy resource assessment for tidal stream generators. Proc. Inst. Mech. Eng. Part A J. Power Energy 2007, 221, 137–146. [Google Scholar] [CrossRef]
- Arinaga, R.A.; Cheung, K.F. Atlas of global wave energy from 10 years of reanalysis and hindcast data. Renew. Energy 2012, 39, 49–64. [Google Scholar] [CrossRef]
- Renewable Energy Policy Network for the 21st Century (REN21) Renewables 2016—Global Status Report. Paris, France, 2016. Available online: http://www.ren21.net/status-of-renewables/global-status-report/ (accessed on 1 February 2017).
- Uihlein, A.; Magagna, D. Wave and tidal current energy—A review of the current state of research beyond technology. Renew. Sustain. Energy Rev. 2016, 58, 1–12. [Google Scholar] [CrossRef]
- Marten, S.; Hall, P. Marine tidal energy: A case study in legislative challenges and environmental impacts. In Proceedings of the IEEE Conference on Technologies for Sustainability, Portland, OR, USA, 24–26 July 2014. [Google Scholar]
- Heronomus, W.E.; Margarella, P.A.; McPherson, R.A.; Ewing, D.L. On the extraction of kinetic energy from oceanic and tidal river currents. In Macarthur Workshop on the Feasibility of Extracting Useable Energy from the Florida Current; Stewart, H.B., Ed.; Palm Beach Shores: Palm Beach, FL, USA, 1974. [Google Scholar]
- Strategic Initiative for Ocean Energy (SIocean). Ocean Energy: Cost of Energy and Cost Reduction Opportunities. 2013. Available online: https://www.oceanenergy-europe.eu/images/projects/130501-SI-Ocean---Cost-of-Energy-Report.pdf (accessed on 6 July 2017).
- Lissaman, P.B.S.; Radkey, R.L. Coriolis program: A review of the status of the ocean turbine energy System. In Proceedings of the Oceans ’79, San Diego, CA, USA, 17–19 September 1979; IEEE: London, UK, 1979; pp. 559–565. [Google Scholar]
- MacGillivray, A.; Jeffrey, H.; Hanmer, C.; Magagna, D.; Raventos, A.; Badcock-Broe, A. Ocean energy technology: Gaps and barriers. In Strategic Initiative for Ocean Energy (SIocean); SI Ocean: Brusseles, Belgium, 2013; Available online: http://www.marineenergypembrokeshire.co.uk/wp-content/uploads/2010/03/Gaps-and-Barriers-Report-FV.pdf (accessed on 18 July 2017).
- Sannino, G.; Cavicchioli, C. Overcoming Research Challenges for Ocean Renewable Energy. Available online: https://setis.ec.europa.eu/energy-research/sites/default/files/library/ERKC_PB%20Ocean%20Renewable%20Energy.pdf (accessed on 5 July 2017).
- Frid, C.; Andonegi, E.; Depestele, J.; Judd, A.; Rihan, D.; Rogers, S.I.; Kenchington, E. The environmental interactions of tidal and wave energy generation devices. Environ. Impact Assess. Rev. 2012, 32, 133–139. [Google Scholar] [CrossRef]
- Department of Energy & Climate Change. UK Energy in Brief 2014; Crown Copyright: London, UK, 2014. Available online: https://www.gov.uk/government/statistics/uk-energy-in-brief-2014 (accessed on 18 July 2017).
- National Grid UK. Future Energy Scenarios, Warwick, UK. Available online: fes.nationalgrid.com (accessed on 18 July 2017).
- Elliot, D. Tidal Power-moving ahead. In Energy Research Developments: Tidal Energy, Energy Efficiency and Solar Energy; Johnson, K.F., Veliotti, T.R., Eds.; Nova Science Publishers: Hauppauge, NY, USA, 2009. [Google Scholar]
- Hendry, C. The Role of Tidal Lagoons. Final Report. 2016. Available online: https://hendryreview.files.wordpress.com/2016/08/hendry-review-final-report-english-version.pdf (accessed on 10 February 2017).
- Cartwright, D.E. Oceanic tides. Rep. Prog. Phys. 1977, 40, 665–708. [Google Scholar] [CrossRef]
- Webb, D.J. Tides and tidal energy. Contemp. Phys. 1982, 23, 419–442. [Google Scholar] [CrossRef]
- Pugh, D.T. Tides, Surges and Mean Sea-Level. A Handbook for Engineers and Scientists; John Wiley & Sons: Chichester, UK, 1987. [Google Scholar]
- Thurman, H.V. Introductory Oceanography, 7th ed.; Macmillan: New York, NY, USA, 1994. [Google Scholar]
- Struben, A.M.A. Tidal Power; Sir Isaac Pitman & Sons, LTD: London, UK, 1921. [Google Scholar]
- Lawless, M.; Rodger, D. Development of the European tidal database and its potential application to marine renewables. J. Coast. Res. 2013, 29, 1629–1630. [Google Scholar] [CrossRef]
- NASA Scientific Visualization Studio. Revealing Hidden Tidal Energy 20/02/2017. Available online: http://svs.gsfc.nasa.gov/stories/topex/tides.html (accessed on 15 December 2016).
- Garrison, T. Oceanography: An Invitation to Marine Science, 9th ed.; Brooks Cole: Boston, MA, USA, 2015. [Google Scholar]
- Miles, J.W. Resonant response of harbours: An equivalent-circuit analysis. J. Fluid Mech. 1971, 46, 241–265. [Google Scholar] [CrossRef]
- Snyder, R.M. Tidal hydraulics in estuarine channels. ASCE J. Hydraul. Div. 1980, 106, 237–245. [Google Scholar]
- Garrett, C.; Cummins, P. The power potential of tidal currents in channels. Proc. R. Soc. Lond. A 2005, 461, 2563–2572. [Google Scholar] [CrossRef]
- Twidell, J.; Weir, T. Renewable Energy Resources, 3rd ed.; Routledge: Oxon, UK, 2015. [Google Scholar]
- BP Marine Environmental Research Ltd, The Met Office, Garrad Hassan. Proudman Oceanographic Laboratory. Atlas of UK Marine Renewable Energy Resources; Technical Report R.1106; ABP Marine Environmental Research: Southampton, UK, 2004. [Google Scholar]
- Van Nieuwkoop, J.C.C.; Smith, H.C.M.; Smith, G.H.; Johanning, L. Wave resource assessment along the Cornish coast (UK) from a 23-year hindcastdata set validated against buoy measurements. Renew. Energy 2013, 58, 1–14. [Google Scholar] [CrossRef]
- Thake, J. Development, Installation and Testing of a Large-Scale Tidal Current Turbine; Technical Report T/06/00210/00/REP; Department of Trade and Industry: London, UK, 2005.
- Morton, T. Tidal Array Grid Is World First. Available online: http://www.shetland.org/60n/blogs/posts/tidal-array-grid-connection-is-world-first (accessed on 20 January 2017).
- Cave, P.R.; Evans, E.M. Tidal streams and energy supply in the Channel Islands. Energy for Rural and Island Communities IV. In Proceedings of the Fourth International Conference, Inverness, UK, 1985; Volume 4, pp. 159–164. [Google Scholar]
- Houde, J. Cost-Benefit Analysis of Tidal Energy Generation in Nova Scotia: A Scenario for a Tidal farm with 300 MW of Installed Capacity in the Minas Passage in 2020; Department of Economics, Dalhousie University: Halifax, NS, Canada, 2012. [Google Scholar]
- Barker, N. Managing Tidal Change; Winston Churchill Memorial Trust: London, UK, 2008. [Google Scholar]
- Green, J.; Smith, H.D. Implementation of the UK Marine and Coastal Access Act and Devolved Marine Legislation: Cross-Border Case Studies; Wildlife and Countryside Link: London, UK, 2009. [Google Scholar]
- The Royal Academy of Engineering. The Severn Barrage, London. 2008. Available online: http://www.raeng.org.uk/publications/reports/severn-barrage-transcript (accessed on 18 July 2017).
- Xia, J.; Falconer, R.A.; Lin, B. Impact of different tidal renewable energy projects on the hydrodynamic processes in the Severn Estuary, UK. Ocean Model. 2010, 32, 86–104. [Google Scholar] [CrossRef]
- Baker, C.; Leach, P. Tidal Lagoon Power Generation Scheme in Swansea Bay; 2006. Available online: https://web.archive.org/web/20070317232049/http:/www.dti.gov.uk/files/file30617.pdf (accessed on 18 July 2017).
- The Conservation of Habitats and Species Regulations 2010. Available online: http://www.legislation.gov.uk/uksi/2010/490/regulation/61/made (accessed on 1 May 2017).
- Waters, S.; Aggidis, G. A World First: Swansea Bay Tidal lagoon in review. Renew. Sustain. Energy Rev. 2016, 56, 916–921. [Google Scholar] [CrossRef]
- Baker, A.C. Tidal Power; Peter Peregrinus: London, UK, 1991. [Google Scholar]
- Tousif, S.R.T.; Taslim, S.B. Tidal Power: An Effective Method of Generating Power. Int. J. Sci. Eng. Res. 2011, 2, 1–5. [Google Scholar]
- Betz, A. Introduction to the Theory of Flow Machines; Pergamon Press: Oxford, UK, 1966. [Google Scholar]
- Gorban, A.N.; Gorlov, A.M.; Silantyev, V.M. Limits of the turbine efficiency for free fluid flow. Trans. ASME J. Energy Resour. Technol. 2001, 123, 311–317. [Google Scholar] [CrossRef]
- Walker, J.M.; Flack, K.A.; Lust, E.E.; Schultz, M.P.; Luznik, L. Experimental and numerical studies of blade roughness and fouling on marine current turbine performance. Renew. Energy 2014, 66, 257–267. [Google Scholar] [CrossRef]
- Tidal Lagoon Power. Ours to Own. 2016. Available online: http://www.tidallagoonpower.com/wp-content/uploads/2016/09/Ours-to-Own_Tidal-Lagoon-Power_Oct-2016.pdf (accessed on 5 November 2016).
- Petley, S.; Aggidis, G. Swansea Bay Tidal Lagoon Annual Energy Estimation. Ocean Eng. 2016, 111, 348–357. [Google Scholar] [CrossRef]
- De Laleu, V. La Rance Tidal Power Plant—40 year operation feedback. In Proceedings of the BHA Annual Conference, Liverpool, UK, 14–15 October 2009. [Google Scholar]
- University of Strathclyde Energy Systems Research Unit. New Generation Technologies for Findhorn Eco-Community. Available online: http://www.esru.strath.ac.uk/EandE/Web_sites/13-14/Findhorn/generation.html#power (accessed on 7 July 2017).
- MacKay, D.J.C. Sustainable Energy without the Hot Air; UIT: Cambridge, UK, 2009. [Google Scholar]
- MacKay, D.J.C. Enhancing Electrical Supply by Pumped Storage in Tidal Lagoons. Available online: http://www.inference.phy.cam.ac.uk/sustainable/book/tex/Lagoons.pdf (accessed on 20 January 2017).
- Dugan, R.C.; Taylor, J.A.; Montenegro, D. Energy Storage Modeling for Distribution Planning. IEEE Trans. Ind. Appl. 2016, 99, 12–20. [Google Scholar]
- Regen. Distributed Generation and Demand Study. 2016. Available online: https://www.regensw.co.uk/the-future-of-network-infrastructure-studies (accessed on 15 February 2017).
- Cotterel, M.; Griff, T. Guide to the Installation of Photovoltaic Systems; Microgeneration Certification Scheme: London, UK, 2012. [Google Scholar]
- Renewable Energy Foundation. British Electricity Generation Fuel Mix. Available online: http://www.ref.org.uk/fuel/index.php?tab=month&share=N# (accessed on 8 May 2017).
- Boyle, G. Renewable Electricity and the Grid; Earthscan: London, UK, 2007. [Google Scholar]
- Sinden, G. Variability of UK Marine Resources. Available online: https://www.carbontrust.com/media/174017/eci-variability-uk-marine-energy-resources.pdf (accessed on 18 July 2017).
- Iyer, A.S.; Couch, S.J.; Harrison, G.P.; Wallace, A.R. Variability and phasing of tidal current energy around the United Kingdom. Renew. Energy 2013, 51, 343–357. [Google Scholar] [CrossRef]
- Burrows, R.; Walkington, I.; Yates, N.; Hedges, T.; Chen, T.; Li, M.; Zhou, J.; Wolf, J.; Proctor, R.; Holt, J. Tapping the Tidal Power Potential of the Eastern Irish Sea; ICE publishing: Liverpool, UK, 2015. [Google Scholar]
- Chakravorty, D.; Chaudhuri, B.; Hui, D. Rapid Frequency Response from Smart Loads in Great Britain Power System. IEEE Trans. Smart Grid 2016, 99, 1–10. [Google Scholar] [CrossRef]
- Online Tides and Currents Predictions. Available online: http://tides.mobilegeographics.com/ (accessed on 28 April 2017).
- Adcock, T.A.A. Back of the Envelope Calculations on the Proposed Swansea Bay Tidal Lagoon. 2014. Available online: http://users.ox.ac.uk/~spet1235/Swansea.pdf (accessed on 25 February 2017).
- Western Power Distribution. Long Term Development Statement for Western Power Distribution (South Wales). 2016. Available online: https://www.westernpower.co.uk/About-us/Our-Business/Our-network/Long-term-development.aspx (accessed on 28 December 2016).
- National Grid UK. Electricity Ten Year Statement (ETYS), Warwick, UK. Available online: www2.nationalgrid.com/UK/Industry-information/Future-of-Energy/Electricity-Ten-Year-Statement (accessed on 18 July 2017).
- Hough, D.; White, E. Future of Coal-Fired Power Station Sites; House of Commons: London, UK, 2016; Available online: http://researchbriefings.files.parliament.uk/documents/CDP-2016–0091/CDP-2016–0091.pdf (accessed on 17 February 2017).
- Boccard, N. Capacity factor of wind power realized values vs. estimates. Energy Policy 2009, 37, 2679–2688. [Google Scholar] [CrossRef]
- Denholm, P.; Margolis, R.M. Evaluating the limits of solar photovoltaics (PV) in traditional electric power systems. Energy Policy 2007, 35, 2852–2861. [Google Scholar] [CrossRef]
- Hemingway, J. Estimating Generation from Feed in Tariff Installations. Available online: https://www.gov.uk/government/statistics/energy-trends-december-2013-special-feature-article-estimating-generation-from-feed-in-tariff-installations (accessed on 8 May 2017).
- International Electrotechnical Commission (IEC). Grid Integration of Large-Capacity Renewable Energy Sources and Use of Large-Capacity Electrical Energy Storage; IEC: Geneva, Switzerland, 2012. [Google Scholar]
- MacEnri, J.; Reed, M.; Thiringer, T. Power quality performance of the tidal energy converter. In Proceedings of the ASME 2011 30th International Conference on Ocean Offshore and Arctic Engineering, Rotterdam, The Netherlands, 19–24 June 2011. [Google Scholar]
- Sanchez, E.V.; Hansen, R.H.; Kramer, M.M. Control performance assessment and design of optimal control to harvest ocean energy. IEEE J. Ocean. Eng. 2015, 40, 15–26. [Google Scholar] [CrossRef]
Figure 1.
Contribution of wind, solar and ocean energy to the total renewable energy capacity installed worldwide at the end of 2015 [2,9].

Figure 2.
Contribution of different energy sources to the total capacity installed in the UK at the end of 2016 [19].
Figure 2.
Contribution of different energy sources to the total capacity installed in the UK at the end of 2016 [19].
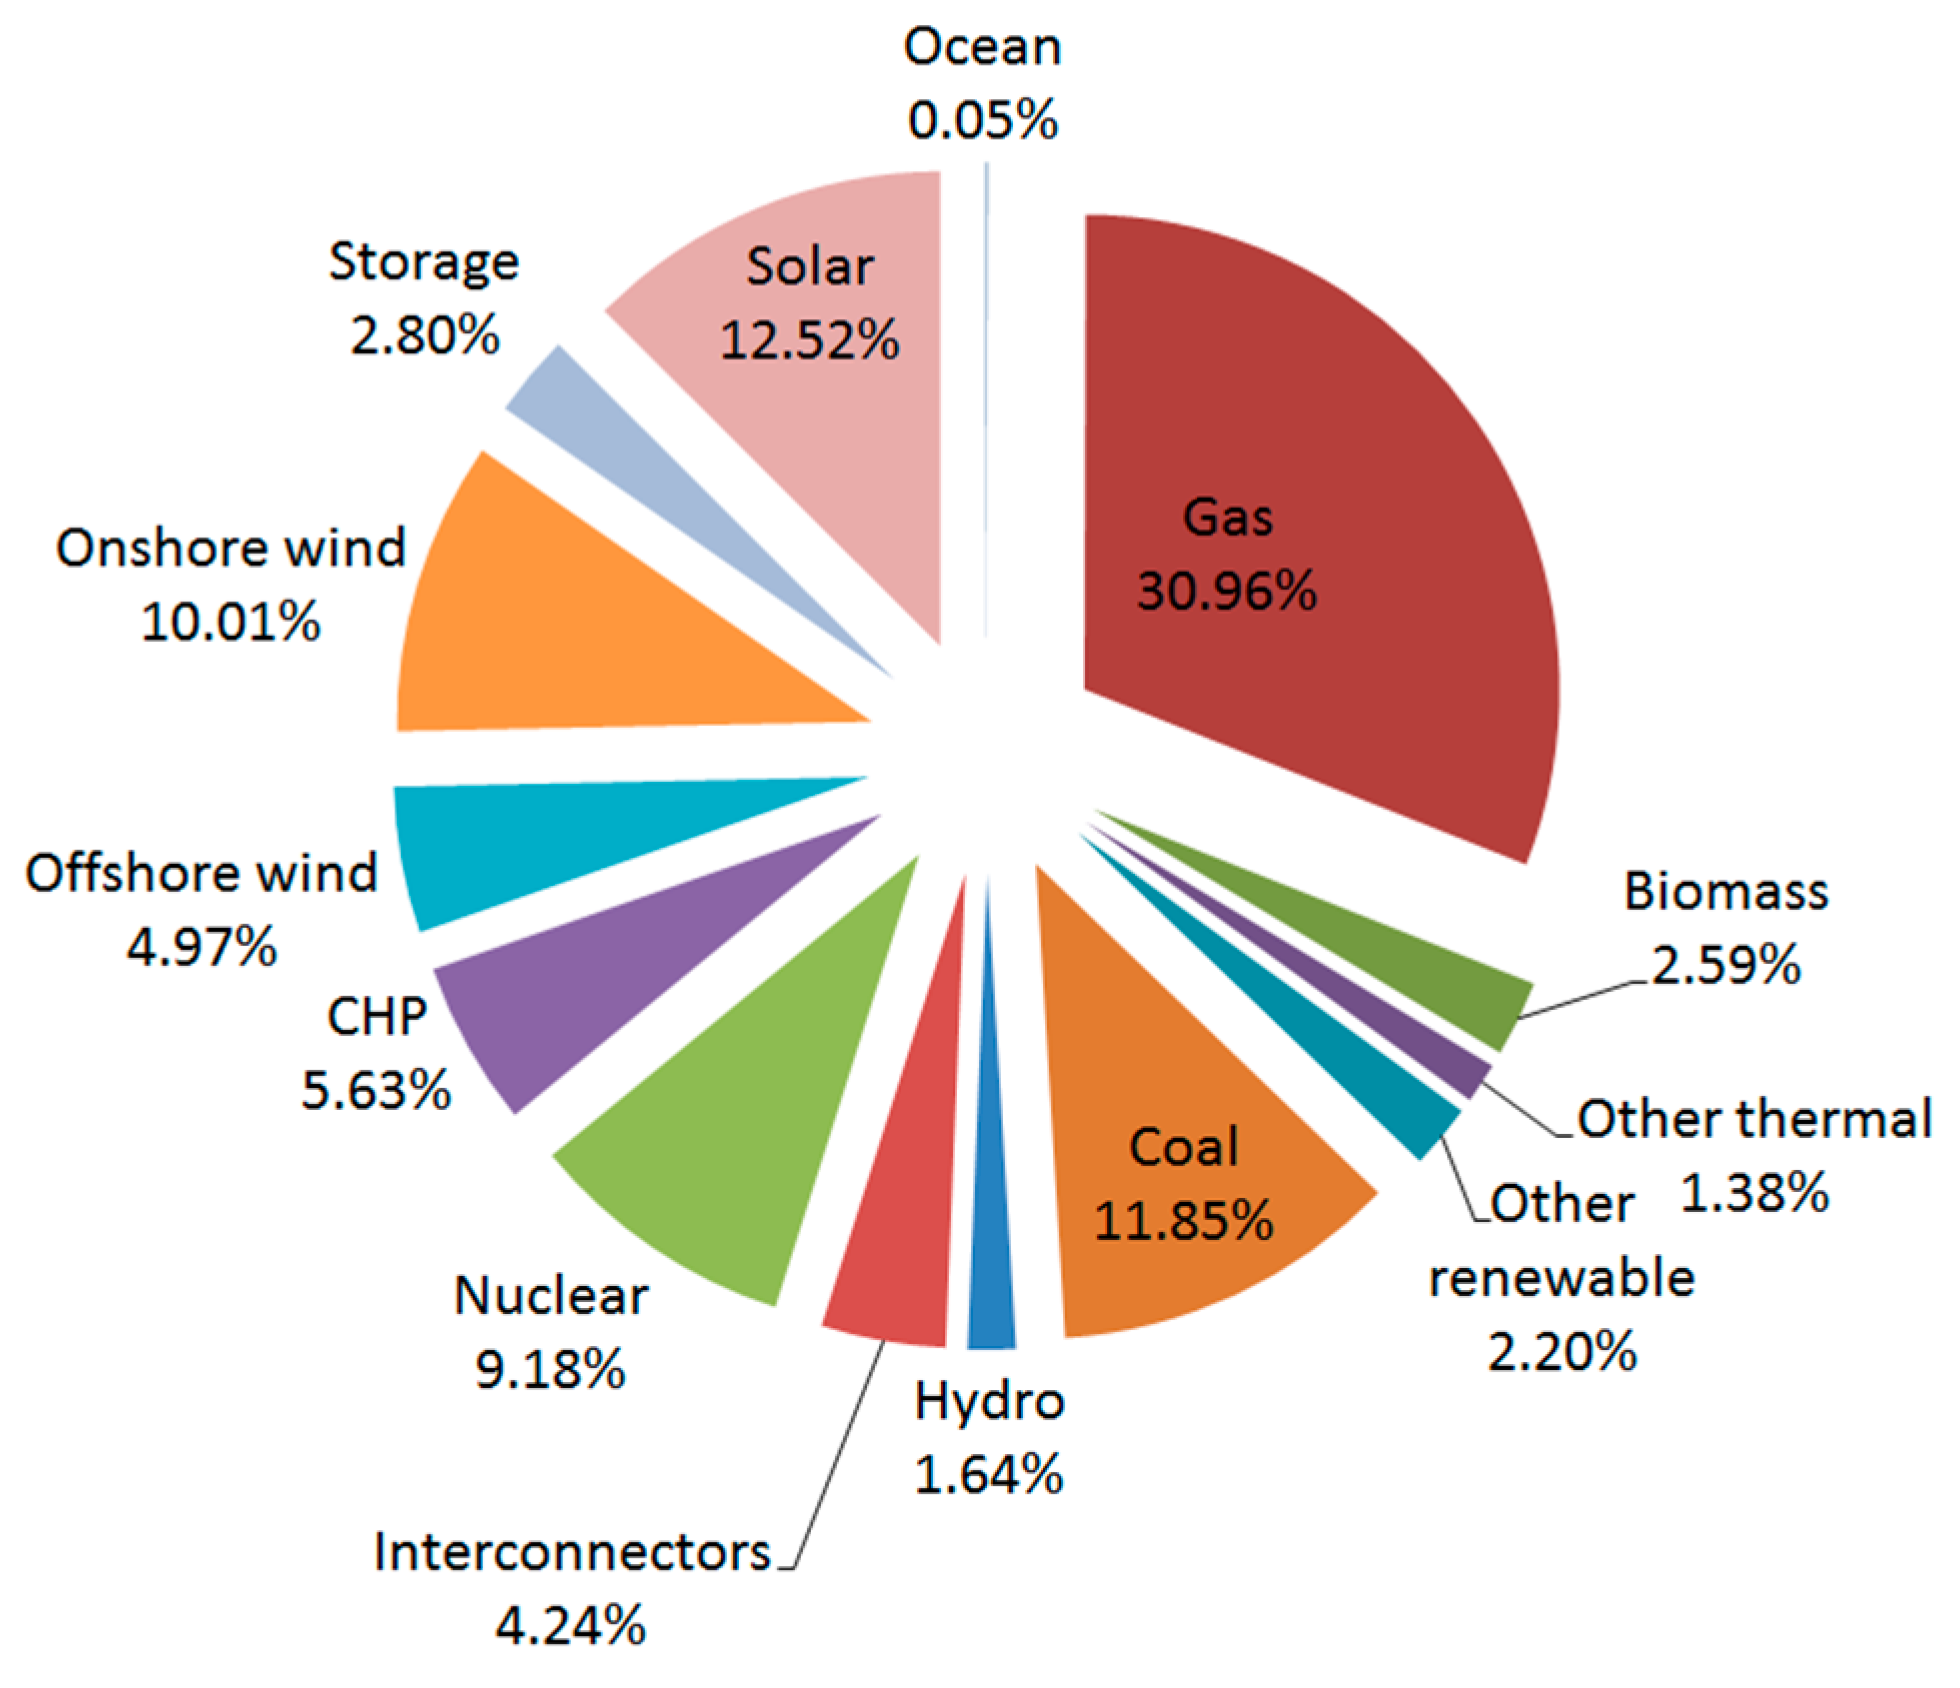
Figure 3.
Different systems used for tidal generation; (a) tidal barrage; (b) tidal lagoon; (c) offshore lagoon.
Figure 3.
Different systems used for tidal generation; (a) tidal barrage; (b) tidal lagoon; (c) offshore lagoon.

Figure 4.
Effect of gravity and inertia on the sea level of Earth.
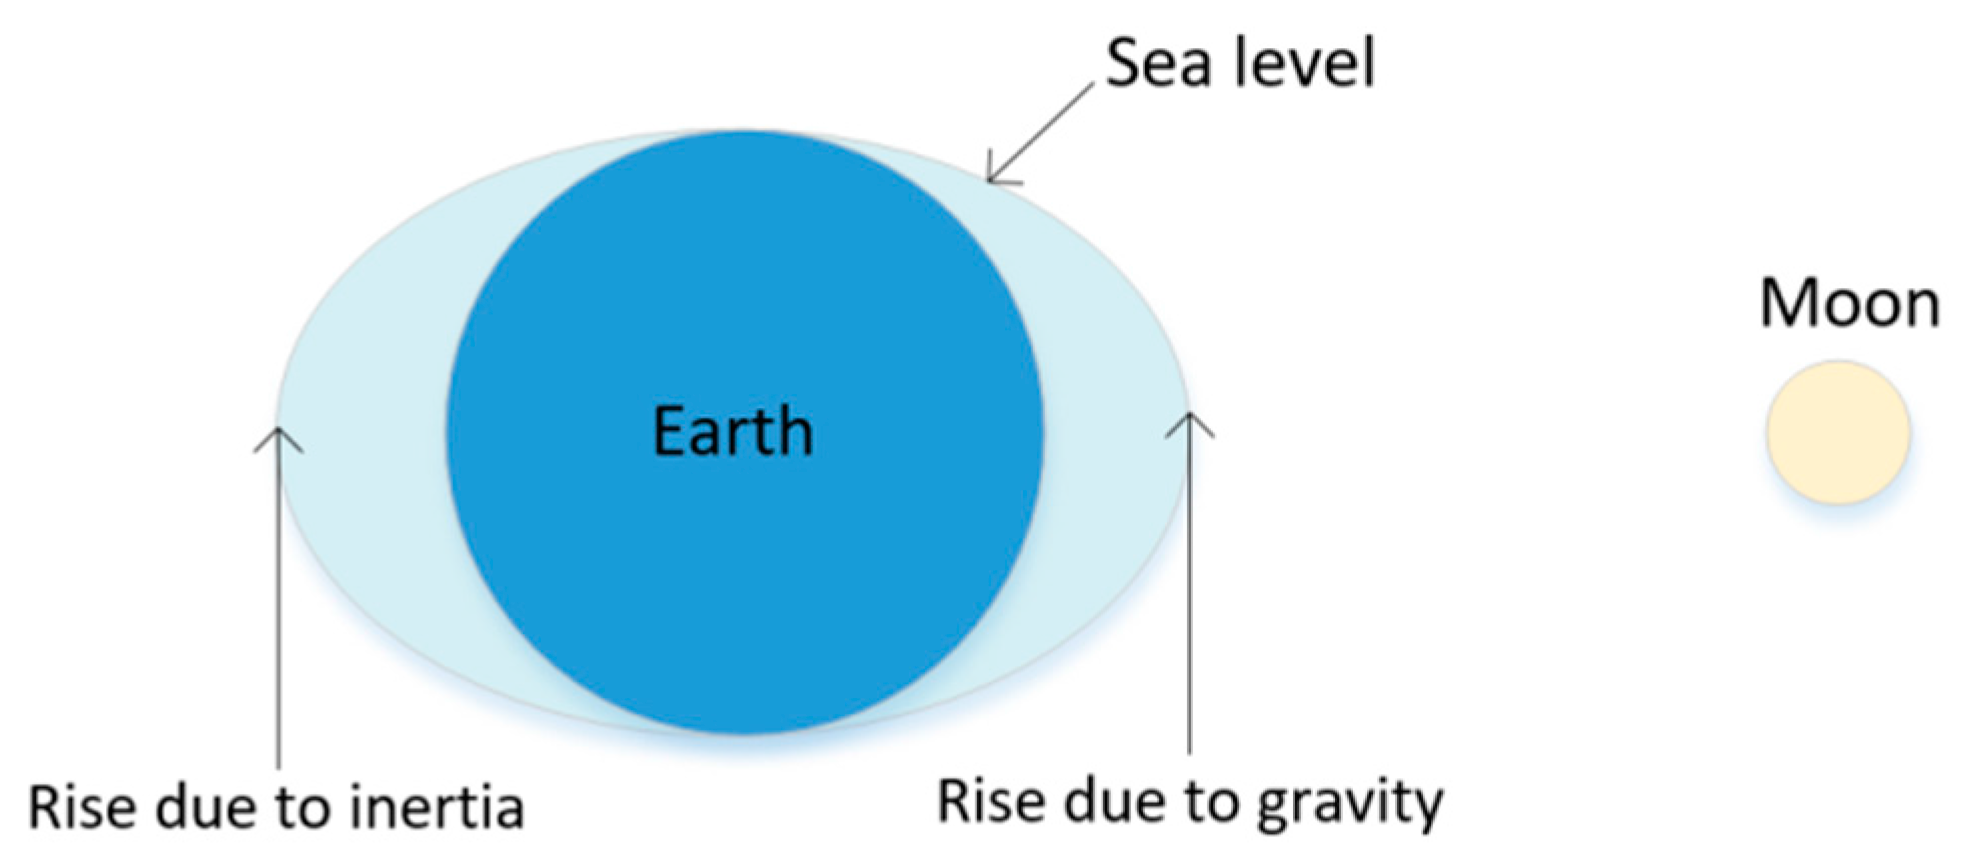
Figure 5.
Comparison of the length of solar day and of lunar day, and typical variation of water levels at one location on Earth.
Figure 5.
Comparison of the length of solar day and of lunar day, and typical variation of water levels at one location on Earth.

Figure 6.
Distribution of tidal range within the oceans. Retrieved from [28].
Figure 6.
Distribution of tidal range within the oceans. Retrieved from [28].

Figure 7.
Effect of funnelling in an Estuary: the water levels inside the estuary rise due to the force of incoming water.
Figure 7.
Effect of funnelling in an Estuary: the water levels inside the estuary rise due to the force of incoming water.

Figure 8.
Area surrounding the Severn Estuary and the Bristol Channel in south-west UK.
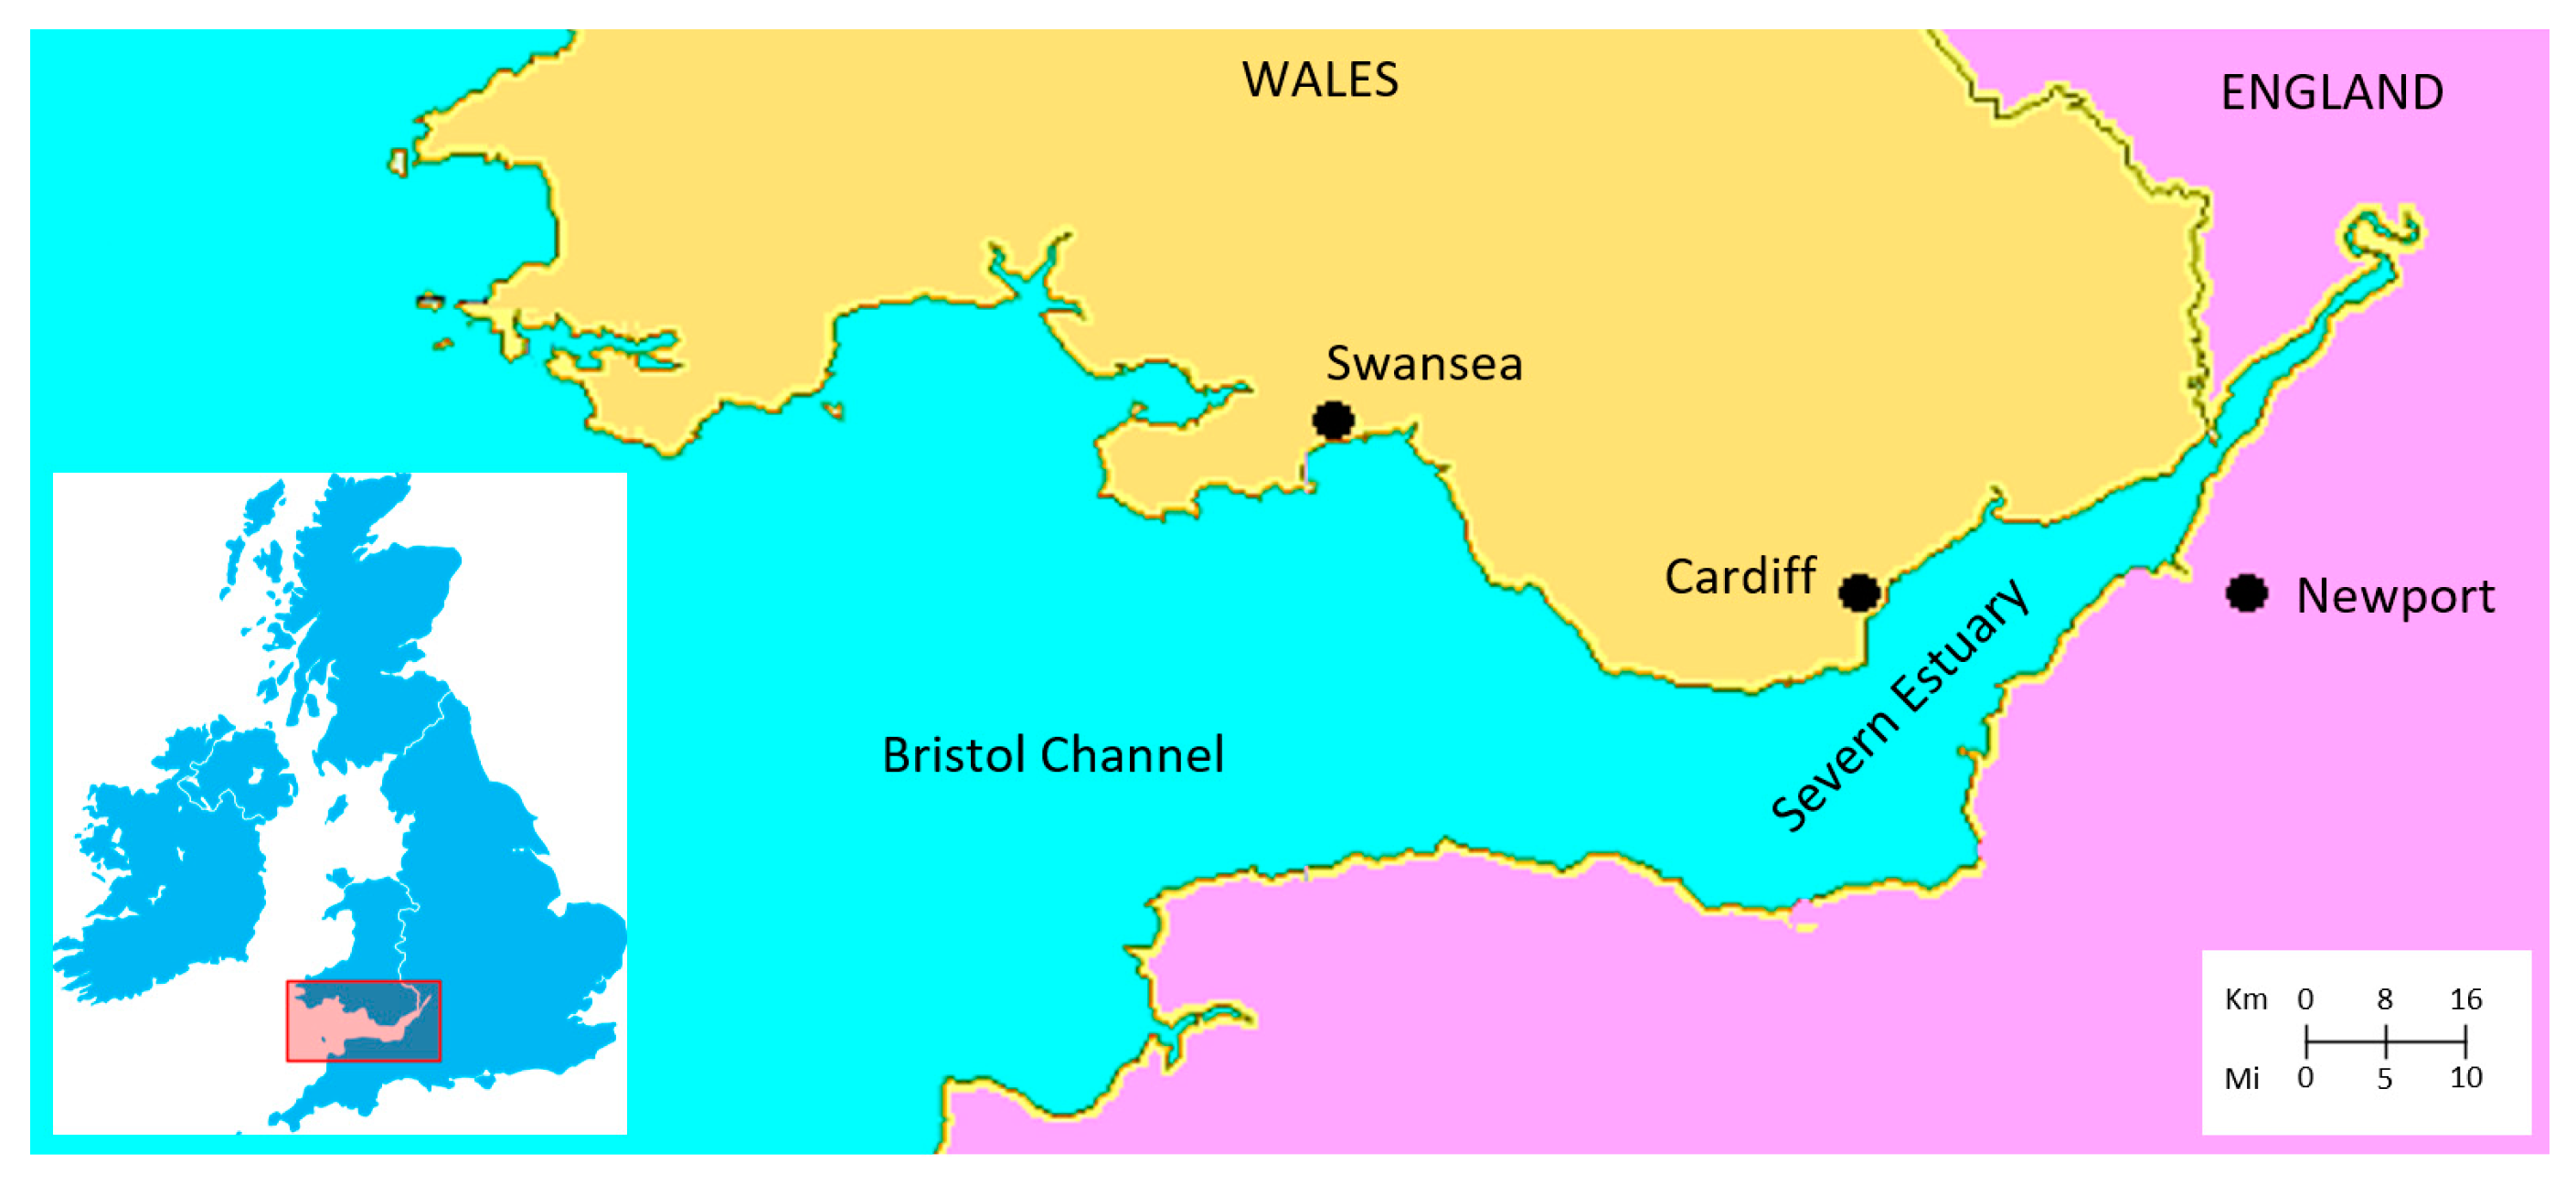
Figure 9.
Illustration of steps in a single-basin tidal lagoon operation: the turbines are installed within the lagoon walls, and water flow is regulated by means of sluice gates. (a) flow tide generation; (b) no generation at high tide; (c) ebb tide generation; (d) no generation at low tide.
Figure 9.
Illustration of steps in a single-basin tidal lagoon operation: the turbines are installed within the lagoon walls, and water flow is regulated by means of sluice gates. (a) flow tide generation; (b) no generation at high tide; (c) ebb tide generation; (d) no generation at low tide.
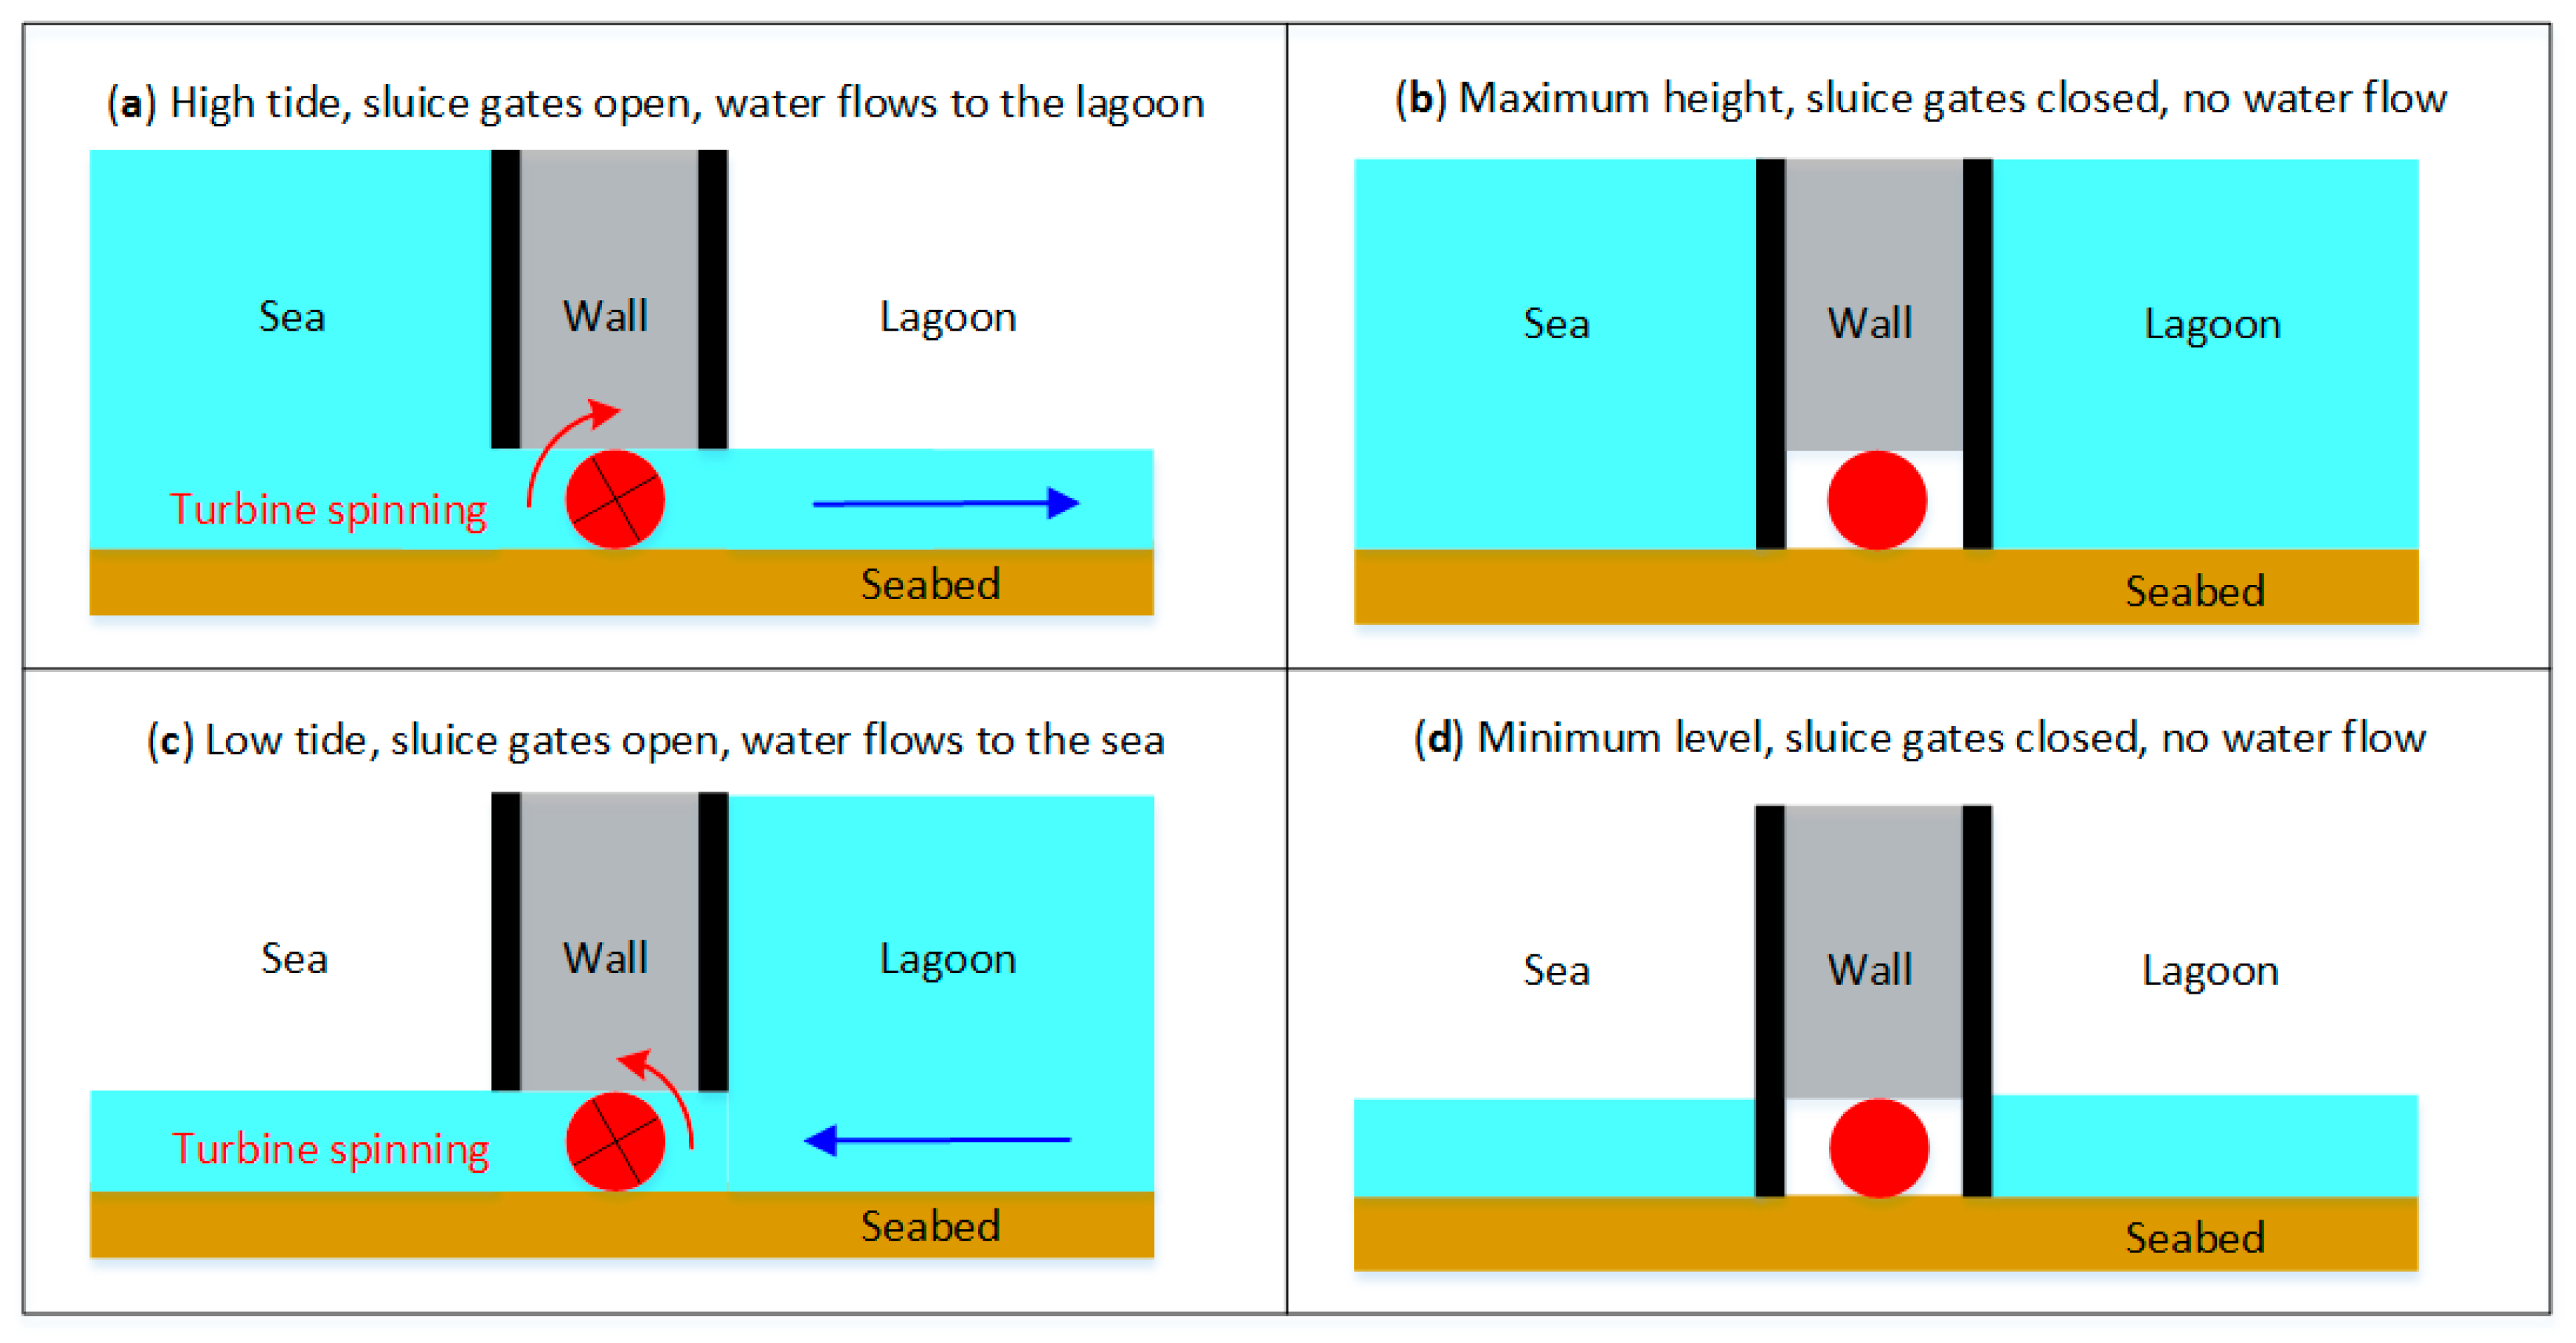
Figure 10.
Sea water level, lagoon water level and energy generation for one tidal period (half tidal day), and for a 60 MW lagoon. Adapted from [44].
Figure 10.
Sea water level, lagoon water level and energy generation for one tidal period (half tidal day), and for a 60 MW lagoon. Adapted from [44].

Figure 11.
Estimated power generation for a 25 kW-rated tidal plant in [55].
Figure 11.
Estimated power generation for a 25 kW-rated tidal plant in [55].
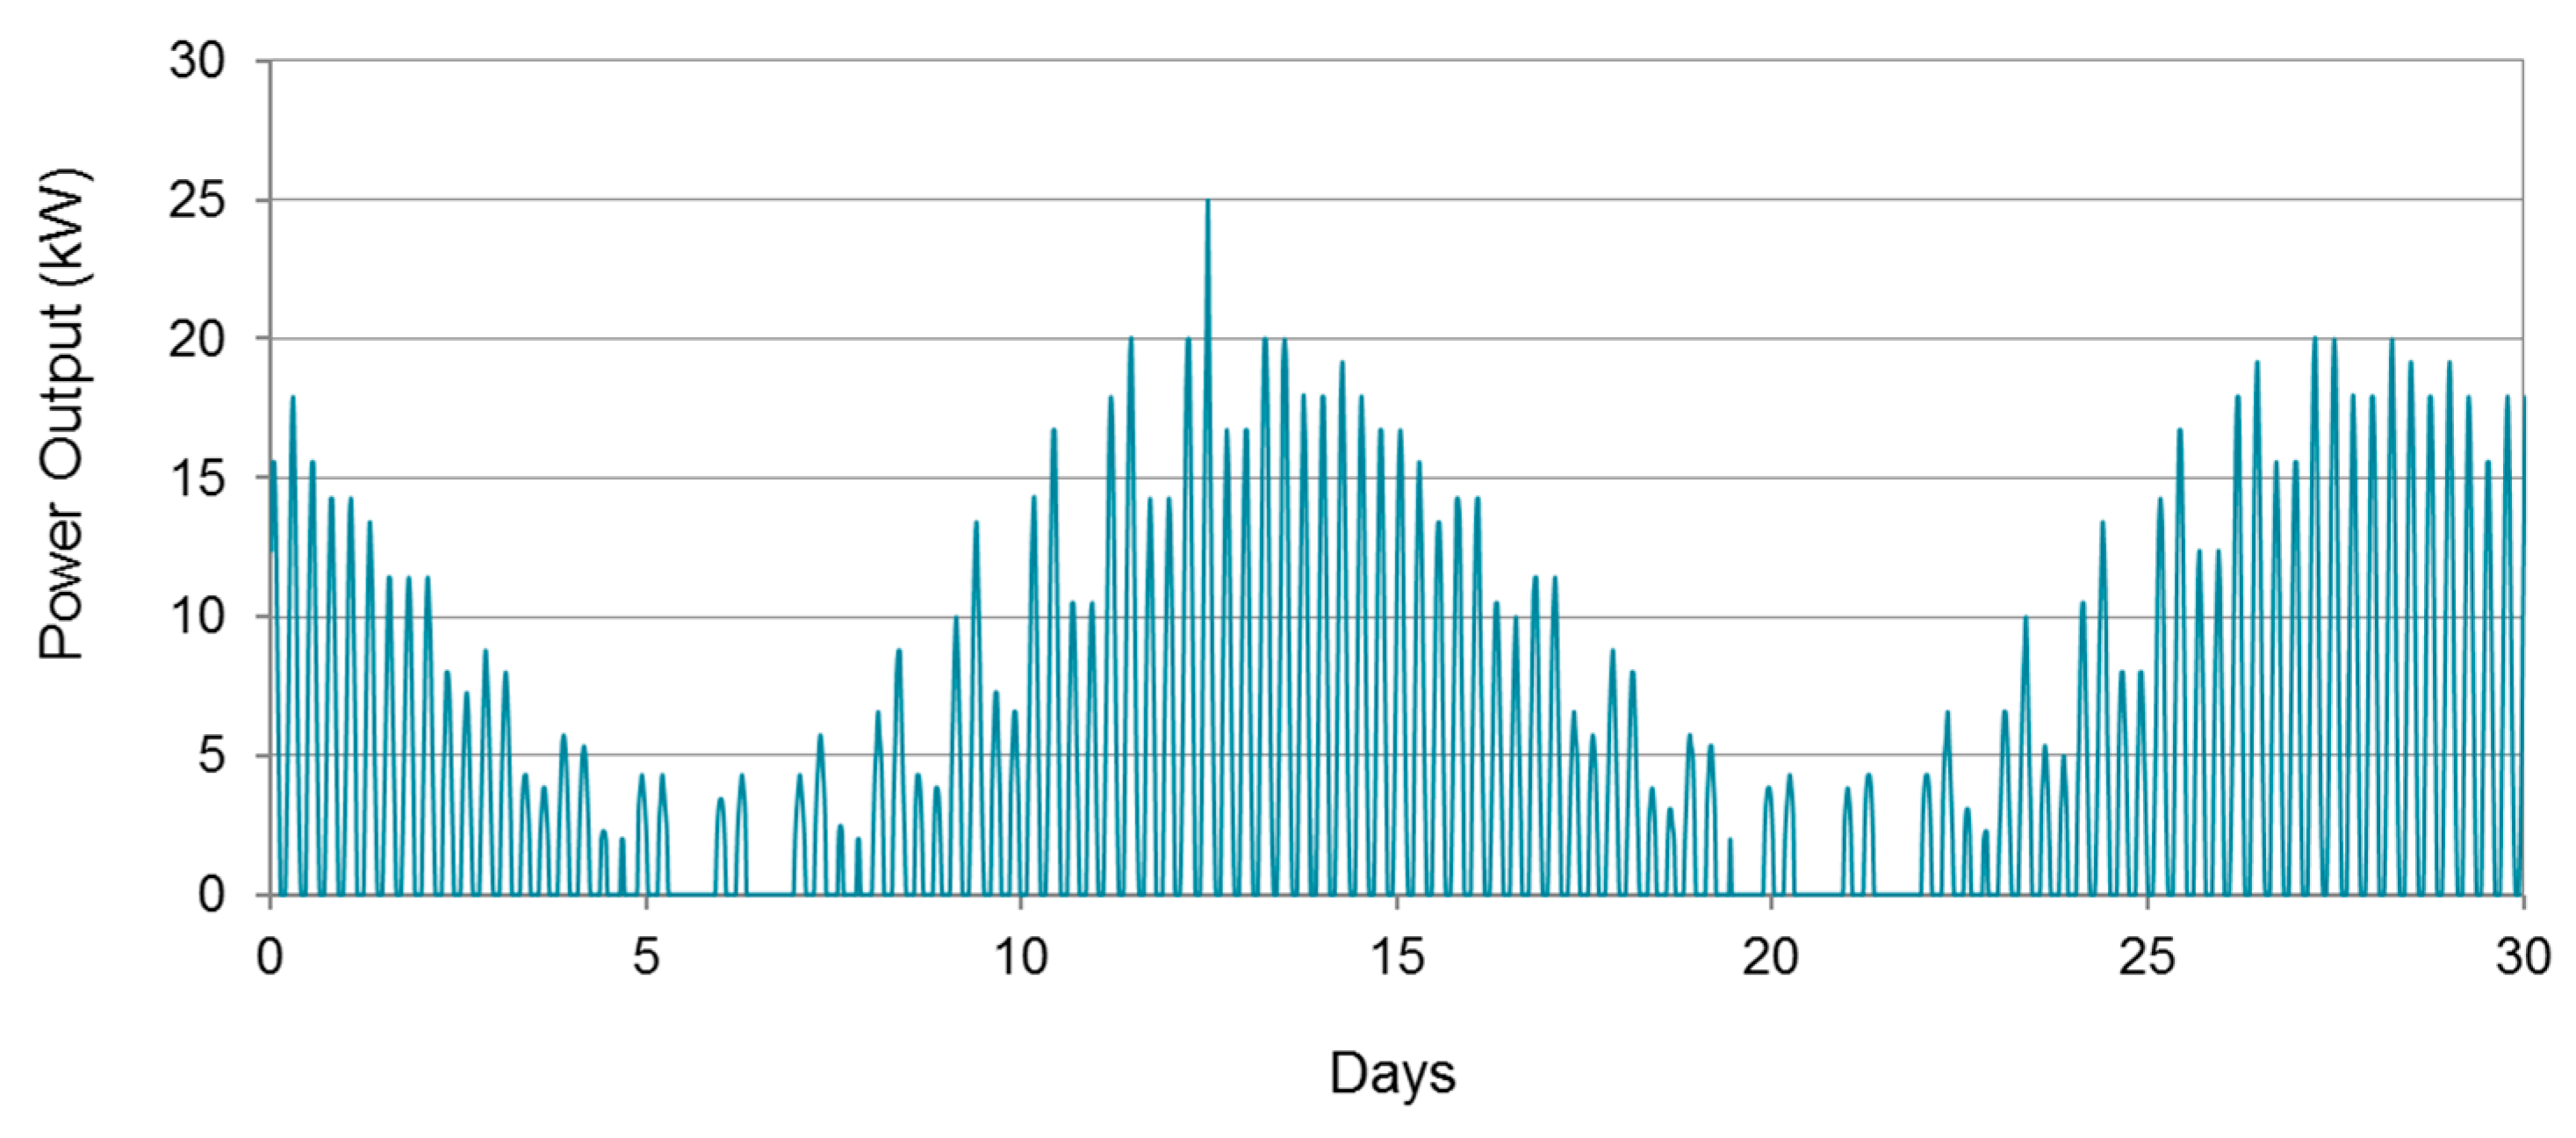
Figure 12.
Average tidal power generation as a function of the water height “b”: the y-axis shows the value of obtained from (4) normalized with respect to the value of obtained from (1).
Figure 12.
Average tidal power generation as a function of the water height “b”: the y-axis shows the value of obtained from (4) normalized with respect to the value of obtained from (1).

Figure 13.
Two possible configurations for a two-basin tidal power generating system; (a) water is allowed to flow between the two basins; (b) water is allowed to flow only between each basin and the sea.
Figure 13.
Two possible configurations for a two-basin tidal power generating system; (a) water is allowed to flow between the two basins; (b) water is allowed to flow only between each basin and the sea.

Figure 14.
Tidal energy generation mechanism for the system shown in Figure 13a. The continuous blue arrows indicate the direction of gravity-driven water flow, the dotted green arrows indicate the direction of pumped water flow. The turbines generate power at all stages. Adapted from [26]. (a) generation at high tide; (b) generation at ebb tide; (c) generation at low tide; (d) generation at flood tide
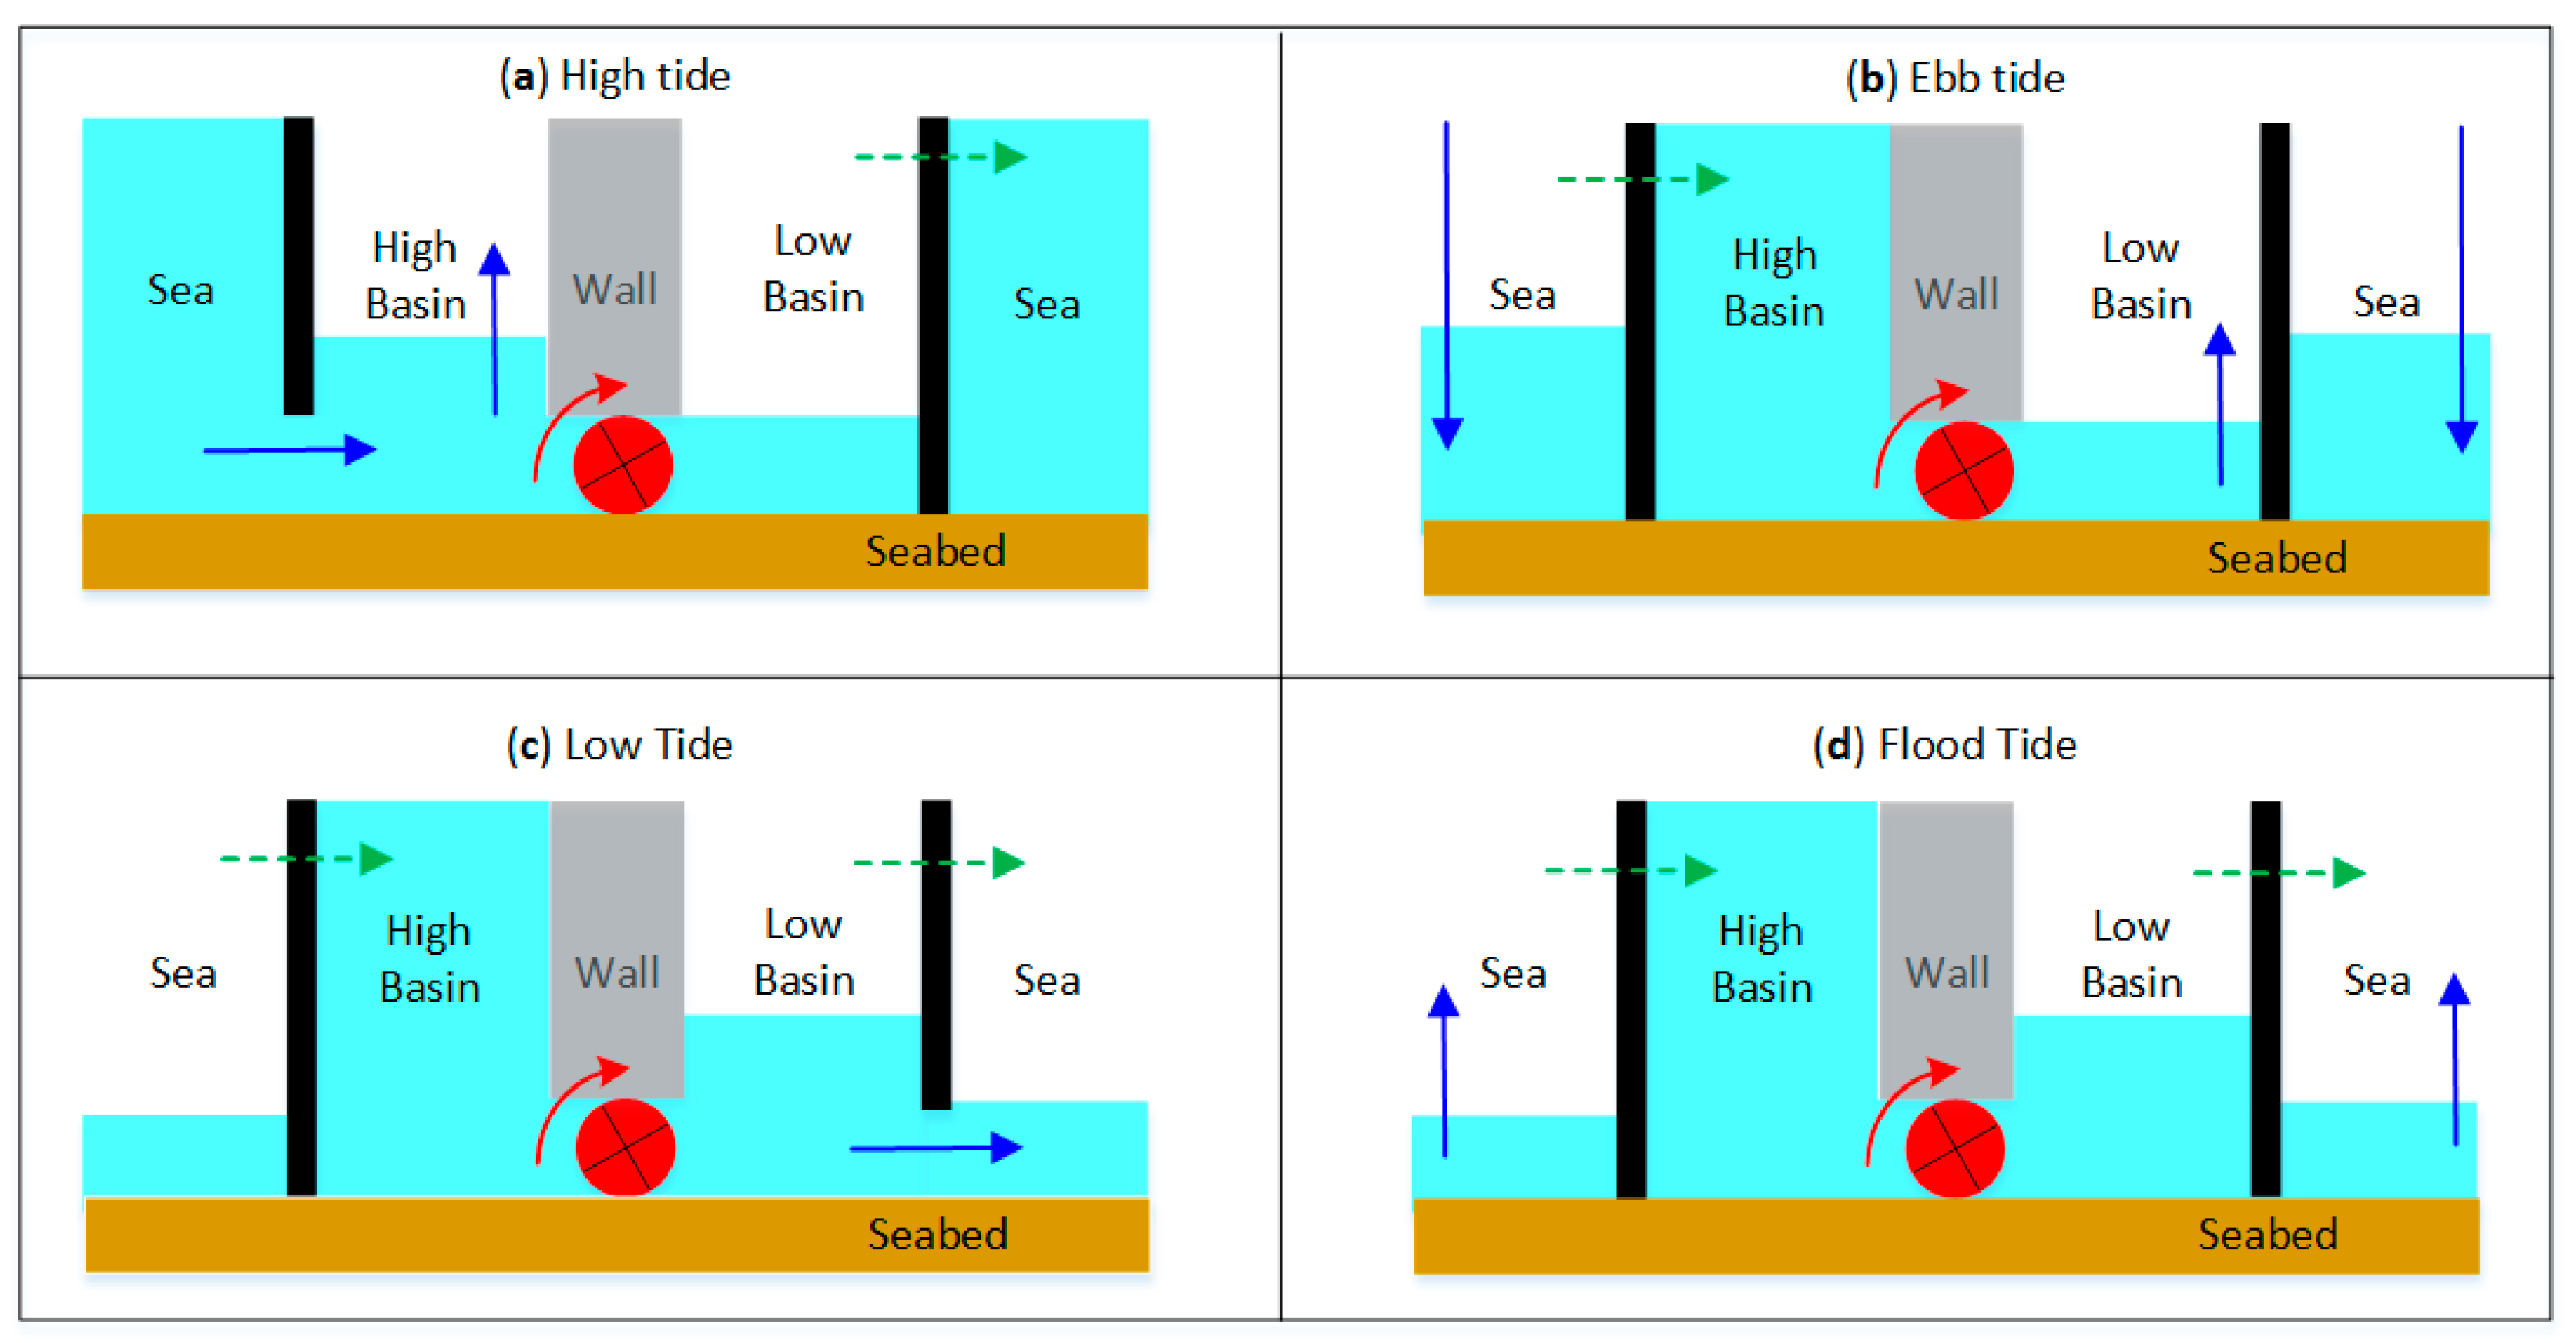
Figure 15.
Typical power generation curves for a solar panel in the UK on a cloudless day; adapted from [60].
Figure 15.
Typical power generation curves for a solar panel in the UK on a cloudless day; adapted from [60].
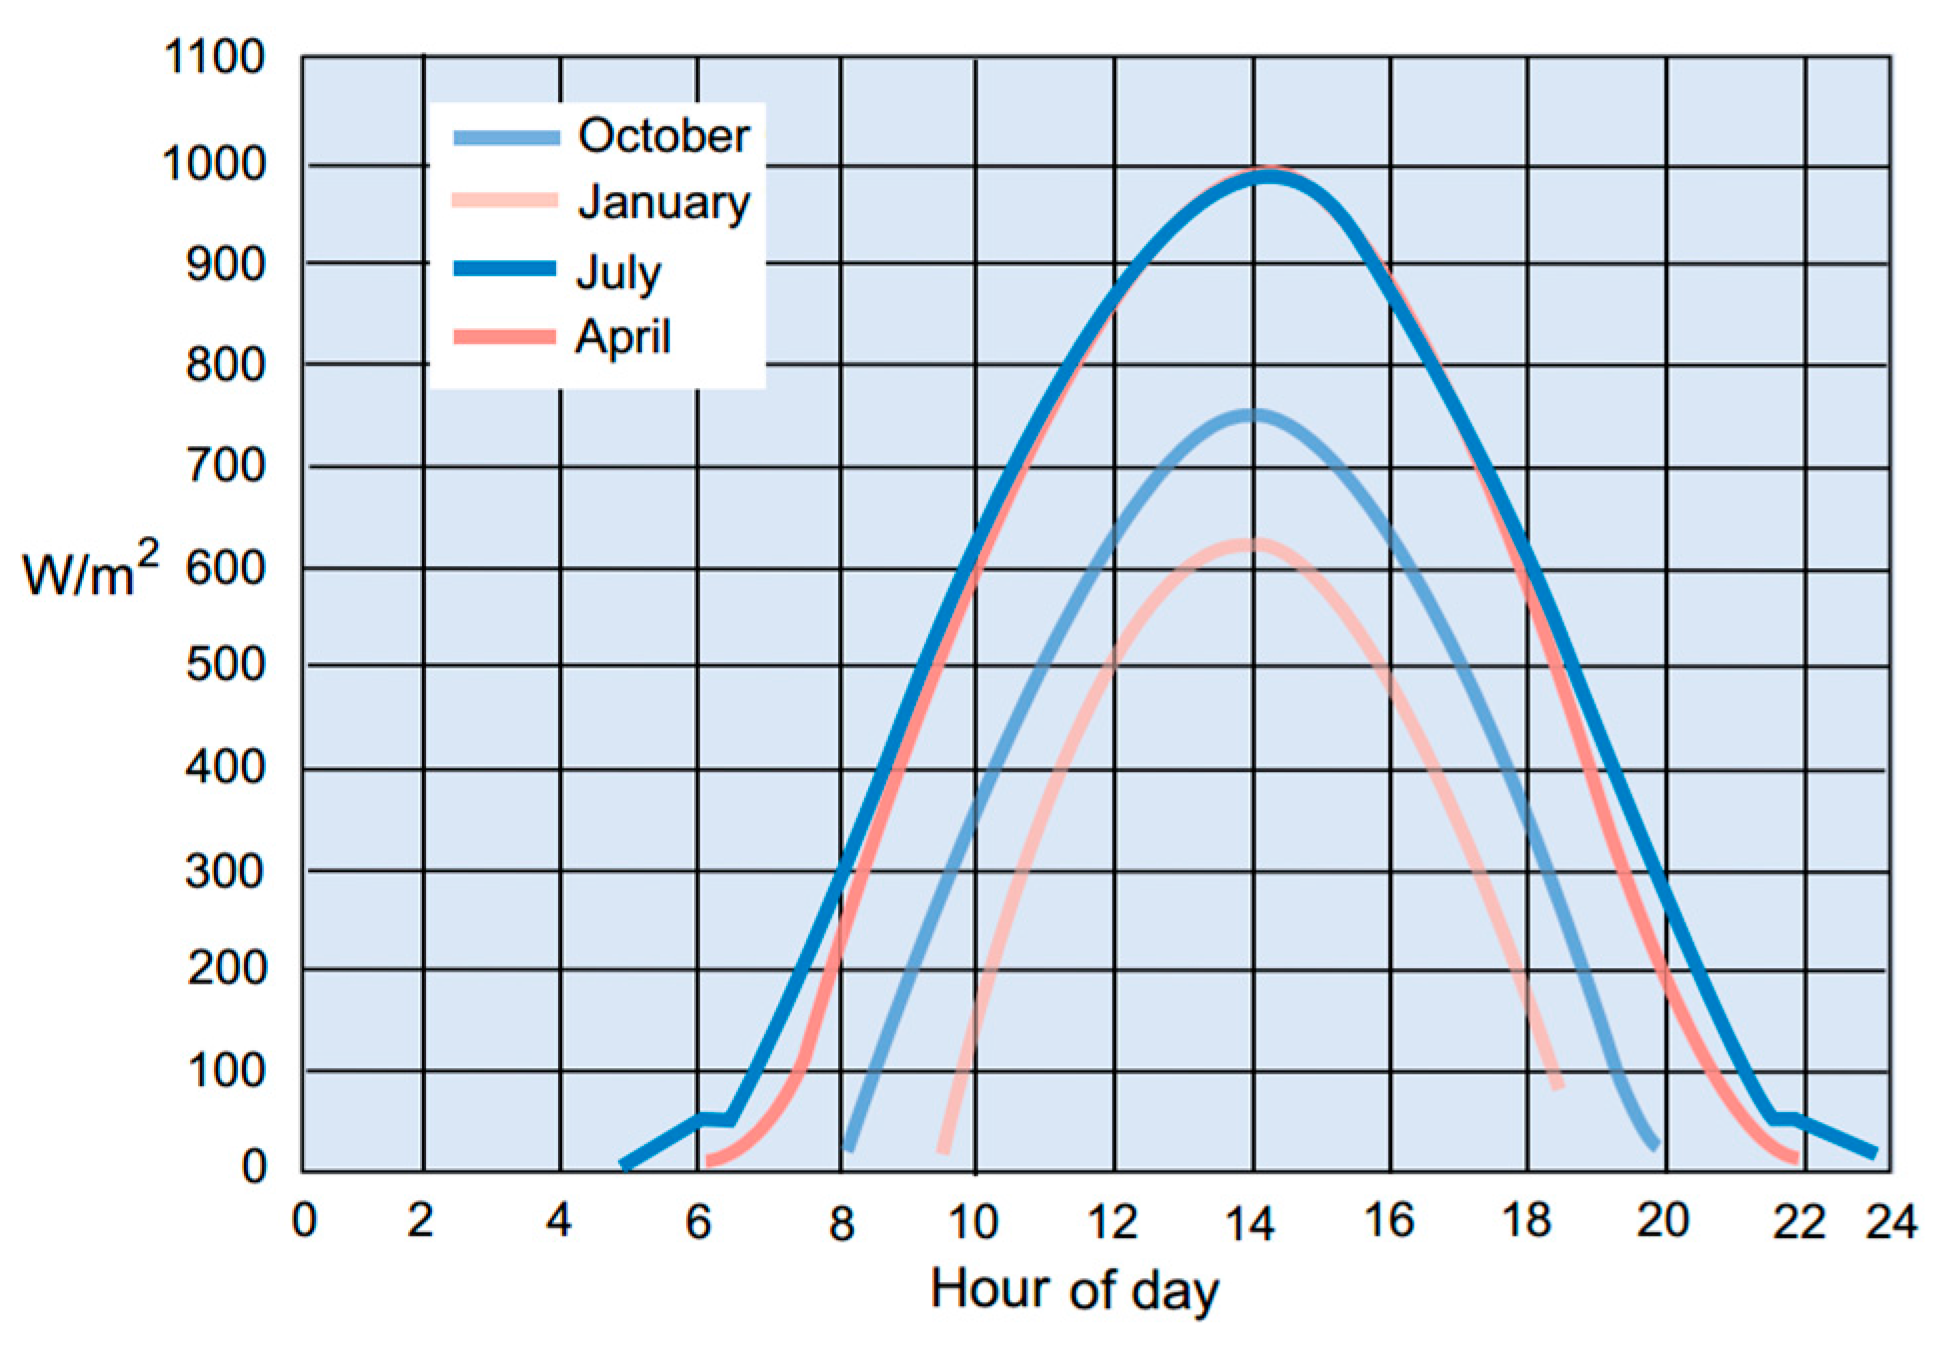
Figure 16.
Typical monthly energy generation for a solar panel in the UK; adapted from [60].
Figure 16.
Typical monthly energy generation for a solar panel in the UK; adapted from [60].

Figure 17.
Wind power generated on three consecutive days in the UK. Data retrieved from [61].
Figure 17.
Wind power generated on three consecutive days in the UK. Data retrieved from [61].

Figure 18.
Wind energy generated monthly in the UK between January 2013 and April 2017. Data retrieved from [61].
Figure 18.
Wind energy generated monthly in the UK between January 2013 and April 2017. Data retrieved from [61].
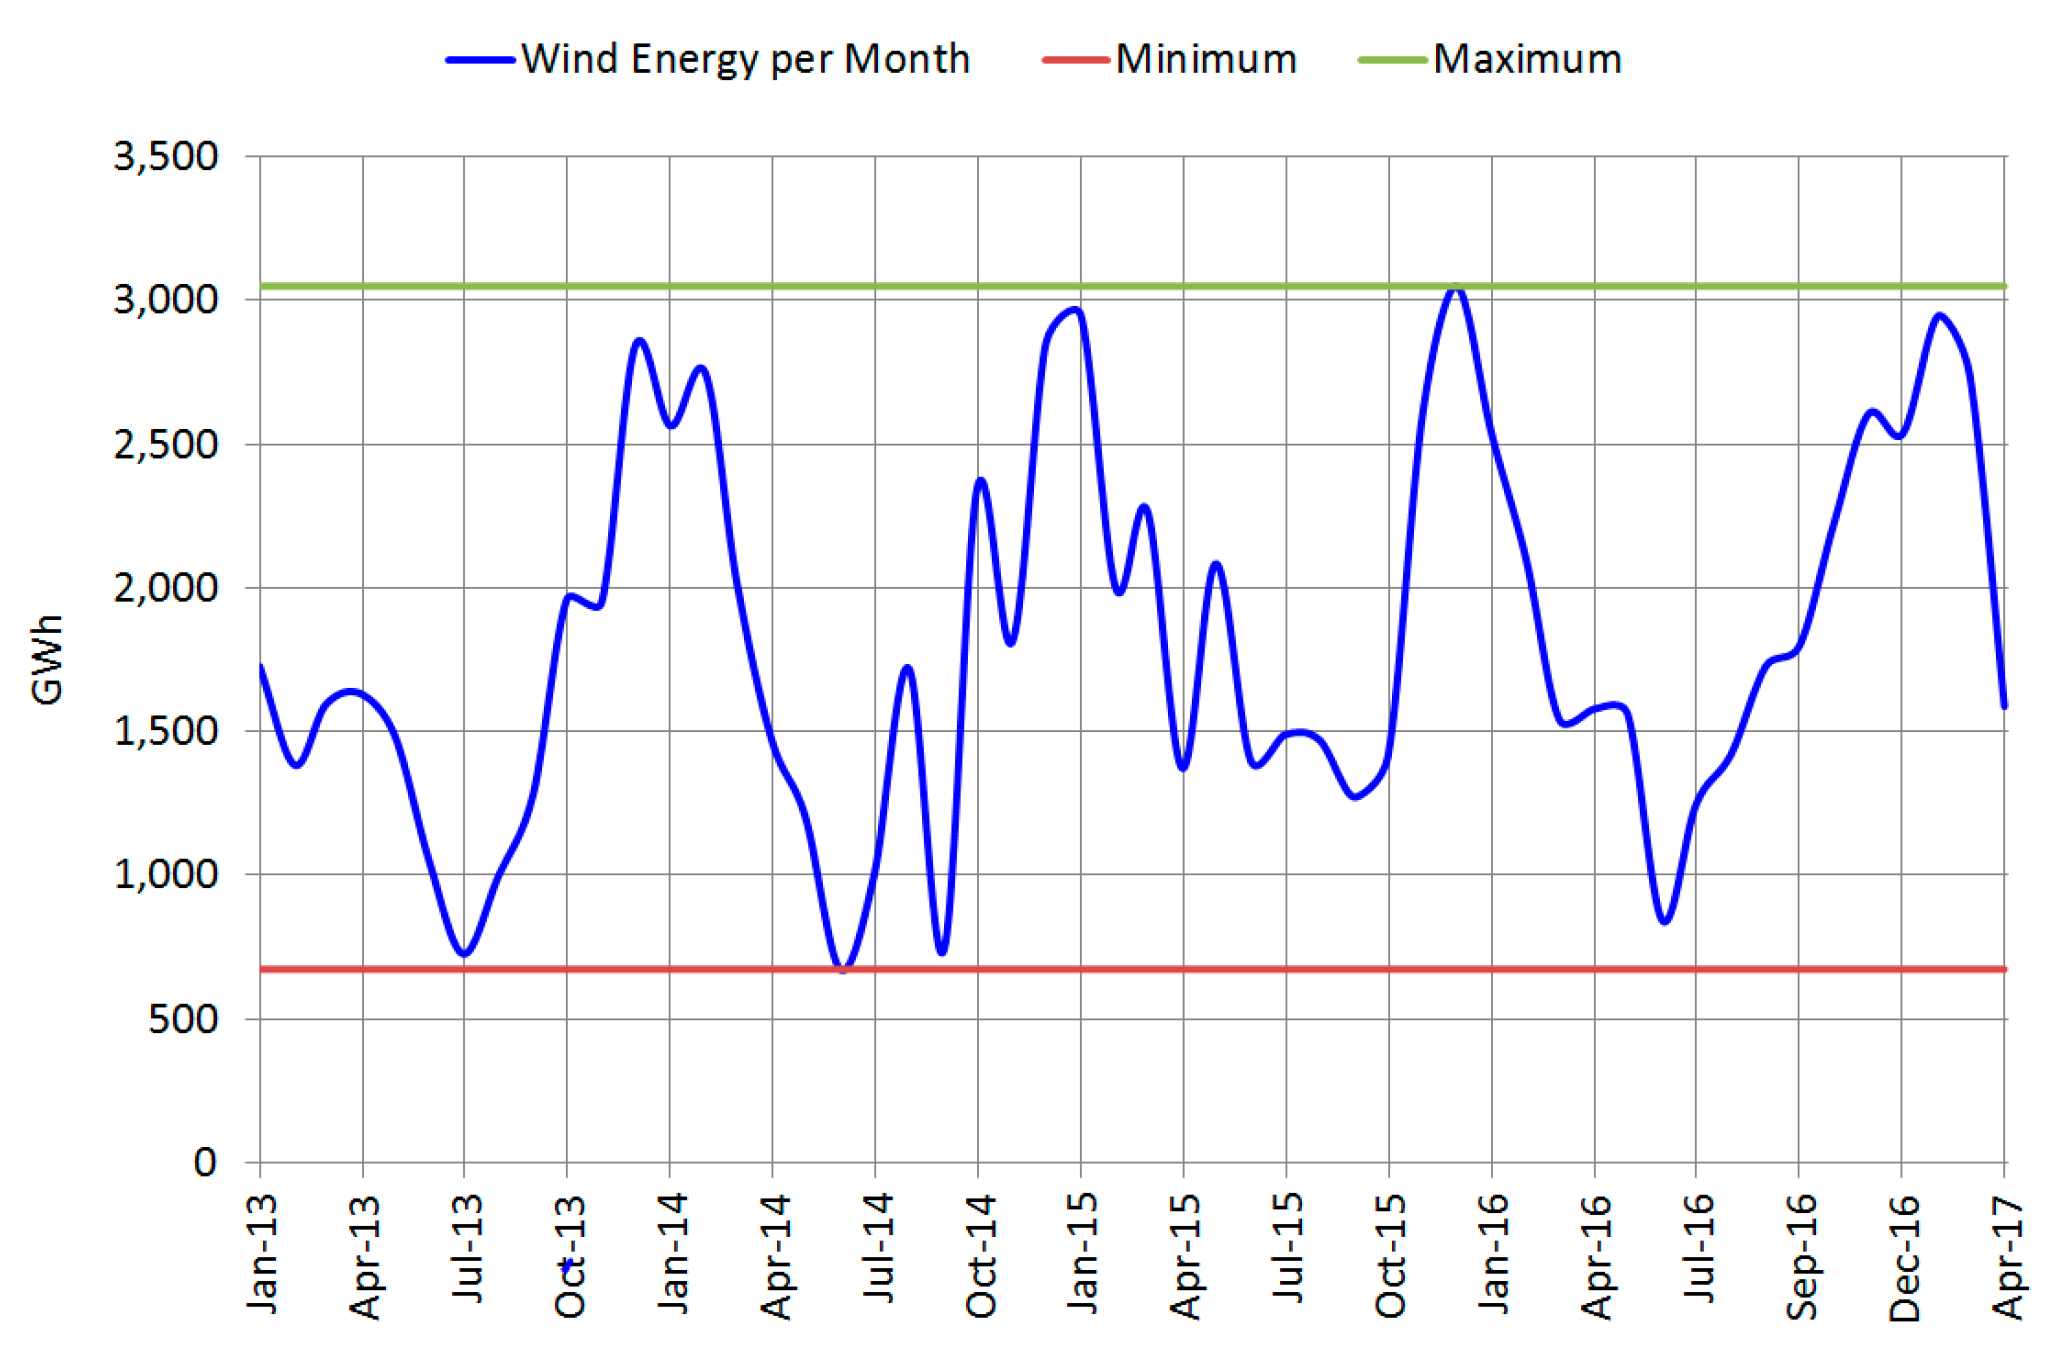
Figure 19.
Daily energy generation in the UK by source, April 2017. Data retrieved from [61].
Figure 19.
Daily energy generation in the UK by source, April 2017. Data retrieved from [61].
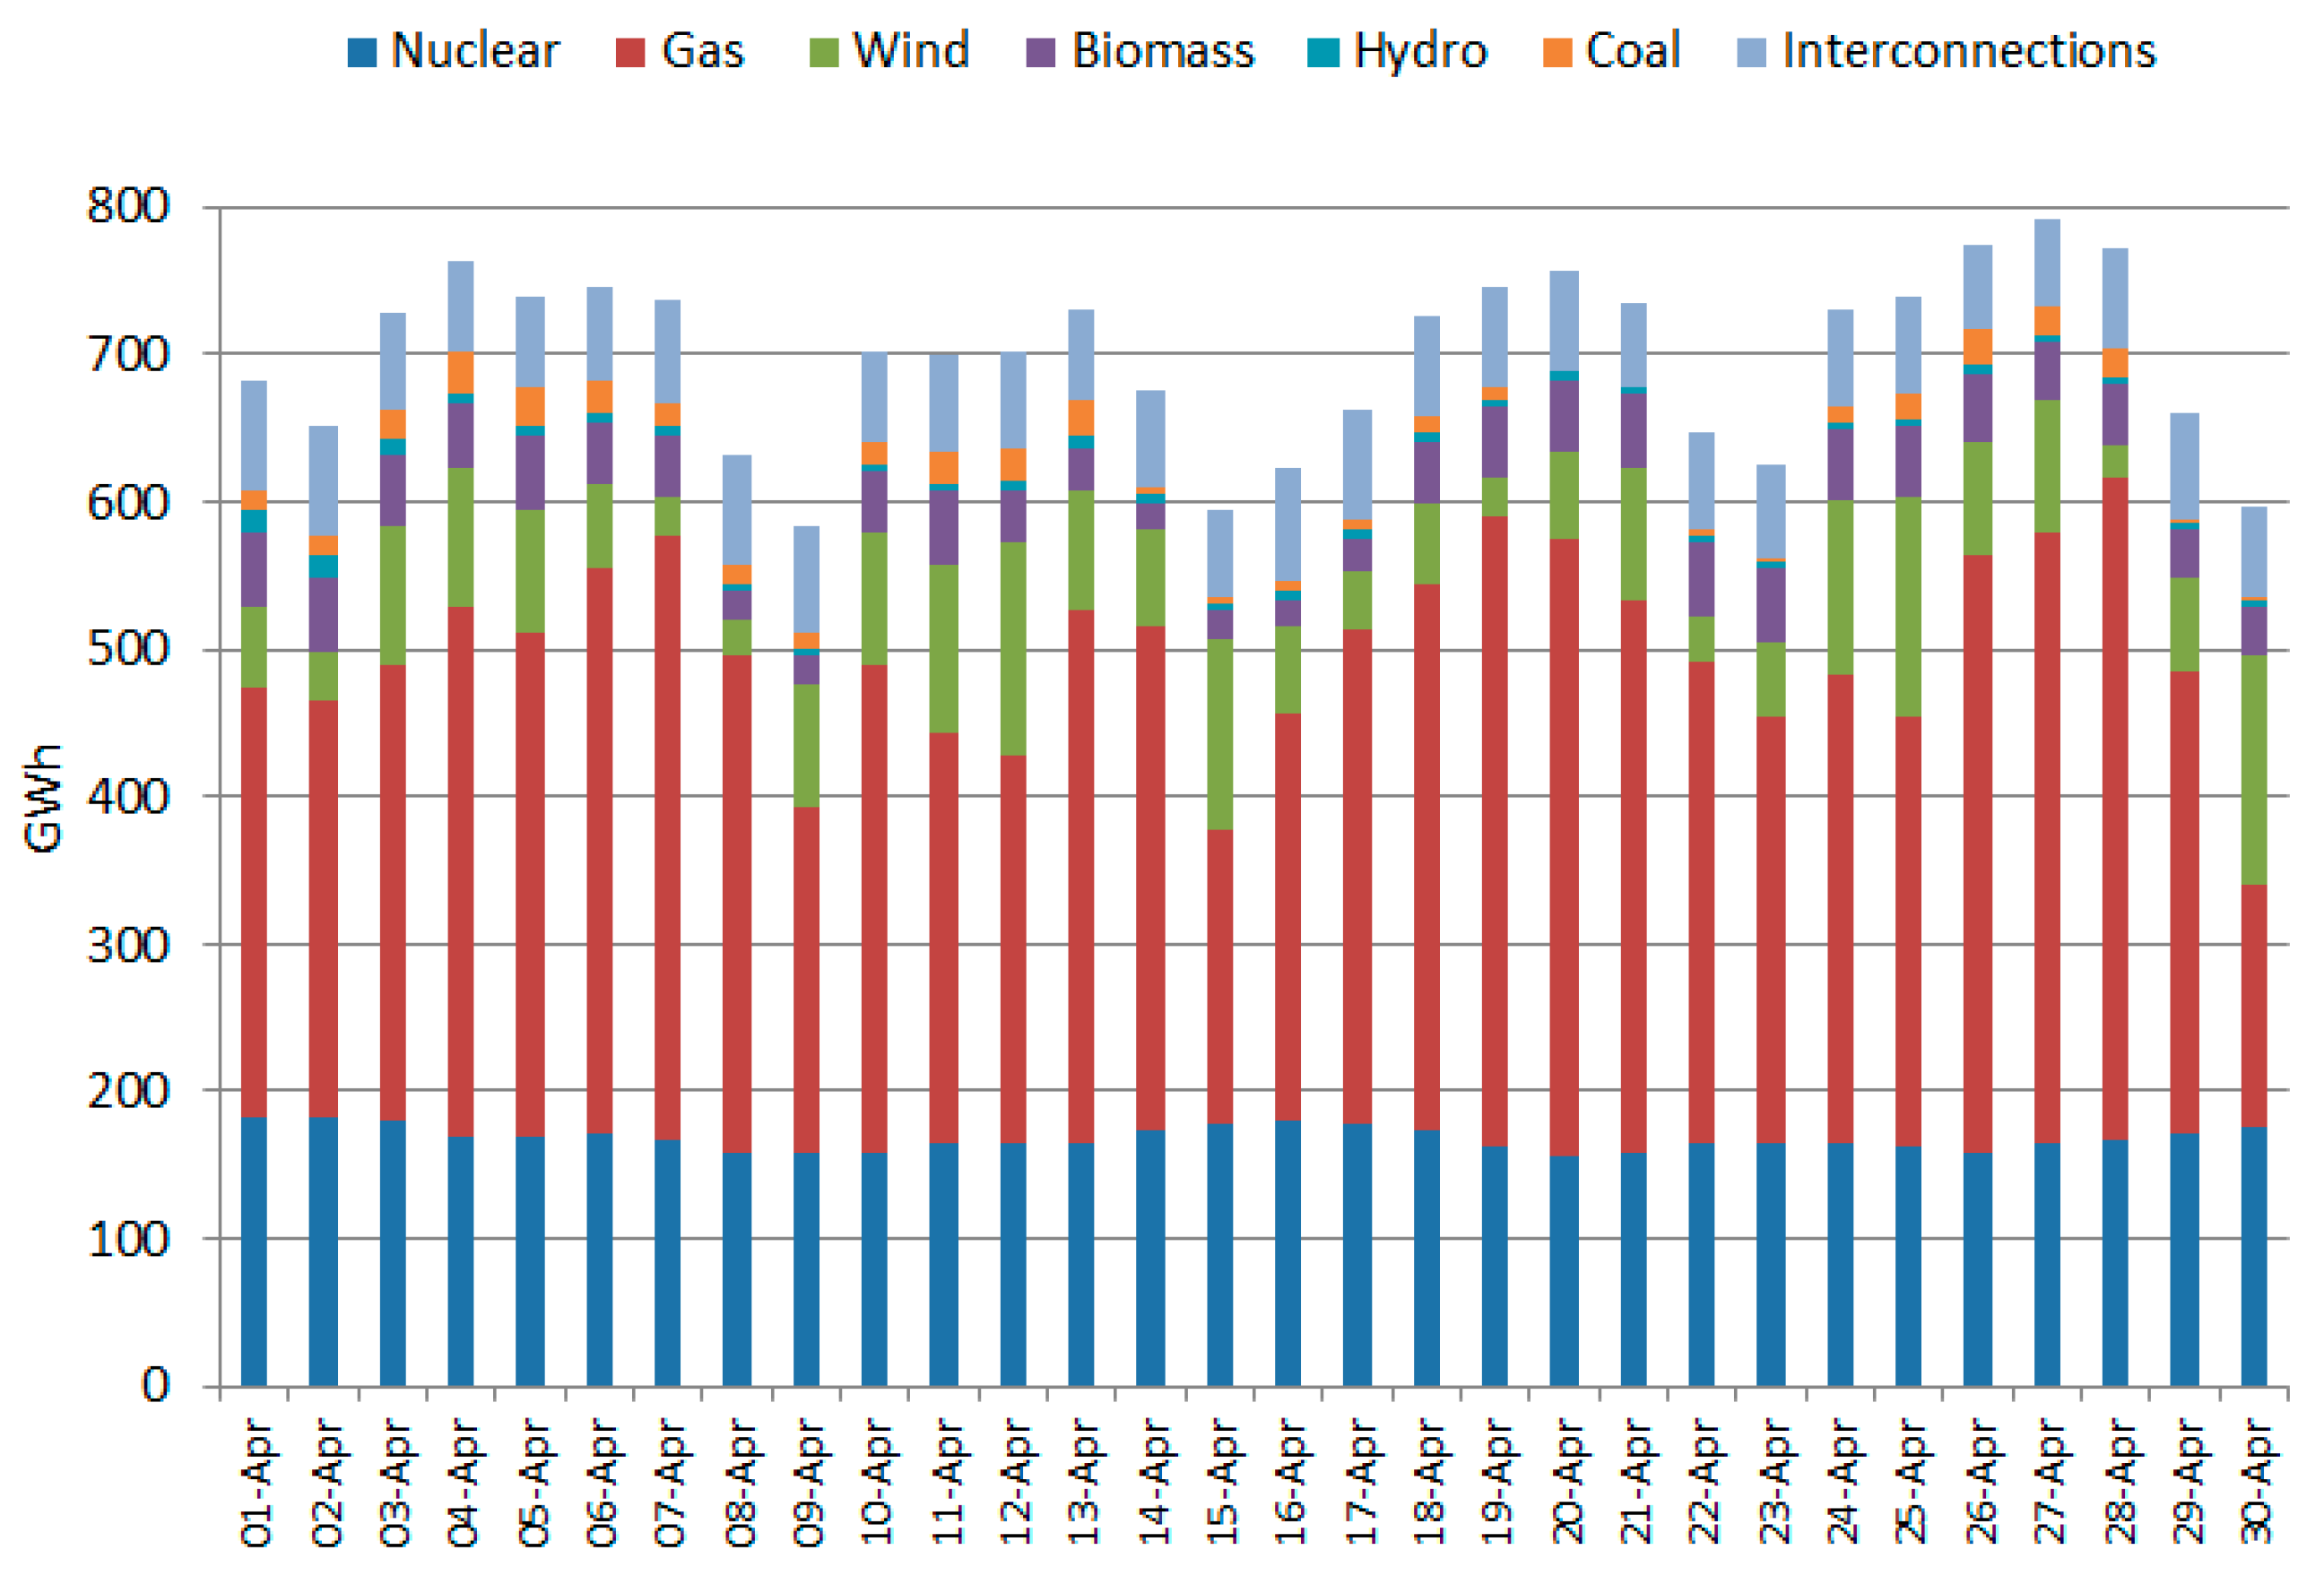
Figure 20.
Estimated daily energy generation for the Swansea Tidal Lagoon, based on 2017 tidal data reported in [67].
Figure 20.
Estimated daily energy generation for the Swansea Tidal Lagoon, based on 2017 tidal data reported in [67].

Figure 21.
Modification of the energy generation pattern in the UK by source, taking into account tidal generation. It is assumed that all power generated by the tidal lagoons can be dispatched (no curtailment is applied).
Figure 21.
Modification of the energy generation pattern in the UK by source, taking into account tidal generation. It is assumed that all power generated by the tidal lagoons can be dispatched (no curtailment is applied).

Figure 22.
Current and projected installed power output (in GW) per generation technology, for the UK energy transmission system. Data extracted from [19,71].


Table 1.
Variability of different renewable energy sources; adapted from [62].
Table 1.
Variability of different renewable energy sources; adapted from [62].
| Resource | Annual | Hourly |
|---|---|---|
| Wind | Low | High |
| Solar | High | Medium |
| Tidal | Low | High |
© 2017 by the author. Licensee MDPI, Basel, Switzerland. This article is an open access article distributed under the terms and conditions of the Creative Commons Attribution (CC BY) license (http://creativecommons.org/licenses/by/4.0/).
Share and Cite
MDPI and ACS Style
Todeschini, G. Review of Tidal Lagoon Technology and Opportunities for Integration within the UK Energy System. Inventions 2017, 2, 14. https://doi.org/10.3390/inventions2030014
AMA Style
Todeschini G. Review of Tidal Lagoon Technology and Opportunities for Integration within the UK Energy System. Inventions. 2017; 2(3):14. https://doi.org/10.3390/inventions2030014
Chicago/Turabian StyleTodeschini, Grazia. 2017. "Review of Tidal Lagoon Technology and Opportunities for Integration within the UK Energy System" Inventions 2, no. 3: 14. https://doi.org/10.3390/inventions2030014