How May Location Analytics Be Used to Enhance the Reliability of the Smart Grid?

Center for Information Systems & Technology, Claremont Graduate University, Claremont, CA 91711, USA
*
Author to whom correspondence should be addressed.
Inventions 2019, 4(3), 39; https://doi.org/10.3390/inventions4030039
Submission received: 6 July 2019
/
Revised: 23 July 2019
/
Accepted: 31 July 2019
/
Published: 2 August 2019
(This article belongs to the Special Issue Modeling, Planning and Optimal Management of Mini/Micro-Grid in Presence of Distributed Energy Resources)
Abstract
:The United States (U.S.) electric infrastructure urgently needs renovation, as highlighted by recent major outages in California, New York, Texas, and Florida. The media has discussed the aging power infrastructure, and the Public Utilities Commission called for a comprehensive review of the causes of recent power outages. Without optimization algorithms to account for the many operating parameters and outage scenarios, planning engineers may inadvertently choose non-optimal locations for new components such as automated distribution switches, thereby impacting circuit reliability. This study aims to address this problem by answering the research question: “How may location analytics should be used to enhance the reliability of the smart grid?” To address this problem, Insights for ArcGIS was used to build worksheets using a geographic information systems (GIS)-based approach to resolve the challenges faced by utilities to reduce power outage frequency. Three case studies demonstrate various risk scenarios wherein a utility can prepare for the unexpected. An artefact in Insights for ArcGIS was created using a design science research methodology. This research proposes a solution to facilitate storm/disaster planning and vegetation management, identify optimal grid locations needing inspection or work, and detect regions where new distribution switches may provide benefits, considering the many operating parameters and outage scenarios. The artefact demonstrates that GIS can play an integral role in resolving this problem.
1. Introduction and Problem Definition
Due to the rapidly changing nature of energy generation, grid-reliability research has been unable to keep pace with new developments in the electric-power network, the incorporation of distributed energy resources into the grid, and circuit and equipment overloads. Several sources have offered definitions of the reliability of the grid. The North American Electric Reliability Corporation defined reliability as “the degree to which the performances of the elements of the electric system result in power being delivered to consumers within accepted standards and in the amount desired” [1]. Osborn and Kawann viewed reliability as “the ability of the power system components to deliver electricity to all points of consumption, in the quantity and with the quality demanded by the customer” [2]. Reliability is measured by outage indices, as illustrated by the Institute of Electrical and Electronics Engineers (IEEE) Standard 1366. In this manuscript, we define reliability as “the ability of the electric grid to deliver electricity to customers without degradation or failure” [3].
Grid-reliability research aims to address challenges and remove barriers to integrating high penetrations of distributed energy generation at the transmission and distribution levels [4]. The Department of Energy (DOE) recently released its electric-grid reliability study, recommending research prioritization of the development of grid resiliency and reliability [5]. Additionally, in the same month, the DOE OE announced an initial investment of nearly $900,000 to address the risk and uncertainty of power systems, enabling academic research in three United States (U.S.) states [6]. The intent of this research is to advance smart grid reliability through the use of location analytics.
The placement of a new automated distribution switch has long-term impacts on the reliability of the circuit in which it is installed [7]. Common placement strategies rely on manual processes and the planning engineer’s inherited knowledge regarding the configuration, past reliability performance, future load growth, planned distributed-energy resources, and other protection-related schemes of the circuit being analyzed to select a new switch location [8]. Without optimization algorithms to account for the many operating parameters and outage scenarios, the planning engineer may select a non-optimal location. Based on personal interviews with experienced utility-industry consultants, non-optimal placement may lead to low reliability and adversely affect customer satisfaction [9,10].
The objective of this study was to instantiate or create a real instance of an abstraction [11], a geographic information systems (GIS) model, and an analysis framework developed in previous research by this article’s authors. Therefore, the solution offered in this paper could lead to a GIS-based application prototype to identify optimal grid locations for inspection or infrastructure work and detect where new components may optimally provide net benefits to the grid.
The Environmental Systems Research Institute [12] defines GIS as a class of tools for collecting, storing, analyzing, and demonstrating data in relation to their positions on the Earth’s surface. Analysts use GIS to view different objects’ locations and study their relationships. Satellite and tabular data can be entered into GIS for a single map display. GIS applications include recognizing site locations, mapping topographies, and developing analytical models to forecast events [12].
Although predictive modeling has existed since the inception of statistics, the penetration of GIS has fostered a new approach to forecasting and data analytics. Predictive modeling is a process to determine a mathematical relationship between two or more variables [13]. Future-dependent variables can be derived if their relationships to independent variables become known. Predictive modeling with GIS has been applied in such sectors as public health [14] and public-works asset management [15]. GIS is not limited to any specific field; it is only restricted by the availability of geospatial data.
GIS can be a catalyst to improve the multiple facets of smart grids. For instance, Resch et al. [16] integrated GIS modeling into the energy system to address renewable-energy infrastructure planning. Sultan and Bitar [17] used GIS to optimize locations of such distributed-energy resources as solar panels. Similarly, Sultan et al. [18] investigated power-grid reliability incidents and power outages and their correlation with infrastructure age using GIS modeling. Based on previous research [17,18], it is posited GIS can highlight optimal locations for components of electric power networks including new automated distribution switches. For this research, an artefact was designed, which forms a GIS solution that resolves the current challenges faced by utilities and thus reduces the risk of power outages.
The rest of the paper is organized as follows. The second section presents a review of the extant literature. The third section presents the study design and methodology. The fourth section describes deployment. The fifth section sums the evaluation. The sixth section is a discussion of the findings. The seventh section offers conclusions.
2. Review of the Literature
Due to a rise in electricity usage through new technologies and subsequent circuit and equipment overloads, a significant number of publications from research organizations, governmental bodies, and utility companies have focused on understanding grid reliability, causes of faults, and analyses of power-outage events. The National Academies of Sciences, Engineering, and Medicine recently published a report in response to a call by the U.S. Congress for an independent assessment to “conduct a national-level comprehensive study on the future resilience and reliability of the nation’s electric power transmission and distribution system” [19]. In addition, the National Academies of Sciences, Engineering, and Medicine established the Committee On Enhancing the Resilience of the Nation’s Electric Power Transmission and Distribution System to conduct the relevant research. Throughout their report, the committee highlighted elements of grid reliability and resilience, risks of a systemwide failure as the structure of the power industry becomes more atomized and complex, and the wide range of actions needed to improve the resilience of the U.S. power system. Analytics (machine learning, data mining, and other artificial intelligence-based techniques) will play a very important role in understanding attacks on the electric grid, grid failures, or other grid impairments, due to their ability to generate real-time recommendations [19].
Adderly examined DOE power-outage data from 2002 to 2013 and investigated reliability trends [19]. The research objective was to assess the correlation between utilities’ reliability and grid-investment projects such as the deployment of smart grid assets. Using the deployment of smart meters as a proxy for grid investments, Adderly concluded that the increase of smart meters correlated strongly with the decrease in the frequency of outages. The author acknowledged that due to the presence of confounding variables, the reduction in power outage could not be attributed to any specific smart grid investment project.
Several additional researchers attempted to understand grid reliability. Mitnick’s report prepared for the Electric Markets Research Foundation is another example of a work that explains the reasons for concern about grid reliability [20]. Mitnick suggested that the incorporation of distributed energy resources into the grid should be carefully managed to minimize grid-reliability risk. Another relevant study conducted by the Lawrence Berkeley National Laboratory [21] brought attention to the notion that reliability data trends might not improve due to the addition of smart grid technologies such as automated outage management systems that are more accurate in their data collection and, as a result, are reporting service interruptions more accurately than in the past. Since the study was based on a sample of reliability data from several utilities, the authors made no claims about overall grid reliability in the United States.
With respect to the power outage research domain, the majority of outages in the United States are the result of events that occur at the distribution side of the grid. Electrical outages have three main causes: (a) hardware and technical failures, (b) environment-related, and (c) human error [22]. Hardware and technical failures are due to equipment overload, short circuits, brownouts, and blackouts, to name a few [23,24,25]. These failures are often attributed to unmet peak usage, outdated equipment, and malfunctioning back-up power systems [22]. Environment-related causes for power outages comprise weather, wildlife, and trees that come into contact with power lines. Lightning, high winds, and ice are common weather-related power interruptions. Also, squirrels, snakes, and birds that come in contact with equipment such as transformers and fuses can cause equipment to momentarily fail or shut down completely [25]. As for the final main cause of electrical outages—human error—the Uptime Institute estimated that human error causes roughly 70% of the problems that plague data centers. Miller included hacking in the human-error category [26].
In the 2013, the DOE OE indicated that grid-reliability improvements that are built on smart grid technologies such as automated feeder switching could reduce the frequency of outages. The DOE presented no statistics to support the correlation between reliability and spending [27]. However, the study authors identified that progress had been made by utilities as a result of receiving funding from the federal government. Based on the analysis, projects with automated feeder switching were able to reduce the frequency of outages, the number of customers affected by sustained outages and by momentary interruptions, and the total amount of time customers were without power. Their analysis also highlighted that the greatest percentage of improvements in reliability from automated feeder switching occur when applied to the worst-performing feeders. Table 1 recapitulates the changes in the major reliability indices due primarily to automated feeder switching, based on measured results from the summer and winter periods of 1 April 2011 through 31 March 2012 [27].
3. Study Design and Methodology
The artefact/solution uses a design science research (DSR) methodology. DSR was conceived by Walls, Widmeyer, and El Sawy [28], who laid the foundations and arguments for DSR in behavior-centric information-systems research. March and Smith [29] elucidated DSR further by separating natural science from design science. A decade later, DSR became integrated into the fabric of information systems research through several seminal publications [11,30,31,32,33].
Every DSR project needs a design principle as guidance. For this study, the principles outlined in Peffers et al. [33] were used for this guidance. These principles, collectively titled the DSR method, were also used as a basis for a study by Gregor and Hevner [30]. Figure 1 depicts the DSR method.
3.1. Design Principle
The DSR method includes six activities. These activities interact sequentially. In addition, iteration through one or more activities is likely. The DSR method includes four possible entry points that indicate how a DSR project would start.
3.2. Possible Entry Points
Peffers et al. [33] identified four entry points—(1) problem-centered initiation, (2) objective-centered solution initiation, (3) design and development-centered initiation, and (4) client/context initiation—and provided four case studies to demonstrate how each entry point works. Practically, researchers may start their research endeavors using any of these entry points.
The entry point for this research is classified as an objective-centered solution initiation. As noted above, the objective in this research was to advance smart grid reliability through location analytics. Due to the new developments in the electric power network, the incorporation of distributed-energy resources into the grid, and circuit and equipment overloads, grid reliability research has been unable to keep pace. Power outages can be especially tragic when involving life-support systems in hospitals and nursing homes or systems in such synchronization facilities as airports, train stations, and traffic control. According to LaCommare and Eto [34], the economic cost of power interruptions to U.S. electricity consumers is $79 billion annually in damages and lost economic activity. These facts highlight the need to investigate grid reliability.
3.3. Process Guiding Design
In conjunction with the design principle elucidated in the previous section, this research used the process steps in Takeda, Veerkamp, and Yoshikawa’s [35] design cycle to create an artefact/solution. This cycle has five simple steps: awareness of the problem, suggestion, development, evaluation, and conclusion. The Takeda et al. design cycle demonstrates how DSR has been embraced as a research paradigm for information systems research projects [11]. Three iterations of the DSR cycle (relevance, design, and rigor [31]), were used to perform each of the Takeda et al. process steps leading to this paper’s final prototype.
This study was designed to address the following question: “How may location analytics be used to enhance the reliability of the Smart Grid?” To answer this research question, a GIS-based application was proposed to address storm/disaster planning and vegetation management, identify grid locations for inspection or infrastructure work, and locate areas for the installation of new distribution switches.
A scenario-based methodology was used to evaluate the proposed solution. Segawa, Sugimura, and Ishigaki [36] highlighted the potential of scenario-based assessment; breaking down the scenario into steps of actions and then assessing each actions taken allows for a robust end-user evaluation. To complete the evaluation, we elicited opinions from industry experts regarding the applicability and usefulness of the solution.
4. Deployment
According to Environmental Systems Research Institute (ESRI) [37], Insights for ArcGIS has transformed how we traditionally performed spatial analysis. It is a web-based, data-analytics application with the capability to work with interactive maps and charts simultaneously.
In this research, three case studies were developed to demonstrate various risk scenarios/challenges that entail a utility company taking action and preparing for the unexpected.
4.1. Utilities Case Studies
4.1.1. Challenge 1—Storm Scenario
Strong winds, heavy rain, and storm surge have the potential to cause extreme damage and dangerous flooding. Electric companies in the path of a storm should be taking steps to prepare, activate their emergency response plans, mobilize restoration workers, stage equipment, and coordinate response efforts with federal, state, and local government officials. Personnel, including linemen and damage assessors, should be ready to respond quickly to power outages, should they occur. Having additional resources on standby and ready for deployment is essential to restoring power to customers.
In this scenario, the National Weather Service has issued a Red Flag Warning for the region, cautioning extreme risk from a storm. The challenge the utility is trying to respond to is: “Where should we preposition workers, and equipment in preparation for the storm?”
4.1.2. Challenge 2—Vegetation Scenario
Utility systems are negatively impacted by storms, trees, squirrels, fires, and firearms. California had a particularly bad year in 2018 for outages and their resultant wildfires. Regulators struck back against utility companies, imposing tens of millions of dollars in fines related to wildfires, including $37 million for the 2007 Malibu fire; $14.4 million for the Witch, Rice, and Guejito fires in the same year; and $8.3 million for the 2015 Butte Fire [38]. One issue is that the grid has many poles and wires that are vulnerable to falling trees and flying debris.
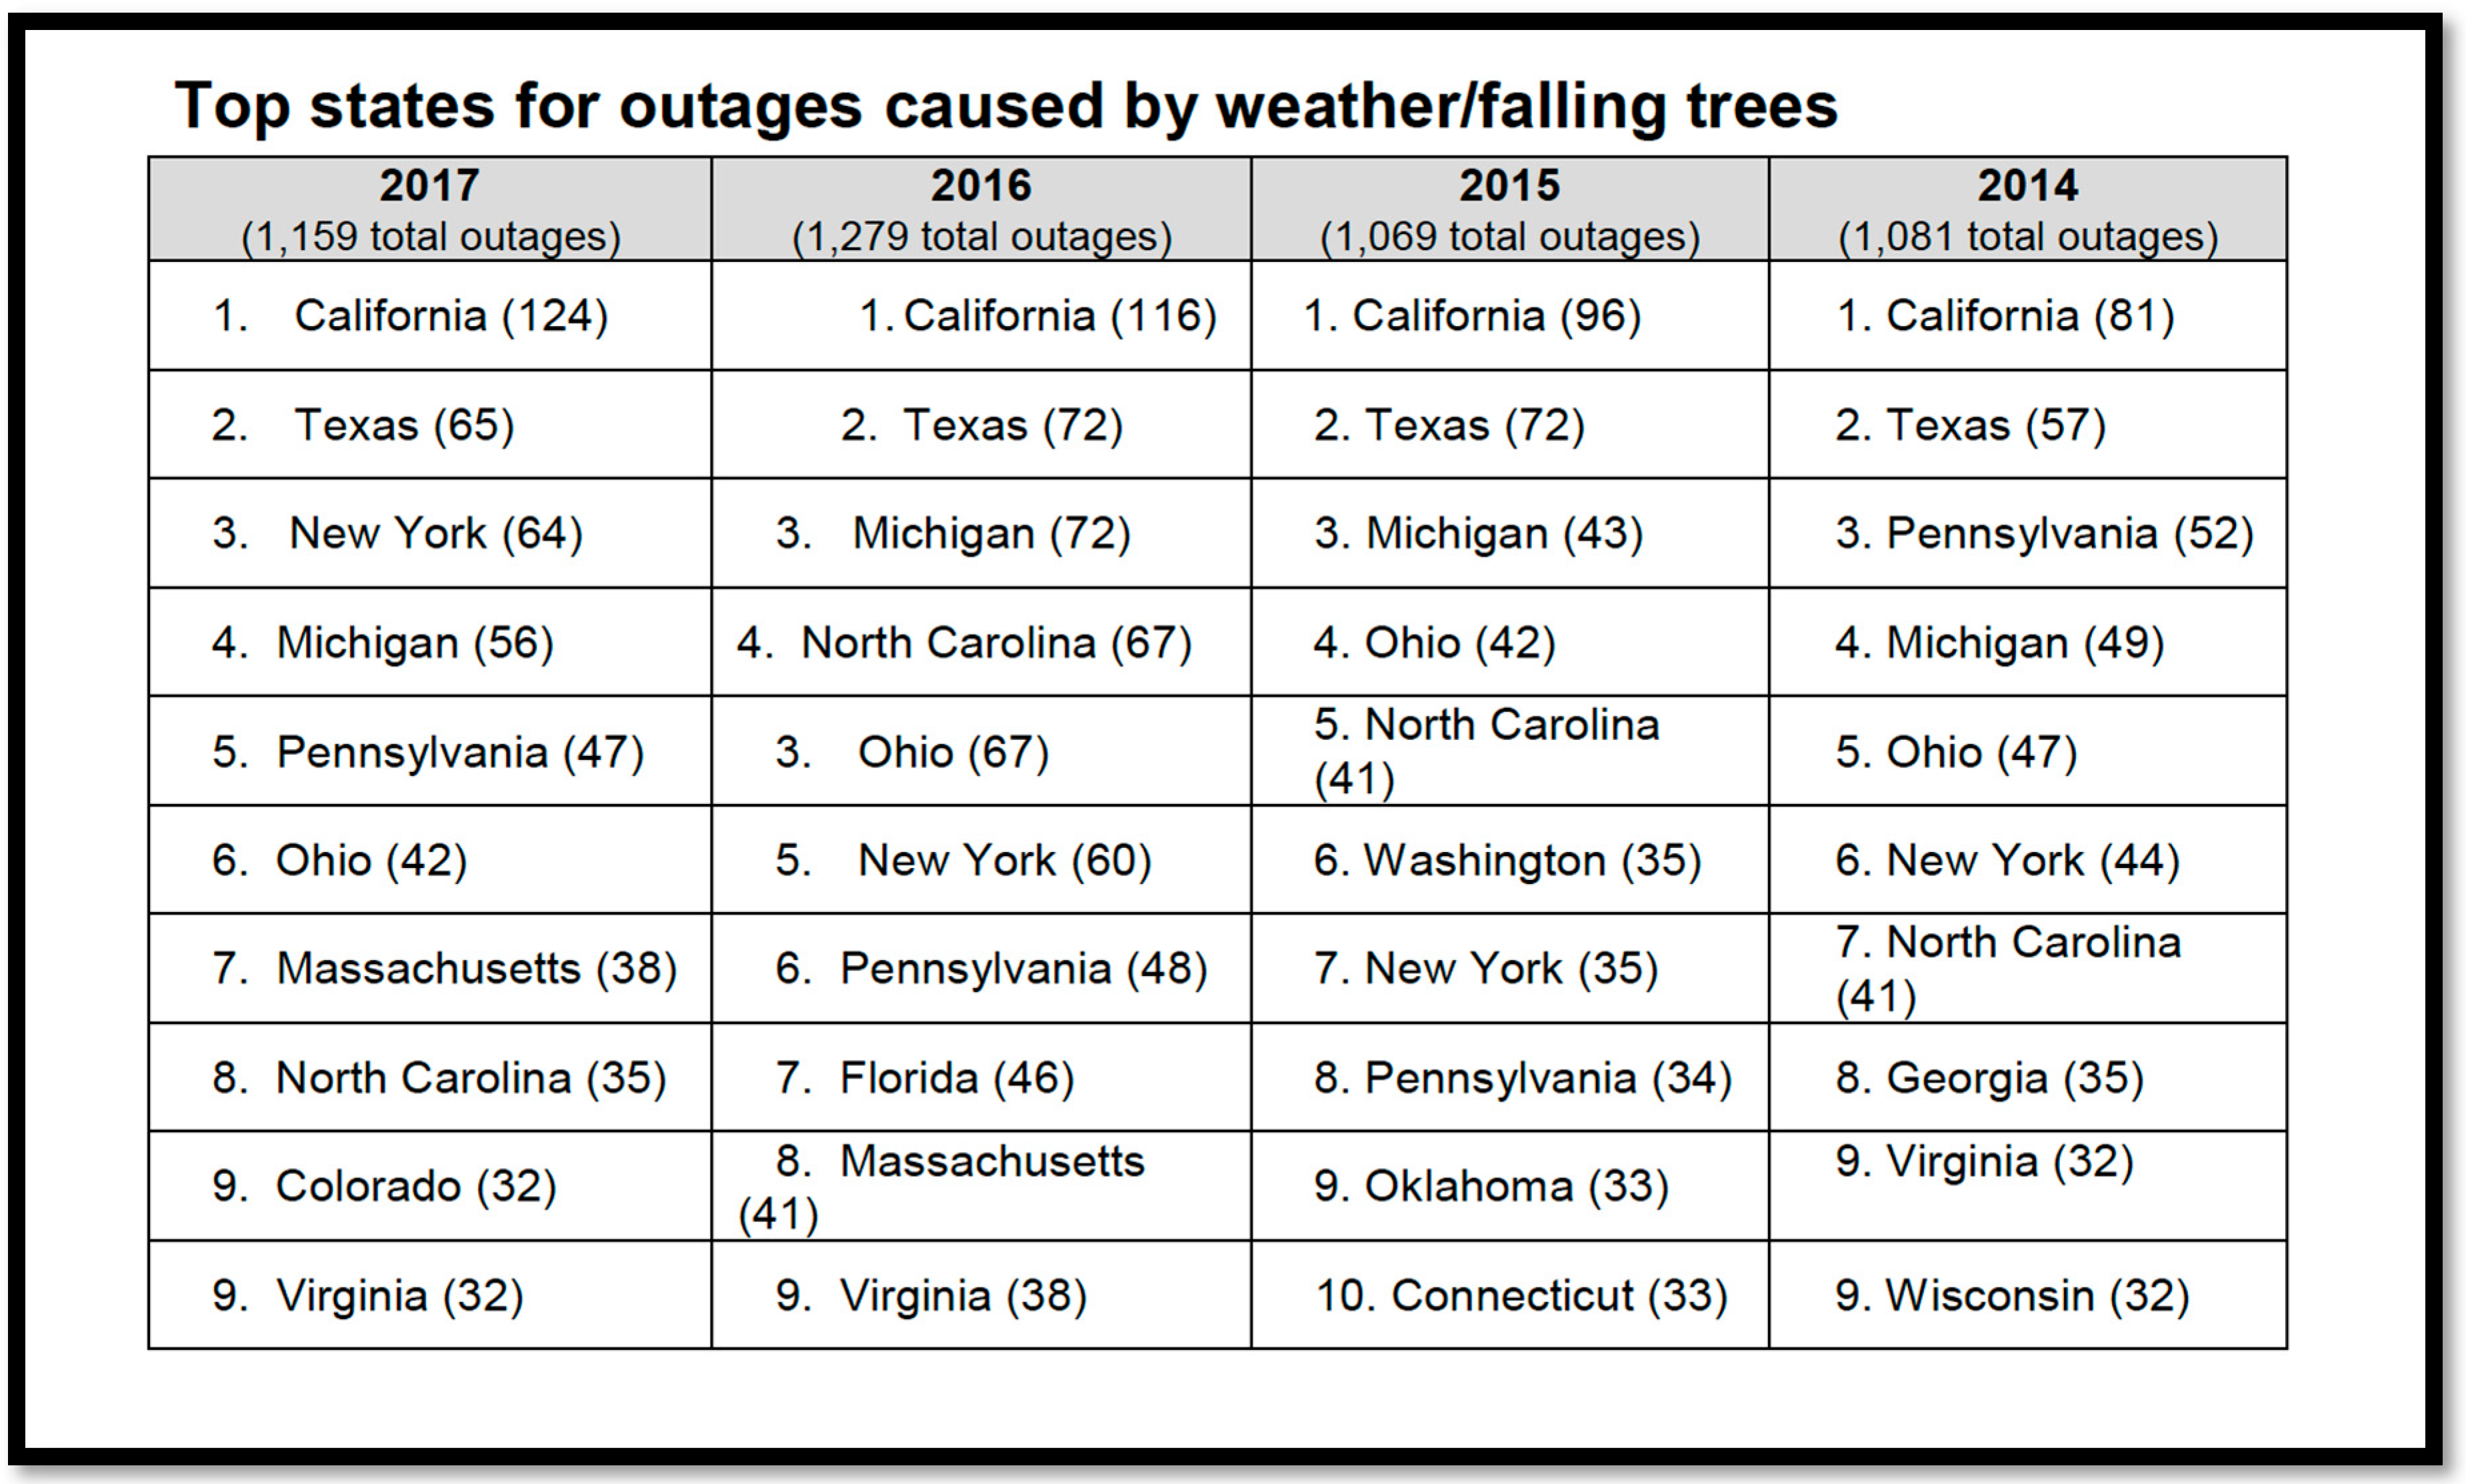
According to the Pennsylvania Public Utility Commission Electric Service Reliability Report [39], fallen trees or tree limbs caused approximately 50% of the total minutes of service interruptions in 2017 (p. 14). According to the National Interagency Fire Center, in 2018, more than 48,347 wildfires burned more than 7.3 million acres, as of late September. Figure 2 shows some overall data on the total number of outages caused by weather/falling trees [40].
To reduce the risk of wildfire and keep customers safe, electric utilities need to accelerate their vegetation management work. Utilities are already working to meet new state vegetation and fire-safety standards. For instance, in California, the new standards require a minimum clearance of four feet around power lines in high fire-threat areas with clearances of 12 feet or more at the time of trim to ensure year-round compliance [41]. However, accelerated wildfire vegetation management work is still needed to address overhanging branches or limbs. The idea is to reduce vegetation below and near power lines that could act as fuel in a wildfire, as an added layer of protection and to enhance defensible space. Thus, the challenge for an electric utility in this case is: “Where should a utility improve tree cutting and trimming-related initiatives to foster operational excellence and reduce the risk of vegetation coming into contact with power lines?”
4.1.3. Challenge 3—Equipment Failure Scenario
The aging of the grid infrastructure is a noteworthy reason for power failures. In 2008, the American Society of Civil Engineers gave the U.S. power-grid infrastructure an unsatisfactory grade [42]. The report stated that the power transmission system in the United States required immediate attention. Furthermore, the report mentioned that the U.S. electric power grid is similar to those of third-world countries. According to the Electric Power Research Institute, equipment such as transformers need to be replaced as they have exceeded their expected lifespan, considering the materials’ original design [43].
Willis and Schrieber [44] identified equipment age as the active factor in aging systems and implied it was the catalyst for utilities’ problems. Their book described the characteristics of an aging infrastructure, including that the majority of equipment in the area is more than 40 years old, and the area is plagued by an above-average equipment-failure rate [44].
The industry is spending hundreds of billions of dollars to replace and upgrade infrastructure, rushing to meet consumer demand for higher quality power, which is enabled by the construction of a more reliable grid. Considering the utility goal to reduce labor and the costs of inspection contractors, the challenge in this case is: “Which infrastructure should be inspected to reduce the risk of power outage?”
4.2. Insights for ArcGIS Solution
An artefact was created in Insights for ArcGIS using the DSR methodology. Insights for ArcGIS Workbooks were developed to explore and discover trends and details in a utility company’s data. Pages is a method for organizing data visualization widgets within a Workbook.
The following section describes the workbooks that were developed to address the three case study scenarios.
4.2.1. Challenge 1—Storm Scenario
This Workbook is used to identify the critical locations where a utility company needs to stage workers and equipment in the event of a storm. All the relevant data were imported from the supervisory control and data acquisition/outage management system/distribution management system.
Page 1: Developed to investigate weather-related outages and the reported causes shown in Figure 3. This Page allows utility personnel to answer the following questions.
- What is the reported weather category contributing to the largest count of outage events?
- What is the reported weather category contributing to the largest duration of outages?
- What is the reported weather-related cause contributing to the largest count of customers’ calls?
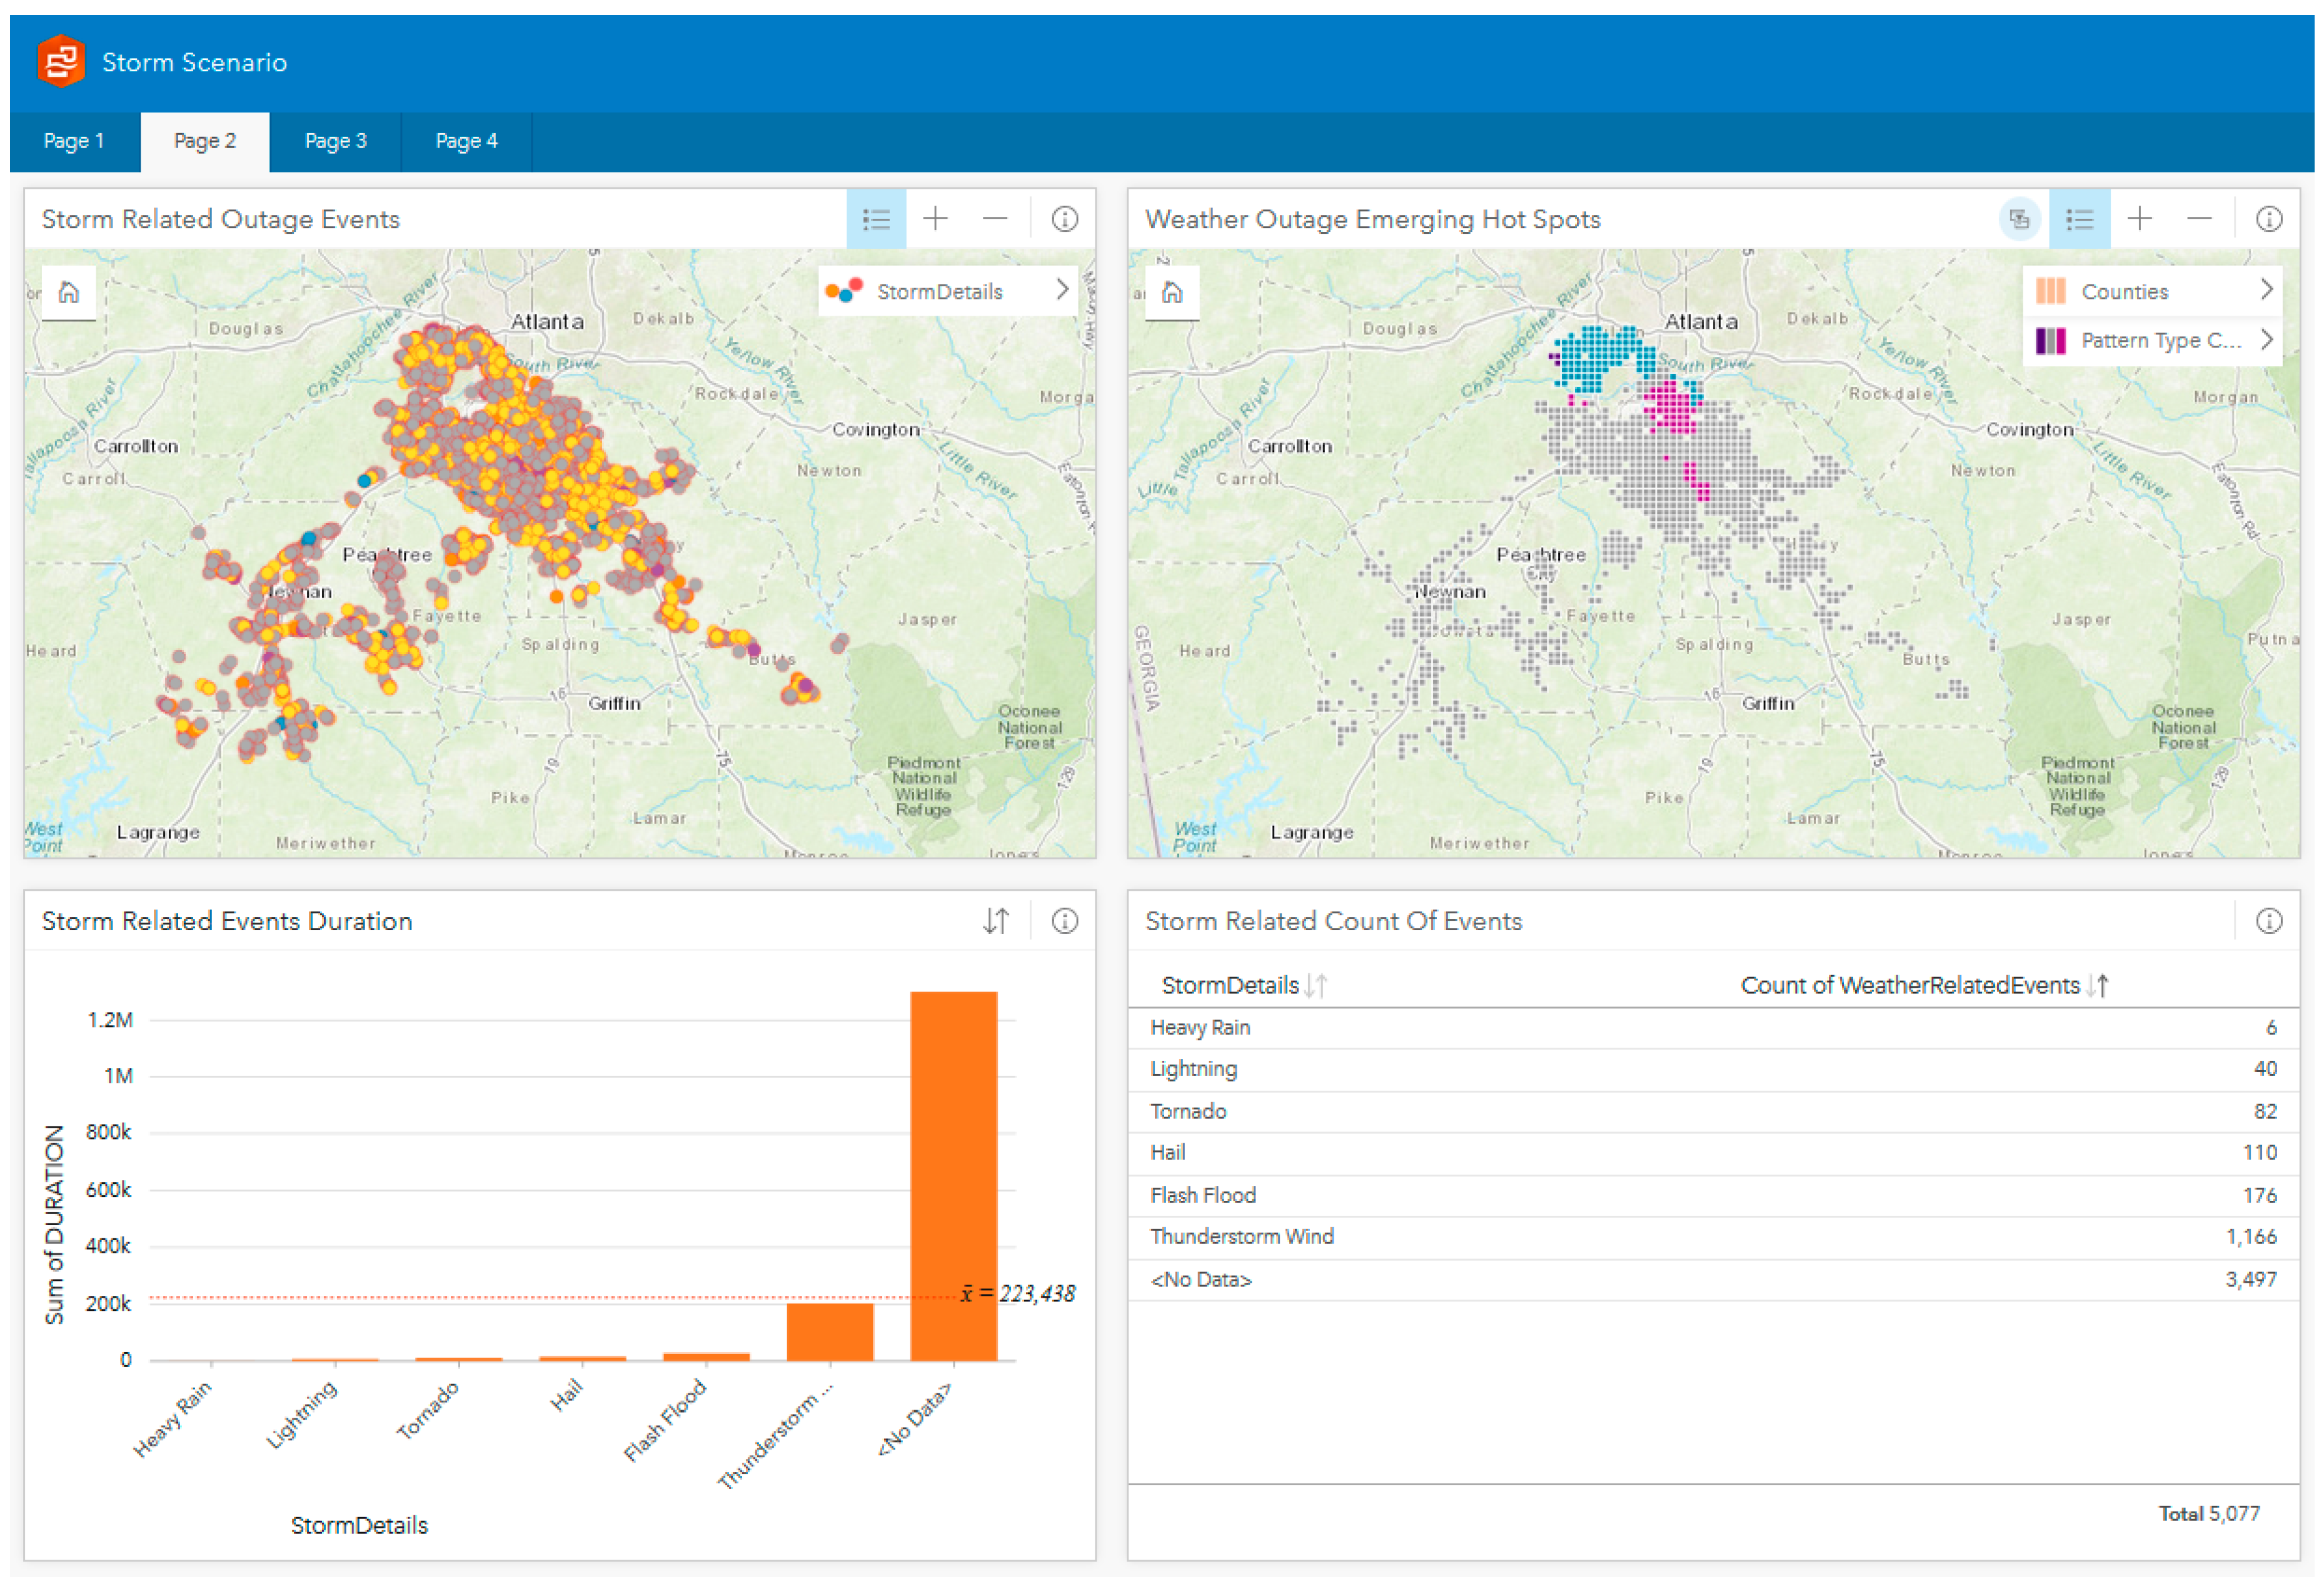
Page 2: Developed to investigate weather-related outages associated with storms in the specific locations shown in Figure 4. This page allows utility personnel to answer the following questions.
- What is the reported type of storm contributing to the largest count of outage events?
- What is the reported type of storm contributing to the largest duration of outages?
- Where do you see emerging hot spots for weather-related outages?
- In which county do you see consecutive emerging power-outage hot spots associated with weather?
Page 3: Developed to investigate the association of weather-related outages with infrastructure age (using pole age as a proxy), as shown in Figure 5. This page allows utility personnel to answer the following questions.
- In which counties do you mainly see infrastructure-age hot spots?
- What is the reported age interval of infrastructure contributing to the largest count of weather-related outage events?
- If you were to stage crews to replace poles in preparation for a storm, does this map tell you where to stage them?
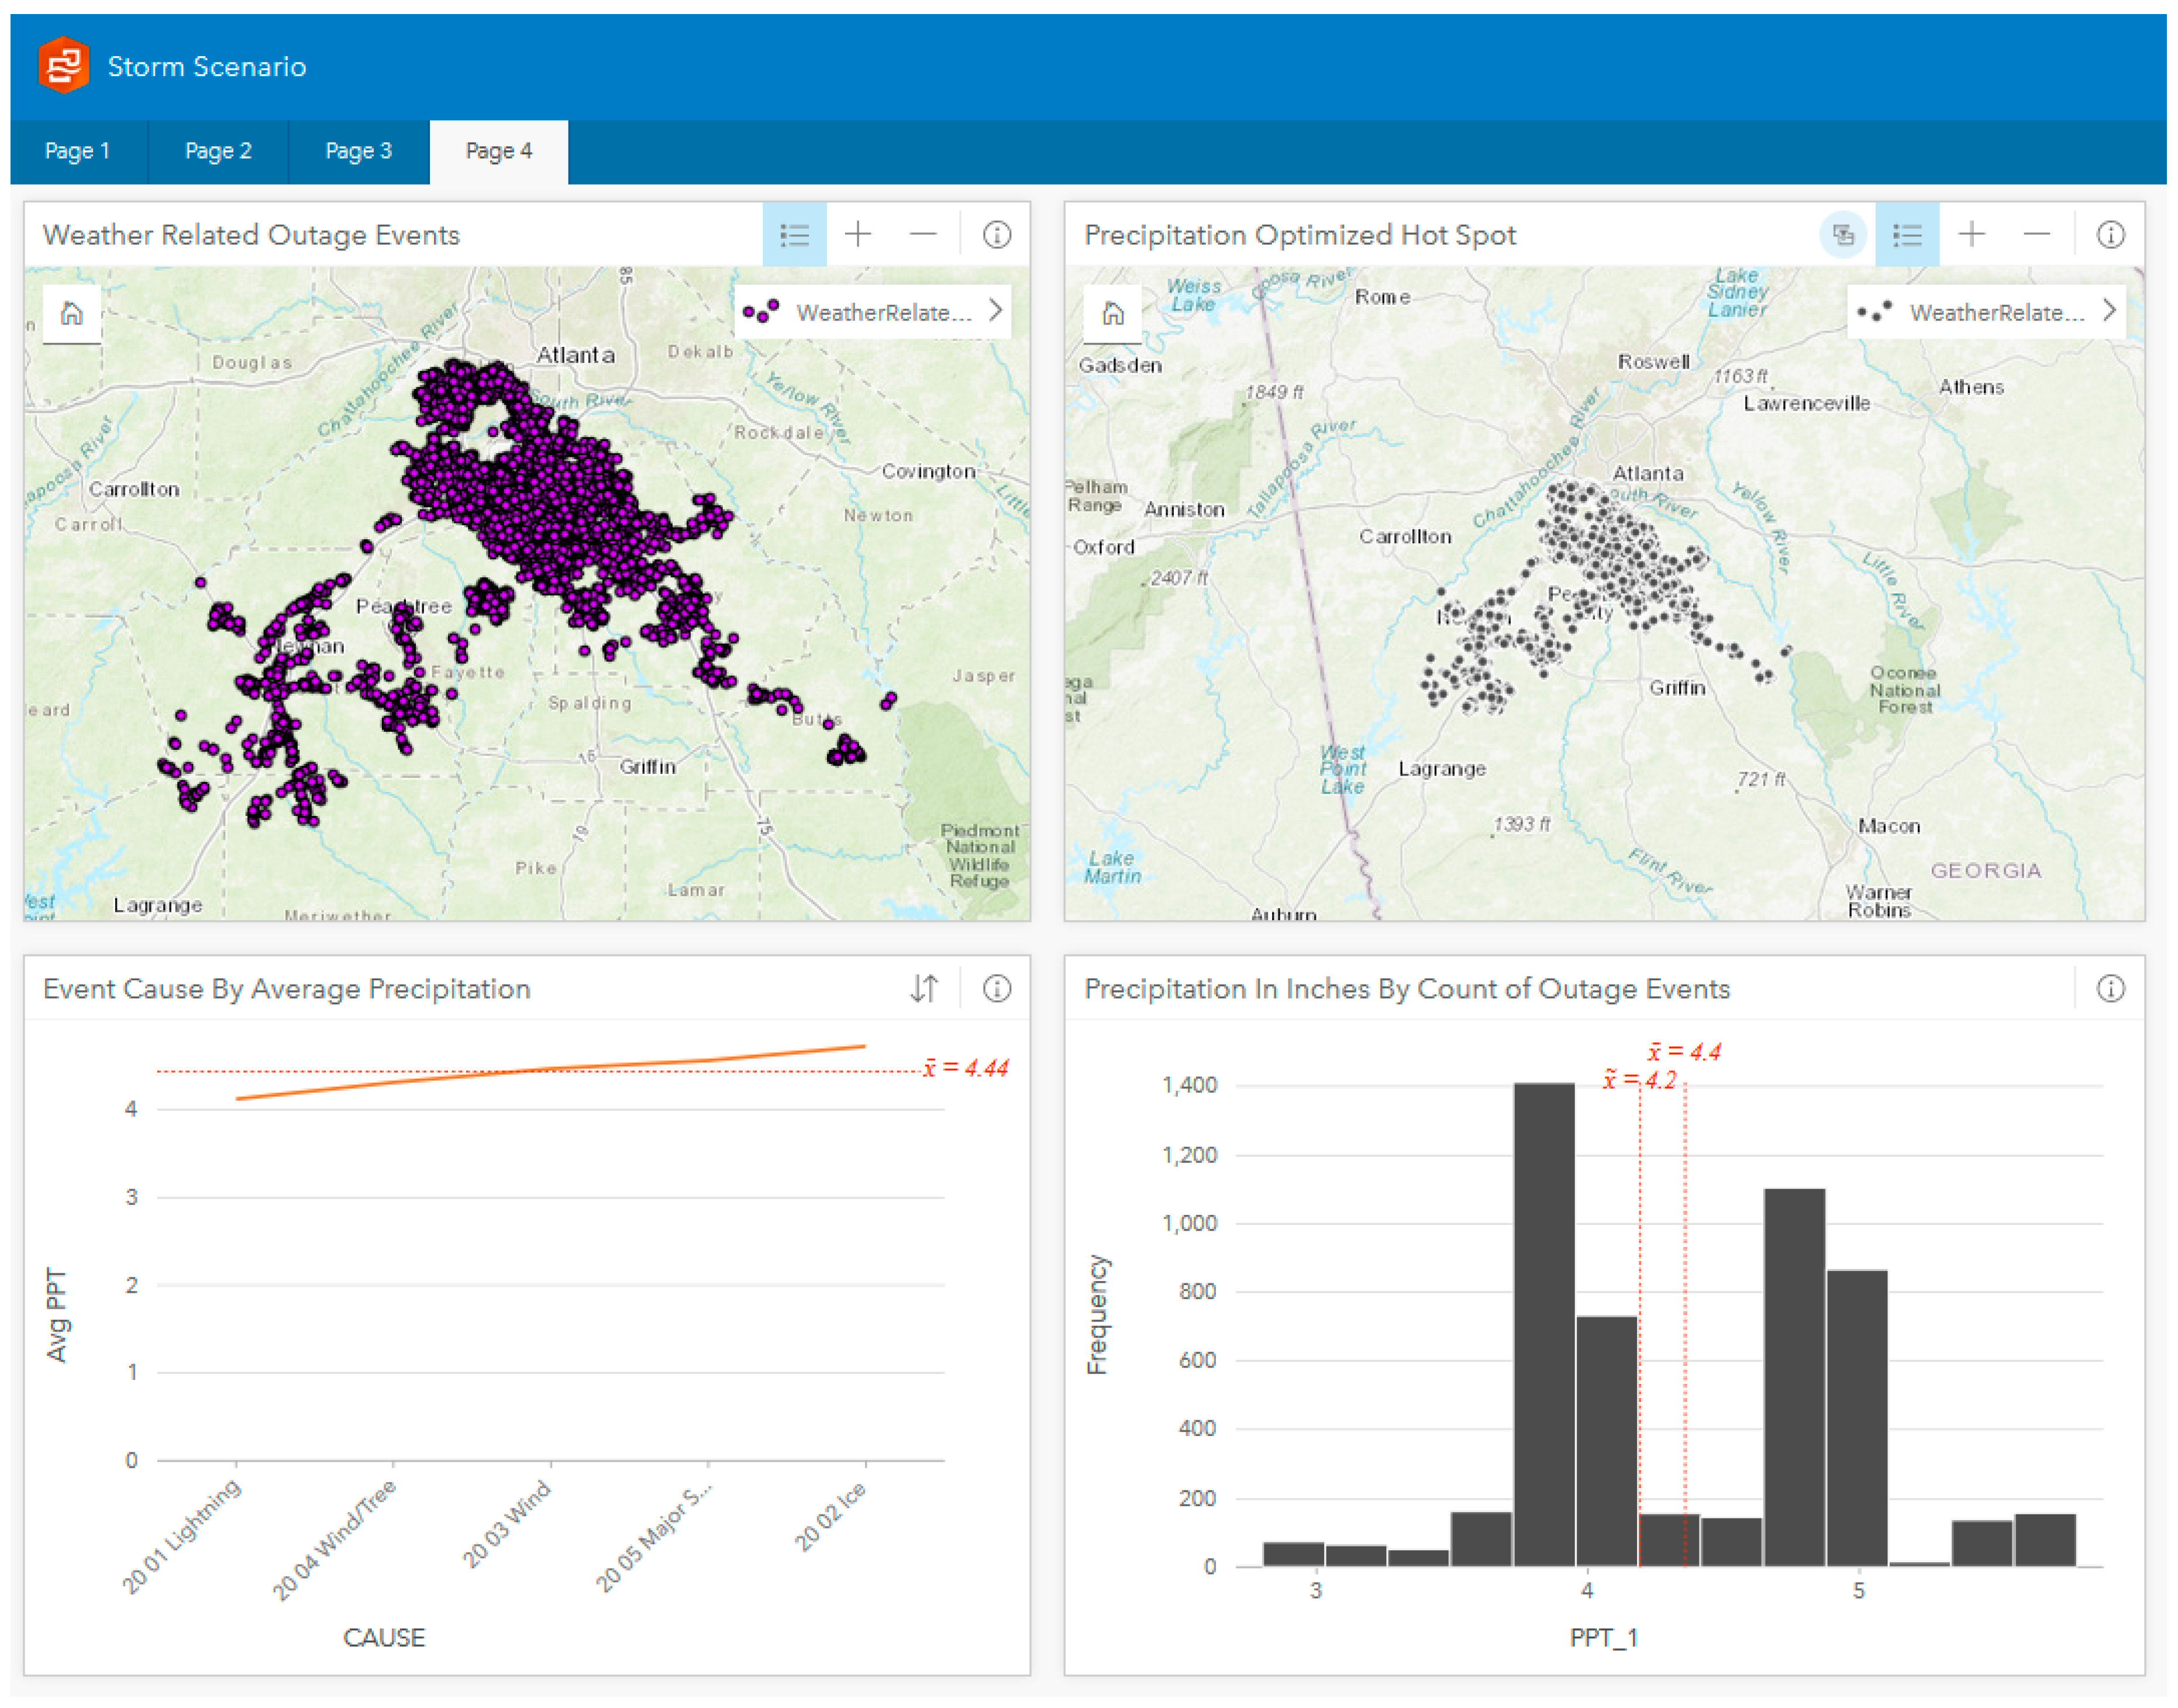
Page 4: Developed to investigate the relationship between weather-related outages and precipitation values, as shown in Figure 6. This page allows utility personnel to answer the following questions.
- What is the average precipitation value associated with weather-related outages?
- What is the reported weather category associated with the largest average precipitation value?
- At how many inches of precipitation, on average, do we start risking outage?
- How many outage events align with 3.7 to 4 inches of precipitation?
4.2.2. Challenge 2—Vegetation Scenario
This Workbook is used to identify the critical locations where a utility company needs to prune trees as an added layer of protection and to enhance defensible space. All the relevant data were imported from the supervisory control and data acquisition/outage management system/distribution management system.
Page 1. Developed to investigate trees-related outages and the reported right-of-way events shown in Figure 7. This page will allow utility personnel to answer the following questions.
- What is the reported right-of-way-event category contributing to the largest count of outage events?
- What is the reported right-of-way-event category contributing to the largest duration of outages?
- What is the reported tree-related cause contributing to the largest count of customer calls?
Page 2. Developed to investigate the relationship between tree pruning time and outage events, as shown in Figure 8. This page will allow utility personnel to answer the following questions.
- How many expected pruning human hours are needed to eliminate vine-caused power outages?
- How many supreme pruning human hours are needed to eliminate which category of right-of-way events?
- Based on actual pruning human hours (a limited resource), which category of right-of-way events needs the greatest number of pruning human hours, on average, to be eliminated?
- In which counties do you see consecutive emerging power outage hot spots associated with trees?
Page 3. Developed to investigate tree-related outages optimized and emerging hot spots, as shown in Figure 9. This page will allow utility personnel to answer the following questions.
- In which counties do you mainly see optimized hot spots for tree-related outages?
- In which counties do you mainly see sporadic emerging hot spots for tree-related outages?
- How many sporadic emerging hot spots do you see?
- What pattern type of emerging hot spots do you mainly see in the optimized hot spot locations of outages?
- How many consecutive emerging power outage hot spots align with trees?
- If you were to send crews (a limited resource) to prune trees, does this map guide you in where you need vegetation management the most?
4.2.3. Challenge 3—Equipment Failure Scenario
This Workbook is used to identify critical locations where utilities need to more often inspect infrastructure and equipment, such as aging poles. All the relevant data were imported from the supervisory control and data acquisition/outage management system/distribution management system.
Page 1. Developed to investigate equipment failure-related outages and reported causes, as shown in Figure 10. This page will allow utility personnel to answer the following questions.
- What is the reported equipment failure-related outage category contributing to the largest count of outage events?
- What is the reported equipment failure-related outage category contributing to the largest duration of outages?
- What is the reported equipment failure-related outage category contributing to the largest count of customers’ calls?
Page 2. Developed to investigate equipment failure-related outages optimized and emerging hot spots, as shown in Figure 11. This page will allow utility personnel to answer the following questions.
- In which county do you mainly see optimized hot spots for equipment failure-related outages?
- In which county do you mainly see emerging hot spots for equipment failure-related outages?
- How many pattern types of emerging hot spots do you mainly see?
- How many consecutive emerging power outage hot spots align with equipment failure?
Page 3. Developed to investigate the association between equipment failure-related outages and infrastructure age (using pole age as a proxy), as shown in Figure 12. This page will allow utility personnel to answer the following questions.
- In which county do you see the largest infrastructure-age hot spot?
- What is the reported age interval of infrastructure contributing to the largest count of equipment failure-related outage events?
- If you were to send crews to inspect aging poles, does this map tell you where you need to send inspection contractors first?
Page 4. Developed to investigate the relationship between all power outage events and infrastructure age (using pole age as a proxy), as shown in Figure 13. This page will allow utility personnel to answer the following questions.
- Which county has the oldest poles, on average?
- What is the average age of poles associated with oscillating emerging power outage hot spots?
- Which emerging hot spots pattern aligns with the oldest poles, on average?
- If you were to send crews (a limited resource) to inspect equipment, does this map tell you where you need to send inspection contractors first?
5. Evaluation
The proposed solution in this paper brings forth an important contribution to help practitioners identify the optimal location(s) for the placement of smart grid interventions while considering many operating parameters, outage scenarios, and potential benefits. The GIS model presented in this study can advance smart grid reliability by, for example, elucidating the root cause of power failure, defining a solution for a blackout through data, or implementing the solution with continuous monitoring and management.
This study illustrated how Insights for ArcGIS, a GIS-based solution, can be used to perform quick analyses, produce illustrative maps and charts, and share that information with managerial staff on the utility side. Since Insights for ArcGIS is able to record workflows, utility personnel will be able to rerun analysis monthly, whenever inspection budgets become available or whenever a storm is expected to hit the service area.
There were two steps in the artefact evaluation in this case. The first step was to hold a webinar for grid operators and professionals from utilities to share project results and present the proposed solution. This step was important, as it initiated a conversation in which utility experts and grid operators made suggestions to help improve the design. Aligned with Hevner [16], communicating results opens an experiment or design to accurate, unbiased evaluation.
For the second step of the evaluation, feedback was solicited from participants who were given access to Insights for ArcGIS to view the proposed solution. A survey was administered to understand how the tool could provide actionable information to utilities considering the risk scenarios. In addition, participants answered questions regarding system usability. Lastly, participants assessed the impact of the research and the viability of the proposed artefact. On average, participants required approximately 75 minutes to navigate the tool and complete the survey. We solicited feedback from participants to whom we gave access to Insights for ArcGIS to view the proposed solution. We intended the first section of the survey (Q1–Q45) to illustrate the solution in Insights for ArcGIS and demonstrate how the tool can provide actionable information for utilities considering the risk scenarios. Next, we asked participants to answer 10 questions on the System Usability Scale (SUS, Q46–Q56), which is a measurement instrument that is used extensively by a variety of industries to test applications and systems. Last, we asked participants six additional questions to assess the impact of the research and the viability of the proposed artefact. It took participants about 75 minutes to navigate the tool and complete the entire survey.
Survey participants were identified using a purposeful sampling technique such that participants with experience in smart grid operations and utility businesses were selected. No compensation or incentive was given to the participants for their voluntary contribution in this study. The following recruitment approaches were used to identify participants and make them aware of the project:
- Asked utility professionals to recommend or refer us to potential participants they know;
- Approached participants one-on-one in conferences and energy forums.
Recruitment of survey participants involved a number of activities, including identifying eligible participants, adequately explaining the study to potential participants, obtaining informed consent, maintaining ethical standards, and retaining participants until study completion. The profile of the survey participant sample appears in Table 2.
According to utility industry consultant Jim Horstman [9], the solution offered here provides useful insights. However, Horstman pointed out that it still needs work, as the terminology used for hot spots, for example, are statisticians’ terms, not laypersons’ terms. Horstman commented that utilities are becoming more “analytical” and beginning to understand the value of this research [9].
A research program manager at Electric Power Research Institute confirmed the potential of this application offered by the prototype. According to the program manager, “ArcGIS Insights worksheets are very easy to use and understand. Other layers like where the lines run and where the customers are located would be an additional useful integration consideration. Utilities would need to do some customization in order to make it truly actionable. Visual analytics and the ability to look at data over time [are] critically important. I really like the hot spots concepts” [45].
All the survey participants responded with positive feedback and highlighted the potential offered by the proposed artefact. Descriptive statistics of the survey results regarding system usability appear in Table 3, Table 4, Table 5, Table 6, Table 7, Table 8, Table 9, Table 10, Table 11 and Table 12.
The System Usability Scale (SUS) yields a single number representing a composite measure of the overall usability of the system being studied. SUS scores have a range of 0 to 100. The average SUS score from previous studies is a 68 [46]. Thus, a score above 68 would be considered above average, and below 68 is considered below average. Based on survey results, this research featured an SUS score of 82.5, which can be interpreted as a grade of “A” on a curve (the top 10% of scores). Table 13 displays the SUS score calculation.
6. Discussion
This dissertation concerns smart grid reliability, specifically regarding the reliability of the distribution system. The main research question of the dissertation was: “How may location analytics be used to enhance Smart Grid reliability research?” To answer this question, I developed an artefact/solution in Insights for ArcGIS to instantiate how GIS can help enhance understanding of power outages and prescribe interventions that will improve the reliability of the smart grid. I developed three case studies to demonstrate various risk scenarios that encourage a utility company to take action and prepare for the unexpected. I created the artefact in Insights for ArcGIS using a DSR research methodology. This research proposed an elegant, interesting, and novel solution to aid in storm/disaster planning and vegetation management, identifying optimal grid locations that need inspection or infrastructure work, and detecting regions where new components such as distribution switches may provide net benefits, considering the many operating parameters and outage scenarios.
Concerning practical applications, the proposed solution brings forth an important contribution to help practitioners identify optimal locations for the placement of smart grid interventions while considering many operating parameters, outage scenarios, and potential benefits. The GIS model presented in this study can advance smart grid reliability by, for example, elucidating a root cause of power failure, defining a solution for a blackout through data, or implementing a solution with continuous monitoring and management.
I developed an analysis framework that can be used effectively in the utility industry to investigate power failure events and their causes. Analysis revealed areas where power outages were statistically significant due to multiple causes. This research illustrated how utility companies can use Insights for ArcGIS—a GIS-based solution—to perform quick analysis, produce illustrative maps and charts, and share that information with managerial staff on the utility side. Since Insights for ArcGIS is able to record workflows, utility personnel will be able to rerun analysis monthly, whenever inspection budgets become available, or whenever a storm is expected to hit the service area.
One limitation of this research is data quality, which is an ongoing problem that plagues numerous utilities. If utility professionals do not take steps to improve the quality of their data, serious consequences could ensue. Research revealed many null fields and missing and incomplete data in the electric utility system database. A utility company needs accurate data to become a good operator of the grid and achieve acceptable outage-reliability metrics and cost of operations. For instance, an effectively managed asset data repository should be able to provide the asset managers of a utility company with various insights into asset conditions, failures, locations, spatial coordinates, and attributes. Currently, a majority of utility organizations are unaware of where they stand in asset data quality. Utilities do not have a standardized way to monitor and track data quality.
The utility organizations of the future need good quality data, such as for example, asset data to understand network and asset behavior, operating conditions, and their impact on customer service. Migrating to GIS provides opportunities as well as the essential technical capabilities that grid-management activities require. However, incomplete asset data prevents GIS from effectively serving the modern grid.
Future researchers should incorporate ArcGIS GeoEvent Server: another tool to accommodate the multiple streams of data flowing continuously through filters and processing steps that stakeholders may define. Thus, identifying failures on the network by performing real-time analytics on streams of data can become feasible. Future work may involve connecting to virtually any type of streaming data feed and transforming GIS applications into frontline decision applications, showing power outage incidents as they occur.
From this research, I conclude that GIS offers a solution to analyze the electric grid distribution system. The solution prototype provided evidence that GIS can perform the analysis to investigate power failure events and their causes. If additional funds and data are made available, researchers can build on the ArcMap source code and create a custom solution for the utility industry to control and forecast power outages. GIS can be a main resource of assistance for electronic inspection systems to lower the duration of customer outages, improve crew response time, and reduce labor and overtime costs.
My first recommendation for an electric utility is to fill in the missing and null fields in their database. Second, electric utilities should capture additional data for other grid components and assets. While utility technicians are in the field, typically, they can capture this additional data. A third recommendation is to correct the spatial data accuracy. Remote sensing can be a useful tool to capture and digitize utility assets and populate GIS with location and device attributes, including images. Finally, a periodic quality assurance check of the data being captured is important, particularly if using lower cost providers or temporary utility workers.
In conclusion, field assets represent a very large investment for utilities, and having an accurate inventory of those assets protects that investment, improves utility operation efficiency, and ensures enterprise adoption of GIS. Data quality is critical for better decision making and compliance, especially as regulations continue to evolve. The old “garbage in, garbage out” adage is true, as is its inverse. Good-quality data will enable utility management personnel to understand network and asset behavior, operating conditions, and their impact on customer service.
7. Conclusions
This study aimed to answer the question: “How may location analytics be used to enhance the reliability of the smart grid?” To answer the research question, Insights for ArcGIS was used to build three Worksheets aimed at resolving the current challenges faced by utilities and thus reducing the risk of power outages. Three case studies were used to demonstrate various risk scenarios that entail a utility company taking action and preparing for the unexpected. The artefact demonstrated that GIS could play an integral role in the problem resolution.
Future research could incorporate a method to accommodate the multiple streams of real-time data flowing continuously through filters and the processing steps that stakeholders may define. Thus, identifying failures on the network by performing real-time analytics on streams of data could become feasible. Future work may involve connecting to virtually any type of streaming data feed and transforming GIS applications into frontline decision applications, showing power outage incidents as they occur.
The developed system is well described. In addition, it must be noted that the approached interfaces are very illustrative and intuitive. The solution prototype provided evidence that GIS can perform the analysis to investigate power failure events and their causes. GIS can be a main resource of assistance for electronic inspection systems to lower the duration of customer outages, improve crew response time, and reduce labor and overtime costs.
Author Contributions
V.S. completed the research, developed the solution, and wrote the paper. B.H. was the chair of the first author’s dissertation committee, designed the paper structure, reviewed the findings, and proofread/edited the final paper. All authors read and approved the final manuscript.
Funding
This research is based on the Vivian Sultan’s doctoral dissertation earned from Claremont Graduate University. No additional funding was used for this project.
Acknowledgments
The first author thanks her entire dissertation committee for their helpful advice. The first author also thanks Jim Horstman, IT Utility Consultant, and Jared Green, Project Manager at EPRI, who guided and supported her in this research initiative.
Conflicts of Interest
The authors declare that they have no competing interests.
References
- Hirst, E.; Kirby, B. Bulk-Power Basics: Reliability and Commerce. Available online: http://www.consultkirby.com/files/RAPBPBasics.pdf (accessed on 29 July 2018).
- Osborn, J.; Kawann, C. Reliability of the U.S. Electricity System: Recent Trends and Current Issues; Ernest Orlando Lawrence Berkeley National Laboratory: Berkeley, CA, USA, 2001.
- U.S. Department of Energy Office of Electricity Delivery and Energy Reliability. United States Electricity Industry Primer. 2015. Available online: https://www.energy.gov/sites/prod/files/2015/12/f28/united-states-electricity-industry-primer.pdf (accessed on 11 September 2017).
- Department of Energy Office of Energy Efficiency & Renewable Energy. Grid Performance and Reliability U.S. 2017. Available online: https://energy.gov/eere/sunshot/grid-performance-and-reliability (accessed on 11 September 2017).
- Profeta, T. The Climate Post: Grid Reliability Study Released as Climate Change Panel Disbands. Available online: http://www.huffingtonpost.com/entry/the-climate-post-grid-reliability-study-released-as_us_599ef43ae4b0a62d0987ad61 (accessed on 11 September 2017).
- Laezman, R. Office of Energy Invests in Grid Reliability Research. Electrical Contractor Magazine 2017. Available online: https://www.ecmag.com/section/systems/office-energy-invests-grid-reliability-research (accessed on 29 July 2018).
- Abiri-Jahromi, A.; Fotuhi-Firuzabad, M.; Parvania, M.; Mosleh, M. Optimized sectionalizing switch placement strategy in distribution systems. IEEE Trans. Power Deliv. 2012, 27, 362–370. [Google Scholar] [CrossRef]
- Electric Power Research Institute. EPRI Data Analytics Case: Optimal Placement of Automated Distribution Switches. Available online: http://smartgrid.epri.com/doc/DMD-Use-Cases/Optimal Placement of Automated Distribution Switches - Short Version.pdf (accessed on 15 September 2017).
- Horstman, J. Personal Interview with Experienced Utility-Industry Consultant. September 2018. [Google Scholar]
- Green, J. Personal Interview with Experienced Utility-Industry Consultant. September 2018. [Google Scholar]
- Hevner, A.; March, S.; Park, J.; Ram, S. Design science in information systems research. MIS Quart. 2004, 28, 75–105. [Google Scholar] [CrossRef]
- ESRI Environmental Systems Research Institute. Understanding GIS—The Arc/Info Method. Available online: http://www.ciesin.columbia.edu/docs/005-331/005-331.html (accessed on 7 November 2015).
- Dickey, D. Introduction to Predictive Modeling with Examples. In Proceedings of the SAS Global Forum, Orlando, FL, USA, 22–25 April 2012; Kuligowski, A.T., Ed.; SAS Institute: Cary, NC, USA, 2012; pp. 337–2012. Available online: http://support.sas.com/resources/papers/proceedings12/337-2012.pdf (accessed on 18 October 2015).
- Idowu, A.; Okoronkwo, N.; Adagunodo, R. Spatial predictive model for malaria in Nigeria. J. Health Inform. Dev. Ctries 2009, 3, 30–36. [Google Scholar]
- Totman, D. Model Predictions: GIS Helps Public Works Manage Assets. Available online: http://americancityandcounty.com/gis-amp-gps/model-predictions-gis-helps-public-works-manage-assets (accessed on 19 October 2015).
- Resch, B.; Sagl, G.; Törnros, T.; Bachmaier, A.; Eggers, J.B.; Herkel, S.; Narmsara, S.; Gündra, H. GIS-based planning and modeling for renewable energy: Challenges and future research avenues. ISPRS Int. J. Geo Inf. 2014, 3, 662–692. [Google Scholar] [CrossRef]
- Sultan, V.; Bitar, H. Geographic Decision Support Systems to Optimize the Placement of Distributed Energy Resources. In Proceedings of the 22nd Americas Conference on Information Systems, San Diego, CA, USA, 11 August 2016. [Google Scholar]
- Sultan, V.; Alzahrani, A.; Bitar, H.; Alharbi, N. Is California’s Aging Infrastructure the Principal Contributor to the Recent Trend of Power Outage? In Proceedings of the 22nd Annual California GIS Conference, Anaheim, CA, USA, 10 May 2016. [Google Scholar]
- National Academies of Sciences, Engineering and Medicine. Enhancing the Resilience of the Nation’s Electricity System; The National Academies Press: Washington, DC, USA, 2017. [Google Scholar] [CrossRef]
- Mitnick, S. Changing Uses of the Electric Grid: Reliability Challenges and Concerns 2015. Available online: http://www.emrf.net/uploads/3/4/4/6/34469793/emrf_business_models_final_web_version.pdf (accessed on 11 September 2017).
- Eto, J.H.; Lacommare, K.H.; Larsen, P.; Todd, A.; Fisher, E. An Examination of Temporal Trends in Electricity Reliability Based on Reports from U.S. Electric Utilities; Berkeley Lab: Berkeley, MA, USA, 2012. Available online: https://emp.lbl.gov/publications/examination-temporal-trends (accessed on 15 September 2017).
- Chayanam, K. Analysis of Telecommunications Outages due to Power Loss. Unpublished Master’s Thesis. 2005. Available online: https://etd.ohiolink.edu/rws_etd/document/get/ohiou1125024491/inline (accessed on 29 July 2018).
- Diesel Service and Supply. The Many Causes of Power Failures 2017. Available online: http://www.dieselserviceandsupply.com/Causes_of_Power_Failures.aspx (accessed on 11 September 2017).
- Rocky Mountain Power. Key Causes of Power Outages 2017. Available online: https://www.rockymountainpower.net/ed/po/or/kcopo.html (accessed on 11 September 2017).
- Westar Energy. What Causes Power Outages? 2017. Available online: https://www.westarenergy.com/outage-causes (accessed on 11 September 2017).
- Miller, R. How to Prevent Downtime Due to Human Error. Data Center Knowledge 2010. Available online: https://www.datacenterknowledge.com/archives/2010/08/13/how-to-prevent-downtime-due-to-human-error (accessed on 11 September 2017).
- Delivery and Energy Reliability. Smart Grid Investment Grant Program: Progress Report II. U.S. Department of Energy Office of Electricity 2013. Available online: https://www.smartgrid.gov/files/SGIG_progress_report_2013.pdf (accessed on 15 September 2017).
- Walls, J.G.; Widmeyer, G.R.; El Sawy, O.A. Building an information system design theory for vigilant EIS. Inform. Syst. Res. 1992, 3, 36–59. [Google Scholar] [CrossRef]
- March, S.T.; Smith, G.F. Design and natural science research on information technology. Decis. Support Syst. 1995, 15, 251–266. [Google Scholar] [CrossRef]
- Gregor, S.; Hevner, A.R. Positioning and presenting design science research for maximum impact. MIS Quart. 2013, 37, 337–356. [Google Scholar] [CrossRef]
- Hevner, A. A three-cycle view of design science research. Scand. J. Inf. Syst. 2007, 19, 87–92. [Google Scholar]
- Hevner, A.R.; Chatterjee, S. Design Science Research in Information Systems. In Design Research in Information Systems; Springer: Boston, MA, USA, 2010; Available online: http://link.springer.com/chapter/10.1007/978-1-4419-5653-8_2. (accessed on 11 September 2017).
- Peffers, K.; Tuunanen, T.; Rothenberger, M.A.; Chatterjee, S. A design science research methodology for information systems research. J. Manag. Inf. Syst. 2007, 24, 45–77. [Google Scholar] [CrossRef]
- LaCommare, K.; Eto, J. Understanding the Cost of Power Interruptions to U.S. Electricity Consumers; Lawrence Berkeley National Laboratory: Berkeley, CA, USA, 2004.
- Takeda, H.; Veerkamp, P.; Yoshikawa, H. Modeling design process. AI Mag. 1990, 11, 37–48. [Google Scholar]
- Segawa, S.; Sugimura, M.; Ishigaki, K. New web-usability evaluation method: Scenario-based walkthrough. Fujitsu Sci. Tech. J. 2005, 41, 105–114. [Google Scholar]
- ESRI Environmental Systems Research Institute. Insights for ArcGIS. Available online: http://doc.arcgis.com/en/insights/ (accessed on 4 September 2018).
- California Public Utility Commission. Electric and Fire Related Fines. Available online: http://cpuc.ca.gov/uploadedFiles/CPUC_Public_Website/Content/Safety/Electric_and_Fire_Related_Fines.pdf (accessed on 28 June 2019).
- Pennsylvania Public Utility Commission. Pennsylvania Electric Reliability Report 2017. Available online: http://www.puc.pa.gov/General/publications_reports/pdf/Electric_Service_Reliability2017.pdf (accessed on 28 June 2019).
- Eaton’s Blackout Tracker. Power Outage Annual Report. Available online: https://switchon.eaton.com/blackout-tracker (accessed on 29 July 2018).
- State Board of Forestry and Fire Protection. 2018 Strategic Fire Plan for California. Available online: http://cdfdata.fire.ca.gov/pub/fireplan/fpupload/fpppdf1614.pdf (accessed on 22 August 2018).
- American Society of Civil Engineers. Infrastructure Fact Sheet. Available online: http://www.infrastructurereportcard.org/2009/sites/default/files/RC2009_rail.pdf (accessed on 7 October 2015).
- Stone, D. It’s the Electric Grid, Stupid. Available online: http://www.thedailybeast.com/articles/2011/09/09/major-power-outage-shows-weakness-of-aging-electric-infrastructure.html (accessed on 5 October 2015).
- Willis, H.; Schrieber, R. Aging Power Delivery Infrastructures, 2nd ed.; CRC Press/Taylor & Francis: Boca Raton, FL, USA, 2013. [Google Scholar]
- Dorr, D. Personal Interview with Experienced Utility-Industry Consultant. September 2018. [Google Scholar]
- Sauro, J. Measuring Usability with the System Usability Scale (SUS). Available online: https://measuringu.com/sus/ (accessed on 28 June 2019).
Figure 1.
Design science research method [18].
Figure 1.
Design science research method [18].

Figure 2.
Eaton’s Blackout Tracker [40].
Figure 2.
Eaton’s Blackout Tracker [40].

Figure 3.
Challenge 1—Storm Scenario Workbook—Page 1.

Figure 4.
Challenge 1—Storm Scenario Workbook—Page 2.

Figure 5.
Challenge 1—Storm Scenario Workbook – Page 3.

Figure 6.
Challenge 1—Storm Scenario Workbook—Page 4.

Figure 7.
Challenge 2—Vegetation Scenario Workbook—Page 1.

Figure 8.
Challenge 2—Vegetation Scenario Workbook—Page 2.

Figure 9.
Challenge 2—Vegetation Scenario Workbook—Page 3.

Figure 10.
Challenge 3—Equipment Failure Scenario Workbook—Page 1.

Figure 11.
Challenge 3—Equipment Failure Scenario Workbook—Page 2.

Figure 12.
Challenge 3—Equipment Failure Scenario Workbook—Page 3.

Figure 13.
Challenge 3—Equipment Failure Scenario Workbook—Page 4.


Table 1.
Changes in Reliability Indices from Automated Feeder Switching.
| Reliability Indices | Description | Range of Percent Changes |
|---|---|---|
| SAIFI | System Average Interruption Frequency Index (outages) | −11% to −49% |
| MAIFI | Momentary Average Interruption Frequency Index (interruptions) | −13% to −35% |
| SAIDI | System Average Interruption Duration Index (minutes) | +4% to −56% |
| CAIDI | Customer Average Interruption Duration Index (minutes) | +29% to −15% |
Table 2.
Survey Participants Sample Characteristics. IT: information technology.
| Participant’s Position | Years of Experience in the Utility Industry | Gender |
|---|---|---|
| Participant 1—Technical leader, project manager | 20–30 | Male |
| Participant 2—Engineer | 30–40 | Male |
| Participant 3—Utility IT consultant | 30–40 | Male |
| Participant 4—Data scientist | 5–10 | Male |
| Participant 5—Utility research program manager | 20–30 | Male |
Table 3.
Percentages and Frequencies, Q46.
| Frequency | Percent | |
|---|---|---|
| I think that I would like to use ArcGIS Insights worksheets frequently. | ||
| Somewhat agree | 4 | 80.0 |
| Neither agree nor disagree | 1 | 20.0 |
| n | 5 | 100.0 |
Table 4.
Percentages and Frequencies, Q47.
| Frequency | Percent | |
|---|---|---|
| I found ArcGIS Insights worksheets unnecessarily complex. | ||
| Neither agree nor disagree | 1 | 20.0 |
| Somewhat disagree | 1 | 20.0 |
| Strongly disagree | 3 | 60.0 |
| n | 5 | 100.0 |
Table 5.
Percentages and Frequencies, Q48.
| Frequency | Percent | |
|---|---|---|
| I thought ArcGIS Insights worksheets was easy to use. | ||
| Strongly agree | 3 | 60.0 |
| Somewhat agree | 2 | 40.0 |
| n | 5 | 100.0 |
Table 6.
Percentages and Frequencies, Q49.
| Frequency | Percent | |
|---|---|---|
| I think that I would need assistance to be able to use ArcGIS Insights worksheets. | ||
| Neither agree nor disagree | 1 | 20.0 |
| Somewhat disagree | 1 | 20.0 |
| Strongly disagree | 3 | 60.0 |
| n | 5 | 100.0 |
Table 7.
Percentages and Frequencies, Q50.
| Frequency | Percent | |
|---|---|---|
| I found the various functions in ArcGIS Insights worksheets were well integrated. | ||
| Strongly agree | 2 | 40.0 |
| Somewhat agree | 2 | 40.0 |
| Missing | 1 | 20.0 |
| n | 5 | 100.0 |
Table 8.
Percentages and Frequencies, Q51.
| Frequency | Percent | |
|---|---|---|
| I thought there was too much inconsistency in ArcGIS Insights worksheets. | ||
| Neither agree nor disagree | 1 | 20.0 |
| Somewhat disagree | 1 | 20.0 |
| Strongly disagree | 3 | 60.0 |
| n | 5 | 100.0 |
Table 9.
Percentages and Frequencies, Q52.
| Frequency | Percent | |
|---|---|---|
| I would imagine that most people would learn to use ArcGIS Insights worksheets very quickly. | ||
| Strongly agree | 4 | 80.0 |
| Somewhat agree | 1 | 20.0 |
| n | 5 | 100.0 |
Table 10.
Percentages and Frequencies, Q53.
| Frequency | Percent | |
|---|---|---|
| I found ArcGIS Insights worksheets very cumbersome/awkward to use. | ||
| Somewhat disagree | 1 | 20.0 |
| Strongly disagree | 4 | 80.0 |
| n | 5 | 100.0 |
Table 11.
Percentages and Frequencies, Q54.
| Frequency | Percent | |
|---|---|---|
| I felt very confident using ArcGIS Insights worksheets. | ||
| Somewhat agree | 5 | 100.0 |
| n | 5 | 100.0 |
Table 12.
Percentages and Frequencies, Q55.
| Frequency | Percent | |
|---|---|---|
| I needed to learn a lot of things before I could get going with ArcGIS Insights worksheets. | ||
| Neither agree nor disagree | 1 | 20.0 |
| Somewhat disagree | 2 | 40.0 |
| Strongly disagree | 2 | 40.0 |
| n | 5 | 100.0 |
Table 13.
System usability scale scores.
| Participant | Q1 | Q2 | Q3 | Q4 | Q5 | Q6 | Q7 | Q8 | Q9 | Q10 | Score |
|---|---|---|---|---|---|---|---|---|---|---|---|
| P1 | 4 | 1 | 4 | 1 | 4 | 2 | 5 | 1 | 4 | 1 | 87.5 |
| P2 | 4 | 2 | 5 | 1 | 5 | 1 | 5 | 1 | 4 | 1 | 92.5 |
| P3 | 4 | 3 | 4 | 3 | 4 | 3 | 4 | 2 | 4 | 2 | 67.5 |
| P4 | 3 | 1 | 5 | 1 | 1 | 5 | 1 | 4 | 2 | 77.5 | |
| P5 | 4 | 1 | 5 | 2 | 5 | 1 | 5 | 1 | 4 | 3 | 87.5 |
| Average | 82.5 |
© 2019 by the authors. Licensee MDPI, Basel, Switzerland. This article is an open access article distributed under the terms and conditions of the Creative Commons Attribution (CC BY) license (http://creativecommons.org/licenses/by/4.0/).
Share and Cite
MDPI and ACS Style
Sultan, V.; Hilton, B. How May Location Analytics Be Used to Enhance the Reliability of the Smart Grid? Inventions 2019, 4, 39. https://doi.org/10.3390/inventions4030039
AMA Style
Sultan V, Hilton B. How May Location Analytics Be Used to Enhance the Reliability of the Smart Grid? Inventions. 2019; 4(3):39. https://doi.org/10.3390/inventions4030039
Chicago/Turabian StyleSultan, Vivian, and Brian Hilton. 2019. "How May Location Analytics Be Used to Enhance the Reliability of the Smart Grid?" Inventions 4, no. 3: 39. https://doi.org/10.3390/inventions4030039