
Innovative Maritime Uncrewed Systems and Satellite Solutions for Shallow Water Bathymetric Assessment


1
NATO Maritime Geospatial, Meteorological and Oceanographic Centre of Excellence, 1249-093 Lisbon, Portugal
2
Department of Mechanical Engineering, Faculty of Engineering, “Dunărea de Jos” University of Galati, 800008 Galati, Romania
3
Instituto Hidrográfico, 1249-093 Lisbon, Portugal
*
Author to whom correspondence should be addressed.
Inventions 2024, 9(1), 20; https://doi.org/10.3390/inventions9010020
Submission received: 29 December 2023
/
Revised: 28 January 2024
/
Accepted: 29 January 2024
/
Published: 5 February 2024
(This article belongs to the Special Issue From Sensing Technology towards Digital Twin in Applications)
Abstract
:Shallow water bathymetry is a topic of significant interest in various fields, including civil construction, port monitoring, and military operations. This study presents several methods for assessing shallow water bathymetry using maritime uncrewed systems (MUSs) integrated with advanced and innovative sensors such as Light Detection and Ranging (LiDAR) and multibeam echosounder (MBES). Furthermore, this study comprehensively describes satellite-derived bathymetry (SDB) techniques within the same geographical area. Each technique is thoroughly outlined with respect to its implementation and resultant data, followed by an analytical comparison encompassing their accuracy, precision, rapidness, and operational efficiency. The accuracy and precision of the methods were evaluated using a bathymetric reference survey conducted with traditional means, prior to the MUS survey and with cross-comparisons between all the approaches. In each assessment of the survey methodologies, a comprehensive evaluation is conducted, explaining both the advantages and limitations for each approach, thereby enabling an inclusive understanding for the reader regarding the efficacy and applicability of these methods. The experiments were conducted as part of the Robotic Experimentation and Prototyping using Maritime Unmanned Systems 23 (REPMUS23) multinational exercise, which was part of the Rapid Environmental Assessment (REA) experimentations.
1. Introduction
The domain characterized by shallow waters, where the dynamic interplay between the sea and land is particularly pronounced, constitutes a critically significant region for a multitude of hydrographic, oceanographic, and topographic survey applications. This encompassing domain is instrumental in supporting various endeavors including coastal construction, marine safety assurance, resource assessment and development, fisheries and marine industries, marine transportation and shipping logistics, environmental preservation, and management, as well as research pertaining to the coastal zones of islands or peninsulas [1,2,3,4,5,6,7].
Traditional methodologies for the measurement of bathymetry in shallow waters primarily rely on shipborne single-beam or multibeam echosounders (MBES) [8], airborne Light Detection and Ranging (LiDAR) [9], Synthetic Aperture Radar (SAR) [10], SAR-based techniques to extract bathymetric features, and optical remote sensing [11,12], with each approach presenting a distinct set of advantages and limitations.
MUSs are increasingly being integrated into military operations, serving either as a supplementary addition to traditional vessel operations or as an autonomous solution for conducting environmental monitoring [13]. This trend reflects the growing reliance on technologically advanced methodologies in naval strategies [14,15]. The military objectives of the North Atlantic Treaty Organization (NATO) extend to crisis response, peace support, humanitarian operations, and conventional warfighting, thereby fundamentally altering the demands of military environmental support [16]. The dynamic nature of these operations, often characterized by short notice and deployment in highly variable, inadequately monitored, and potentially hostile physical environments, underscores the requirement for dynamic and responsive processes to provide operational environmental information.
The hydrographic surveys delineated in this study are not confined solely to operational applications within the military domain; rather, they find utility in civilian contexts, particularly in the realm of coastal mapping. Coastal mapping stands as a fundamental tool essential for supporting coastal engineering efforts [17]. It constitutes a primary component in the ongoing monitoring and assessment of both shorelines and coastal regions. This practice enables the identification of areas particularly susceptible to alterations induced by erosion, thereby facilitating the efficient and cost-effective management of shore protection strategies. In instances of protected shores, coastal mapping facilitates expeditious verification of the functionality and efficacy of applied reinforcement, thereby enhancing engineering practices. Consequently, the efficacy of coastal management is contingent upon the consistent monitoring and mapping of coastal environments [18].
The presented experiments form an integral component of the activities conducted within the framework of the 2023 edition of the REPMUS multinational exercise [19]. The REPMUS exercise series is a multinational initiative wherein collaborative efforts among military entities, industry, academia, and other institutions are orchestrated to experiment with the deployment of MUSs for both military and civilian applications. The system integration of vehicles, sensors, and survey methodologies represents an innovative solution for conducting environmental surveys in a shallow water domain, particularly in the vicinity of a coastal site, with the specific objective of a fast environmental assessment. REA is a concept that is widely used in the military domain, to rapidly assess the area of operations before a military operation, or in civilian use for disaster research or any other monitoring activity of the environment [20].
The uncrewed systems employed in this evaluation consist of surface and aerial uncrewed systems integrated with state-of-the-art commercial off-the-shelf and prototype sensors specifically engineered for shallow and medium water bathymetric measurements. The application of conventional crewed survey techniques is characterized by significant financial implications and limited time efficiency. This can be effectively complemented by the comprehensive utilization of MUSs, which can deliver precise results in shallow water environments, achieving this with a reduced personnel risk and a substantial decrease in time and cost.
In conjunction with the surveys conducted using surface and aerial uncrewed systems, an evaluation of SDB was undertaken. The escalating availability of satellite remote sensing data, particularly from satellites such as WorldView, Landsat, Airbus, and Sentinel, has contributed to the advancement of bathymetric assessments through remote sensing technology. SDB involves utilizing multispectral satellite images and mathematical models, often of linear, polynomial, exponential, or similar nature, derived from radiative transfer formulas. Subsequently, the model is applied to calculate the depth of the water body under consideration [21].
The conceptualization of this study was based on addressing the common limitations and deficiencies characteristic to the domain of shallow water hydrographic surveying:
- The traditional crewed hydrographic survey activities are disadvantaged by significant requisites for human and financial resources.
The main contributions of this study are to address the above-mentioned challenges using cutting-edge MUSs for rapid shallow water hydrographic surveys:
- A novel integration of a medium-depth multibeam sonar with an Unmanned Surface Vehicle (USV) was successfully trialed in a shallow water environment.
- The challenging surf zone area was rapidly surveyed with high accuracy using an innovative LiDAR survey Uncrewed Aerial System (UAS).
- Advanced SDB techniques demonstrated the capability to produce high-resolution products, facilitating remote assessments in hydrographic surveying.
Recent studies have concentrated on the use of MUSs for hydrographic surveys [26], cartographic and safety of navigation aspects [27,28,29], and geomorphological surveys using UAVs [30] of shallow water bathymetry, using commercial or innovative bathymetric sensors [31], emphasizing the accuracy and precision of the data collected.
In contrast, this study concentrates on the rapid and accurate evaluation of the depths in any environmental context, including the surf zone, with the objective of enabling prompt task execution using innovative integrations of MUSs and bathymetric sensors, combined with recent remote sensing technology methods. The focus of the study is not predominantly on the cartographic rigor of the collected data. Overall, the paper aims to contribute to promoting the effectiveness of the use of MUSs in challenging shallow areas of surveying, thus improving the monitoring capability in areas of interest.
This article is organized in the following manner: Section 2 provides a description of the bathymetric survey areas, followed by a description of the MUSs used, including technical specifications, survey parameter details, and data processing methodologies. Section 3 is devoted to the presentation of the survey outcomes for each methodology, with an emphasis on the statistical characterization of the resultant bathymetric surfaces. Additionally, a discussion pertaining to comparative evaluations with a reference survey area and the corresponding nautical chart is expressed. Finally, Section 4 delineates the summarizing conclusions and outlines prospective directions for future research.
2. Materials and Methods
2.1. Description of the Study Area
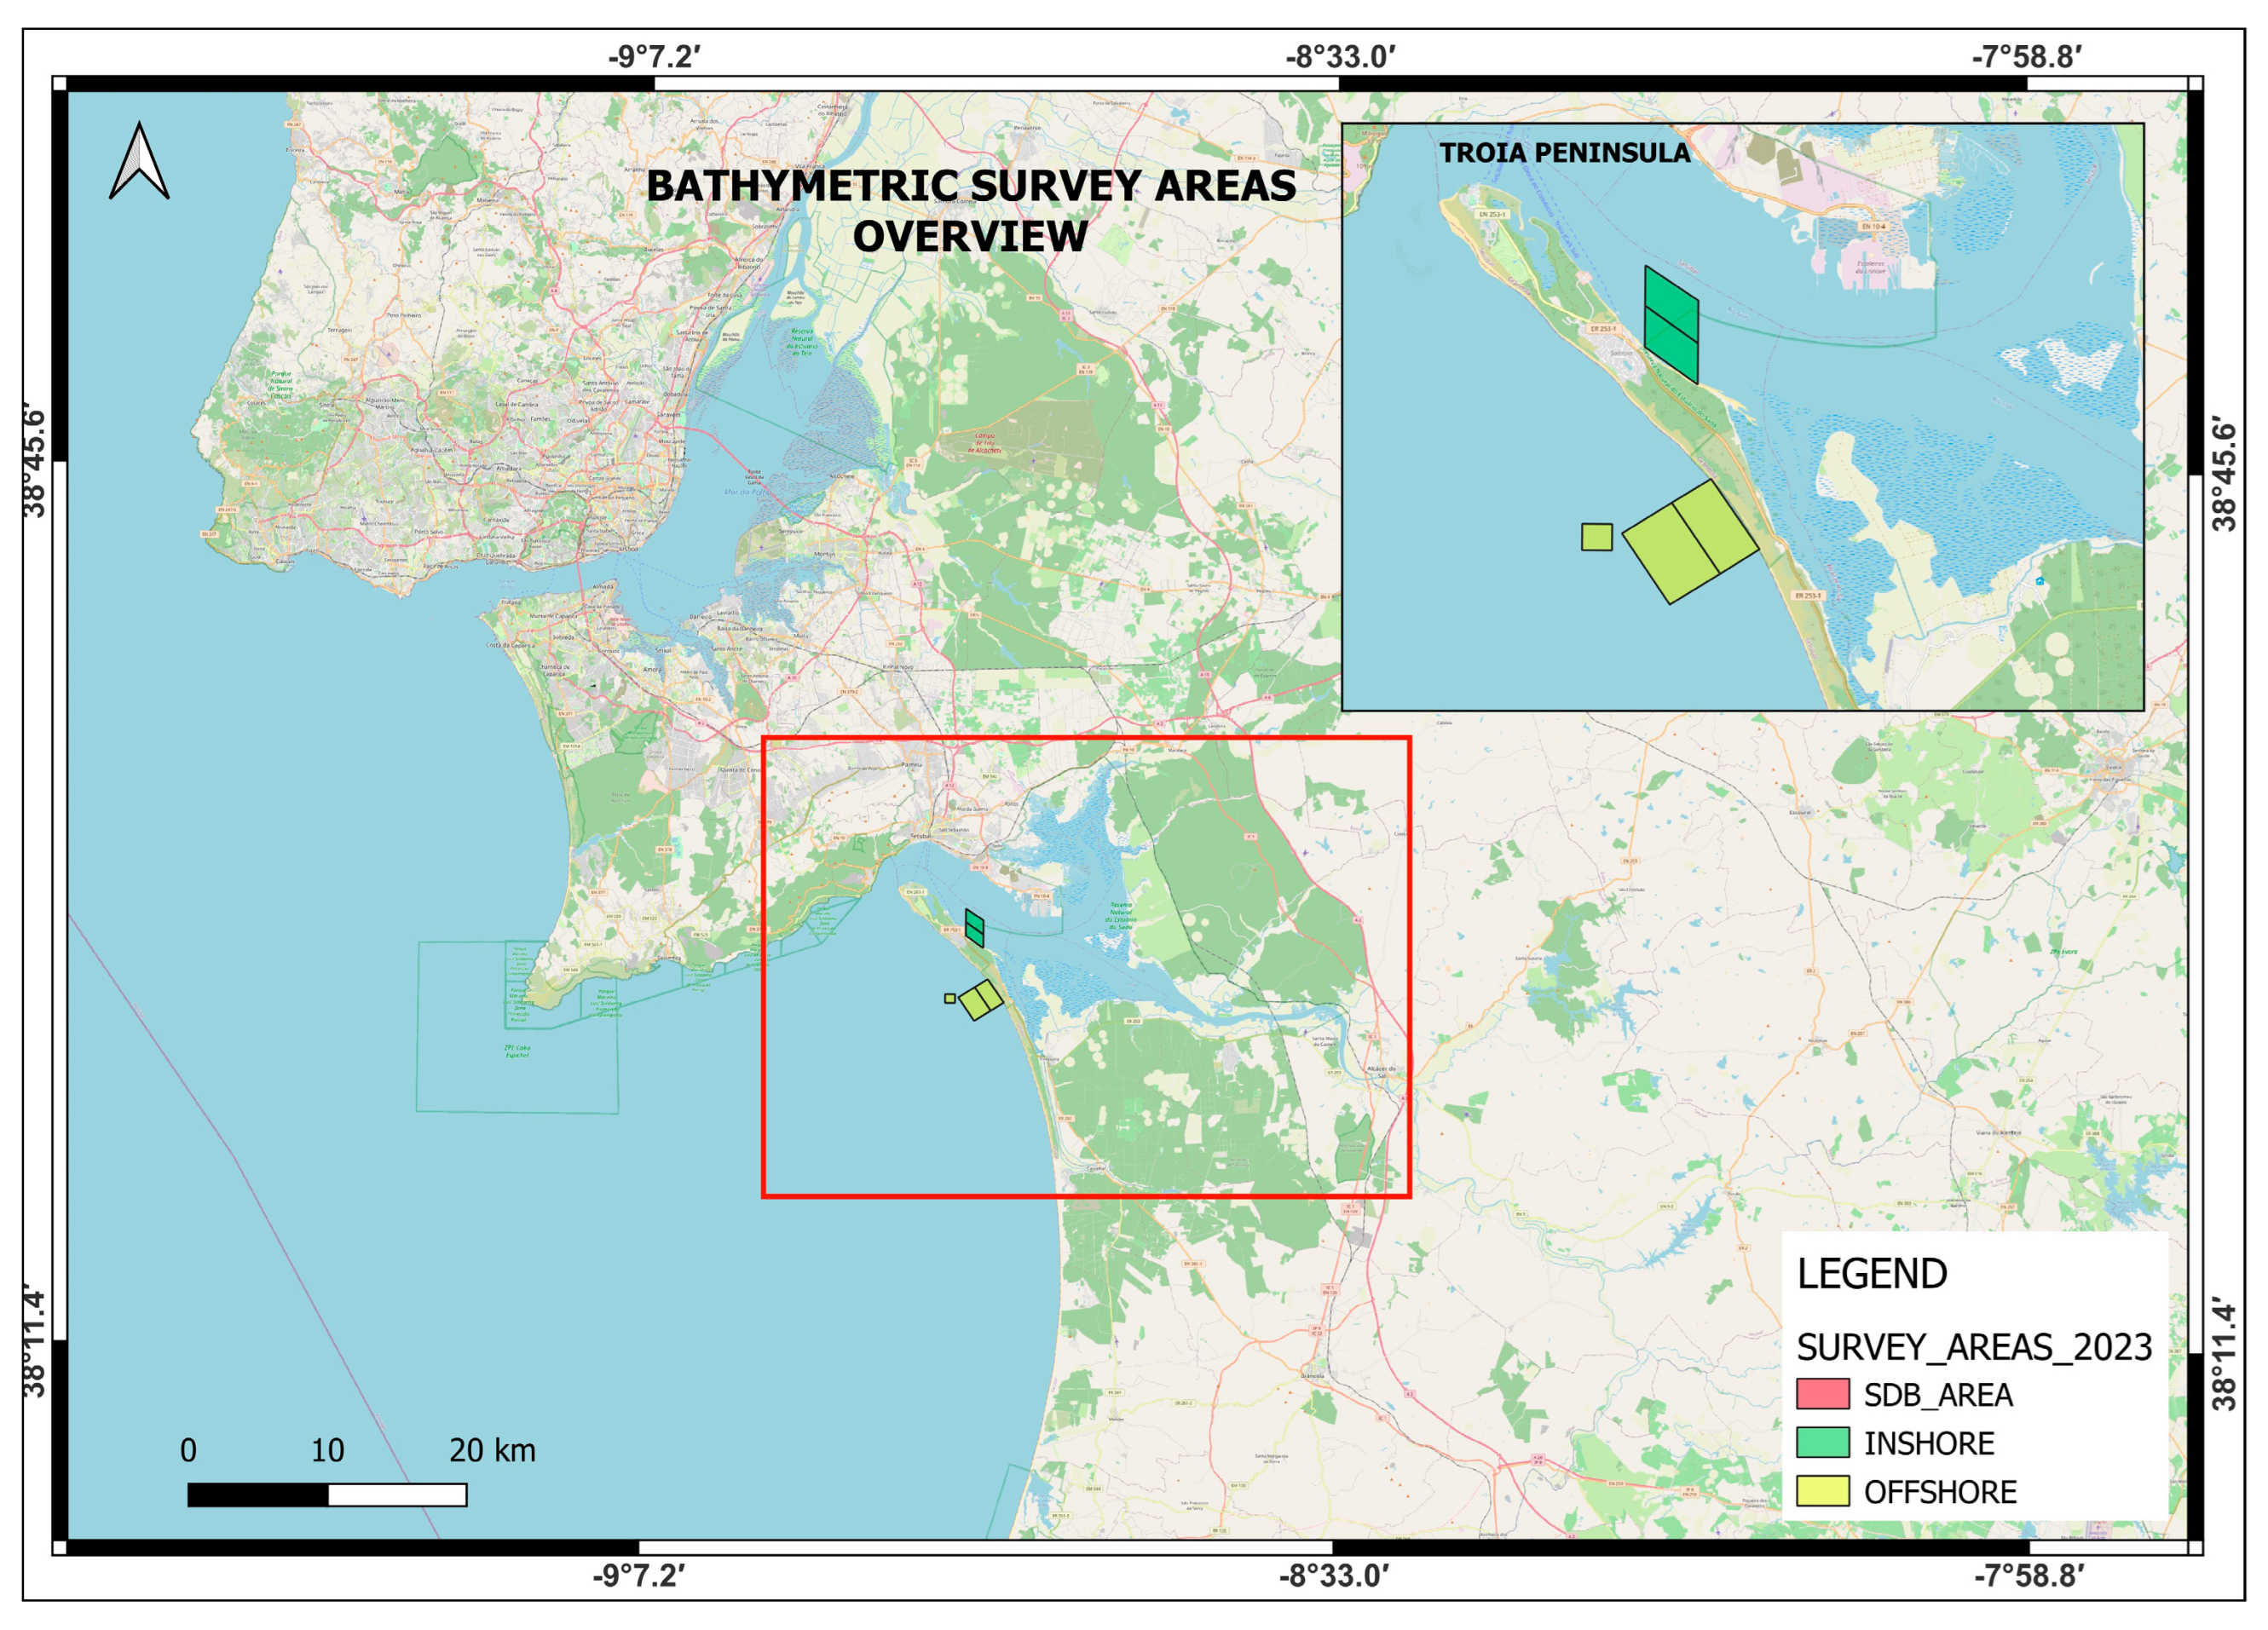
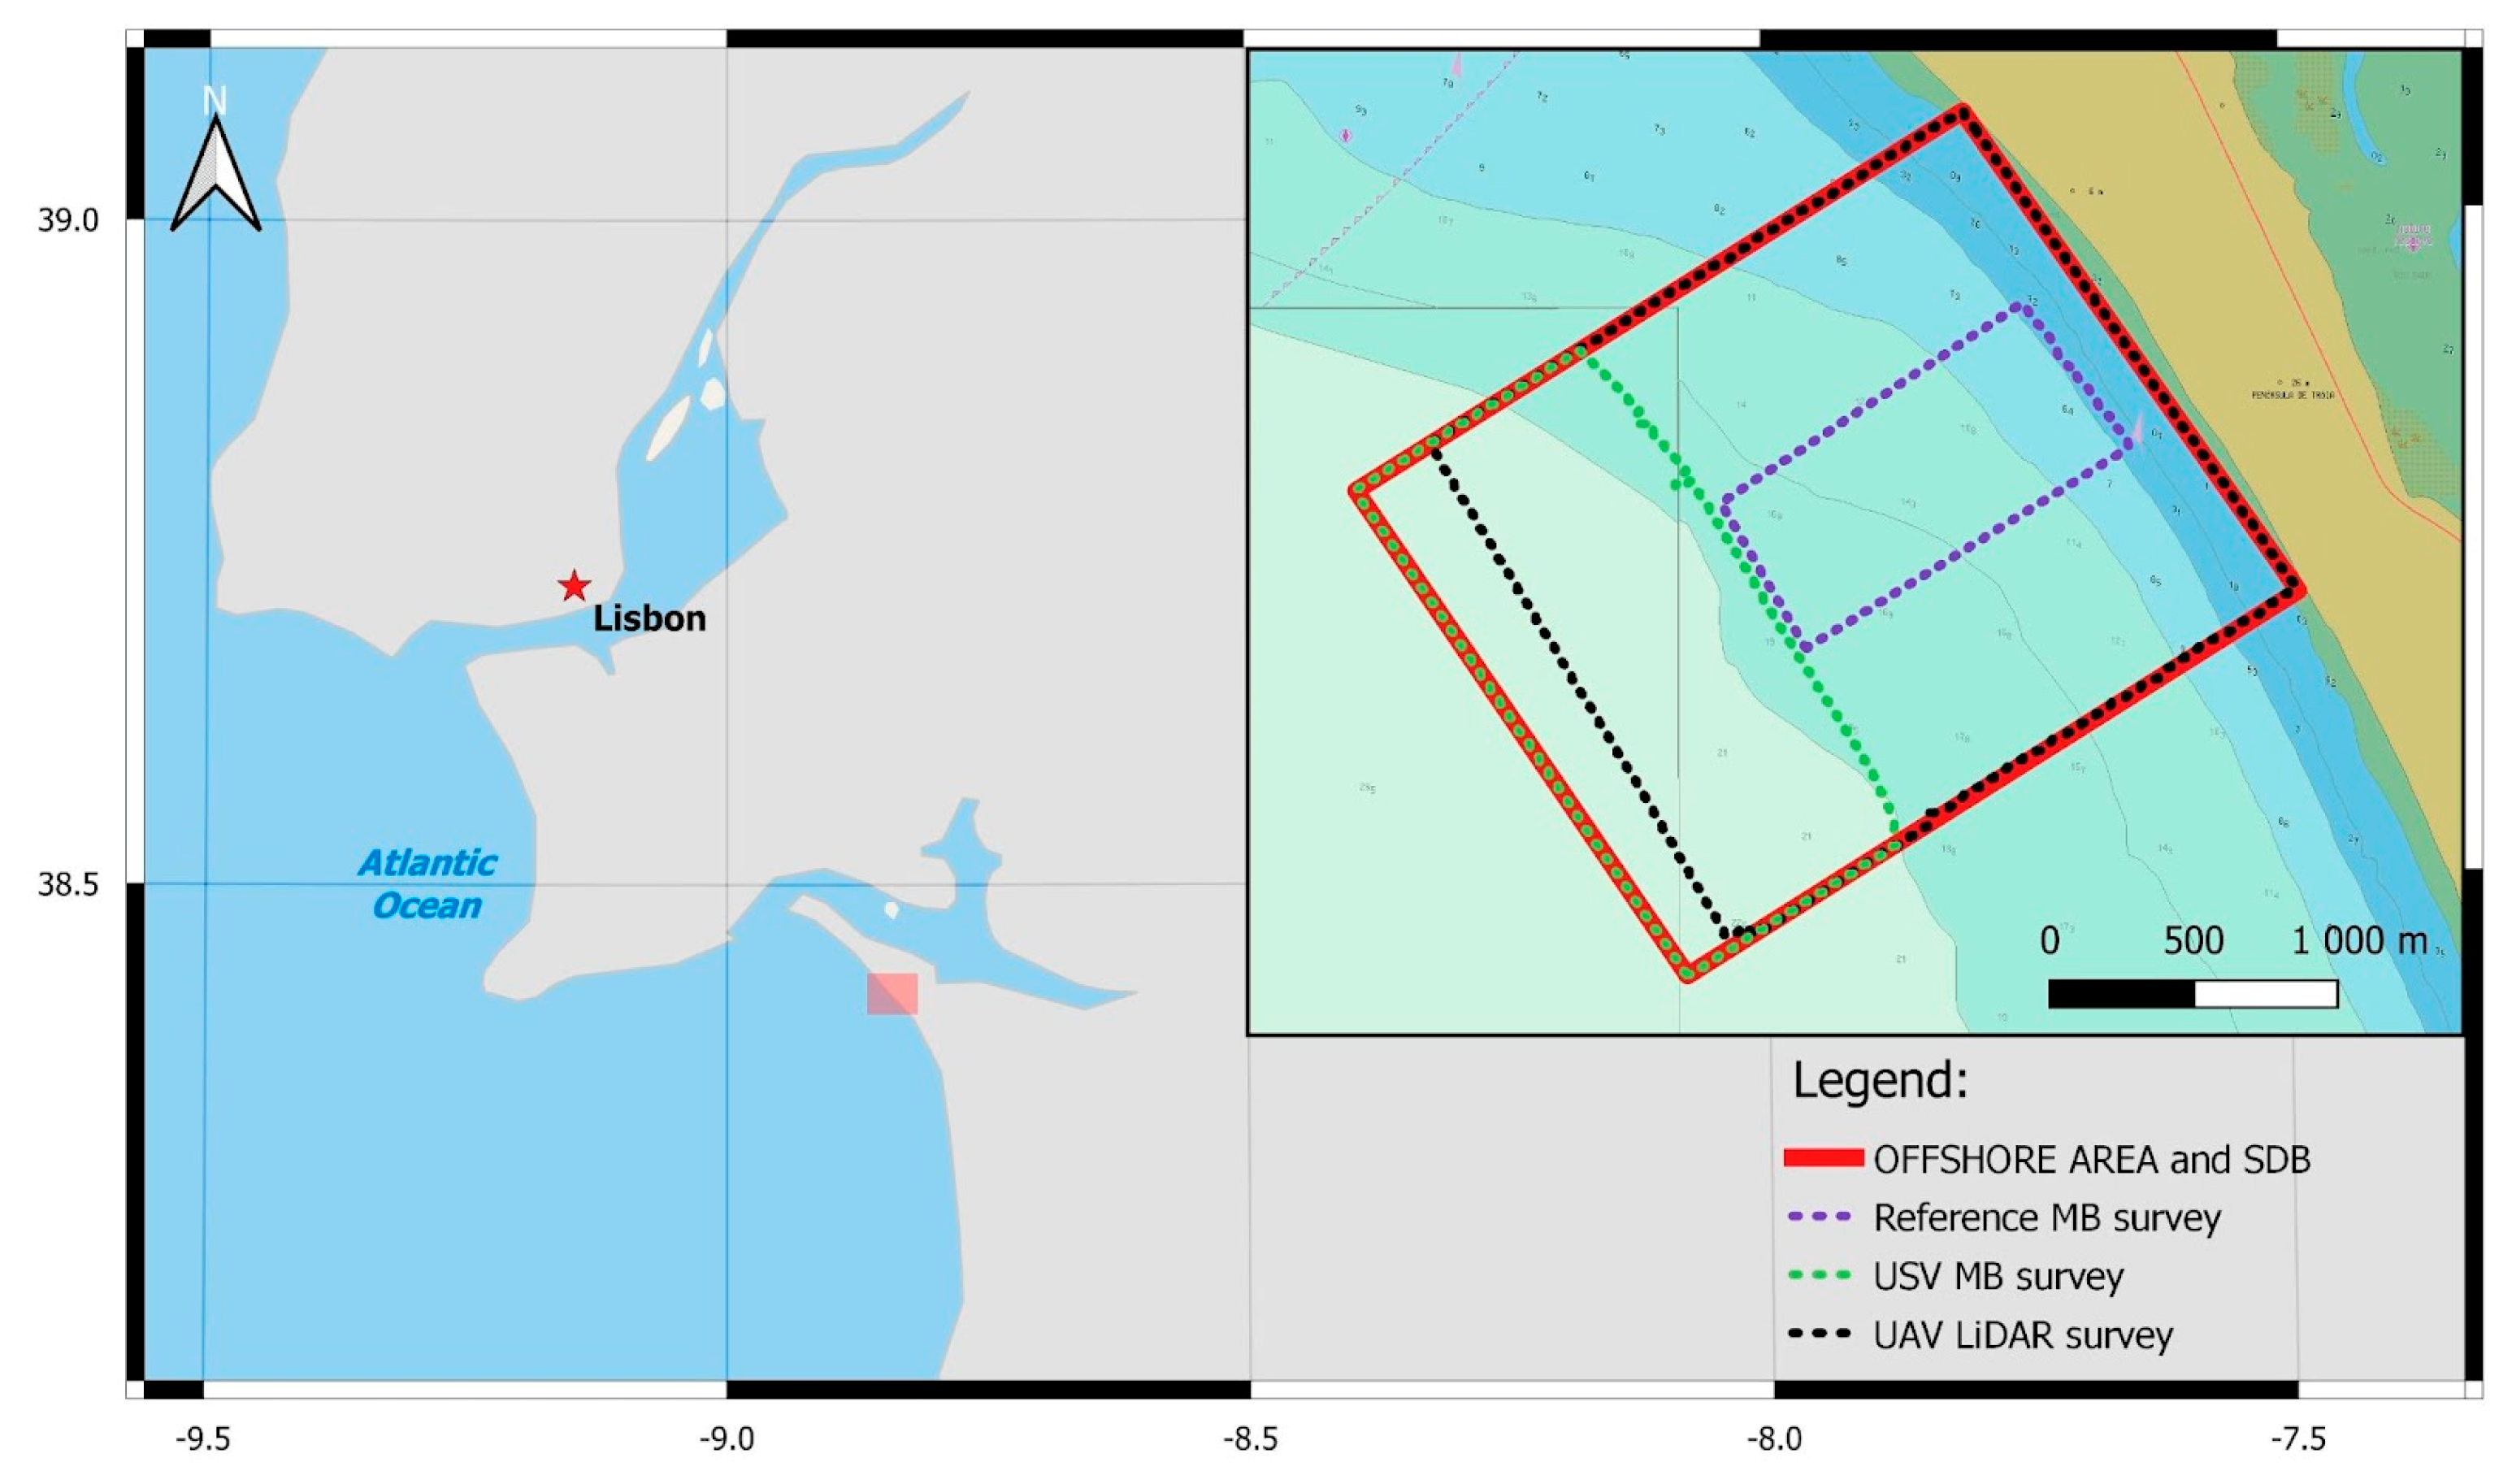
The study area is located in the western part of Portugal, in the Sado River estuary, as illustrated in Figure 1. The Sado estuary is the second largest Portuguese estuary and one of the largest in Europe, representing a substantial estuarine system, covering approximately 212.4 km2, being characterized by a distinctive combination of natural aesthetics and biodiversity [32]. Troia Peninsula is situated in the mouth of the Sado River, separating the estuary from the Atlantic Ocean, with a 20 km long sand spit on the mouth of the Sado estuary, and with a SSE-NNW orientation.
The operational experiments were divided into two demanding scenarios, denoted as “Scenario REA inshore” and “Scenario REA offshore”, as illustrated in Figure 1.
2.1.1. Meteorological and Oceanographic (METOC) Conditions during the Hydrographic Surveys
During the survey operations, executed from the 11th to the 15th of September 2023, meteorological conditions were continuously monitored via data sourced from the proximate Setúbal weather station, managed by the Instituto Português do Mar e da Atmosfera (IPMA) [33]. During this interval, wind velocities consistently registered below 3 m/s, predominantly emanating from the southwest, though transitioning to the east on the 14th. The prevalence of these gentle wind conditions favored the stability of both UAV flights and USV operations. Precipitation was sparse throughout the duration of the survey, with a mere two hourly instances recorded on the 11th, none coinciding with the survey timings. This absence of significant rainfall mitigated potential disturbances in the LiDAR’s interaction with surface water turbulence, as well as the impact on echosounder performance, particularly concerning rapid alterations in the sound velocity profile, thereby preserving the accuracy of the collected bathymetric data. Air temperatures ranged from 16.8 to 27.9 °C during the survey period. The humidity peaked at 96.2% on the night of the 11th and gradually decreased to a minimum of 50.2% on the 15th.
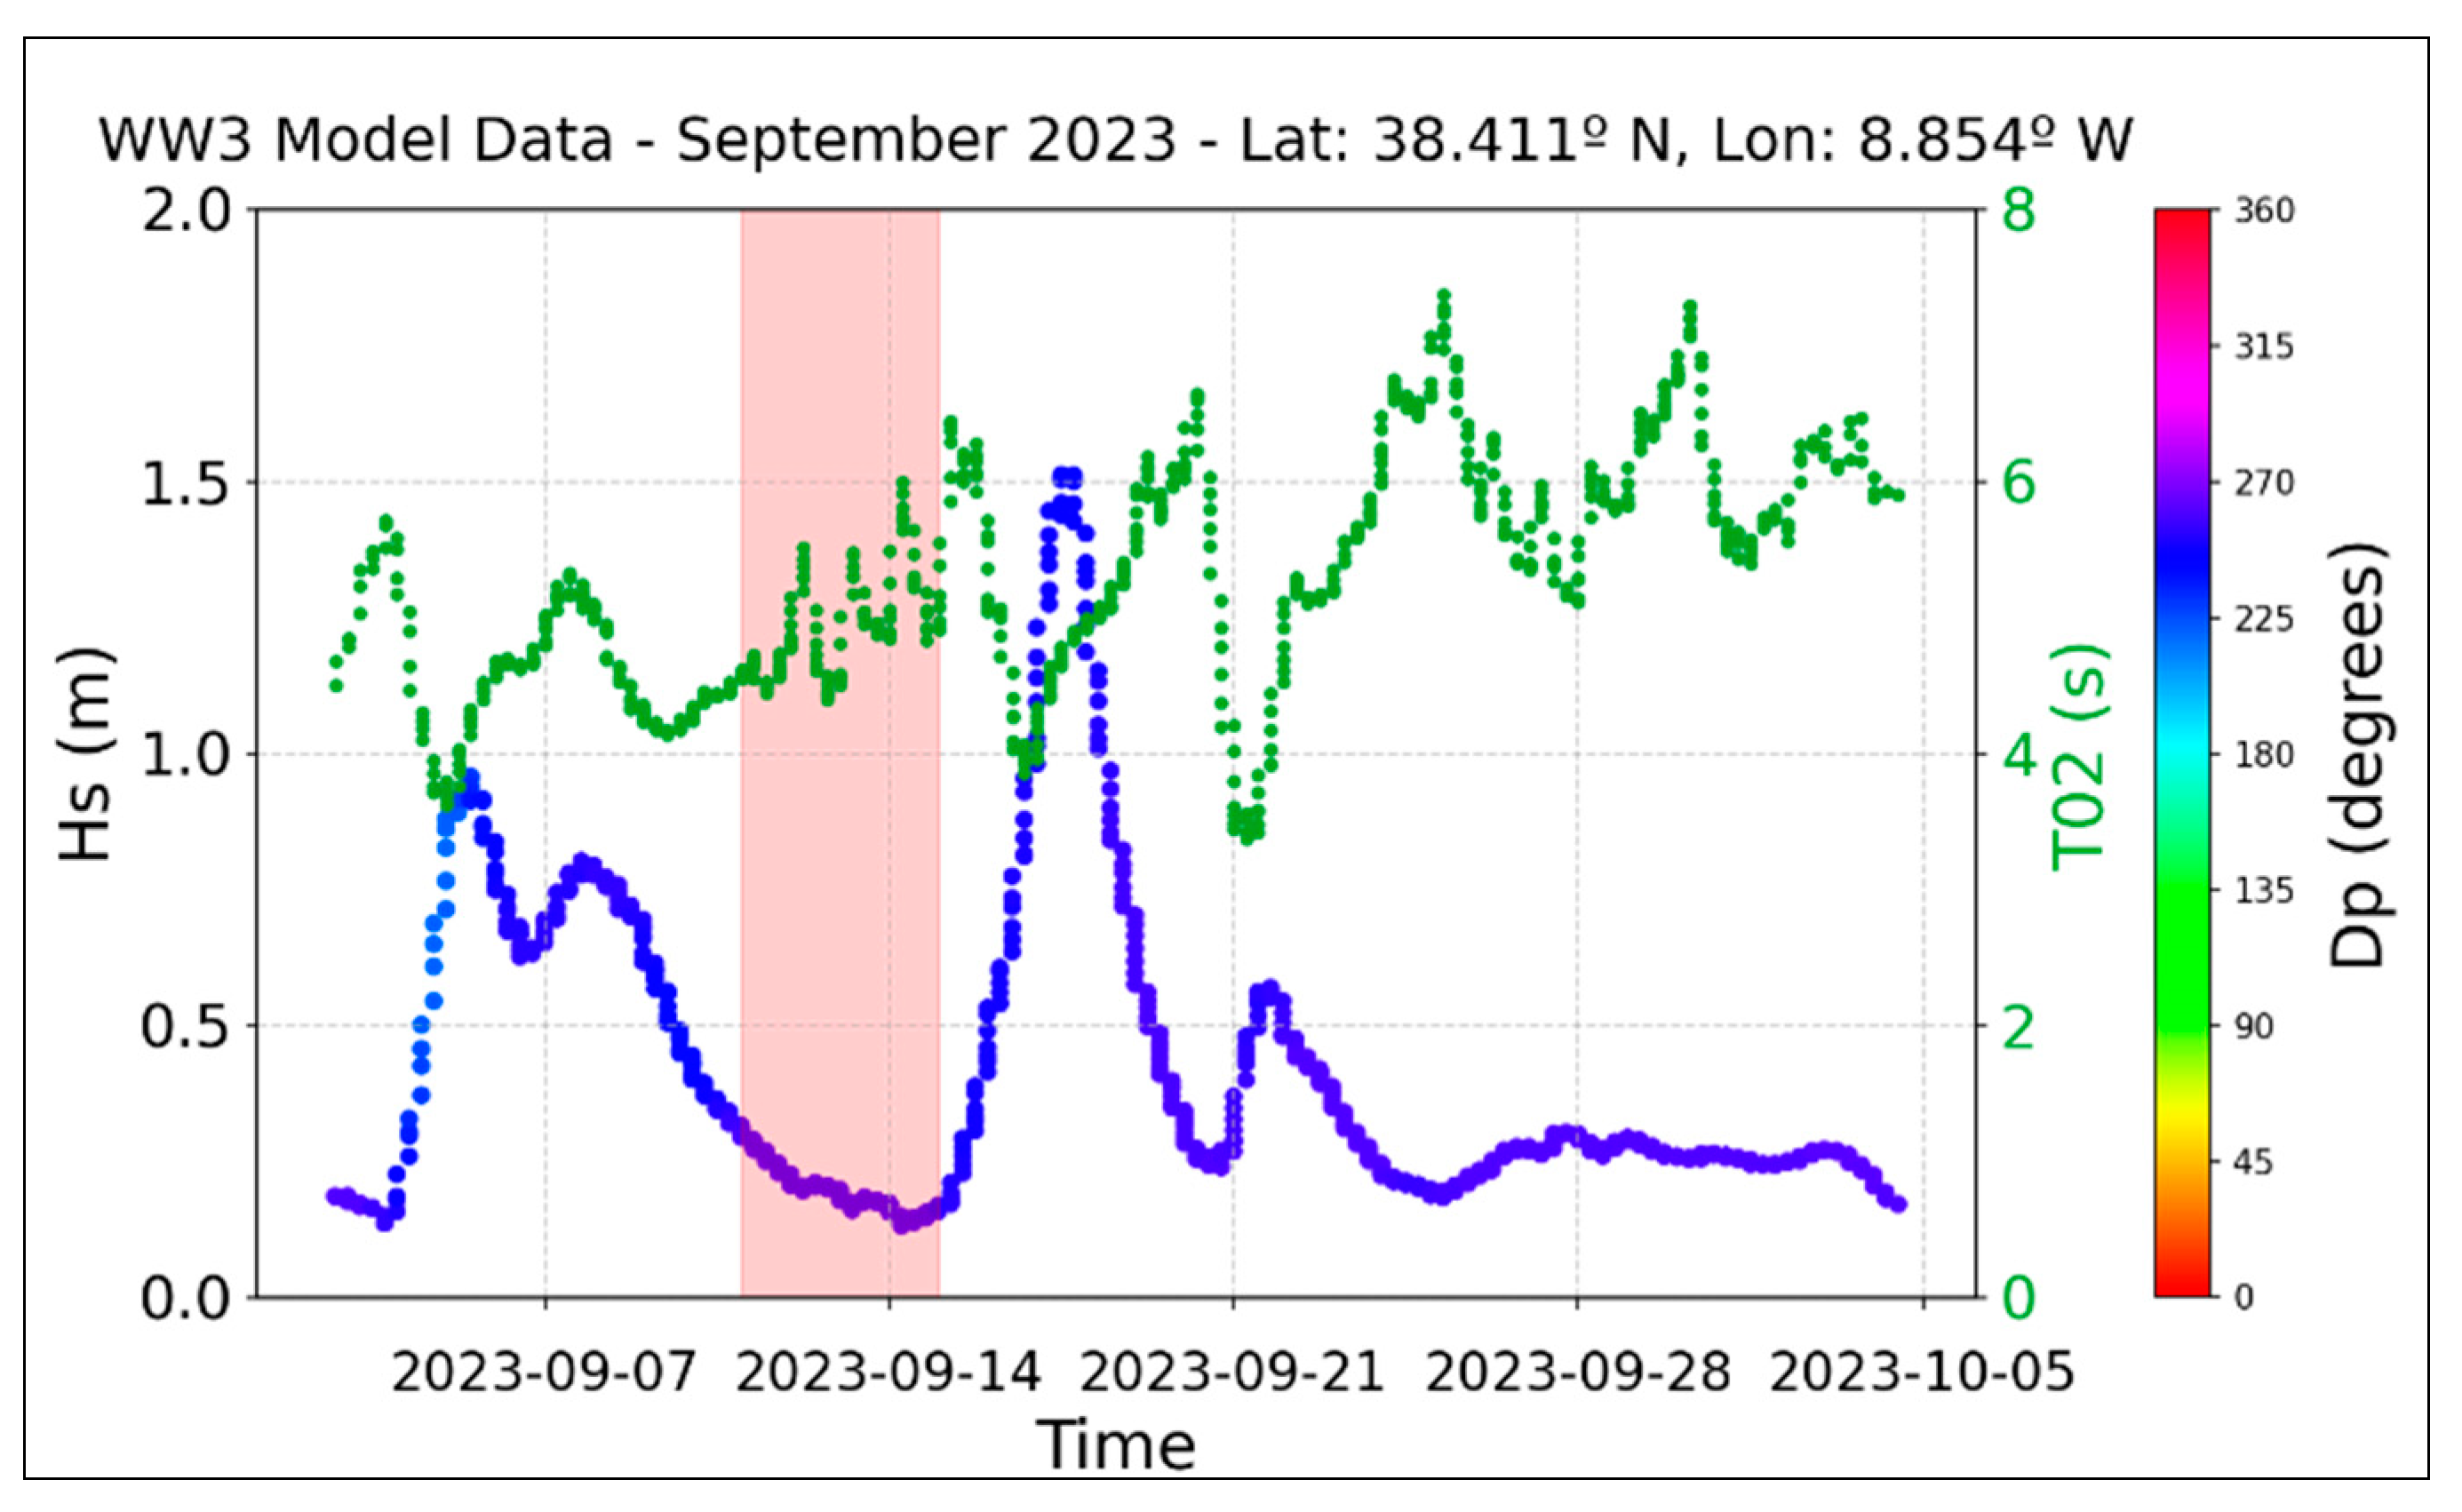
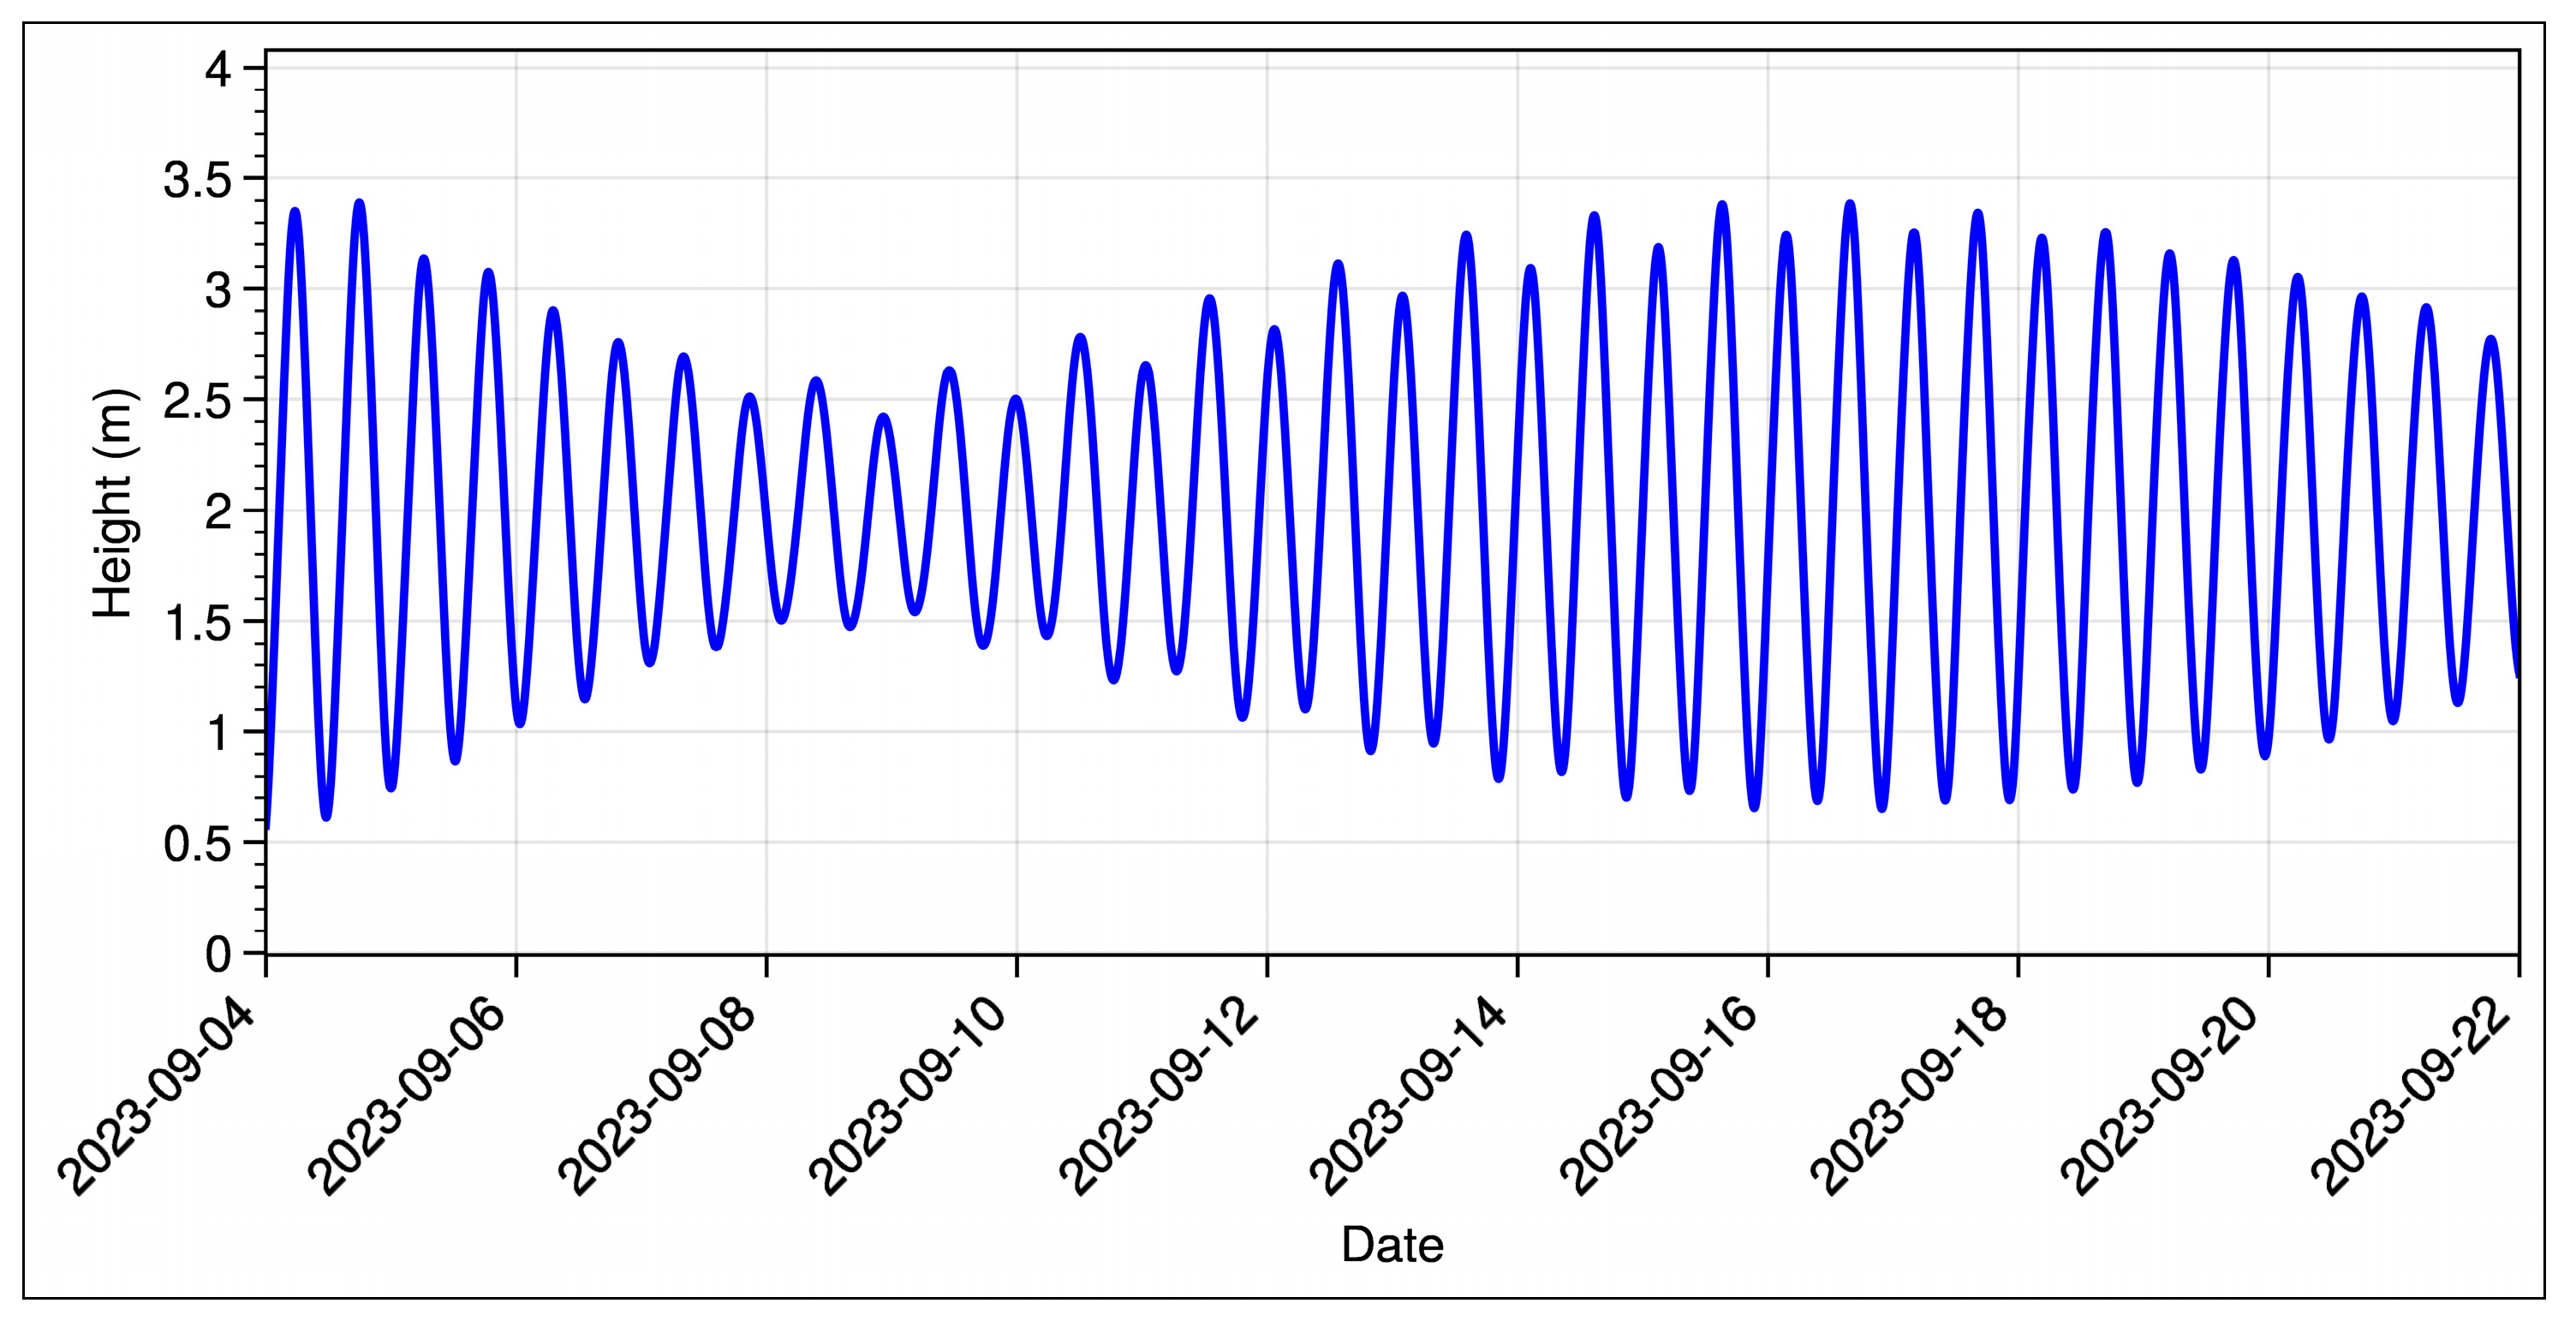
In terms of oceanographic conditions, the survey area is shielded from swell originating from the north and northwest, common directions for swell reaching the Portuguese West Coast, due to the forcing of the wind generated by the Azores High-Pressure System. Although no wave buoy was moored near the survey area, the Wave Watch 3 model run by the Portuguese Hydrographic Institute was monitored daily and represented the conditions found on the field. The model time series, depicted in Figure 2, from the nearest point to the survey area indicated that the significant wave height (Hs) during the survey periods remained below 0.5 m. The mean period (T02) was 5.3 s, with the waves coming from the southwest quadrant. This suggests favorable oceanographic conditions with minimal wave disturbance during the survey timeframe.
2.1.2. Challenges of the Hydrographic Surveys in the Study Area
The inshore scenario was played inside the Sado River estuary waters. The Sado estuary represents an exceptional natural phenomenon situated within the geographical confines of Portugal, precisely within the Setúbal region along the southwestern coastal expanse of the country. It is distinguished by the presence of extensive intertidal zones, which encompass approximately one-third of its total area and feature a more intricate bathymetric configuration [34].
The primary source of freshwater input into the Sado estuary is derived from the Sado River, which enters via the Alcácer Channel, mixing with the salty ocean waters, impacting the physical properties of the water column in the area. Additionally, several minor tributaries contribute to the estuarine system, with the Marateca Stream assuming particular significance in this context [35].
Surveying in shallow waters may present a range of hazards, including the potential for interactions between the survey vessel and/or its instrumentation with the seabed and obstructions, as well as the presence of rapid currents in the vicinity of structural impediments, such as dams and intakes. Additionally, environmental factors, encompassing suboptimal Global Navigation Satellite System (GNSS) signal reception in areas adjacent to towering structures, coupled with water conditions characterized by increased turbidity or the presence of air bubbles, can profoundly compromise the integrity of the data acquired [36]. The prevalent environmental conditions in the survey area did not pose substantial impediments to the GNSS signal reception; notably, the beach area is characterized by a gradual incline extending from the land portion to the oceanic boundary.
With the increase in water turbidity, the growth of suspended and dissolved particulates intensifies the attenuation of light, thereby affecting the light incident upon specific sensors. This degradation in light induces alterations in the spectral properties of the satellite imagery and LiDAR sensors, potentially leading to diminished image contrast. Consequently, this can compromise the precision of mapping shallow water depths, as the accuracy in delineating these regions is adversely impacted, with high turbidity levels [37].
In this investigation, it was observed that the maximum penetration depth achievable with Sentinel-2 satellite imagery for precise bathymetric measurement is constrained to 12 m, a limitation attributable to the specific oceanographic conditions (transparency of the waters) prevalent in the study area. Within the specified area of study, located at a distance 6 nautical miles SSE from the mouth of Sado River estuary, the efflux of the Sado River did not pose constraints on the optical properties of the water, as the transparency of the water column facilitated LiDAR penetration to nearly 30 m in depth. The performance of the LiDAR system was first assessed in the turbid conditions of the Sado River; nonetheless, it was discerned that the system’s capability to penetrate was stalled by the abundance of suspended particulates and the exceedingly shallow water depths, which complicated the distinction between the surface return and the seabed return signals of the laser system.
The acoustic performance of multibeam echosounders can be compromised by the presence of suspended particulate matter, a condition commonly observed in waters with high turbidity. In such environments, the acoustic pulses emitted by the transducers are susceptible to reflecting off the suspended particulates, consequently generating false echoes within the collected dataset. In the context of the study area, this phenomenon was not observed. Consequently, the structural integrity of the water column did not present any issues in this specific setting.
2.2. MUS and Hydrographic Surveys Characterization
The employment of the platforms and sensors used in this study represents the integration of cutting-edge technological advancements and progressive methodologies in hydrographic surveying such as the LiDAR UAV and MBES USV surveys. This is complemented by the application of a remote sensing technique that undergoes continual refinement, aimed at granting increasingly precise bathymetric outcomes.
2.2.1. Reference Hydrographic Survey
A bathymetric survey conducted with a crewed vessel was used to generate the reference bathymetric model, to benchmark the datasets acquired with uncrewed systems by direct comparisons of the surfaces and cross-comparisons between all the resultant surfaces.
2.2.2. LiDAR UAV Survey
The Pushbroom Imaging LiDAR for Littoral Surveillance (PILLS) system represents a collaborative research initiative supported by the Office of Naval Research (ONR) and the Naval Air Systems Command (NAVAIR), operating within the framework of the Small Business Innovation Research (SBIR) program [38]. This endeavor has achieved notable success in the development and demonstration of an aerial LiDAR bathymetric capability, utilizing advanced Streak Tube Imaging LiDAR (STIL) technology provided by the Areté company [39]. The ongoing project encompasses the creation of a high-resolution, high-dynamic-range camera, the integration of an additional Areté-manufactured AIRTRAC Laser to enhance Pulse Rate Frequency (PRF), and the implementation of an onboard real-time processor.
Most bathymetric LiDAR systems, including those in use in most ALB systems, are efficient over a very limited temperature range; thus, they require a chiller to keep the system working at an adequate temperature range. The PILLS Areté laser has a unique athermal design that requires only air ventilation, which removes all the weight and bulk associated with cooling systems. Second, most ALB systems scan the ocean with a spinning mirror to direct the laser beam in an elliptical pattern. Areté’s new sensor is configured in a pushbroom configuration, which requires no moving parts.
For the past decade, the PILLS sensor system has gone through five design iterations ranging from initial prototyping to commercial variants deployed for hydrographic surveys by the Fugro company, with the commercial name Rapid Airborne Multibeam Mapping System (RAMMS) [39]. The hardware development (Table 1 and Table 2) points out the technological advancements such as the high repetition scan rate (60 Hz), achieved with two AITRAC lasers inside the systems to provide a higher accuracy and precision of the hydrographic data.
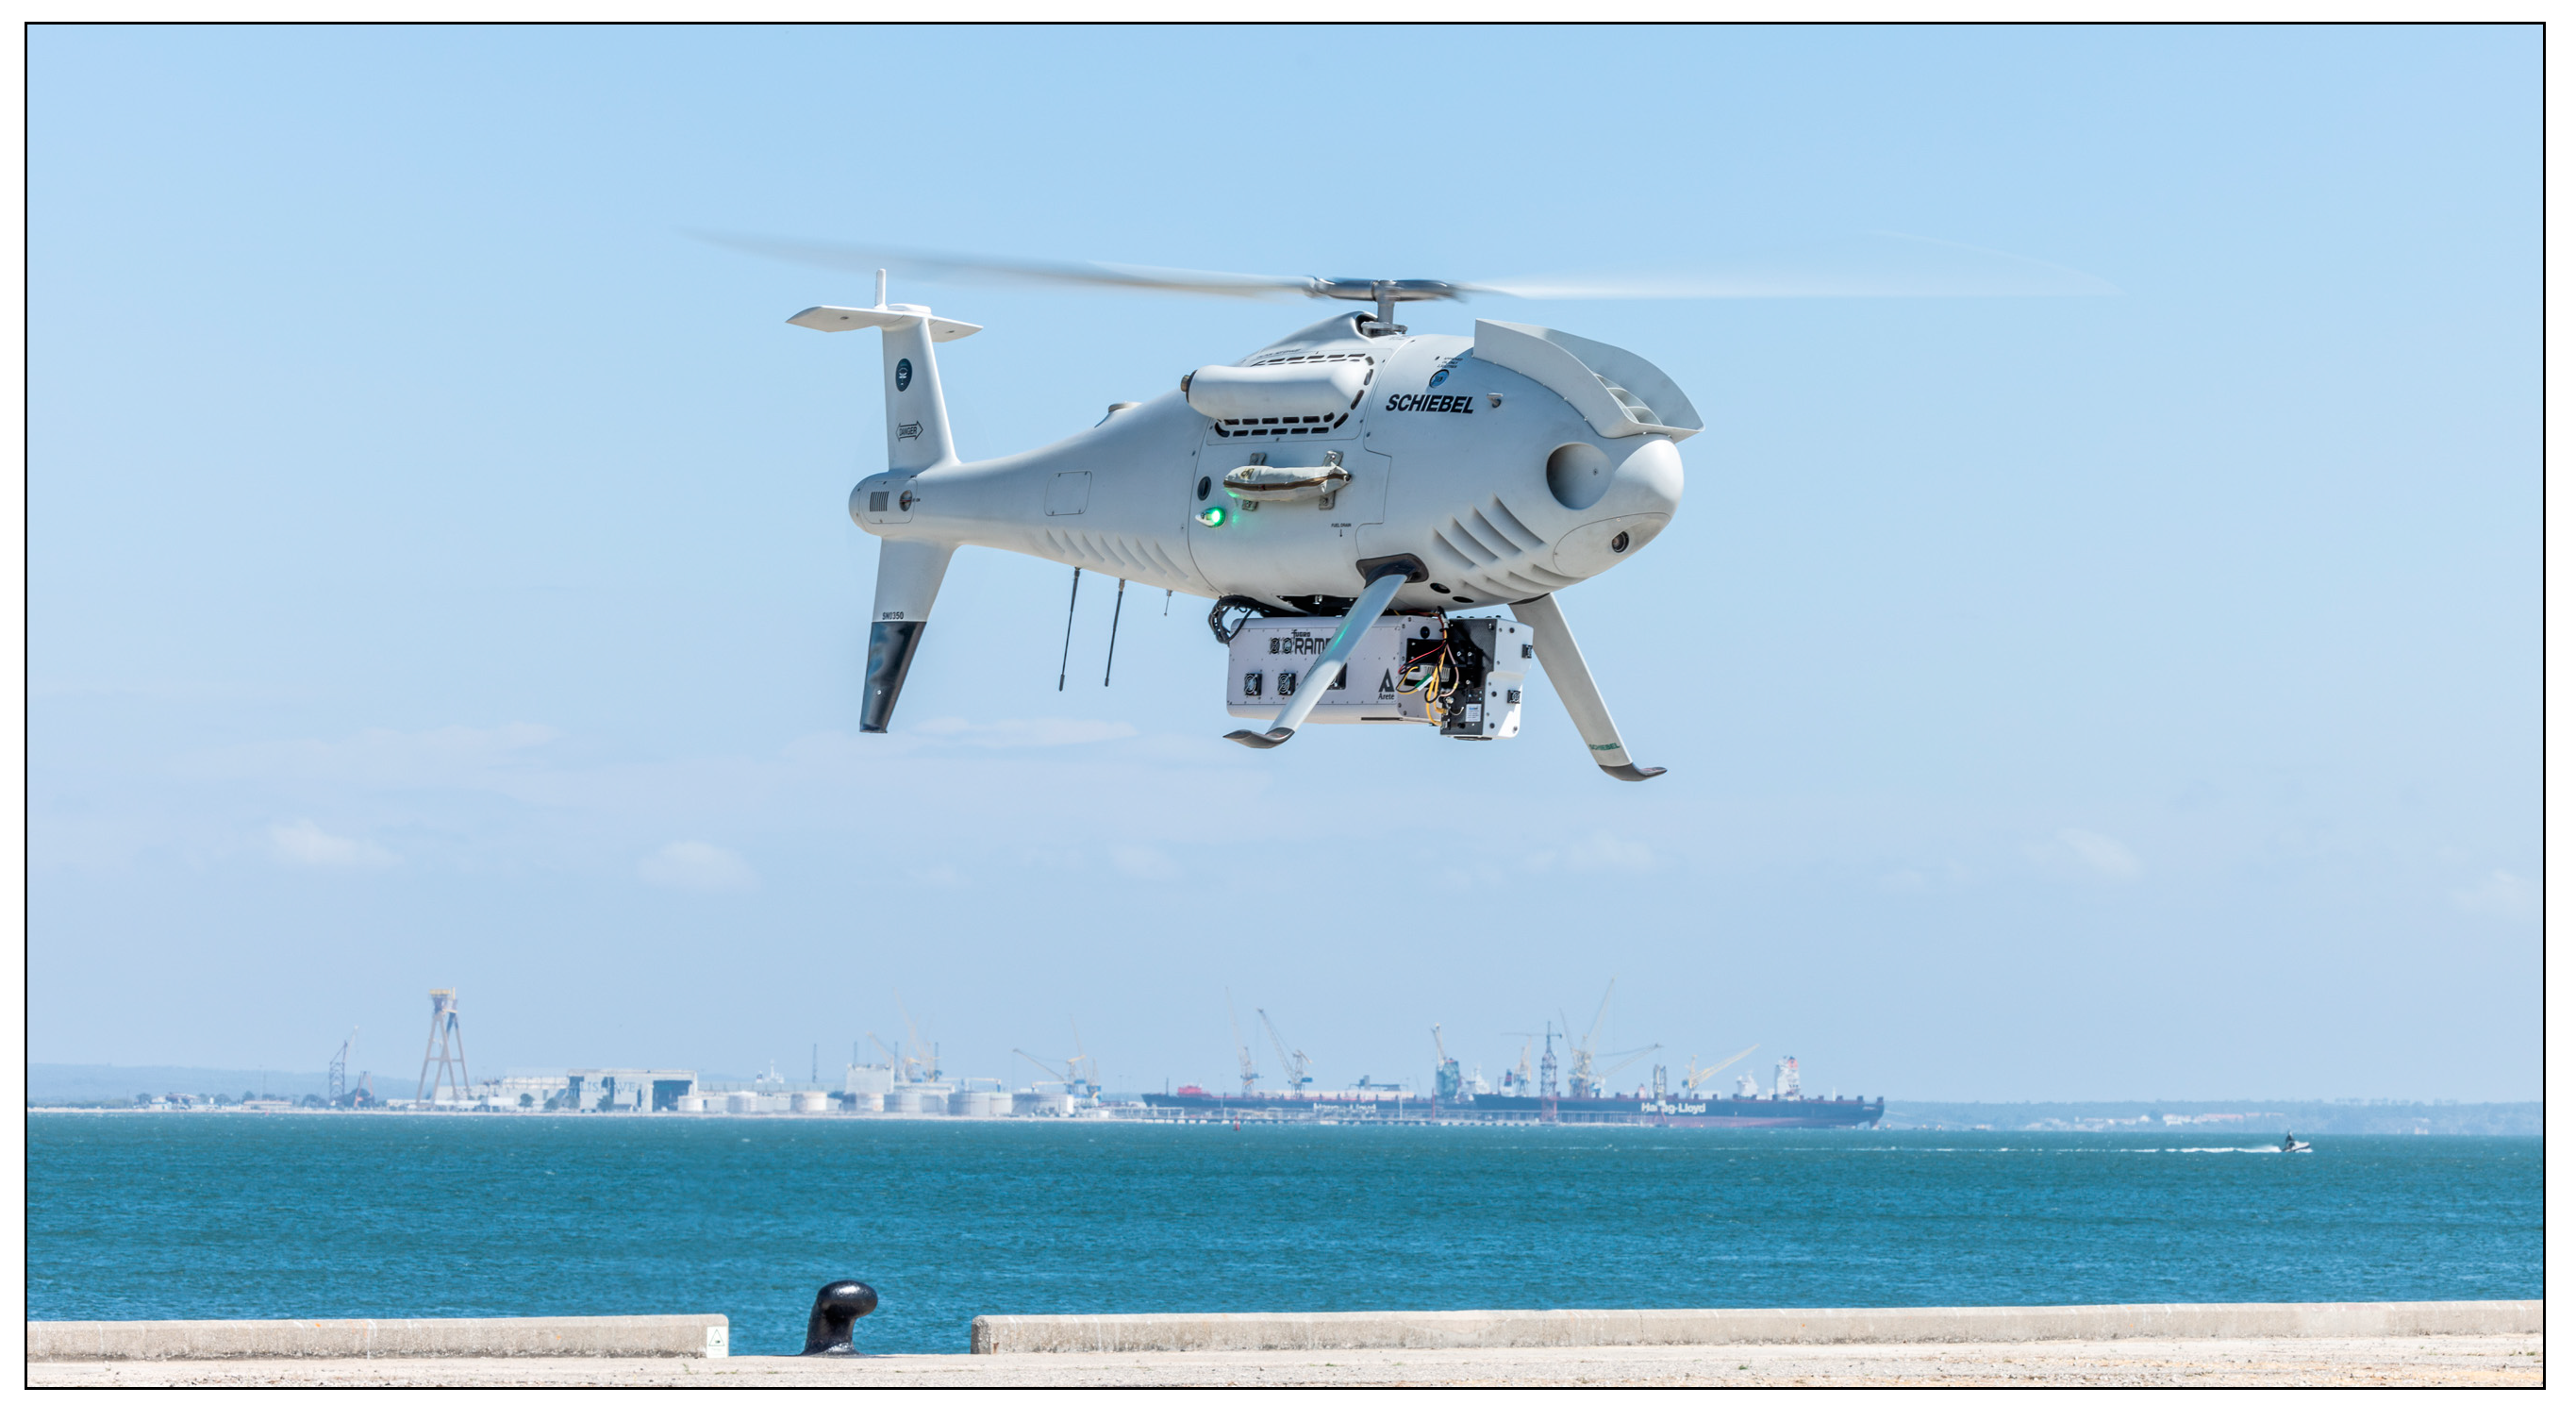
This system has been deployed on nine different commercial aircrafts, underscoring its versatility and adaptability. Furthermore, flight testing has been conducted using UAS, featuring the Seahunter UAS (Griffon Aerospace, Madison, AL, USA) and the Schiebel CAMCOPTER® S-100 (Schiebel, Vienna, Austria). Notably, the S-100 UAS (Figure 3), which is presently in use by 45 countries, boasts a compact design and impressive payload capacity of 110 pounds, supplemented by a 1 kW power output and sufficient volume, all of which obviates the need for additional launch or recovery equipment for land- or ship-based operations [40].
The integration of the Areté Pills LIDAR system was initially tested as a proof of concept in 2021, as a demonstration for the US Navy. The UAS introduced in this research represents an innovative integration within this specific LiDAR configuration. Additionally, the LiDAR system possesses distinctive technical attributes and employs unique processing methodologies, crucial for the acquisition of precise bathymetric data. Topo-bathymetric LiDAR surveys are recognized for their efficacy in conducting fast surveys in coastal regions characterized by clear waters, a context exemplified in this study. The unique LiDAR sensor, incorporated within the mature Schiebel CAMCOPTER® S-100 UAV, demonstrated its reliability as a system for rapid and precise surveying. Nonetheless, the operational capabilities of UAVs are generally constrained by meteorological factors, particularly wind and precipitation. However, such conditions did not impede the survey operations in the context of this research. The system incorporates a specialized Real-Time Kinematic (RTK) GNSS for accurate mapping, operating autonomously from the aircraft systems. The PILLS system requires a significantly reduced power input compared to contemporary LiDAR systems utilized on manned aircraft yet yields a mapping performance of a comparable caliber when deployed from a compact UAV. Moreover, the system is refined to function effectively amidst the high shock and vibration conditions that are characteristic of ship-launched and recovered uncrewed aerial vehicles [42].
The LIDAR UAV survey started with the inshore scenario, for the Sado River area. Several attempts were made to survey this area, but as expected, the LIDAR system showed its limitations in penetrating the turbid waters of the river, so it only managed to properly survey the land area near the riverside. However, this survey provided good training for the operators of both the Schiebel CAMCOPTER® S-100 UAV and the PILLS (RAMMS) LiDAR system, allowing for the determination of the real limitations and capabilities of these systems.
The combined accuracy and precision derived from the LiDAR technology depend upon the meticulous assembly and calibration of the triad of system components: the GNSS, the Inertial Navigation System (INS), and the laser scanner system. Boresight angles represent the angular discrepancies in the X, Y, and Z axes between the scanner frame and the INS frame, quantified at the central juncture of the INS body frame. The boresight calibration was conducted in the first days of tests inside the inshore area.
The PILLS (RAMMS) system, without mirrors or moving components, emits pulses of diffused laser energy towards the water surface, which then penetrate the water column and are subsequently reflected off the seabed. As the laser light propagates, it diverges laterally relative to the flight direction, thereby collecting data across a swath width approximately equivalent to the altitude of the flight, 115 m, in the case of this survey. The inbound signal is subsequently concentrated into a streak tube receiver, where it undergoes beam formation into up to 900 individual segments (beams), collectively encompassing the entire waveform. This swath-coverage approach shows a close resemblance to the operational mechanisms of vessel-based multibeam echosounder systems, generating data of comparable quality. The LiDAR system can produce 24,000 range observations per second and attains a depth penetration equivalent to three times the Secchi disk depth. The single laser pulse emitted by RAMMS accomplishes what would conventionally require hundreds of pulses in a traditional LiDAR system. These 2-dimensional returns of the inbound signal are gathered with each laser discharge along the track, facilitating the creation of ground or seafloor representations.
The survey flight altitude was limited to 128 m due to safety reasons; however, this resulted in much higher point density of the data. The survey was planned and repeated four times in different tide regimes, to incorporate more data coverage in the drying heights areas. The UAS demonstrated high agility characterized by tight turns at the end of each survey line, facilitating the efficient utilization of airborne time. Nevertheless, these rapid turns lead to swift deceleration and pitch alterations.
2.2.3. USV MB Survey
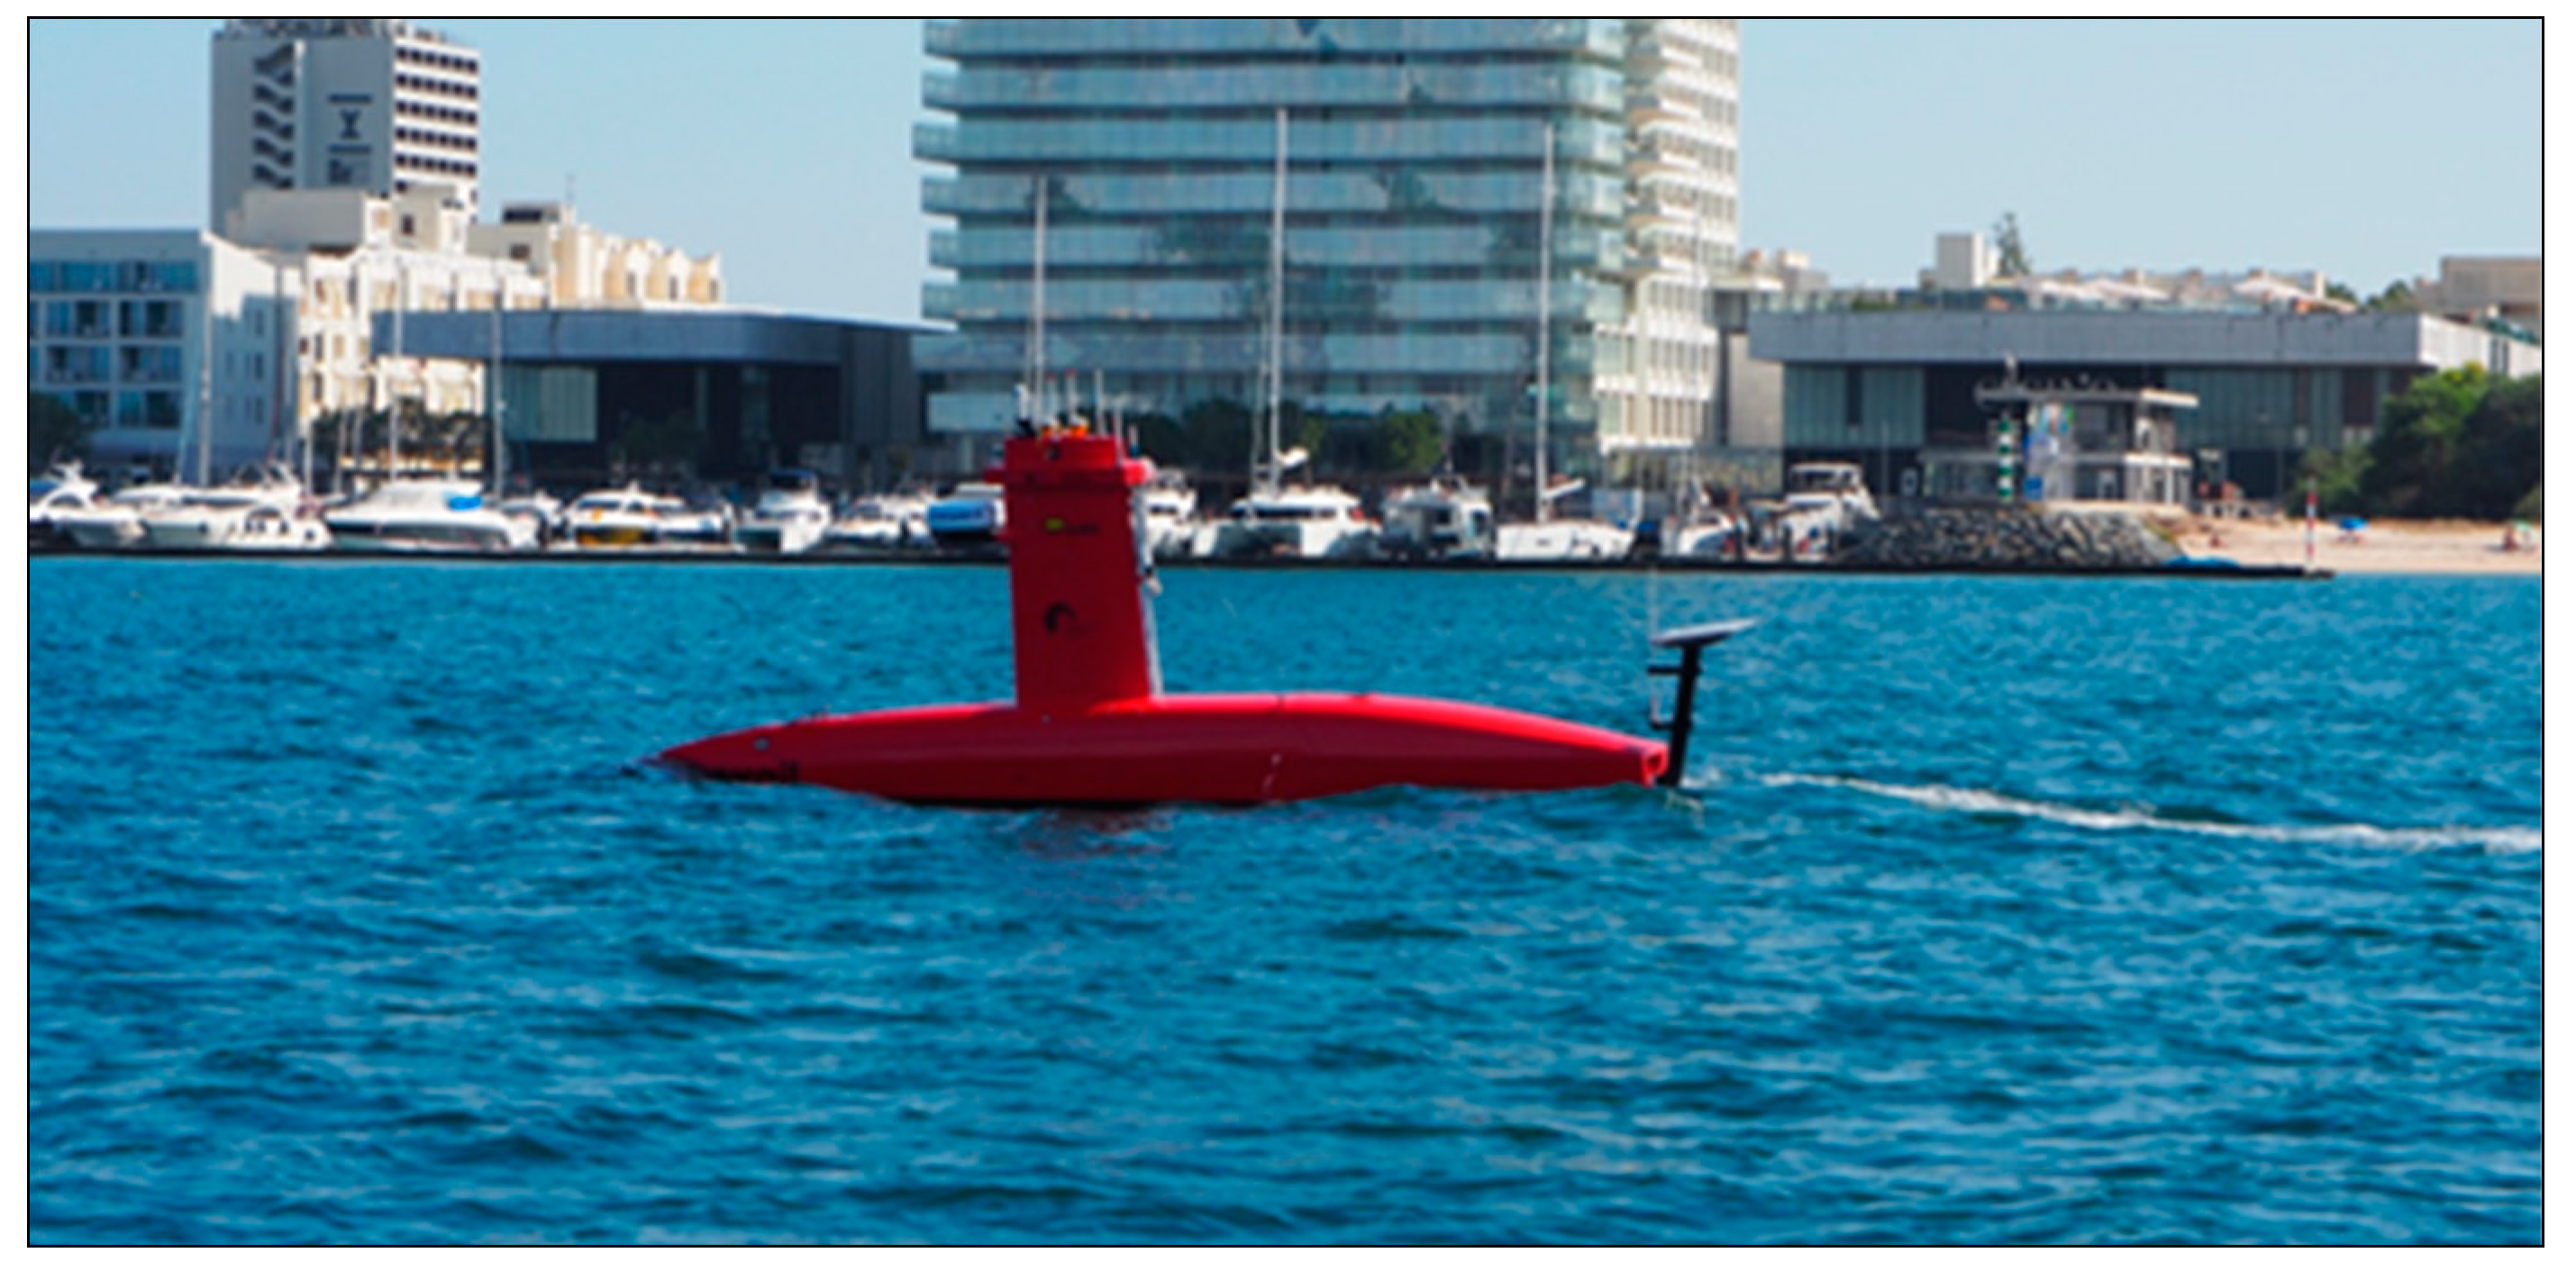
The DriX USV system (Figure 4) was provided by the Agência Regional para o Desenvolvimento da Investigação, Tecnologia e Inovação (ARDITI) which has the primary objectives to provide support for research and experimental development endeavors, facilitate the dissemination of technology, offer training opportunities, and disseminate scientific and technical knowledge. Additionally, ARDITI is committed to executing initiatives that actively contribute to the modernization and advancement of the Autonomous Region of Madeira (RAM) [43].
The DriX USV, manufactured by the French company Exail, has been purposefully engineered to operate with a significant degree of autonomy (up to 7 days at 7 Knots) while being remotely supervised by an operator during its mission execution. DriX USV is characterized by its versatility as an open platform, capable of accommodating a diverse array of payloads within its submerged gondola. Furthermore, it offers robust support for Line of Sight and Over the Horizon operations through its sophisticated multichannel communication infrastructure [44].
The DriX USV was used in the configuration with a Kongsberg EM 712 USV MBES (Table 3), iXblue Phins INS, and the Septentrio GNSS receiver.
The USV is equipped with the Ixblue Phins INS [46], which incorporates an advanced fiber-optic gyroscope (FOG). This technology utilizes the propagation of optical waves within a fiber-optic coil to measure rotational velocity with high accuracy. The INS is seamlessly integrated with the EM 712 USV multibeam echosounder and the Septentrio GNSS. The Septentrio GNSS, installed on the DriX USV, allows for reliable, high-precision Real-Time Kinematic (RTK) positioning, and it exhibits robustness against GNSS jamming and spoofing [47].
While the selection of this survey hardware is established in conventional survey methodologies, the innovation resides in the integration of the advanced hydrographic equipment into a compact USV platform.
The USV commenced its survey in the inshore region, executing an array of tests and verifications, encompassing the patch test, Differential GNSS assessments and validations, communication protocols, and trials for remote data transmission.
Considerable importance was placed on the initial tests and validations, given the novelty and innovative nature of the system in its current configuration. During these preliminary assessments, various errors were identified and rectified, including the apparent misalignment between the Inertial Measurement Unit (IMU) and the MBES.
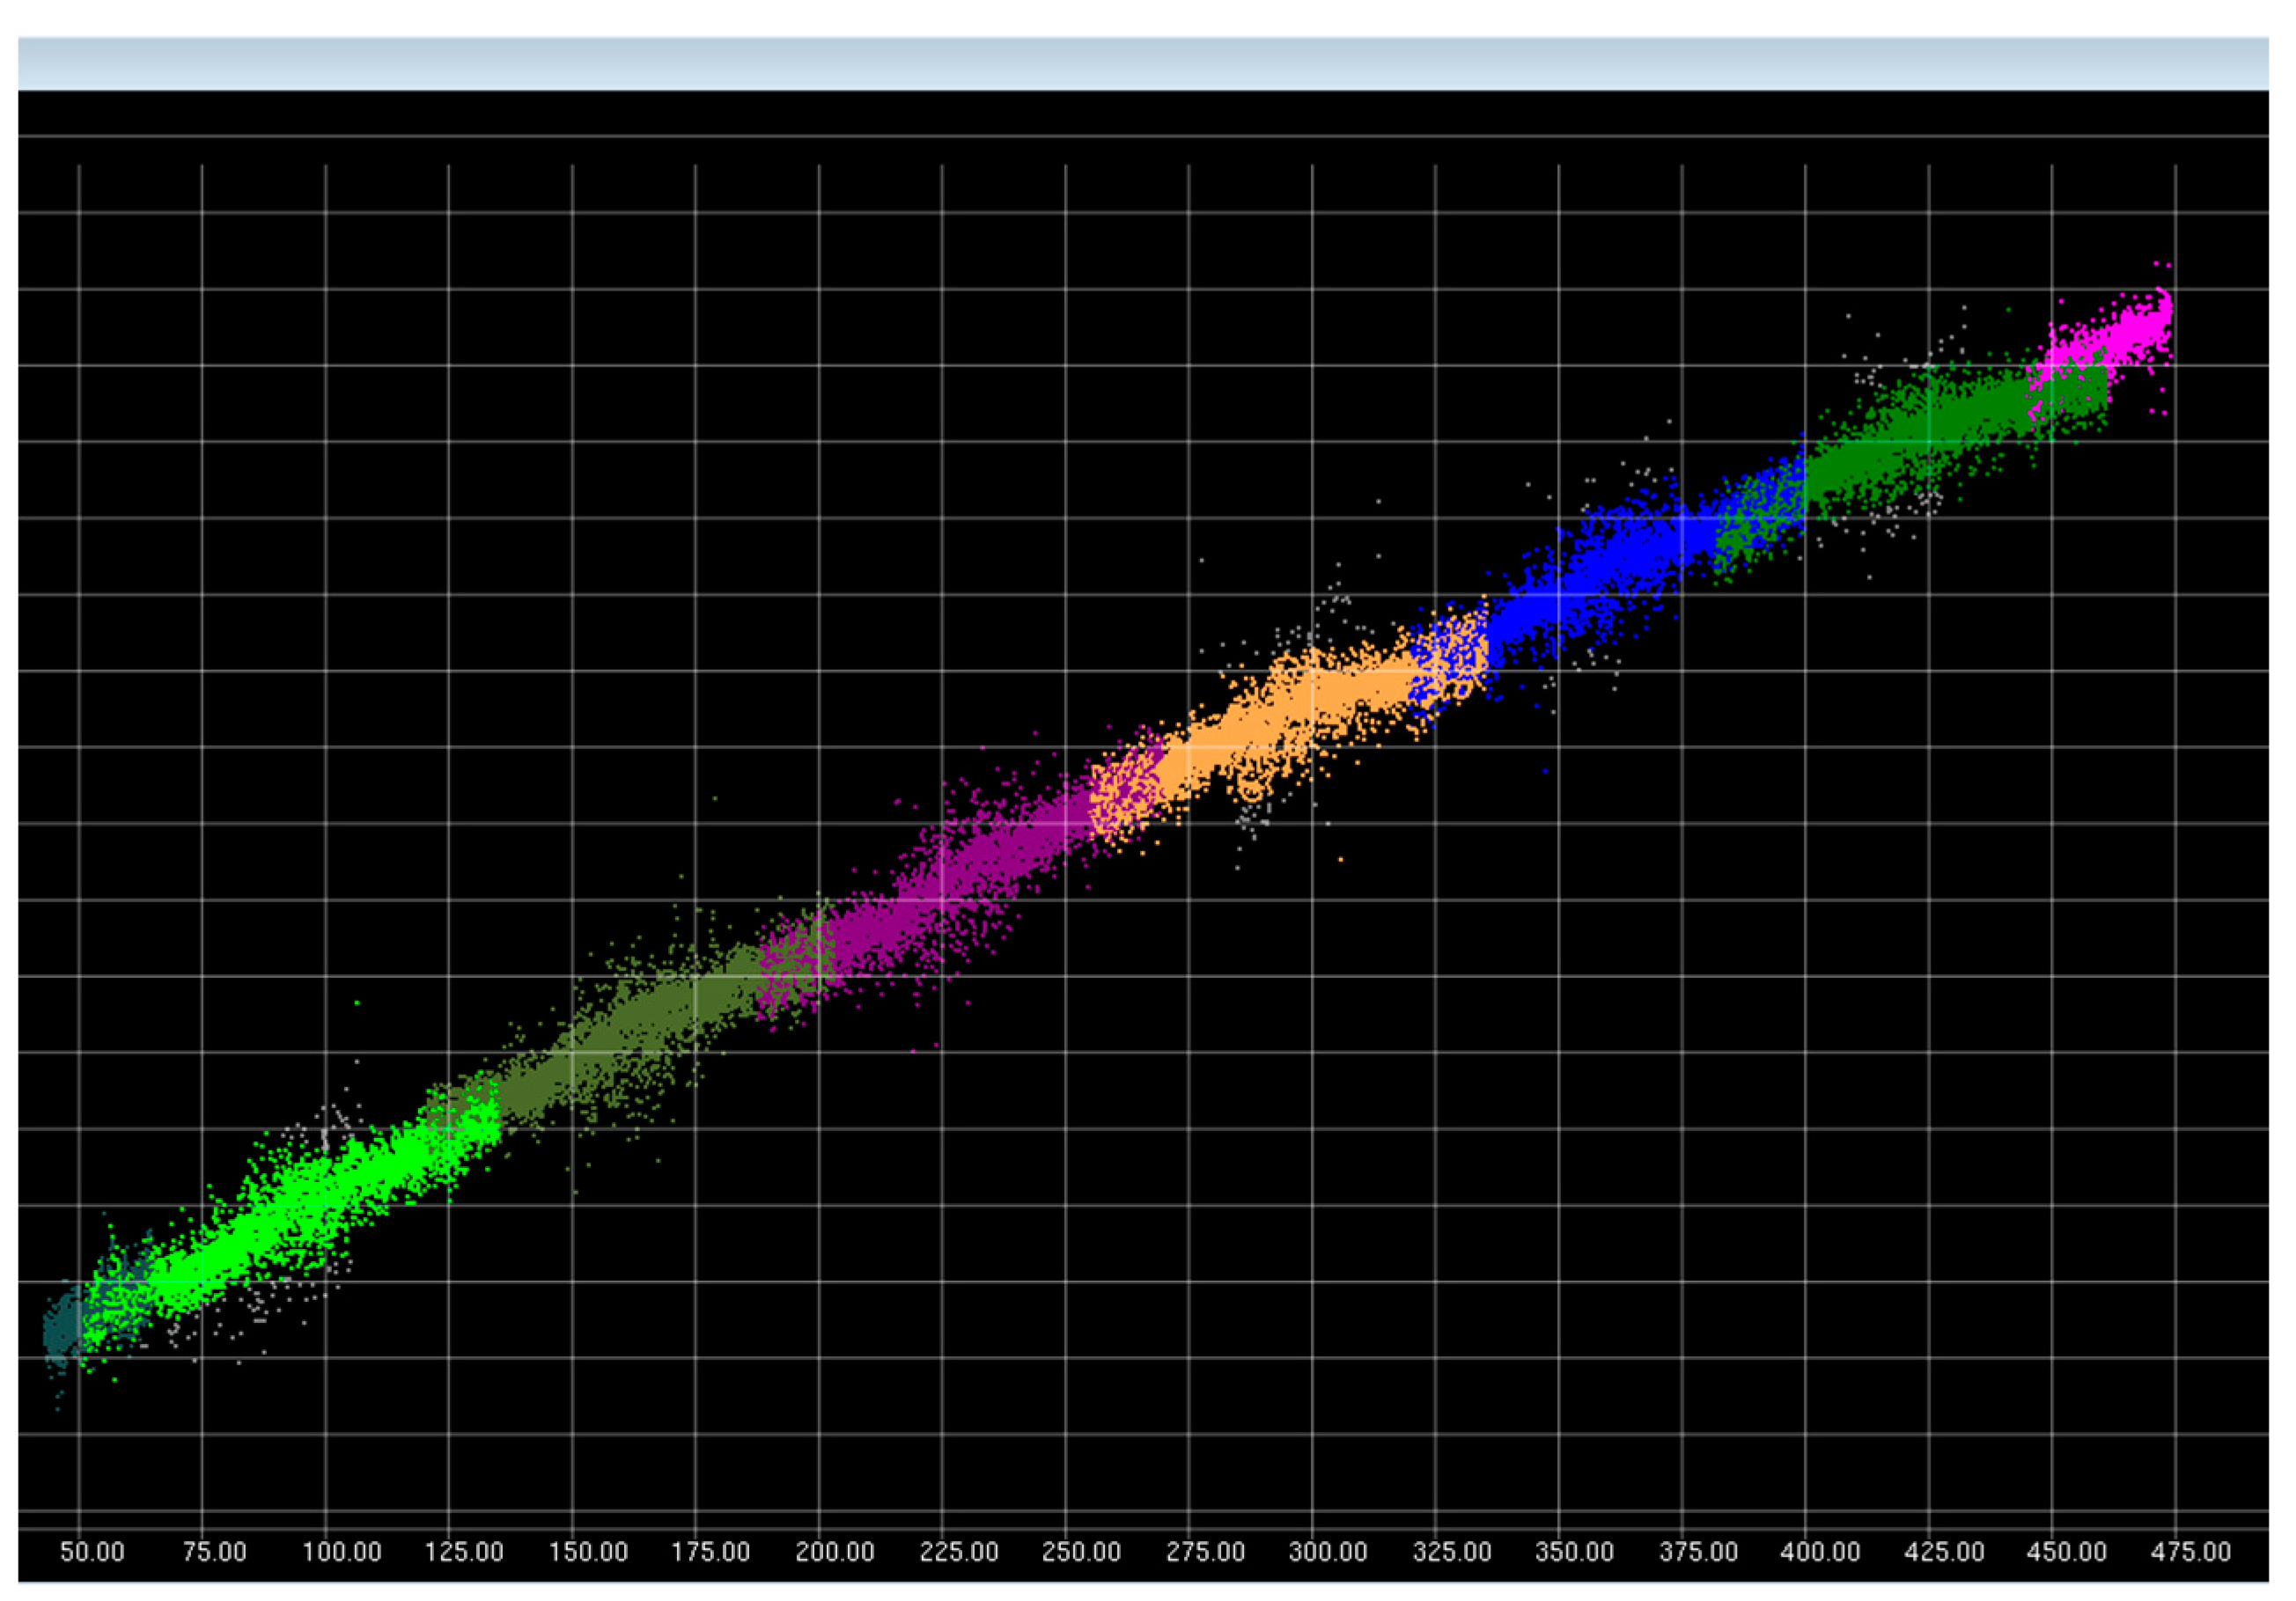
The patch test (Figure 5) is meticulously designed to precisely determine the static orientation parameters of the sonar head with respect to the IMU, specifically accounting for roll, pitch, and yaw angles. Inaccuracies in ascertaining these three critical parameters can lead to the introduction of systematic errors in the computation of the exact three-dimensional geospatial coordinates of each sounding [48].
The USV had no Sound Speed Profiler (SSP) winch installed yet, thereby excluding the option of autonomous acquisition of SVP estimates. Consequently, the profiles were collected by a hydrographic vessel affiliated with the Portuguese Hydrographic Institute. These profiles were measured whenever the difference exceeded 2 m/s between the readings from the surface sound speed sensor (mounted at the multibeam transducer’s head) and the water column profile.
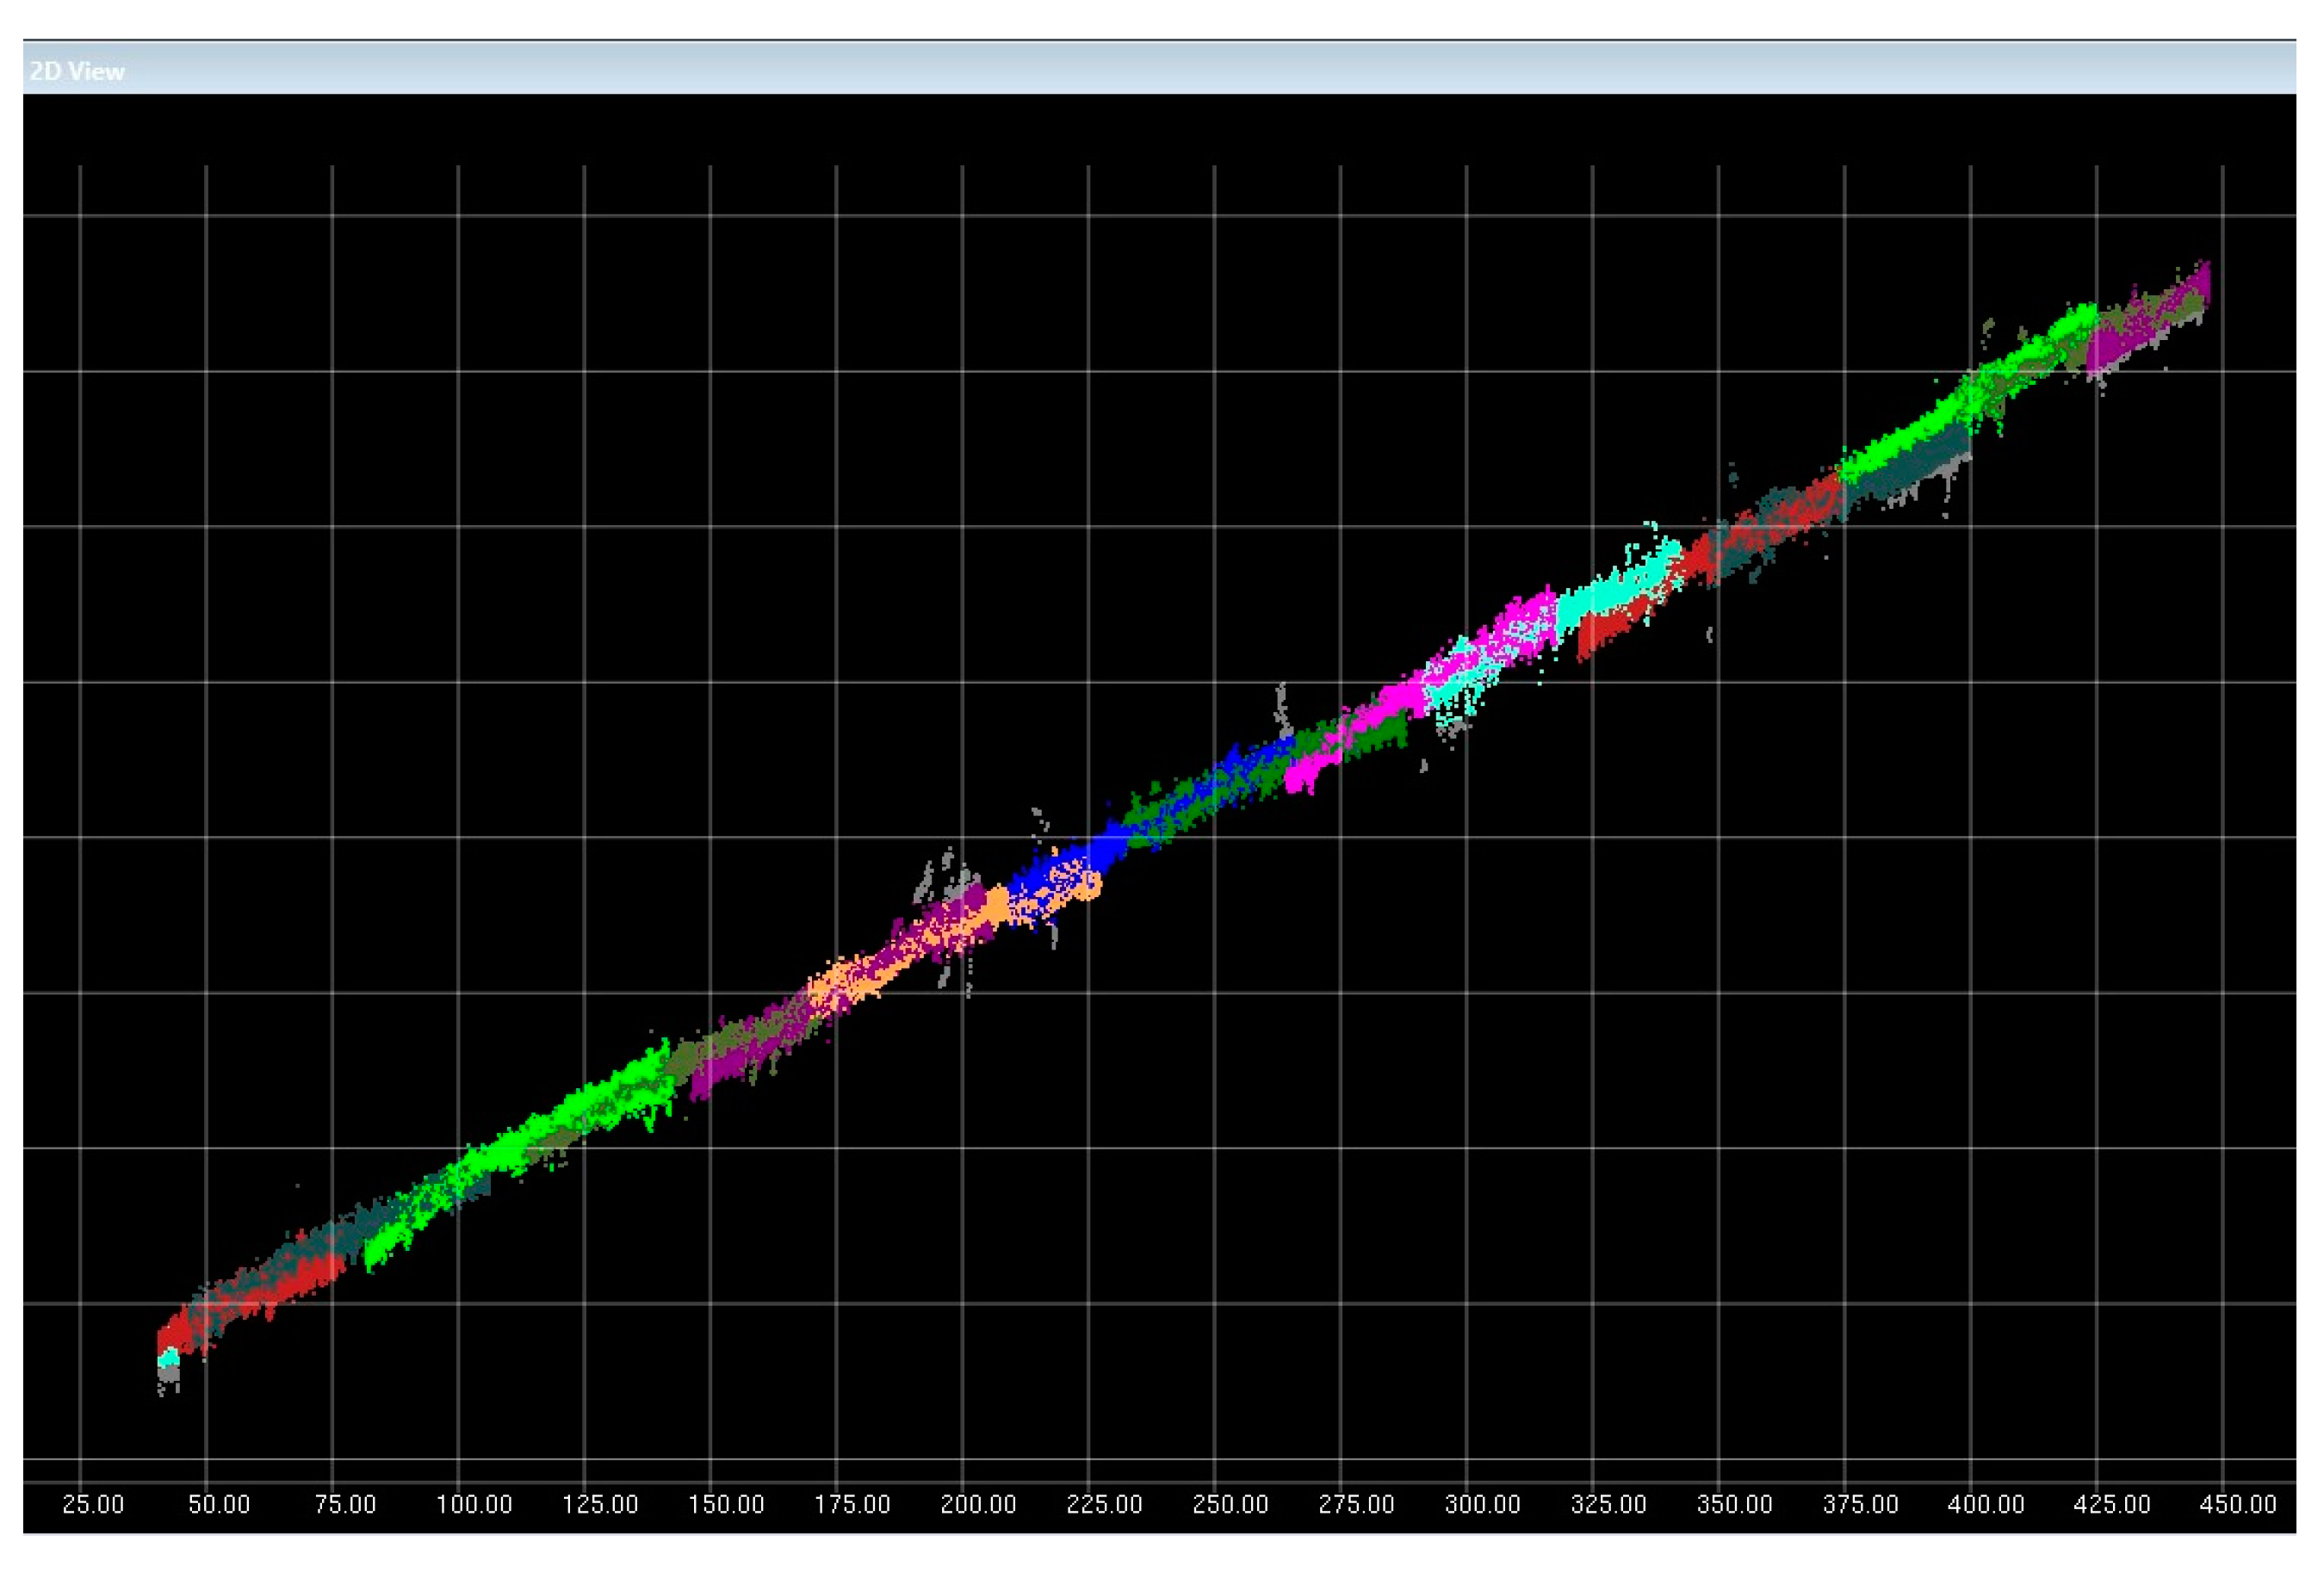
The obtained SVPs were loaded through the acquisition software, Kongsberg SIS [49], during the survey, implementing a thinning procedure and subsequently employing the profile to determine the beam trajectory throughout the water column allowing for the proper computation of each sounding’s geospatial coordinates, as seen in the subset of the data showing multiple survey lines correctly representing the flat seafloor (Figure 6). No postprocessing techniques were employed to reapply the SVP values to the raw data. A parallel procedure was adopted for the reference survey, wherein a manual SVP was utilized onboard (Figure 7).
The multibeam data could be downloaded in real time either using 4G or the Starlink connection onboard the USV. This made it available for the hydrographic surveyors to generate products in near-real time after the data collection, while the asset was still gathering bathymetric information onsite.
Furthermore, DriX USV did not conduct hydrographic surveys in waters less than 10 m deep for several reasons: primarily, safety concerns arise due to the considerable size of the platform (draft with the MBES gondola exceeding 2 m). Additionally, the Kongsberg EM 712 USV multibeam echosounder is engineered for optimal performance in shallow to medium-depth waters, as dictated by the specifications of the transducers. In extremely shallow waters, high reverberation and multiple reflections can markedly distort the acoustic signals, thereby amplifying the range of error [50].
Additionally, the Kongsberg EM 712 USV features a versatile frequency spectrum, spanning from 40 to 100 kHz. This feature facilitates broad range and swath coverage capabilities, achieved via the utilization of Continuous Wave (CW) and Frequency-Modulated (FM) chirp pulses, whilst simultaneously operating as a high-resolution sonar. Its suitability as a solution for platforms such as USVs, which are susceptible to rapid dynamic motions, is featured by the comprehensive stabilization of swath coverage for roll, pitch, and yaw. This stabilization mechanism guarantees complete seabed coverage with evenly distributed soundings, maintaining its reliability even under challenging METOC conditions [51]. The employment of USVs for hydrographic surveys effectively surmounts the previously encountered limitations, as these platforms are considerably smaller, enabling access to water bodies with depths as shallow as 0.5 m.
The USV evaluated in this study is equipped with a cutting-edge, state-of-the-art MBES sensor recently designed for a small platform, from a technology typically employed in large, crewed survey vessels. Additionally, USVs are less costly to acquire wand operate, and the requisite manpower for their deployment is markedly reduced.
2.2.4. Satellite-Derived Bathymetry (SDB)
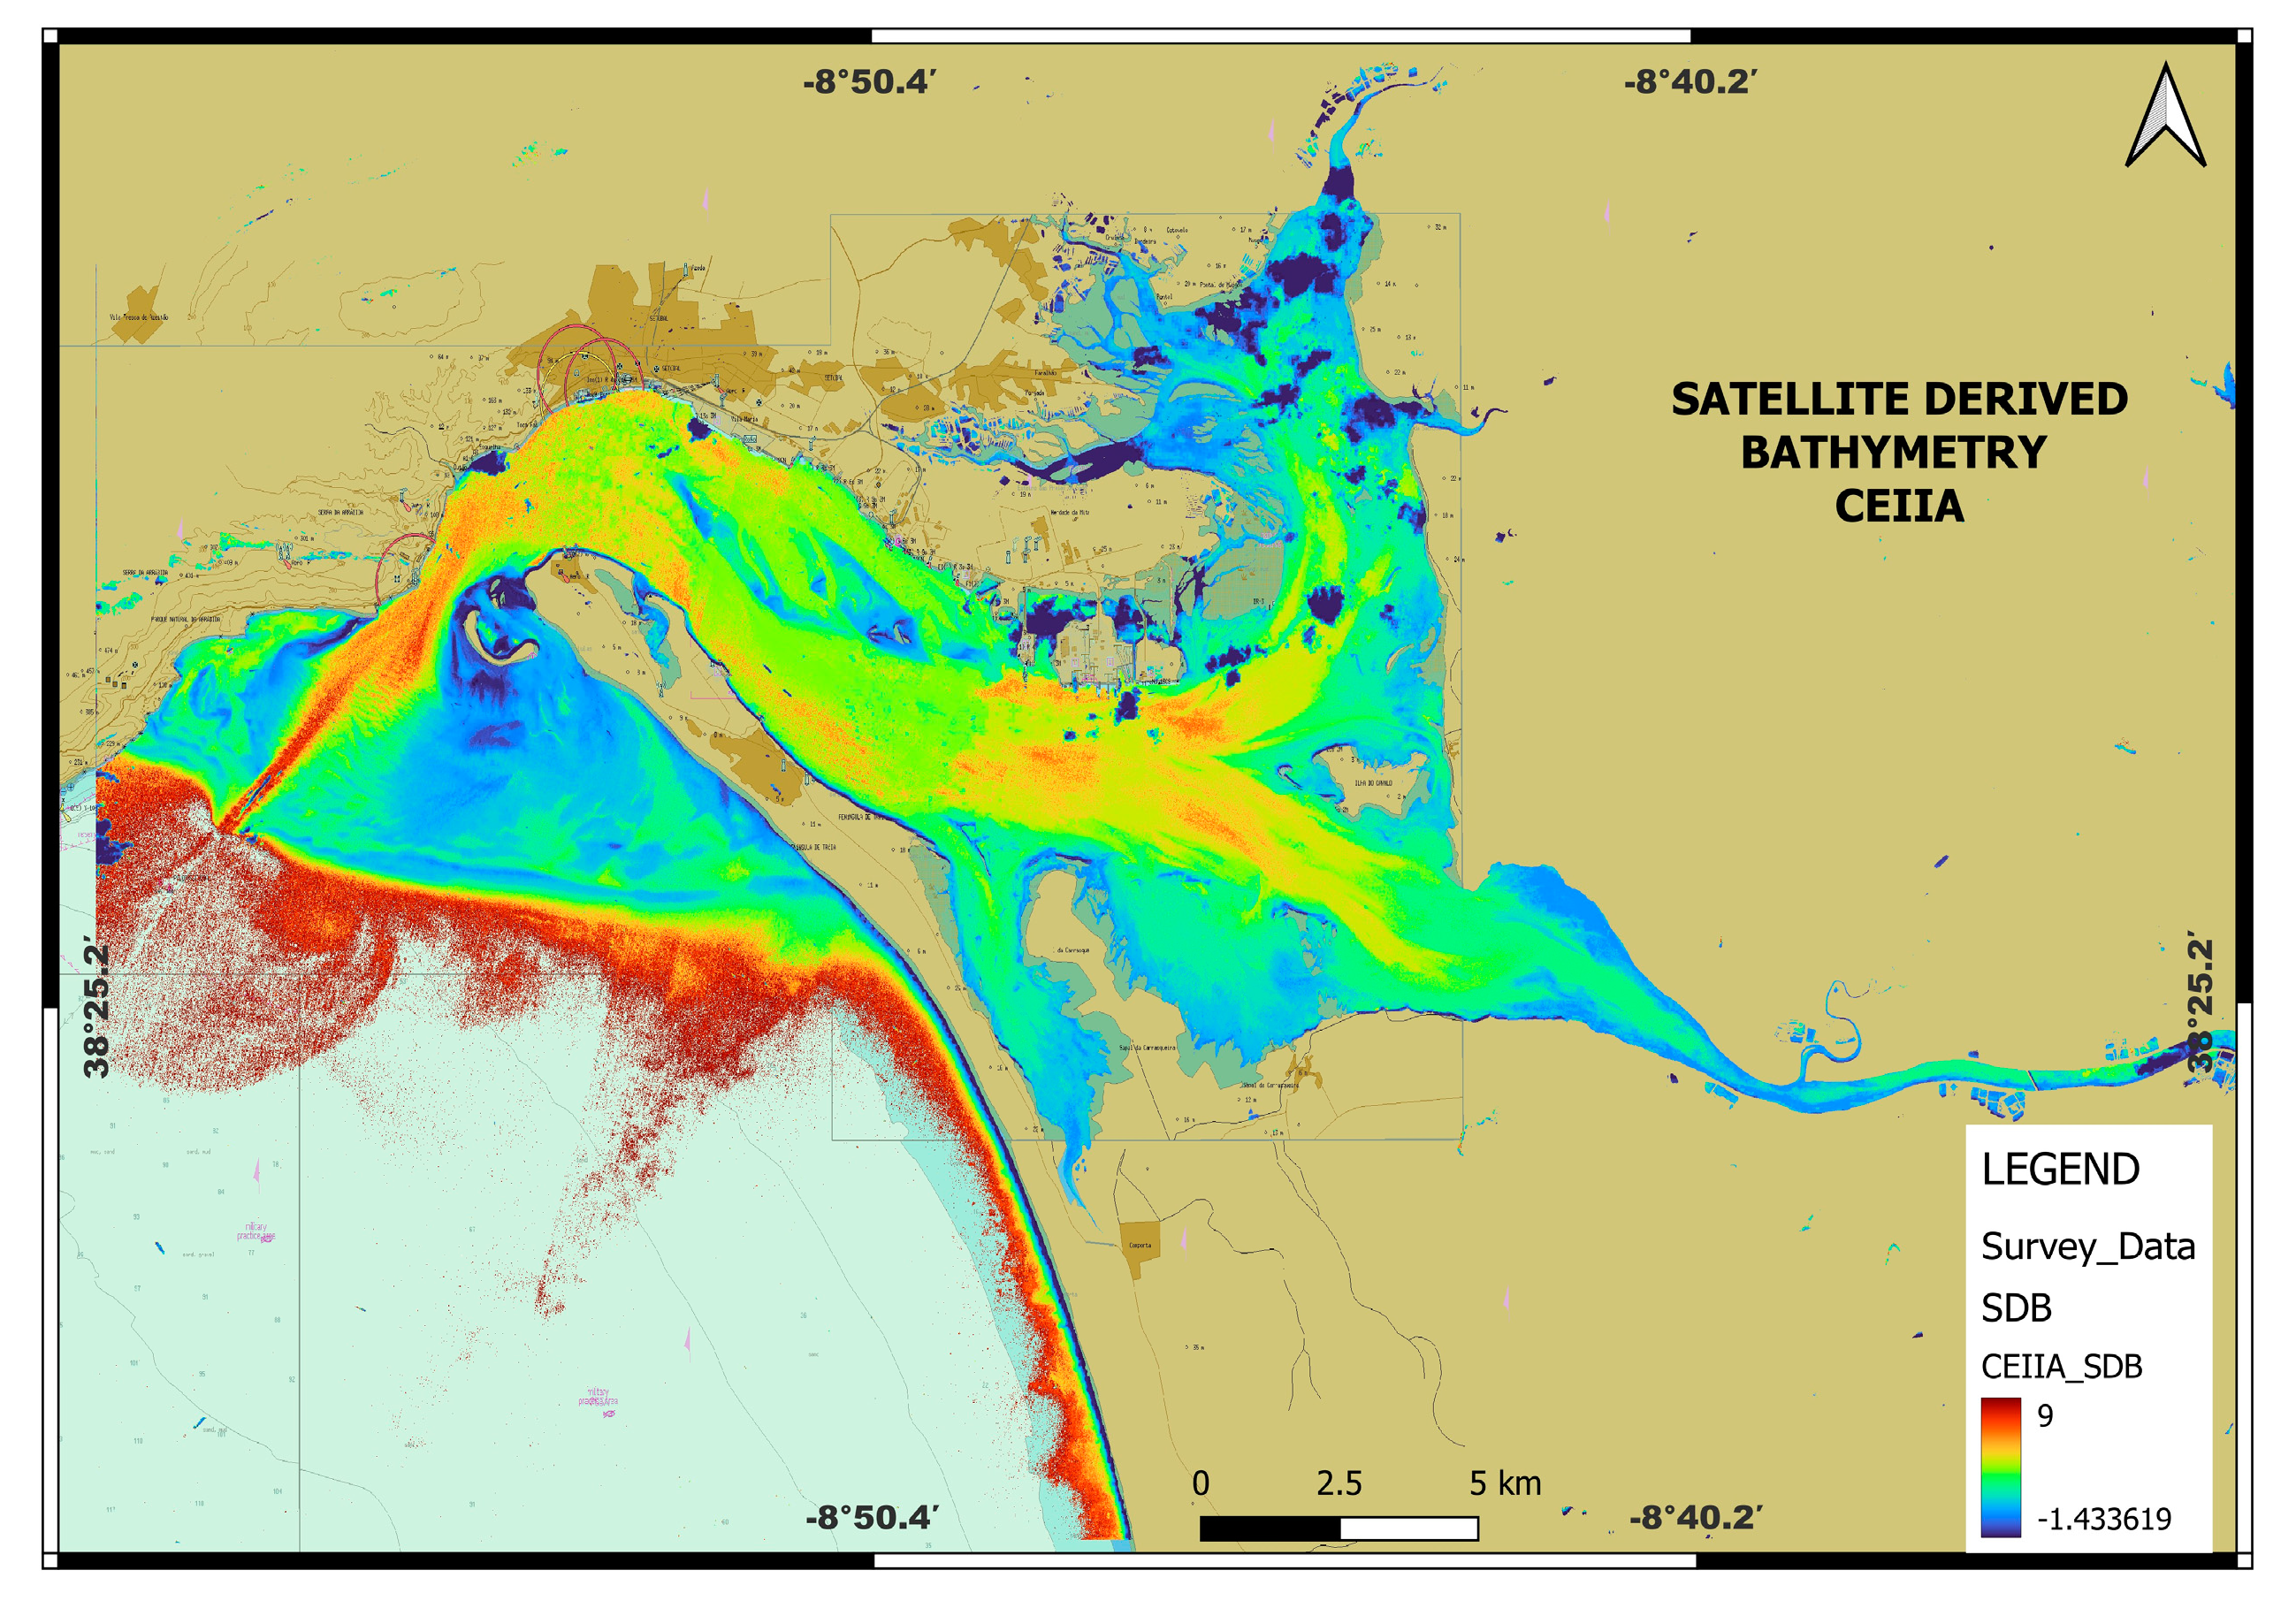
The study area (Figure 1) comprises both turbid river waters and clearer ocean waters, as well as the Troia Peninsula with all the sedimentological features of the Sado estuary. For this research, the Sentinel-2 imagery based products created by the Portuguese Company CEIIA [52] were used. Sentinel-2 images for the Sado estuary region were downloaded through the ESA Copernicus Open Access Hub platform [53]. The selection of these images was contingent on several criteria, including minimal cloud cover, alignment with the region of interest, and the type of Top-of-Atmosphere (TOA) product. Following the acquisition, the images underwent a series of preprocessing steps that encompassed the correction of atmospheric and aerosol effects, mitigation of sun glint, analysis of water turbidity, quantification of chlorophyll-a concentrations, assessment of the Normalized Difference Chlorophyll Index, and the evaluation of the Floating Algal Index [54]. For developing a general water depth estimation model, machine learning (ML) and deep learning algorithms were applied and tested. Data recorded by multispectral sensors have multidimensional features, thus allowing for the building of a model that explains the relationship between these features and depth. Under variable observation conditions, ML approaches were also used to automatically investigate the best numerical models and to provide an optimal solution. A total of 25 Sentinel-2 images were downloaded and normalized following the criteria described above, ensuring that only the suitable images were used within the investigation, resulting in 5 optimal images to derive SDB models which were merged afterwards.
Subsequently, two distinct approaches were implemented. First, the Stumpf et al. [55] approach was utilized to calculate bathymetry through a linear regression from the green and blue band ratio. Second, machine learning techniques, specifically boosting algorithms, were applied to reflectance from Bands 1 to 4 (Coastal Blue, Blue, Green, and Red) of the Sentinel-2 products.
The processing model operates on the foundational principle that each spectral band shows distinct levels of absorption within the water body. The conceptual variation in absorption levels gives rise to the ratio between bands, and this ratio undergoes consistent concurrent changes with alterations in water depth.
In theoretical terms, an increase in the ratio is expected to correspond to an increase in depth. The spectral band characterized by a higher absorption level will consistently decrease with escalating depth. As asserted in [55], this log-ratio model displays greater robustness and has shown superior accuracy in depth estimation, particularly in shallow habitats with low reflectance and in the context of deeper benthic habitats, when compared to alternative derivation models. Equation (1) below reveals the algorithm of the Stumpf log-ratio model:
where
n, , and are the constant coefficients for the model.
L() and L() are the radiances for the bands centered in and .
This aimed to affirm the precise execution of the processing procedures for all models, as well as to validate the effectiveness of atmospheric correction and ML algorithms in ensuring that the bathymetric outcomes are aligned with the anticipated standards. To fulfil this objective, the product underwent rigorous training, validation, and testing, utilizing reference bathymetric data sources such as the General Bathymetric Chart of the Oceans (GEBCO) [56] and in situ soundings derived from local bathymetric surveys. All the depth values and soundings were referenced to the chart datum (2 m below the Mean Sea Level).
SDB techniques are routinely employed in the preliminary phases of REA, serving to provide an initial understanding of depth contours within a specified area, or in scenarios where conducting an on-site survey proves challenging. However, it is generally agreed that limitations pertaining to precision, accuracy, water depth penetration, and the mandatory expertise for data processing are fundamental in this methodology.
2.3. Datasets’ Evaluation
As described above, various systems and techniques were employed to determine the depths within the designated offshore area. Table 4 provides specific survey details, offering insight into the relationship between the survey time and the covered area. The survey total times considered here do not account for turning times between lines, time spent acquiring SVPs or transit to and from the survey area. It should be noted that the multispectral imagery used by CeiiA was acquired between January and April 2023 to derive a reliable SDB model before the exercise, unlike the remaining datasets collected during the REPMUS23 exercise period.
The different types of datasets were delivered in distinct types and formats, as described in Table 5. Multibeam and LiDAR data were delivered as point cloud data, while SDB information was presented in raster image format. To allow for a direct comparison of all datasets, Digital Terrain Models (DTMs) were generated from the point cloud datasets. The preferred gridding method was the Combined Uncertainty and Bathymetry Estimator (CUBE) model, which was specifically applied to multibeam echosounder data. However, since the UAV LiDAR survey had no uncertainty estimates, a basic weighted mean gridding method was applied to the data.
The resulting survey coverage from each system was superimposed onto the planned offshore area, resulting in the diagram shown in Figure 8. The figure highlights not only that the SDB datasets fully covered the offshore area, but also that the Reference MB survey partially covers all other datasets, except for the USV MB survey.
All the datasets were processed using specialized hydrographic software by a certified hydrographic surveyor. GNSS ellipsoidal positioning combined with tide observations (Figure 9) was used for reducing the soundings to the chart datum.
3. Results and Discussion
This section is dedicated to the processing and analytical examination of the hydrographic data derived from each system. It involves a comparative evaluation of the datasets with the reference survey, as well as inter-comparisons among the datasets themselves.
3.1. Reference Bathymetric Survey
This analysis is not aiming to assess the compliance with hydrographic or cartographic standards used for charting purposes but rather intends to evaluate it under the scope of a REA operation. In this context, the rapid exchange of data and products’ dissemination holds greater significance than adherence to demanding standards typical of traditional bathymetric surveys.
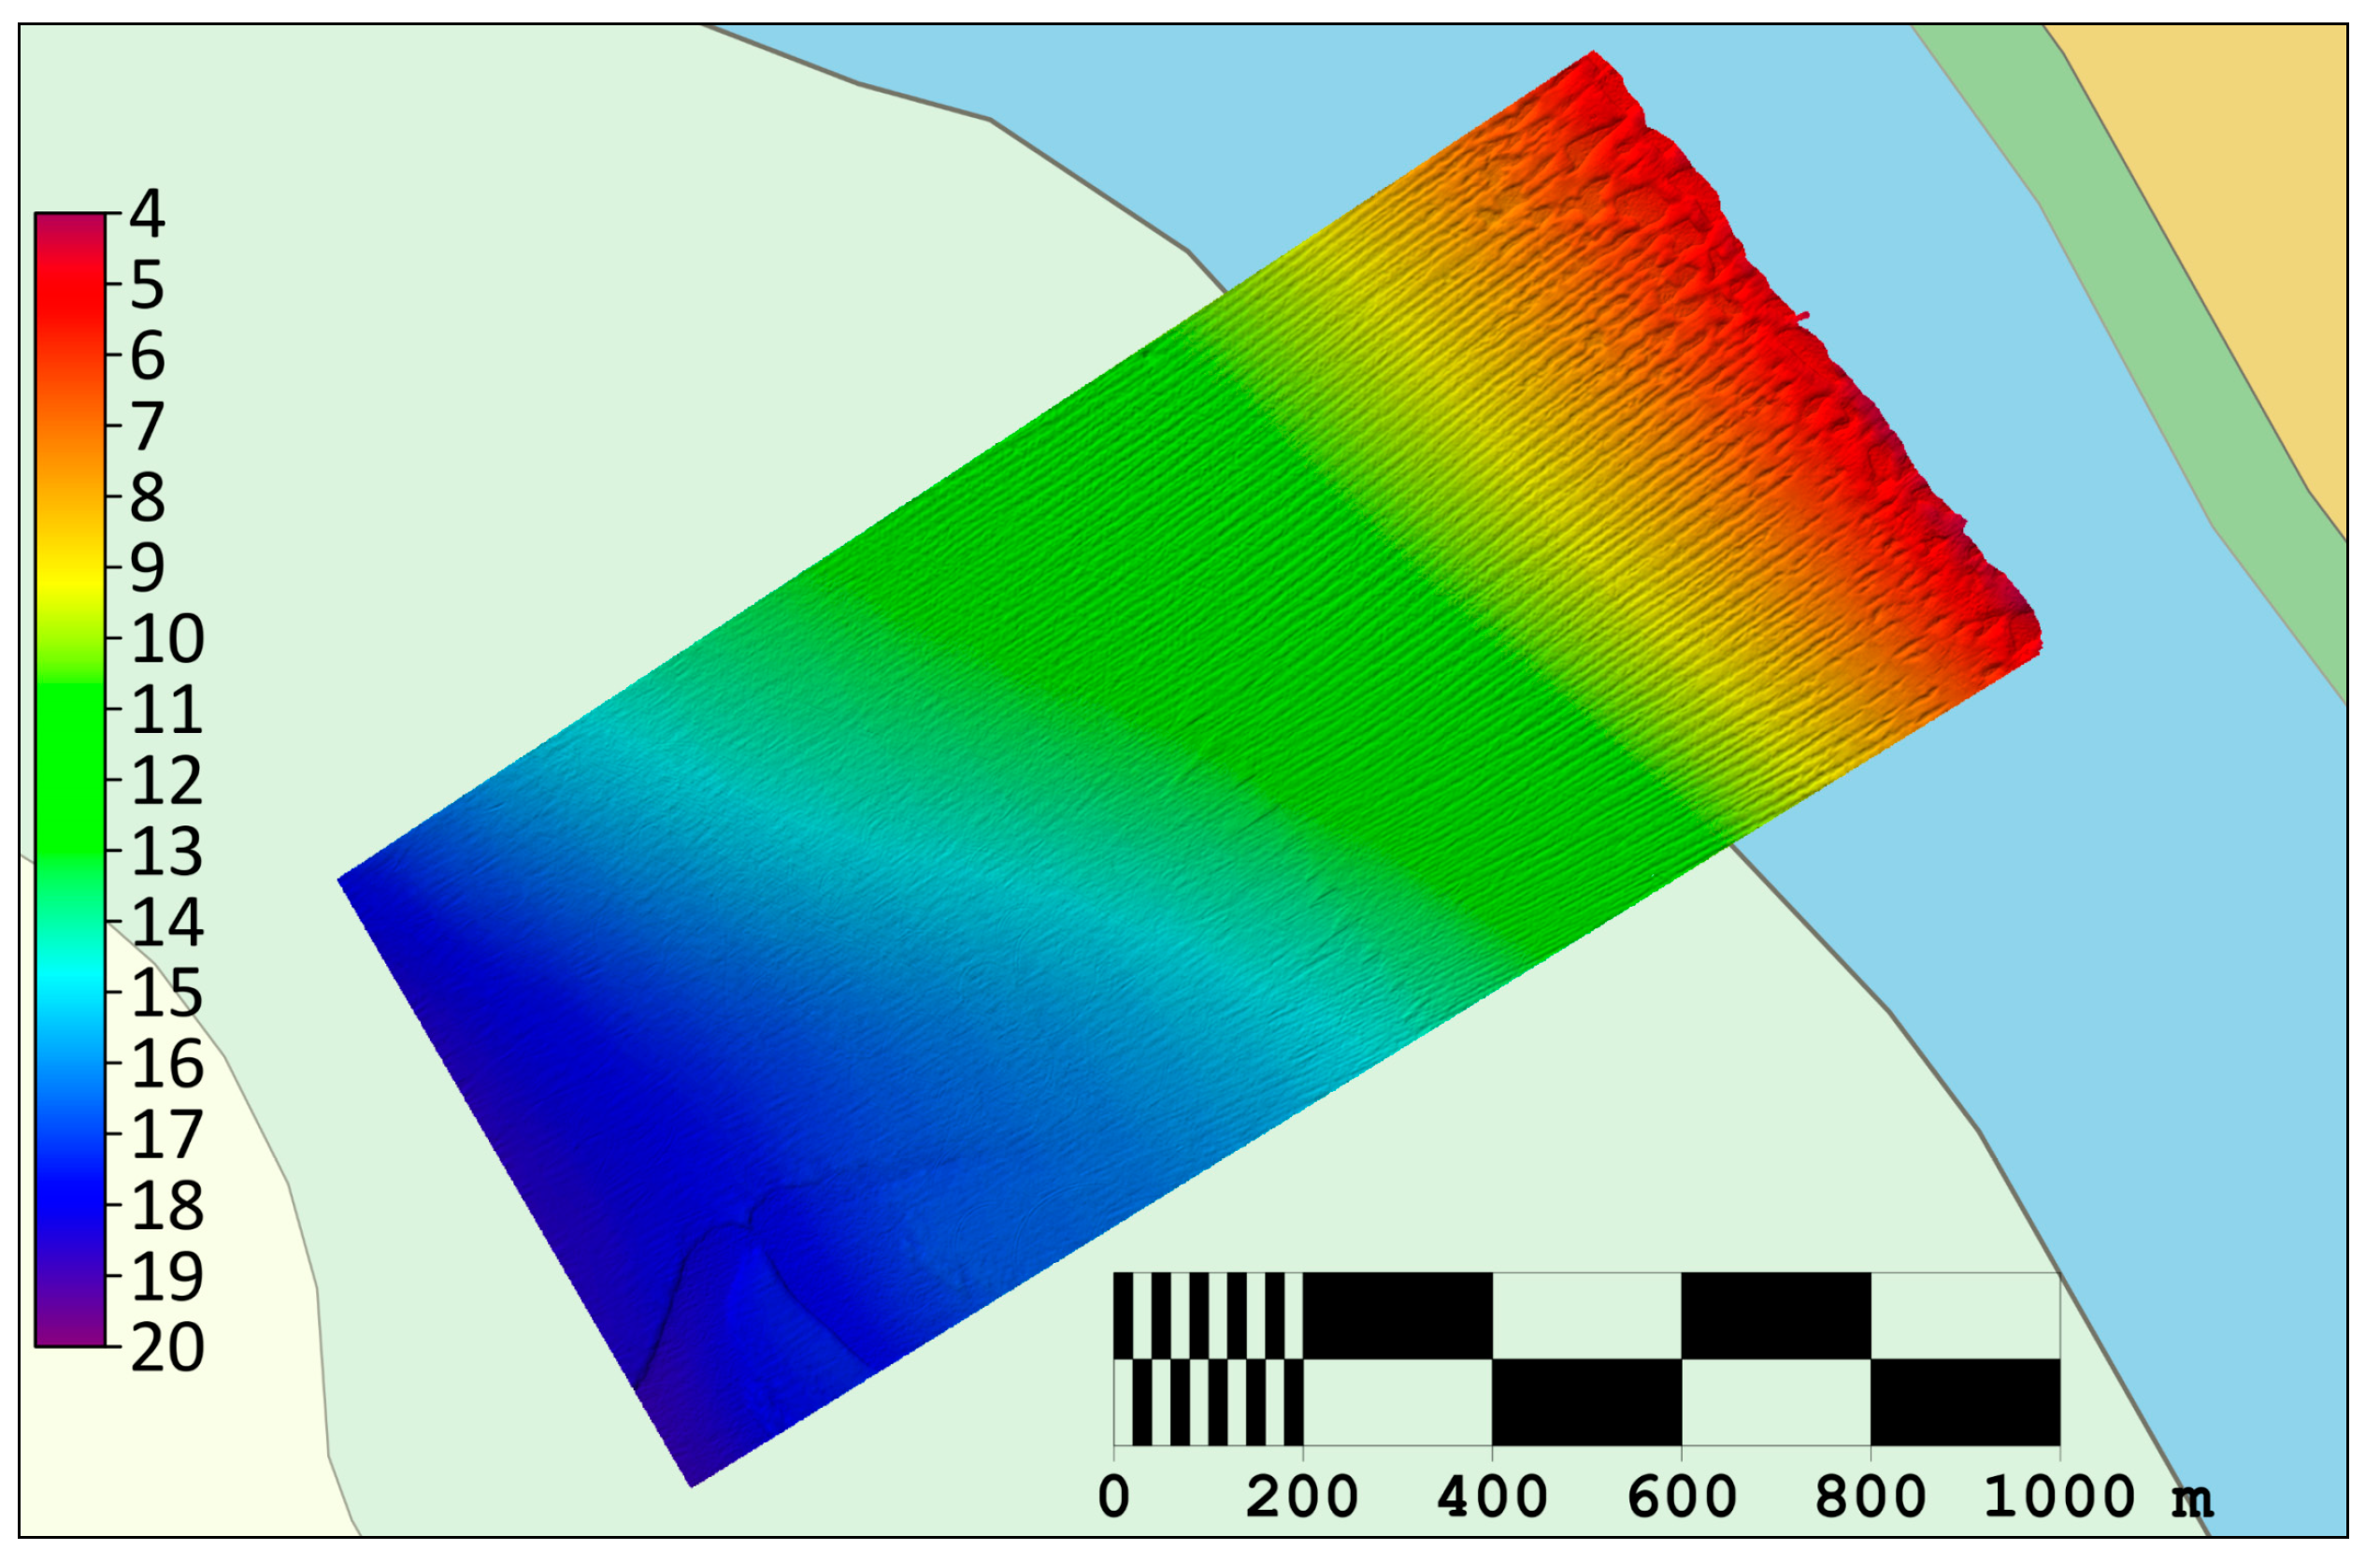
The bathymetric model from the ref”renc’ survey (Figure 10) was conducted following the International Hydrographic Organization (IHO) S-44 standard survey order for special order surveys [58].
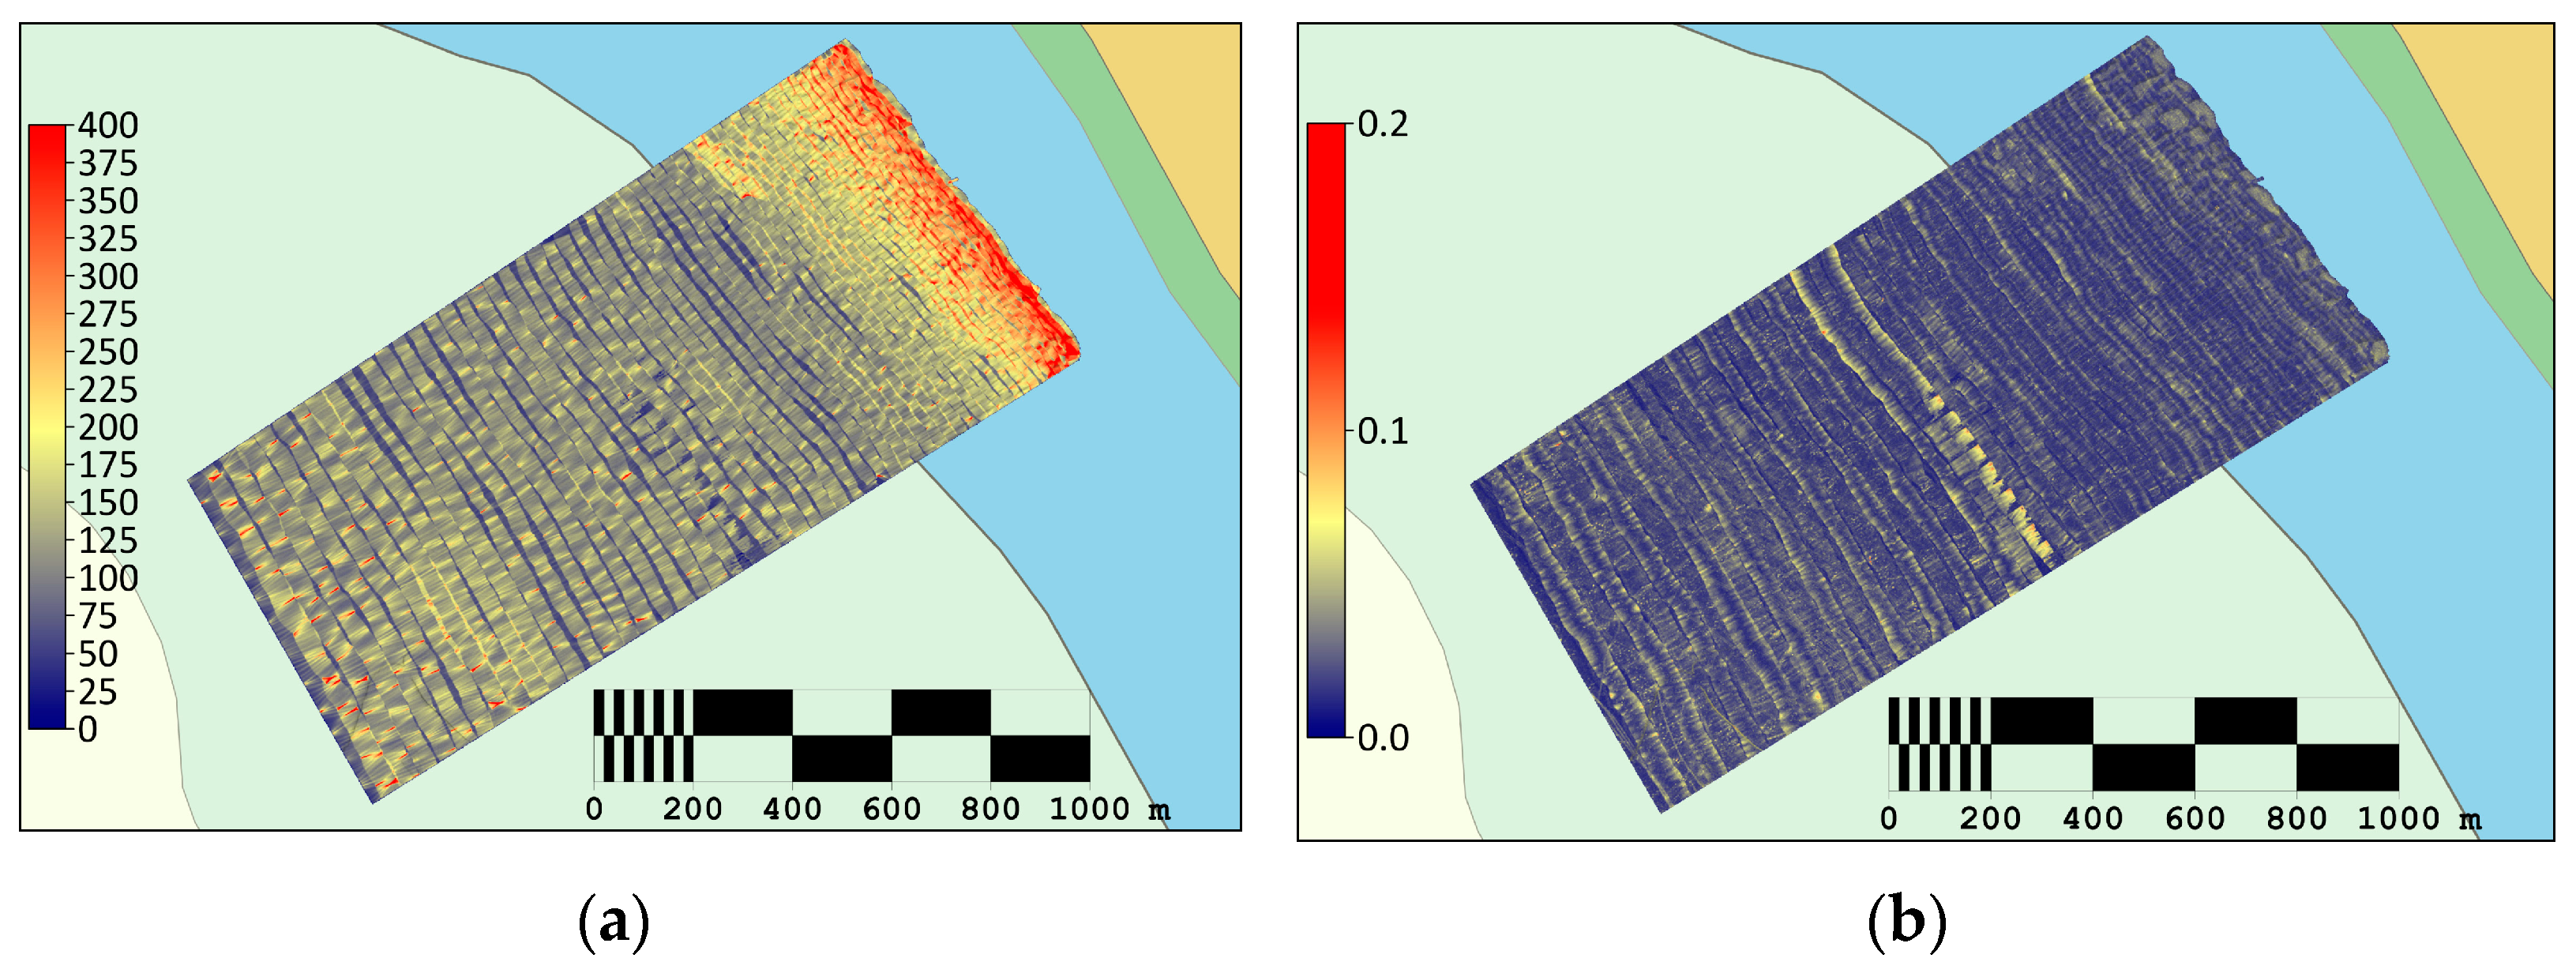
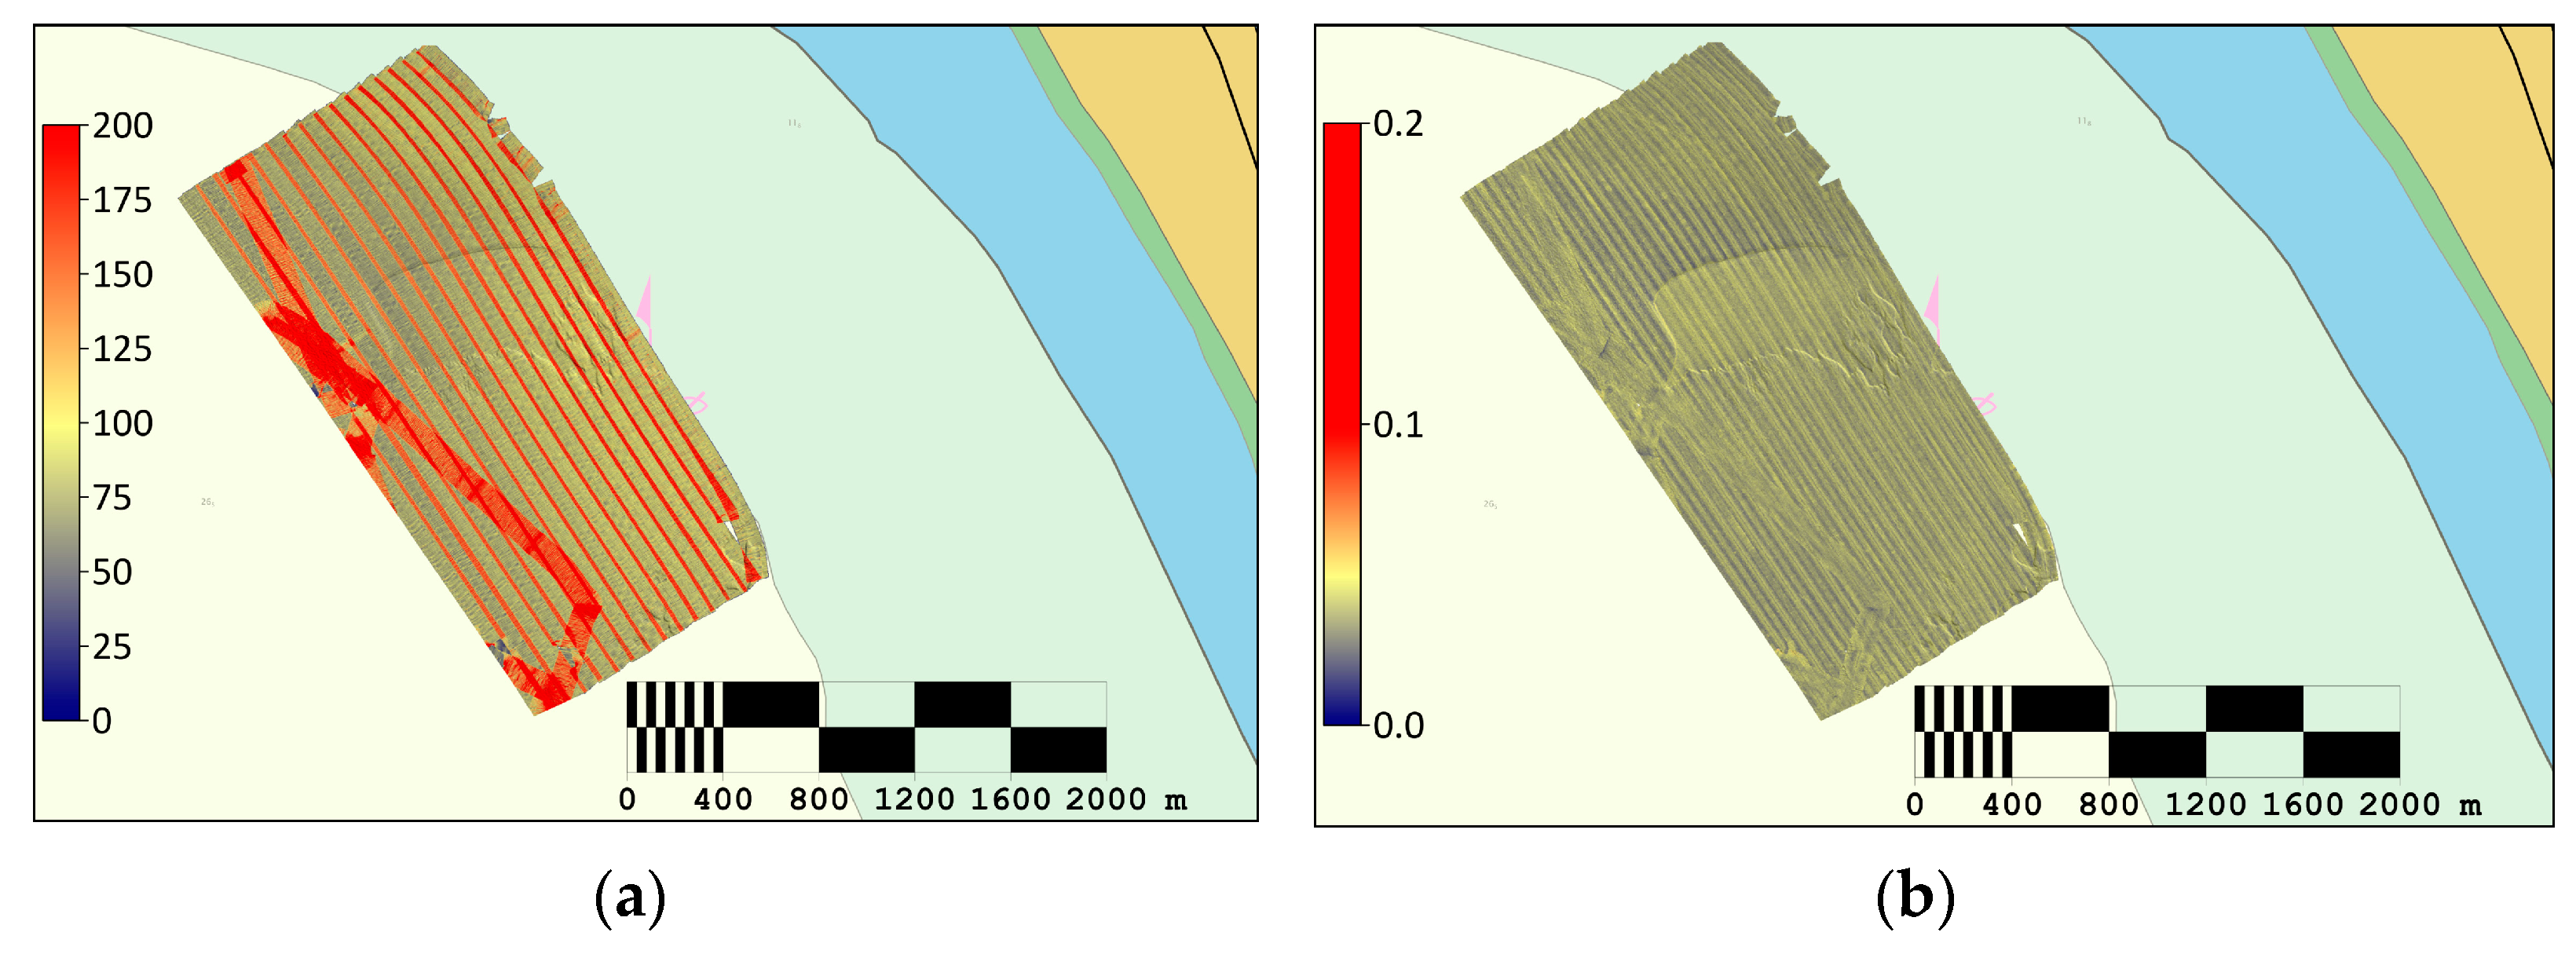
The node density of the reference survey was computed (Figure 11a and Table 6), highlighting higher values in the shallow part of the area and decreasing in density in the deeper part, with a mean value of 139.66 nodes. Moreover, the standard deviation, which represents one component of the bathymetric uncertainty in the final bathymetric model, was computed for the reference surface (Figure 11b and Table 6), with 0 m as the mean value, and 0.1 m as the maximum value, accentuating the high accuracy and precision of the bathymetric surface.
3.2. USV MB Survey Results
The raw multibeam data, sent from the DriX USV to the Datahub, via the Starlink connection, were imported into the Teledyne Caris HIPS and SIPS software for postprocessing. Differential GNSS corrections were integrated into the multibeam dataset to reduce the height of the tide and reference the depths to the local chart datum, followed by the generation of a preliminary CUBE model [59,60]. A meticulous visual inspection of the bathymetric model was conducted by the team of hydrographers to identify potential systematic errors or gross inaccuracies within the data. After the inspection of the surface and the removal of noisy data (and spikes) and data consistency, a detailed analysis of the final hypotheses generated by the CUBE algorithm was undertaken. This step was crucial to ascertain whether the noise reduction process performed by the CUBE algorithm inadvertently eliminated valid data points. Afterwards, the statistical parameters of the CUBE surface, including standard deviation, histogram details, and the correlation with depth data from the electronic nautical chart (ENC), were rigorously examined.
Simultaneously, a graphical representation of the surveyed area, indicated by the CUBE surface (Figure 12), was generated, accompanied by the statistical metrics.
3.3. UAV LiDAR Survey Results
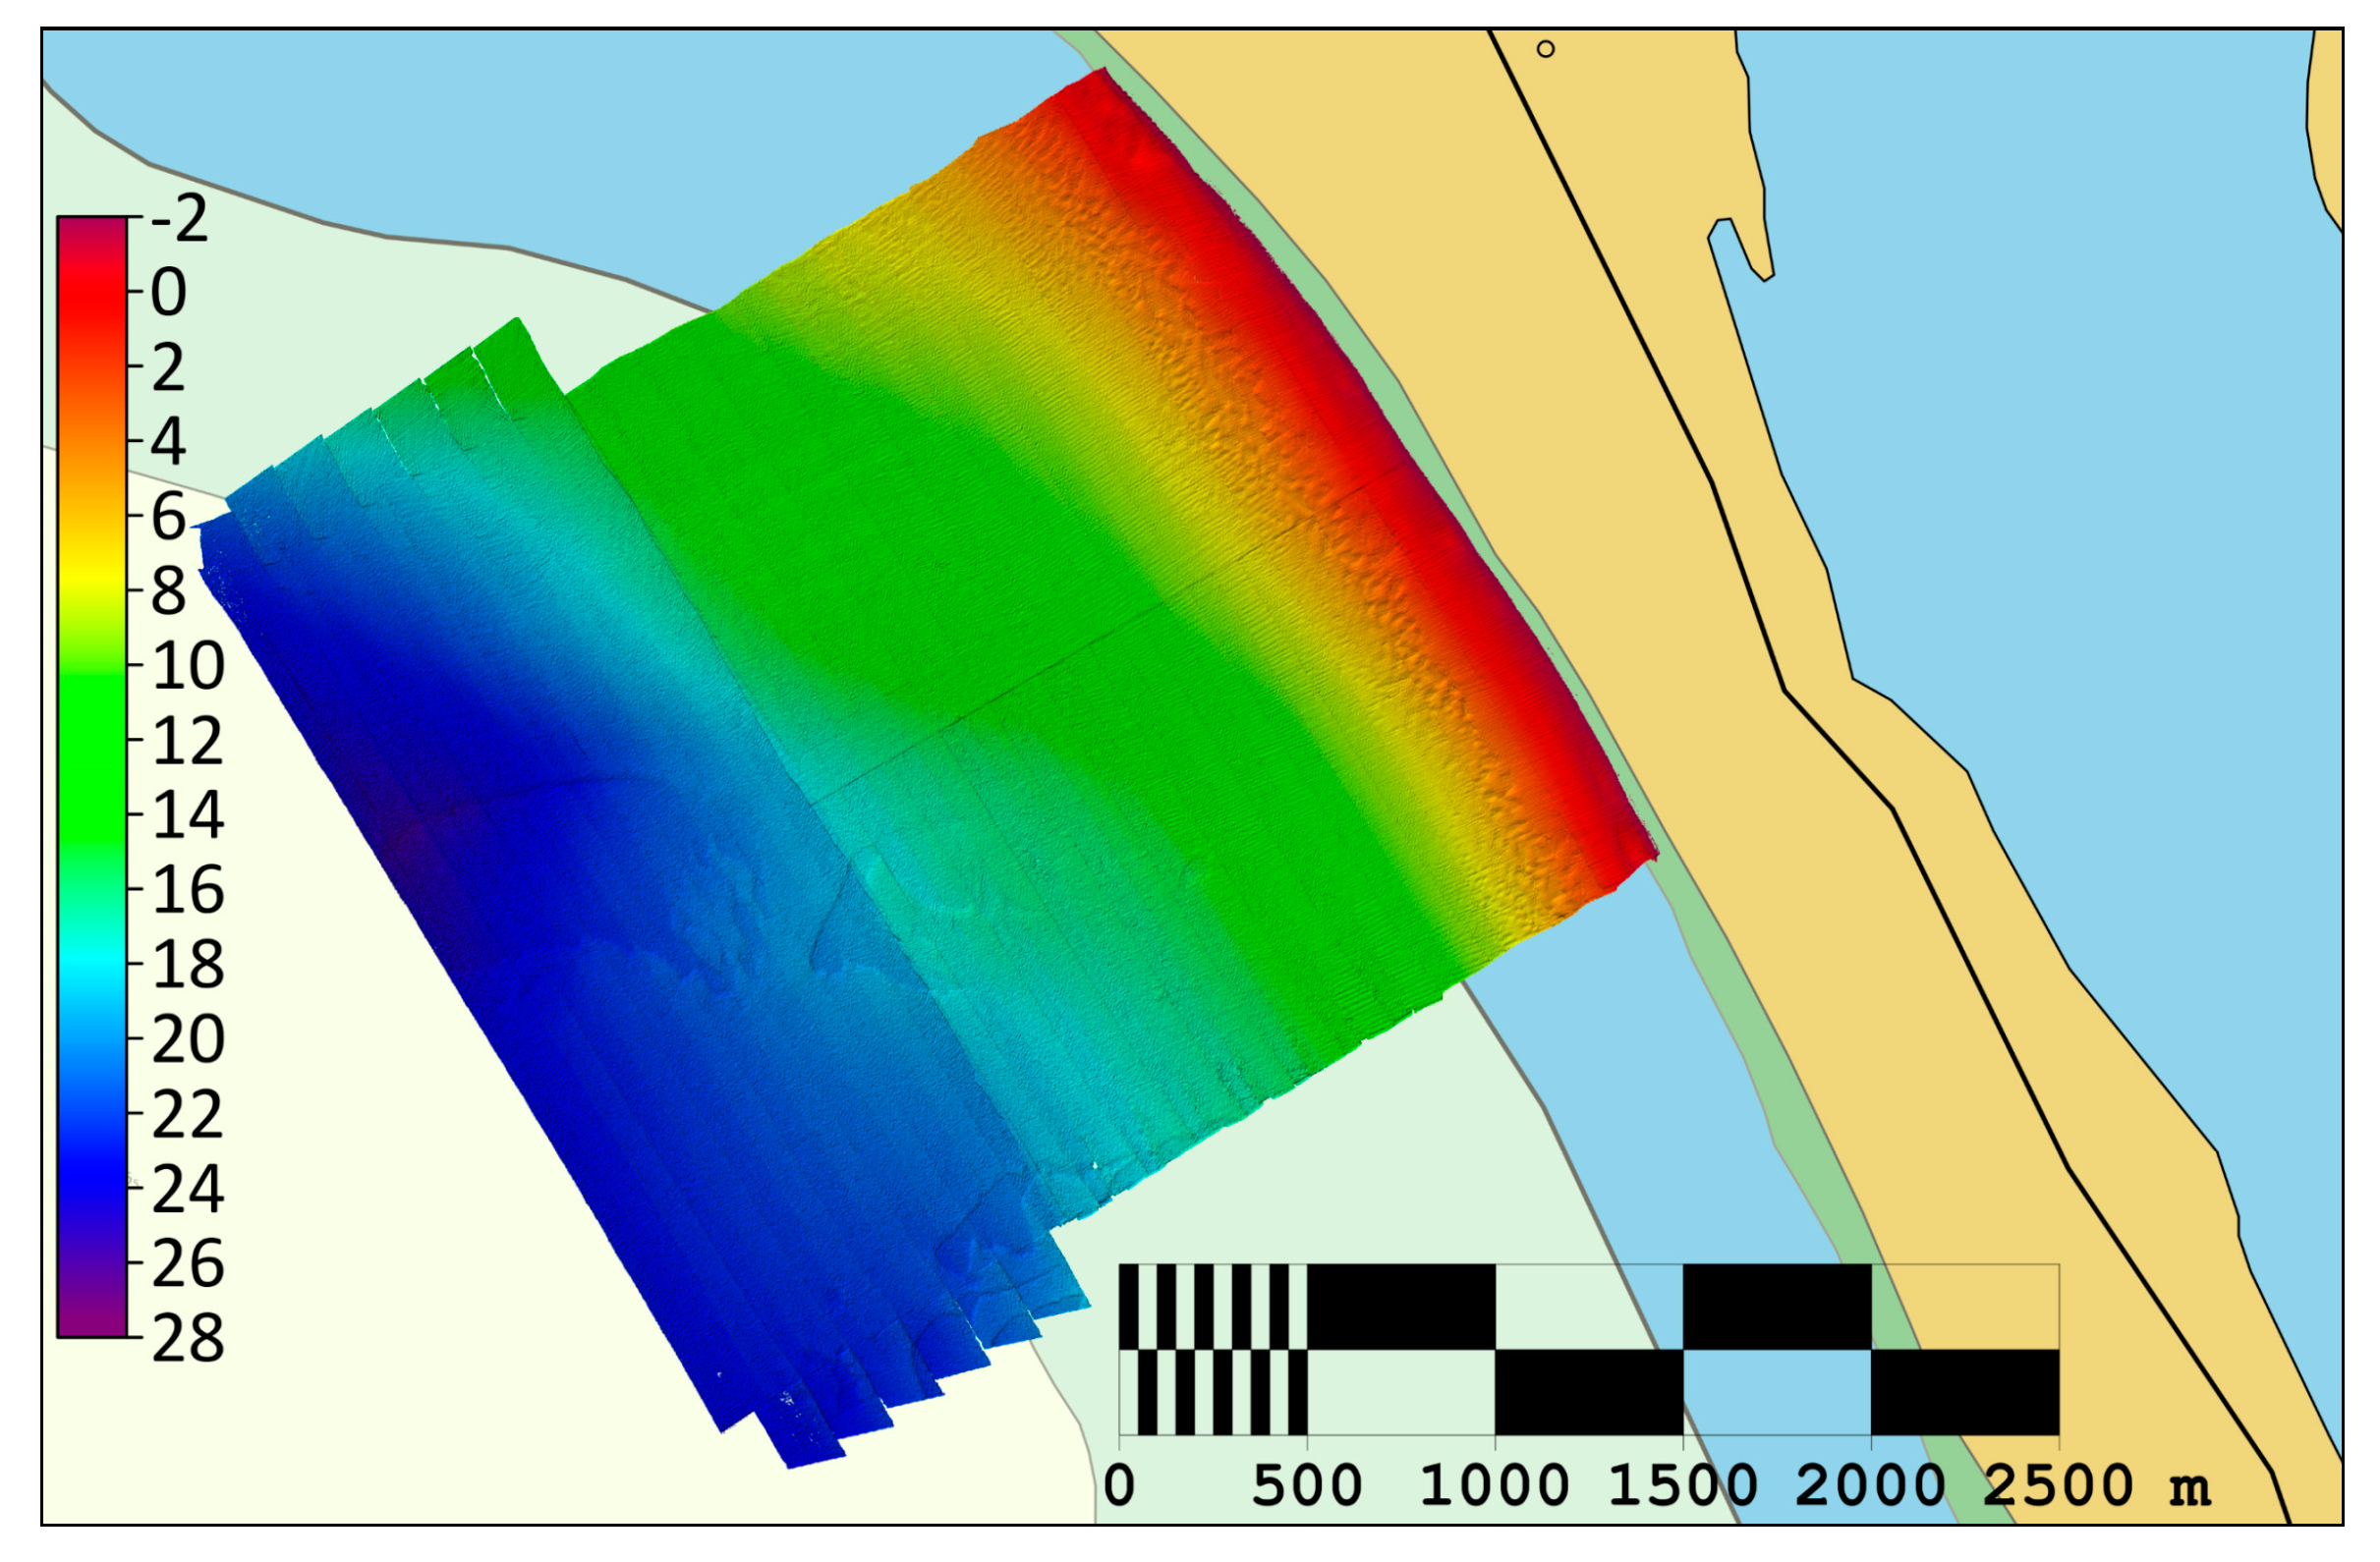
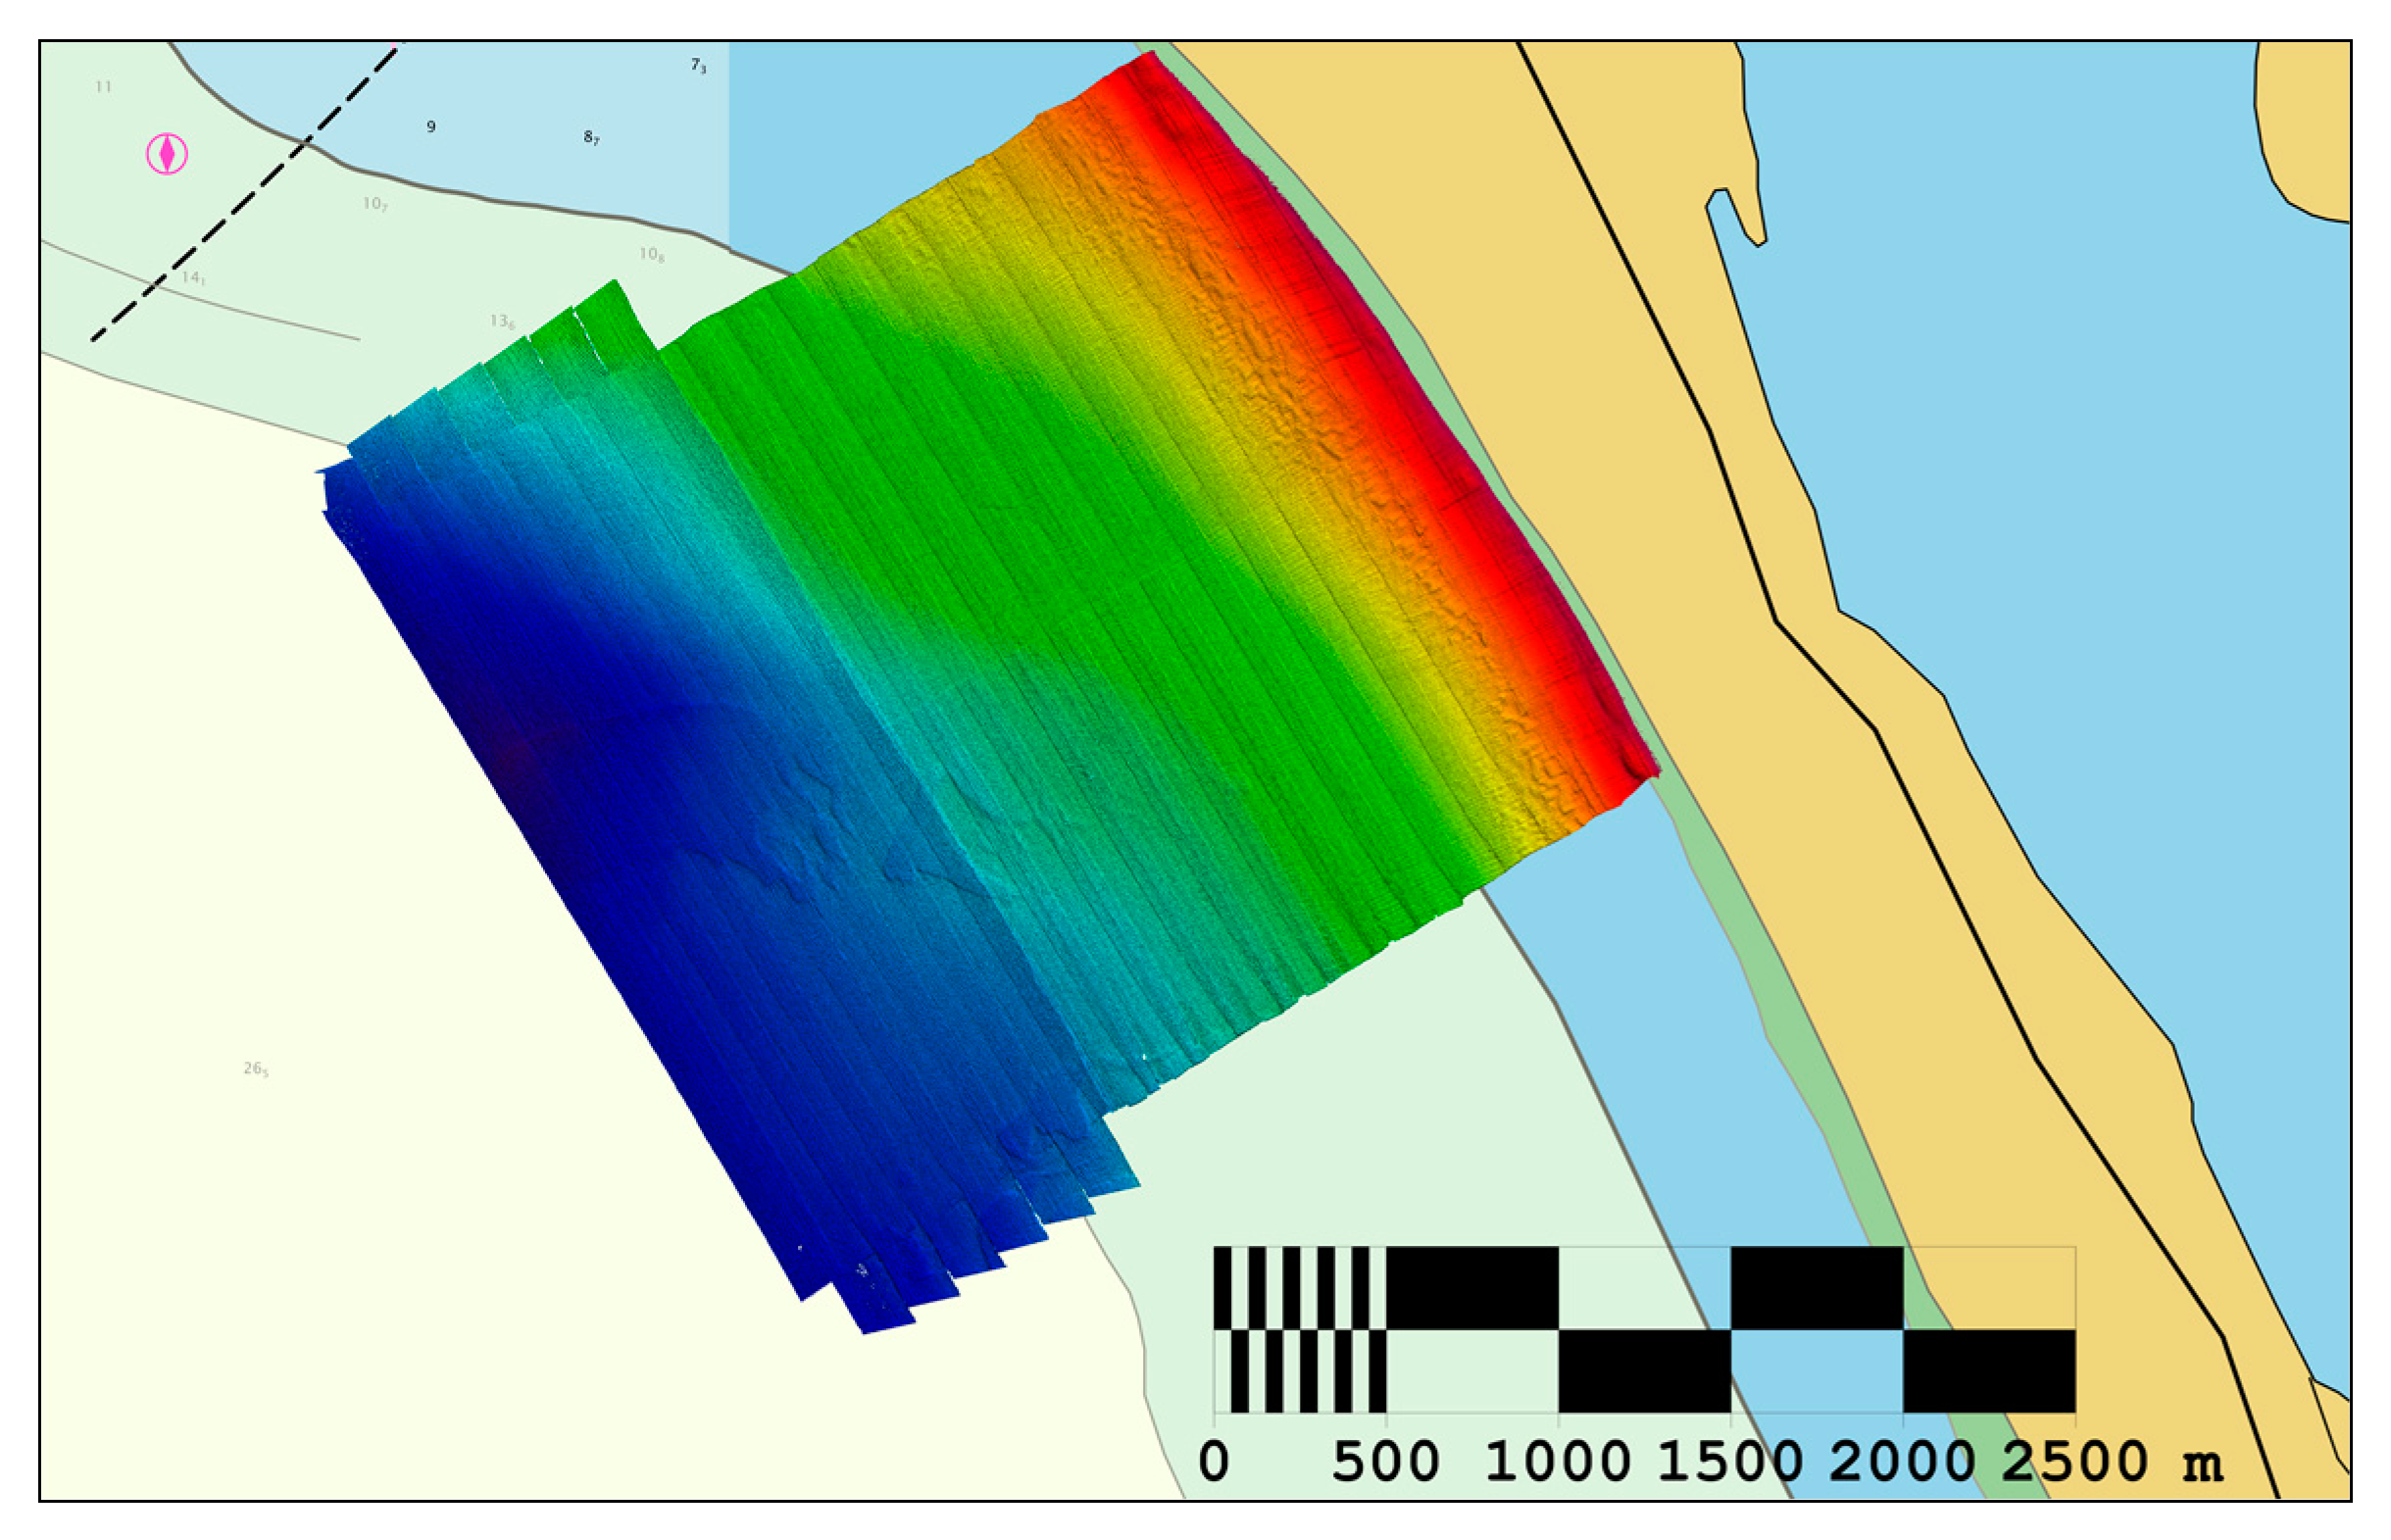
The processing workflow for the LiDAR data commenced with the synchronization of raw laser data with GNSS positioning information, followed by the processing of waveforms and the generation of the laser point cloud data file (LAS file). After its creation, the LAS file underwent a quality analysis check, which included the integration of GNSS data and the identification of various errors. A data cleaning process was then applied to the LAS file, aimed at minimizing noise (spikes) and implementing statistical quality control, finishing in an auto-processing procedure that produces the final LAS file. The final LAS file was imported into the Teledyne Caris HIPS and SIPS software, where a geoid model (Geoid PT08) was applied for reducing the depth to a certain vertical datum (in this instance, the Portuguese Chart Datum), followed by a final review of data quality. The team of hydrographers then conducted a comprehensive crossline quality control, surface statistics analysis, and visual inspection prior to the production of the final deliverables (Figure 14).
Furthermore, the distinctive pushbroom technology inherent to the system, in conjunction with the sophisticated water column processing algorithms it employs, distinguishes it as the single system currently capable of facilitating water column volume analysis and augmenting data density through the exploitation of this feature. The profound understanding of the water column afforded by the pushbroom technology enables difficult analyses of underwater contacts. This is achieved by fully leveraging the technological foundations of the system, particularly tailored for littoral mapping endeavors [61,62].
In recent years, enhancements in waveform processing have been implemented within the PILLS (RAMMS) system. These advancements encompass refined methodologies for water surface modeling, backscatter modeling, and signal attenuation, in addition to automated seabed detection. Moreover, the integration of machine learning techniques for the analysis of water parameters and seafloor surface characterization has been introduced, further augmenting the system’s capabilities.
The demarcation of the survey area into two distinct zones, one in shallow waters and the other in deeper waters, was implemented to facilitate a more streamlined processing workflow.
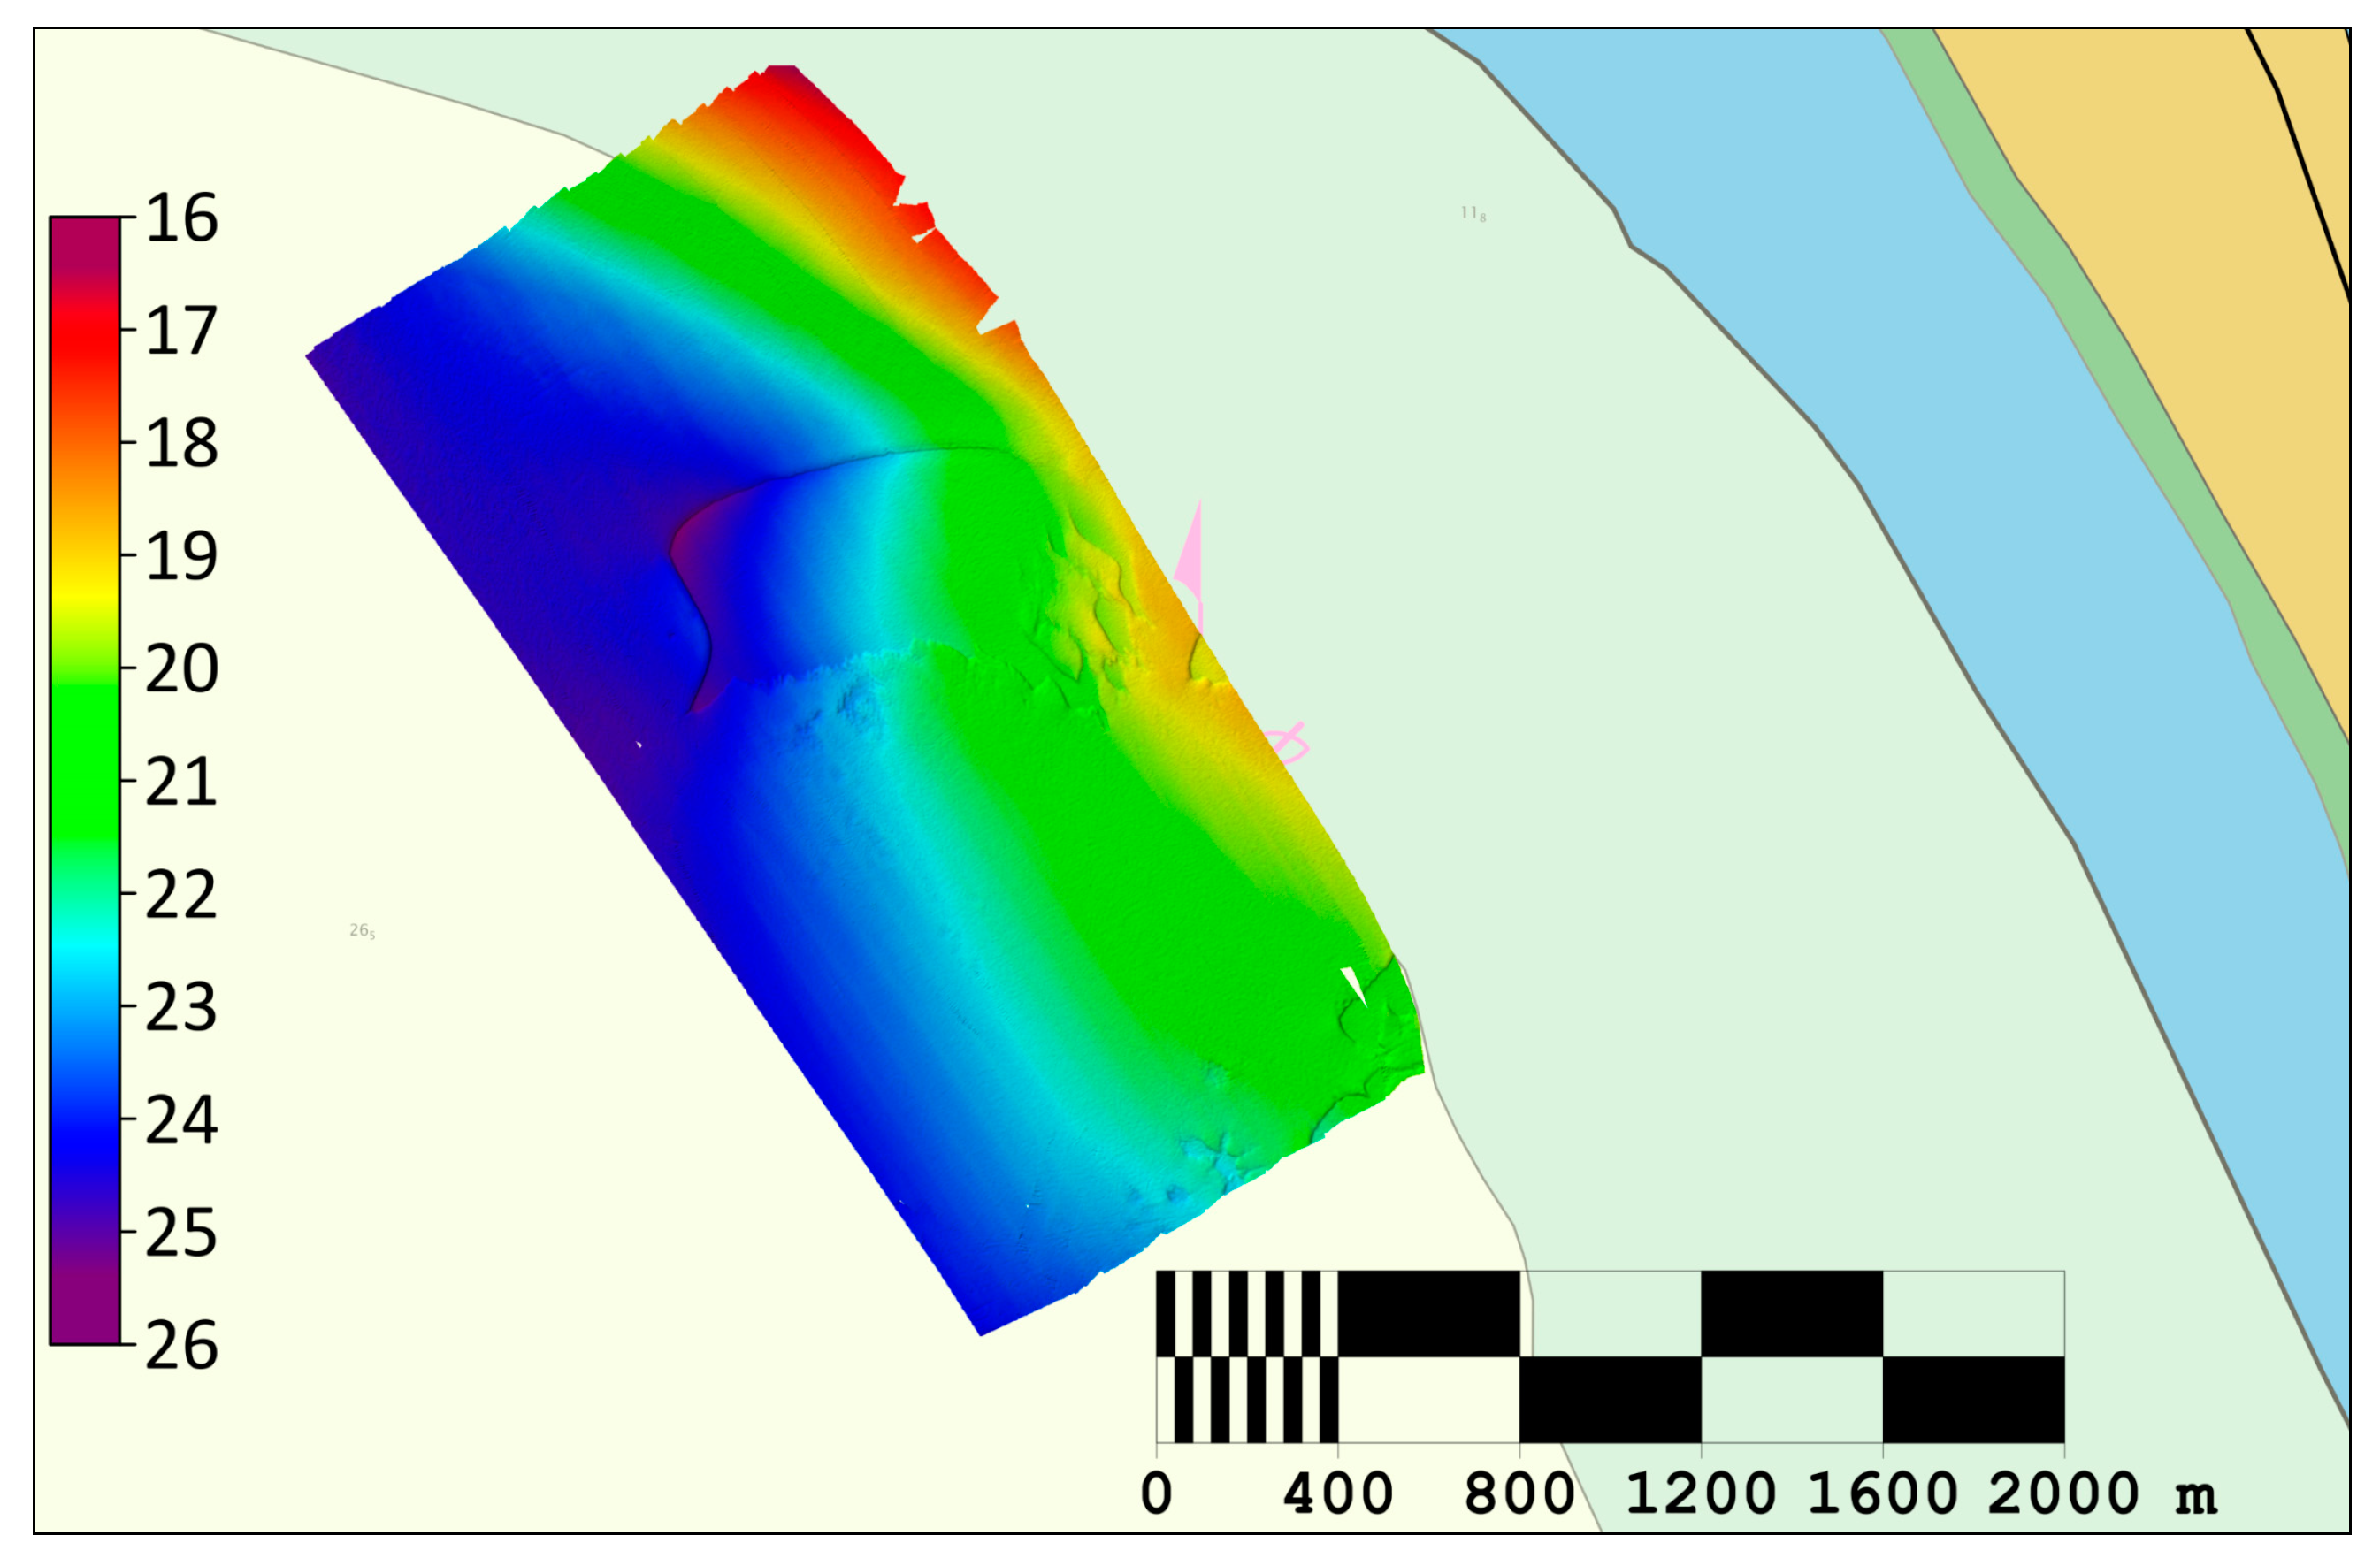
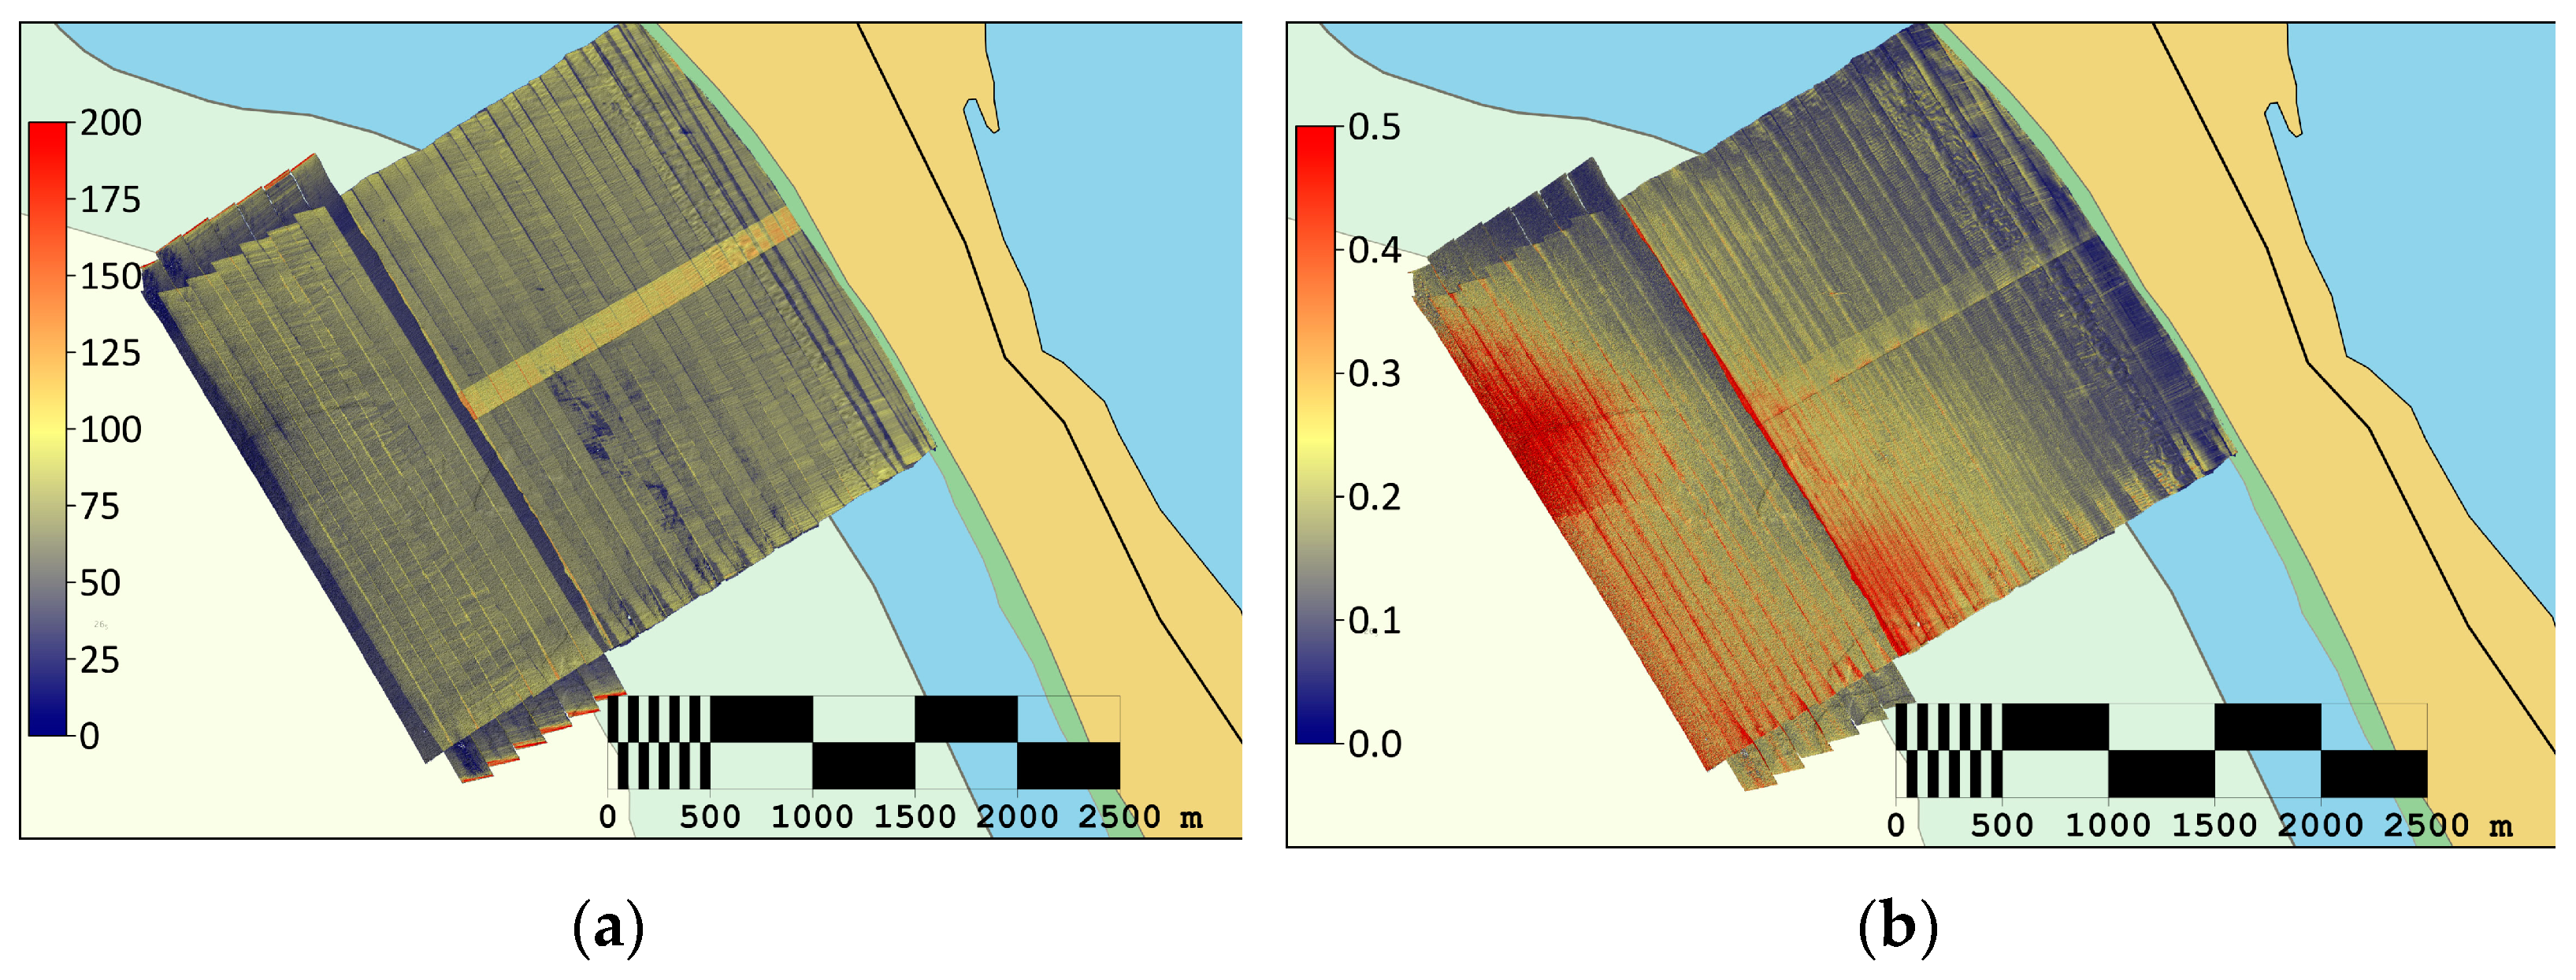
The LiDAR survey exposed an average node density of 65.60 (Figure 15a and Table 8) with a mean standard deviation of 0.2, higher in greater water depths, suggesting a diminishing accuracy of LiDAR beyond a water depth of 25 m, in this specific area.
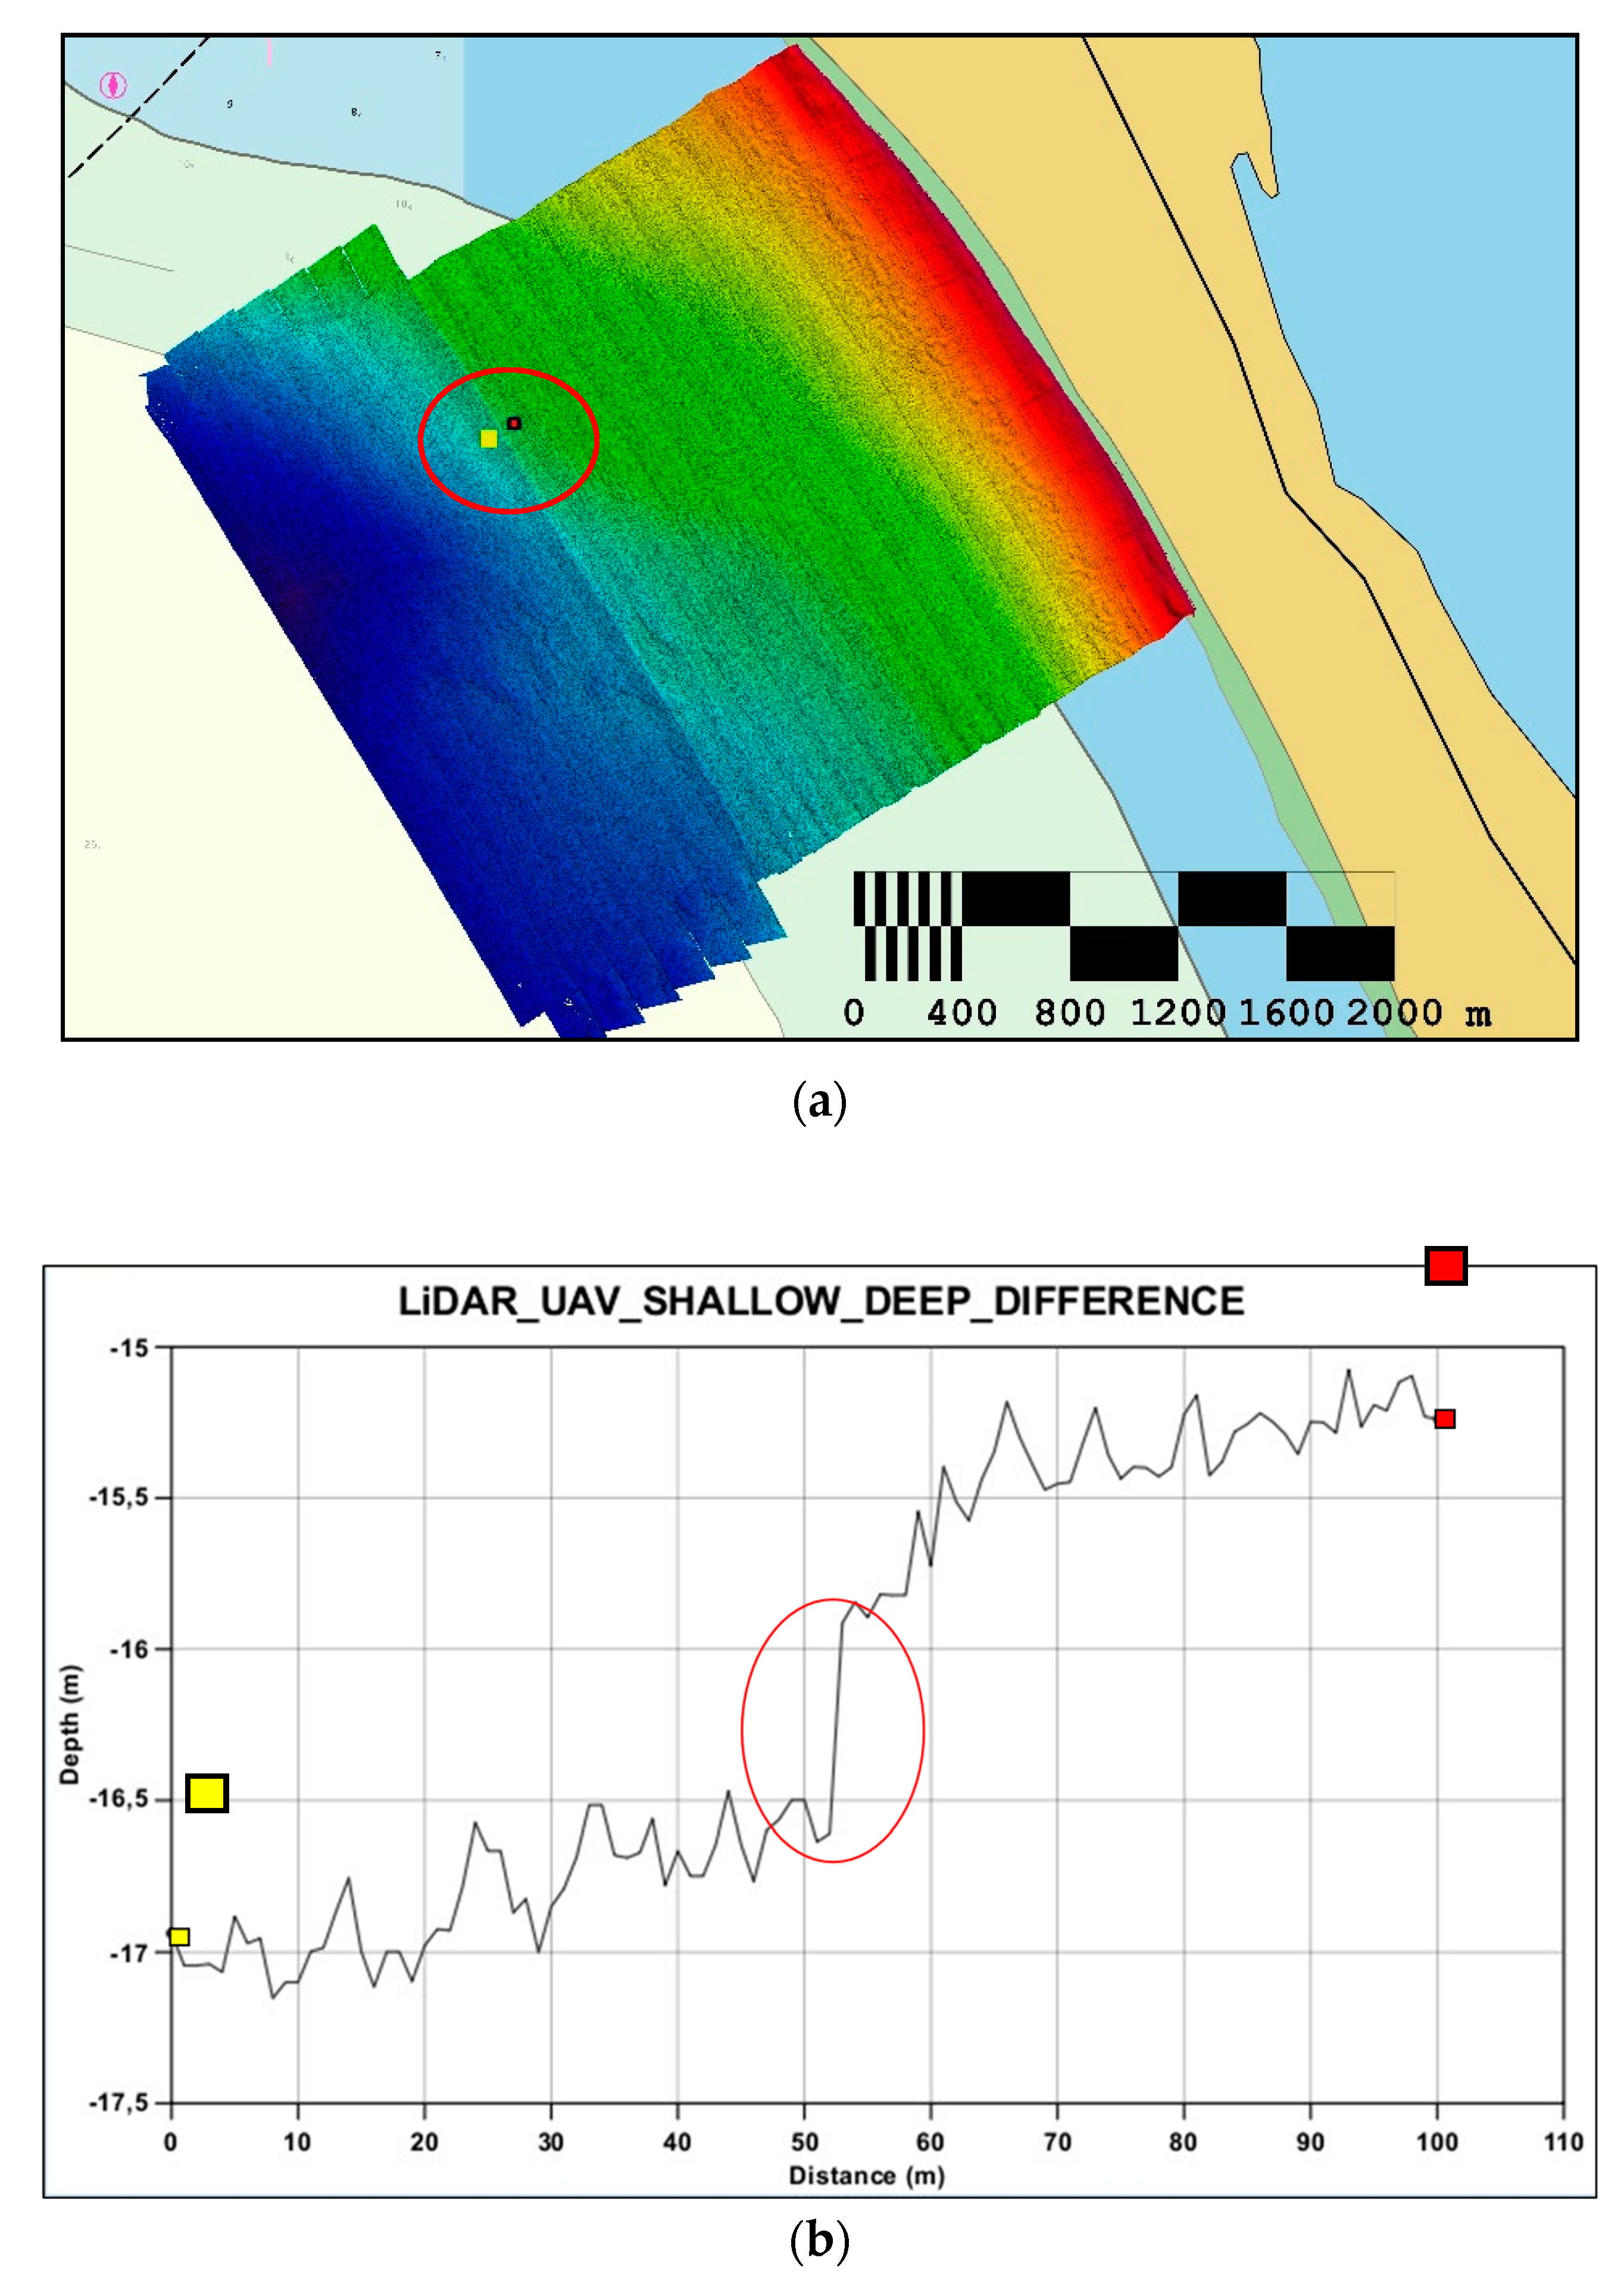
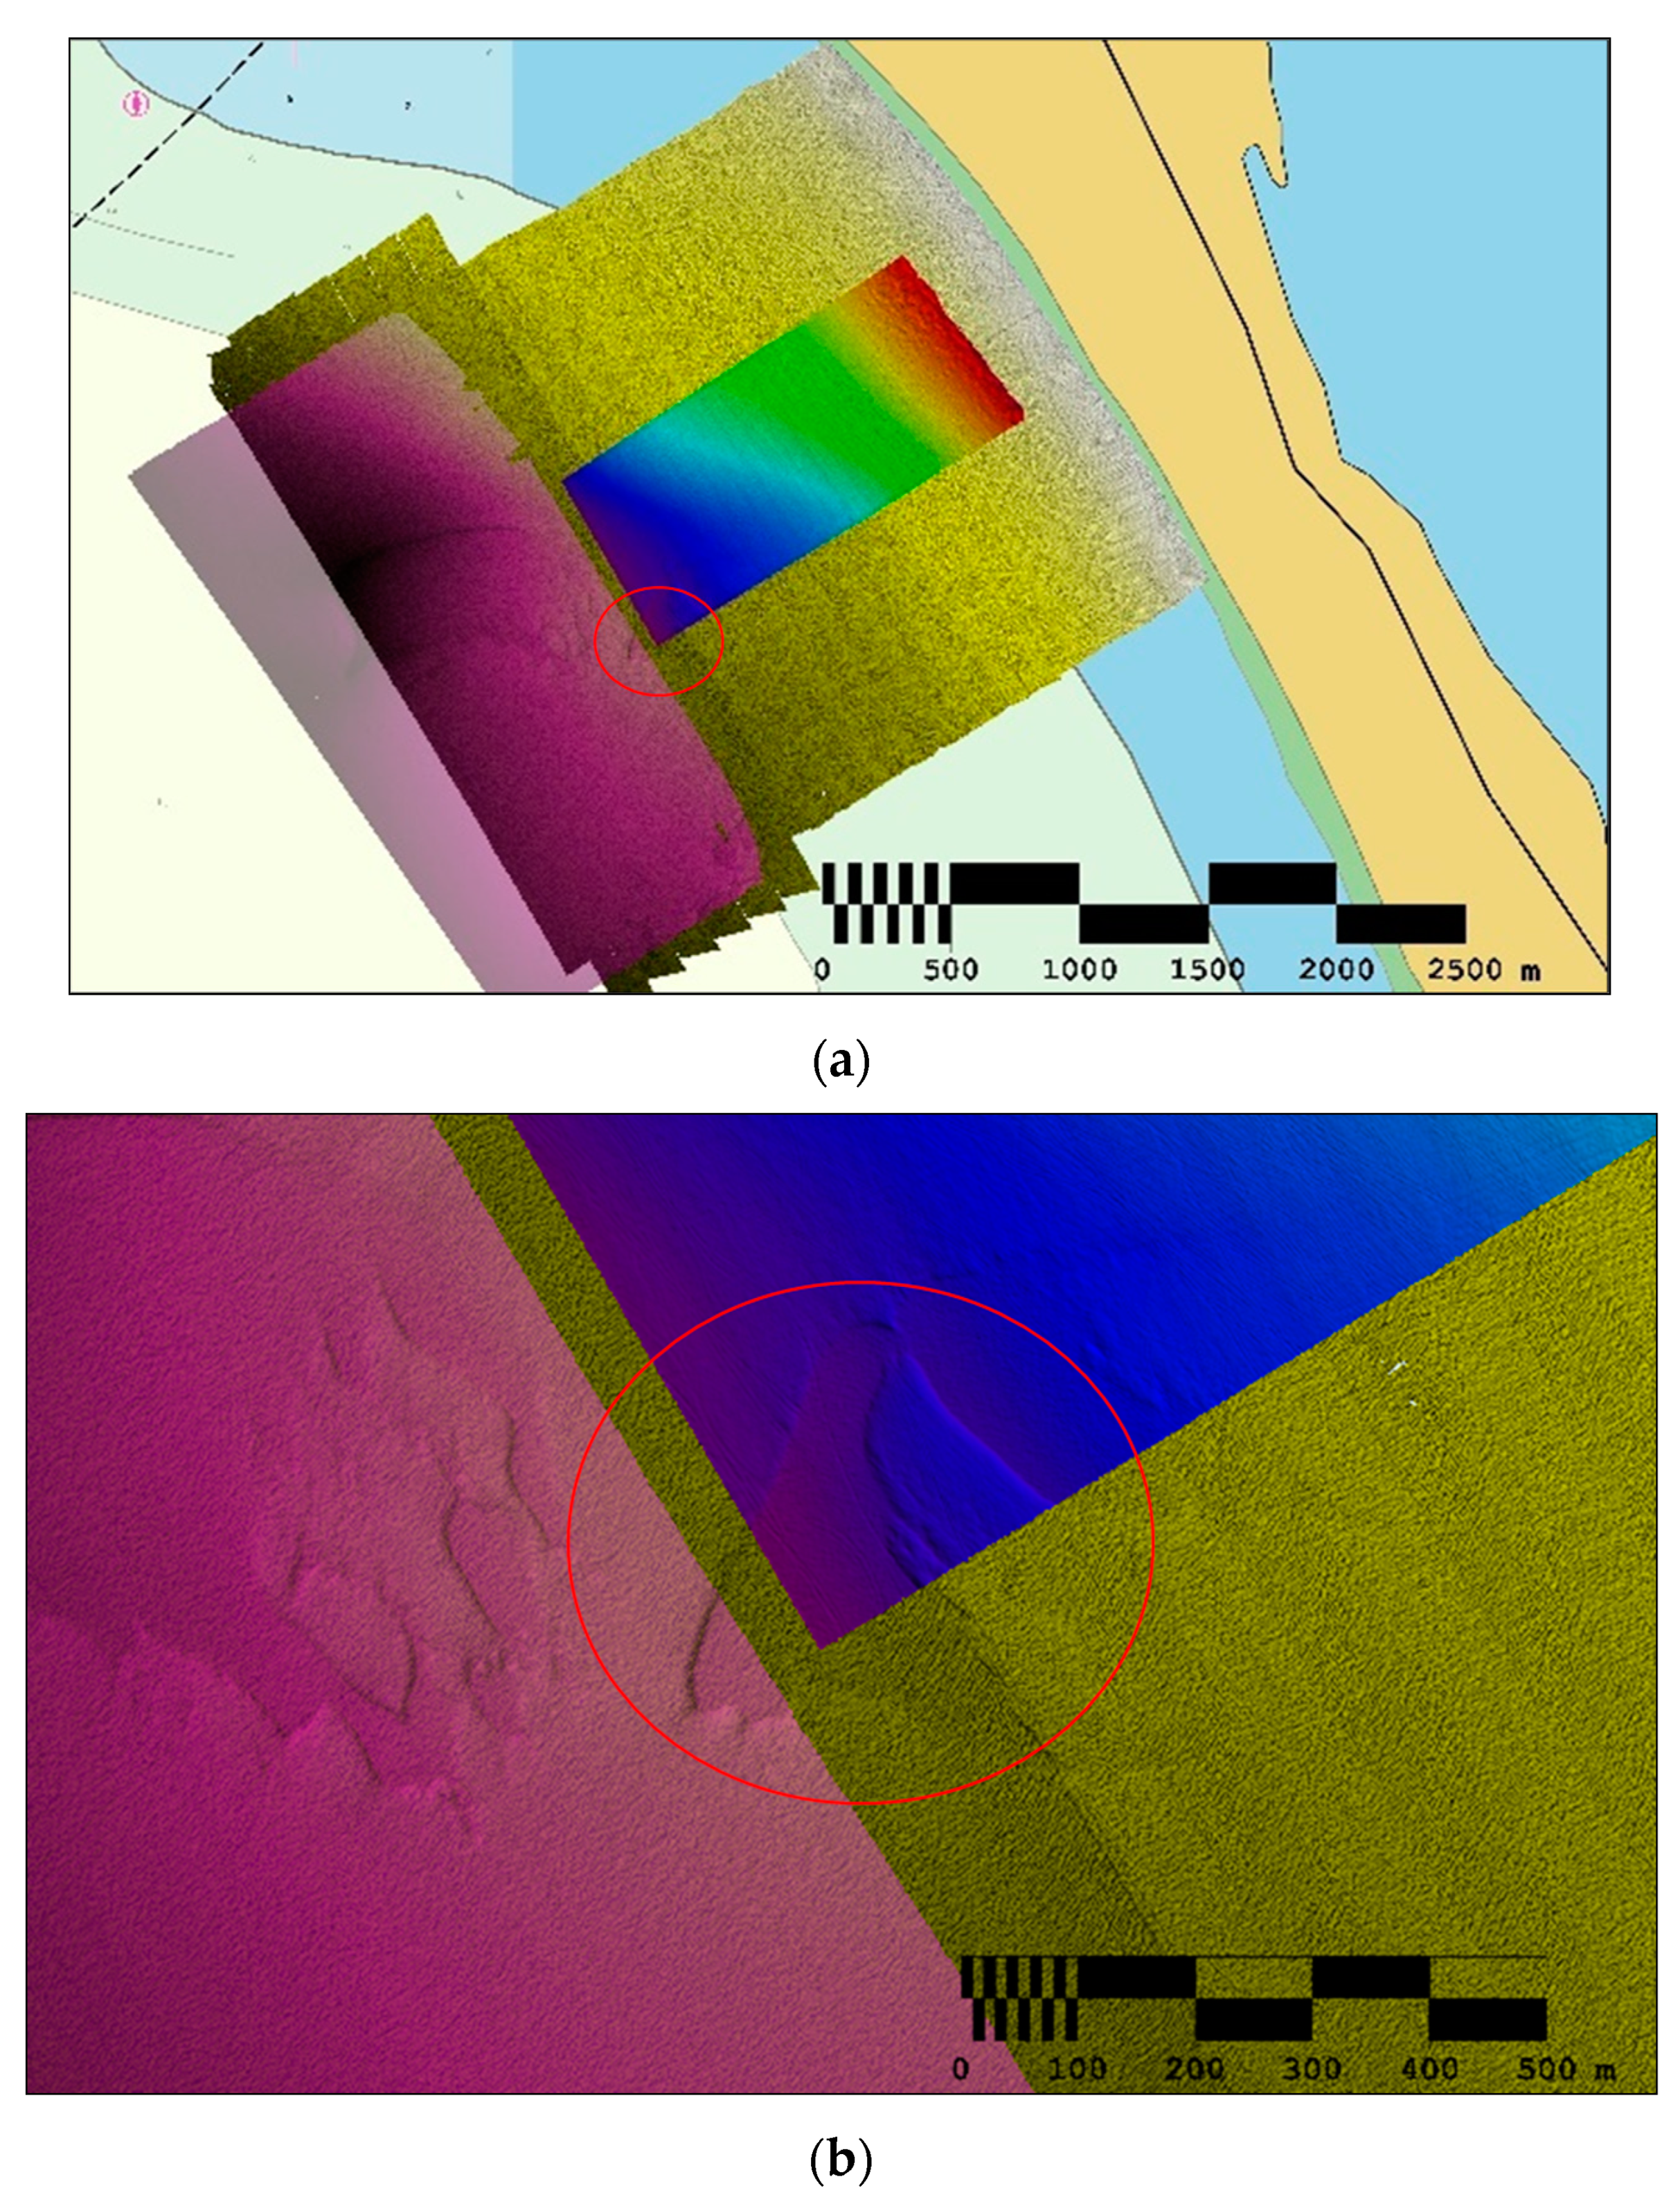
An inconsistency step was observed between the two datasets’ calibration procedures (the shallow water surface and the deeper water surface due to boresight and offset angles between the inertial navigation system and the LiDAR sensor). The deeper surface is improved since more time was given for the surveyors to refine the boresight calibration. It was discovered that the system, still being in its first use with a high scan rate of 60 Hz for the 2 AIRTRAC lasers, had a 1 nanosecond offset in the electronics of the laser and this resulted in an inconsistency step of around 0.5 m between the surfaces (highlighted on the profile in Figure 16) in the LiDAR data. However, with extra processing, these errors were acknowledged and eliminated after the experimentation.
3.4. SDB Results
After calibrating and validating the SDB processing models, the time series were merged to remove possible outliers and smooth the final composite model. A different number of statistics were computed for each pixel image to evaluate in detail the results of the final SDB model surfaces: minimum value, maximum value, mean value, median value, standard deviation value, variance value, and range (maximum–minimum) value. The mean depth values are represented in Figure 17 (chart datum) with a pseudo band coloring to better match bathymetric symbology.
In the case of each of the five selected images that had undergone prior preprocessing, the process of calibrating and validating the SDB model was thoroughly executed. ML algorithms were employed to estimate bathymetry values for depths with available training data, while the Stumpf algorithm was utilized for points at greater depths than those covered in the training data. In each instance, the dataset of soundings specific to the Troia Peninsula region were employed. Within this framework, the models were systematically trained using 80% of the 300 ground truth sounding points accessible, while the remaining 20% were reserved to rigorously assess the model’s performance.
3.5. Dataset Comparison
Given that the systems employed in this study are at an emerging stage of development with respect to their integration with unmanned systems (as is the case with the multibeam echosounder) and considering the innovative nature of the LiDAR solution trialed in this exercise, it was not feasible to predetermine a comprehensive a priori uncertainty and error assessment. Consequently, a conventional hydrographic survey was executed using a crewed vessel to fulfill the IHO S-44 special order survey requirements, in the days preceding the unmanned survey operations, in the same area of interest. The reference hydrographic survey resulted in an independent, accurate, and precise bathymetric model, thereby functioning as the definitive reference standard for MUS surveys.
The primary methodology for quantifying errors in the datasets assessed in this study involves a comparative analysis with the results from the reference survey, focusing on the standard deviation and density values for each of the resulting MUS bathymetric models. Moreover, a histogram analysis between the MUS models and the reference survey and a comparison between depth contours between the MUS data and the local electronic nautical chart (ENC), complemented by cross-comparisons among all datasets to evaluate vertical and horizontal accuracy and precision, were conducted.
3.5.1. Horizontal Accuracy Comparison
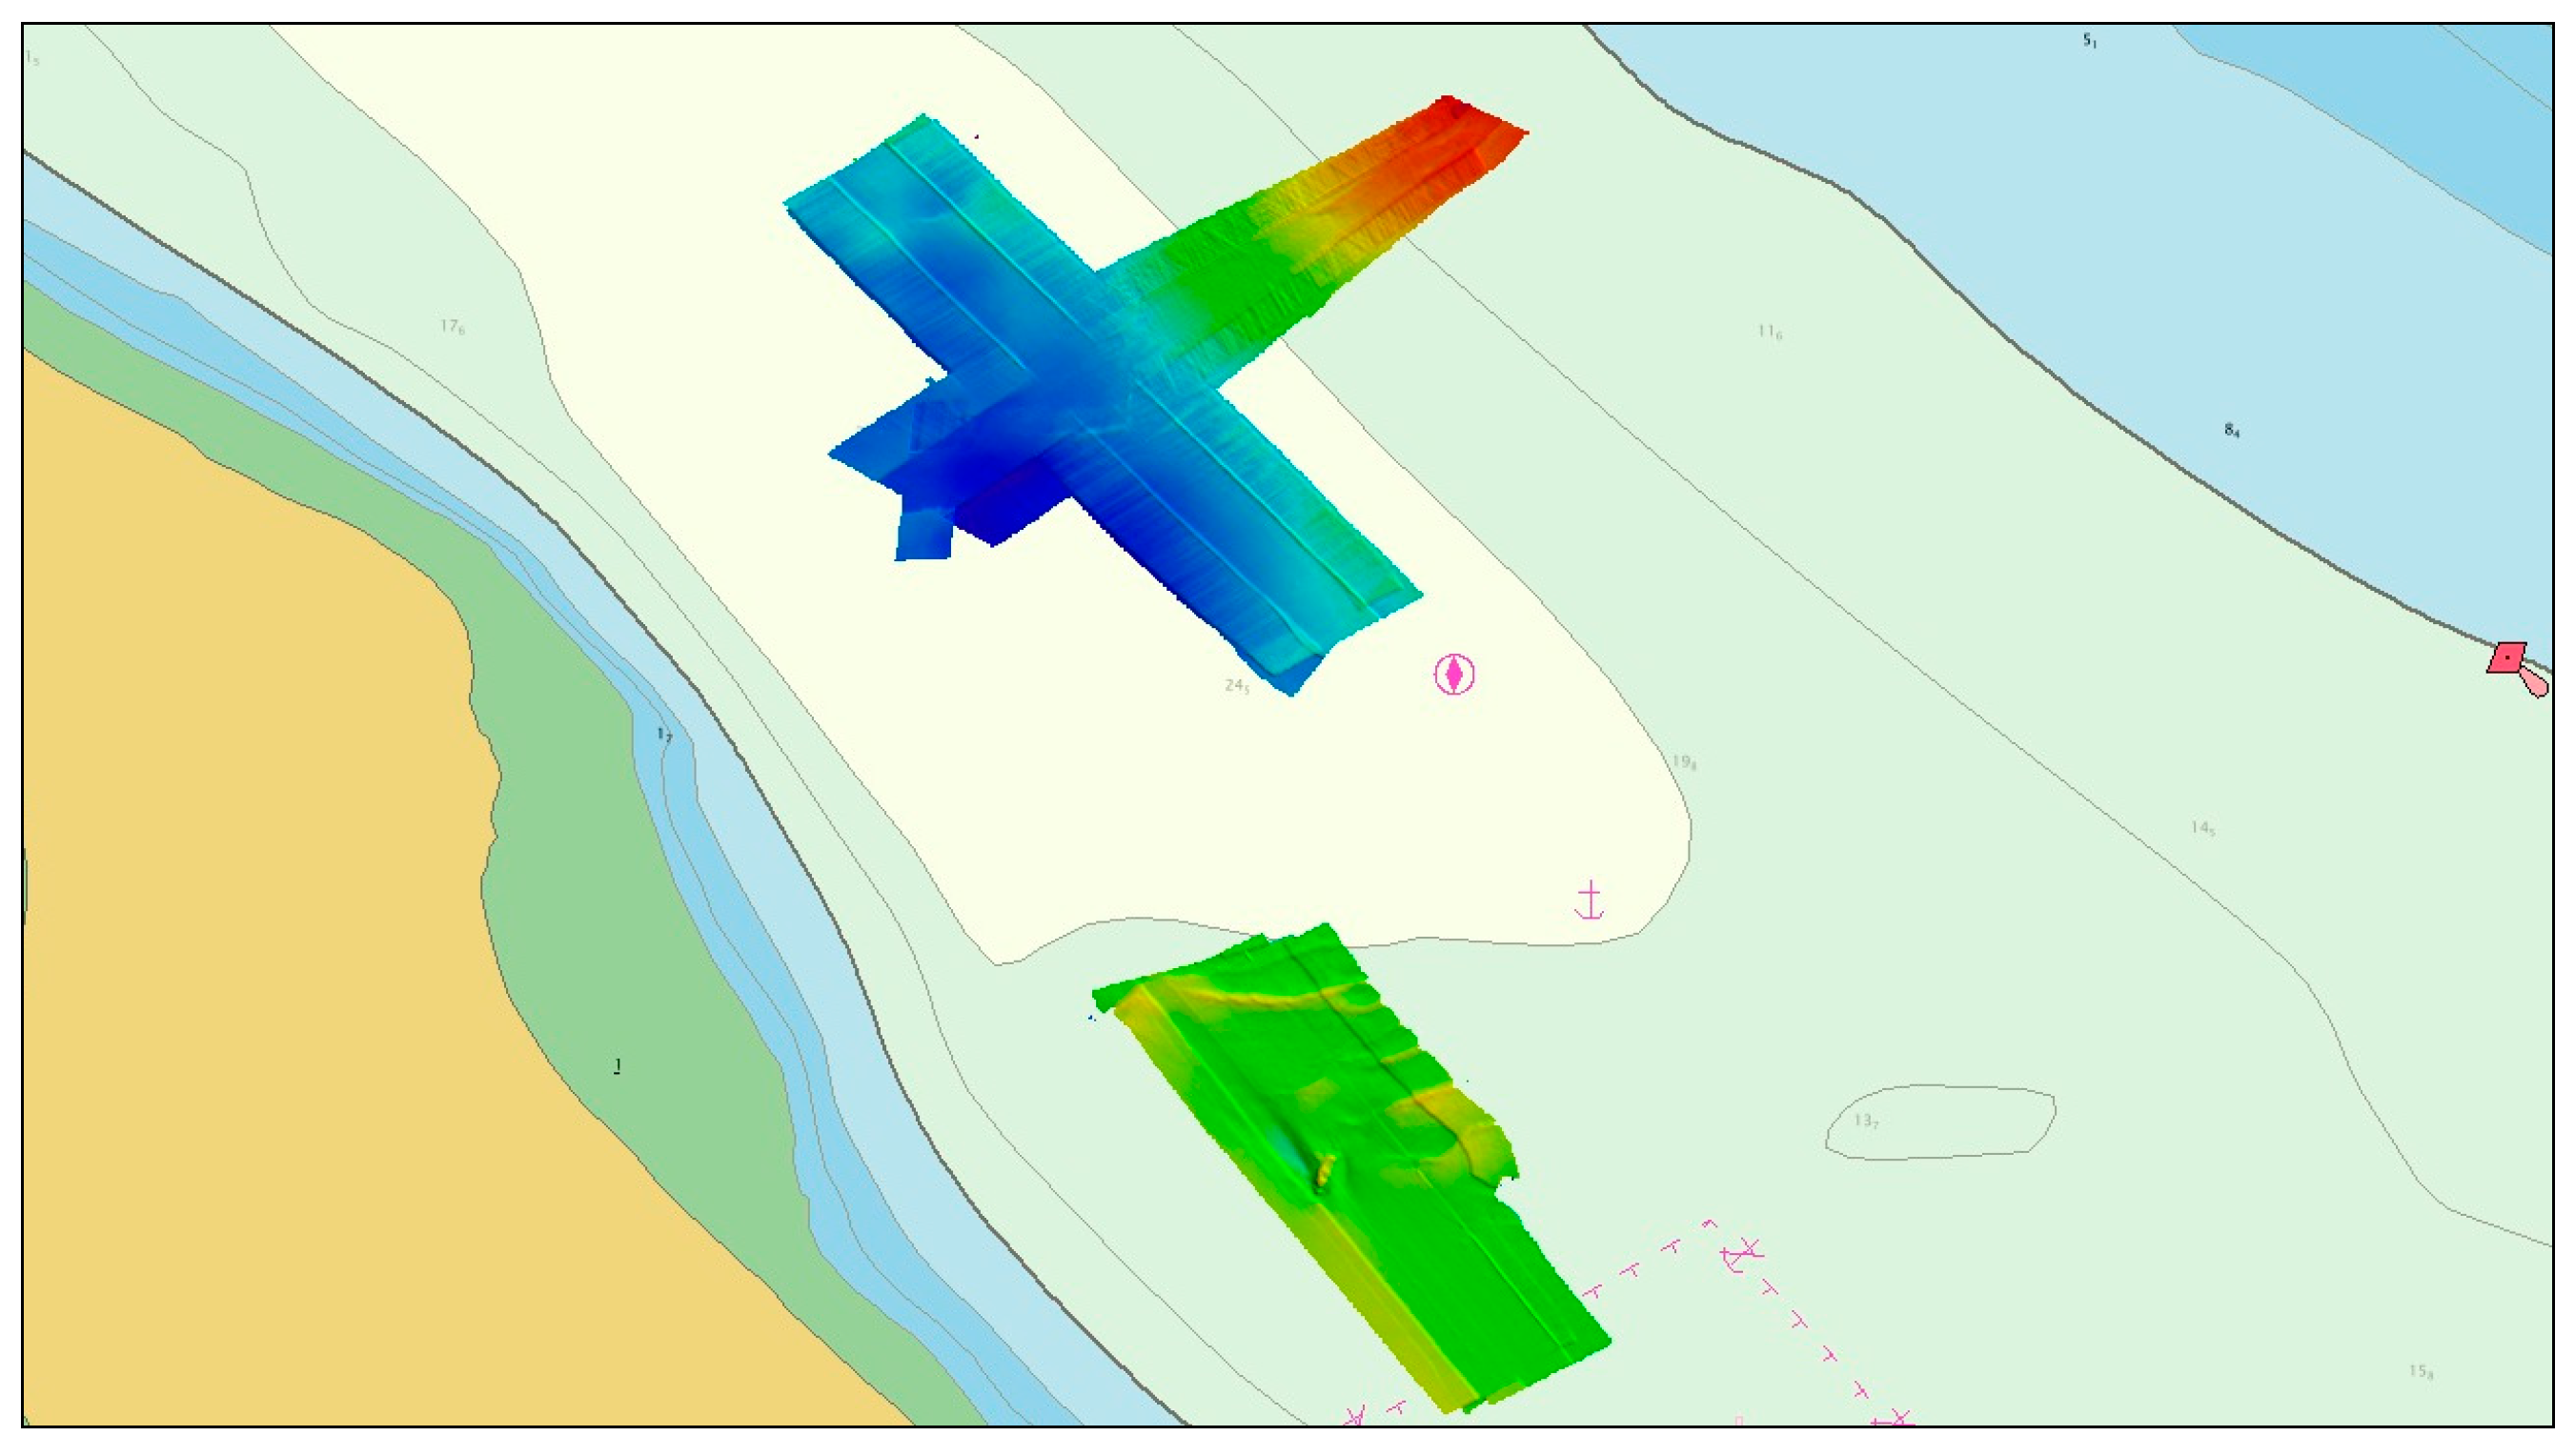
In the context of hydrographic surveying, horizontal accuracy typically possesses a broader tolerance margin compared to vertical accuracy, in accordance with most IHO and industry standards. Nonetheless, from a military perspective, horizontal accuracy and precision are paramount due to the imperative need for precise object detection capabilities inherent in these systems. Figure 18 illustrates the overlay of three datasets upon an identical geomorphological sand formation, showing a coherent correspondence. This alignment indicates the accurate horizontal resolution of the systems in question, underscoring their capability for precise spatial delineation.
The horizontal accuracy of SDB is naturally linked to the spatial resolution of the employed satellite sensor, resulting in bathymetric data uncertainties that typically correspond to the dimension of one pixel. In this study, Sentinel-2 imagery, which possesses a spatial resolution of 10 m, was utilized. Consequently, for a product with a 10 m resolution, the horizontal accuracy is anticipated to be in the same range. This limitation in spatial resolution is the primary reason SDB techniques have not yet been extensively adopted for underwater object detection applications.
3.5.2. Vertical Accuracy Comparison
In the context of dataset comparison, the designated approach involved comparing the UAV LiDAR and SDB datasets with the reference survey bathymetric model and creating several Difference surfaces to assess the accuracy and precision of the data. However, it is noteworthy that the coverage area of the USV MB dataset did not align with the coverage of the reference survey; therefore, cross-comparisons with the other available survey datasets were conducted.
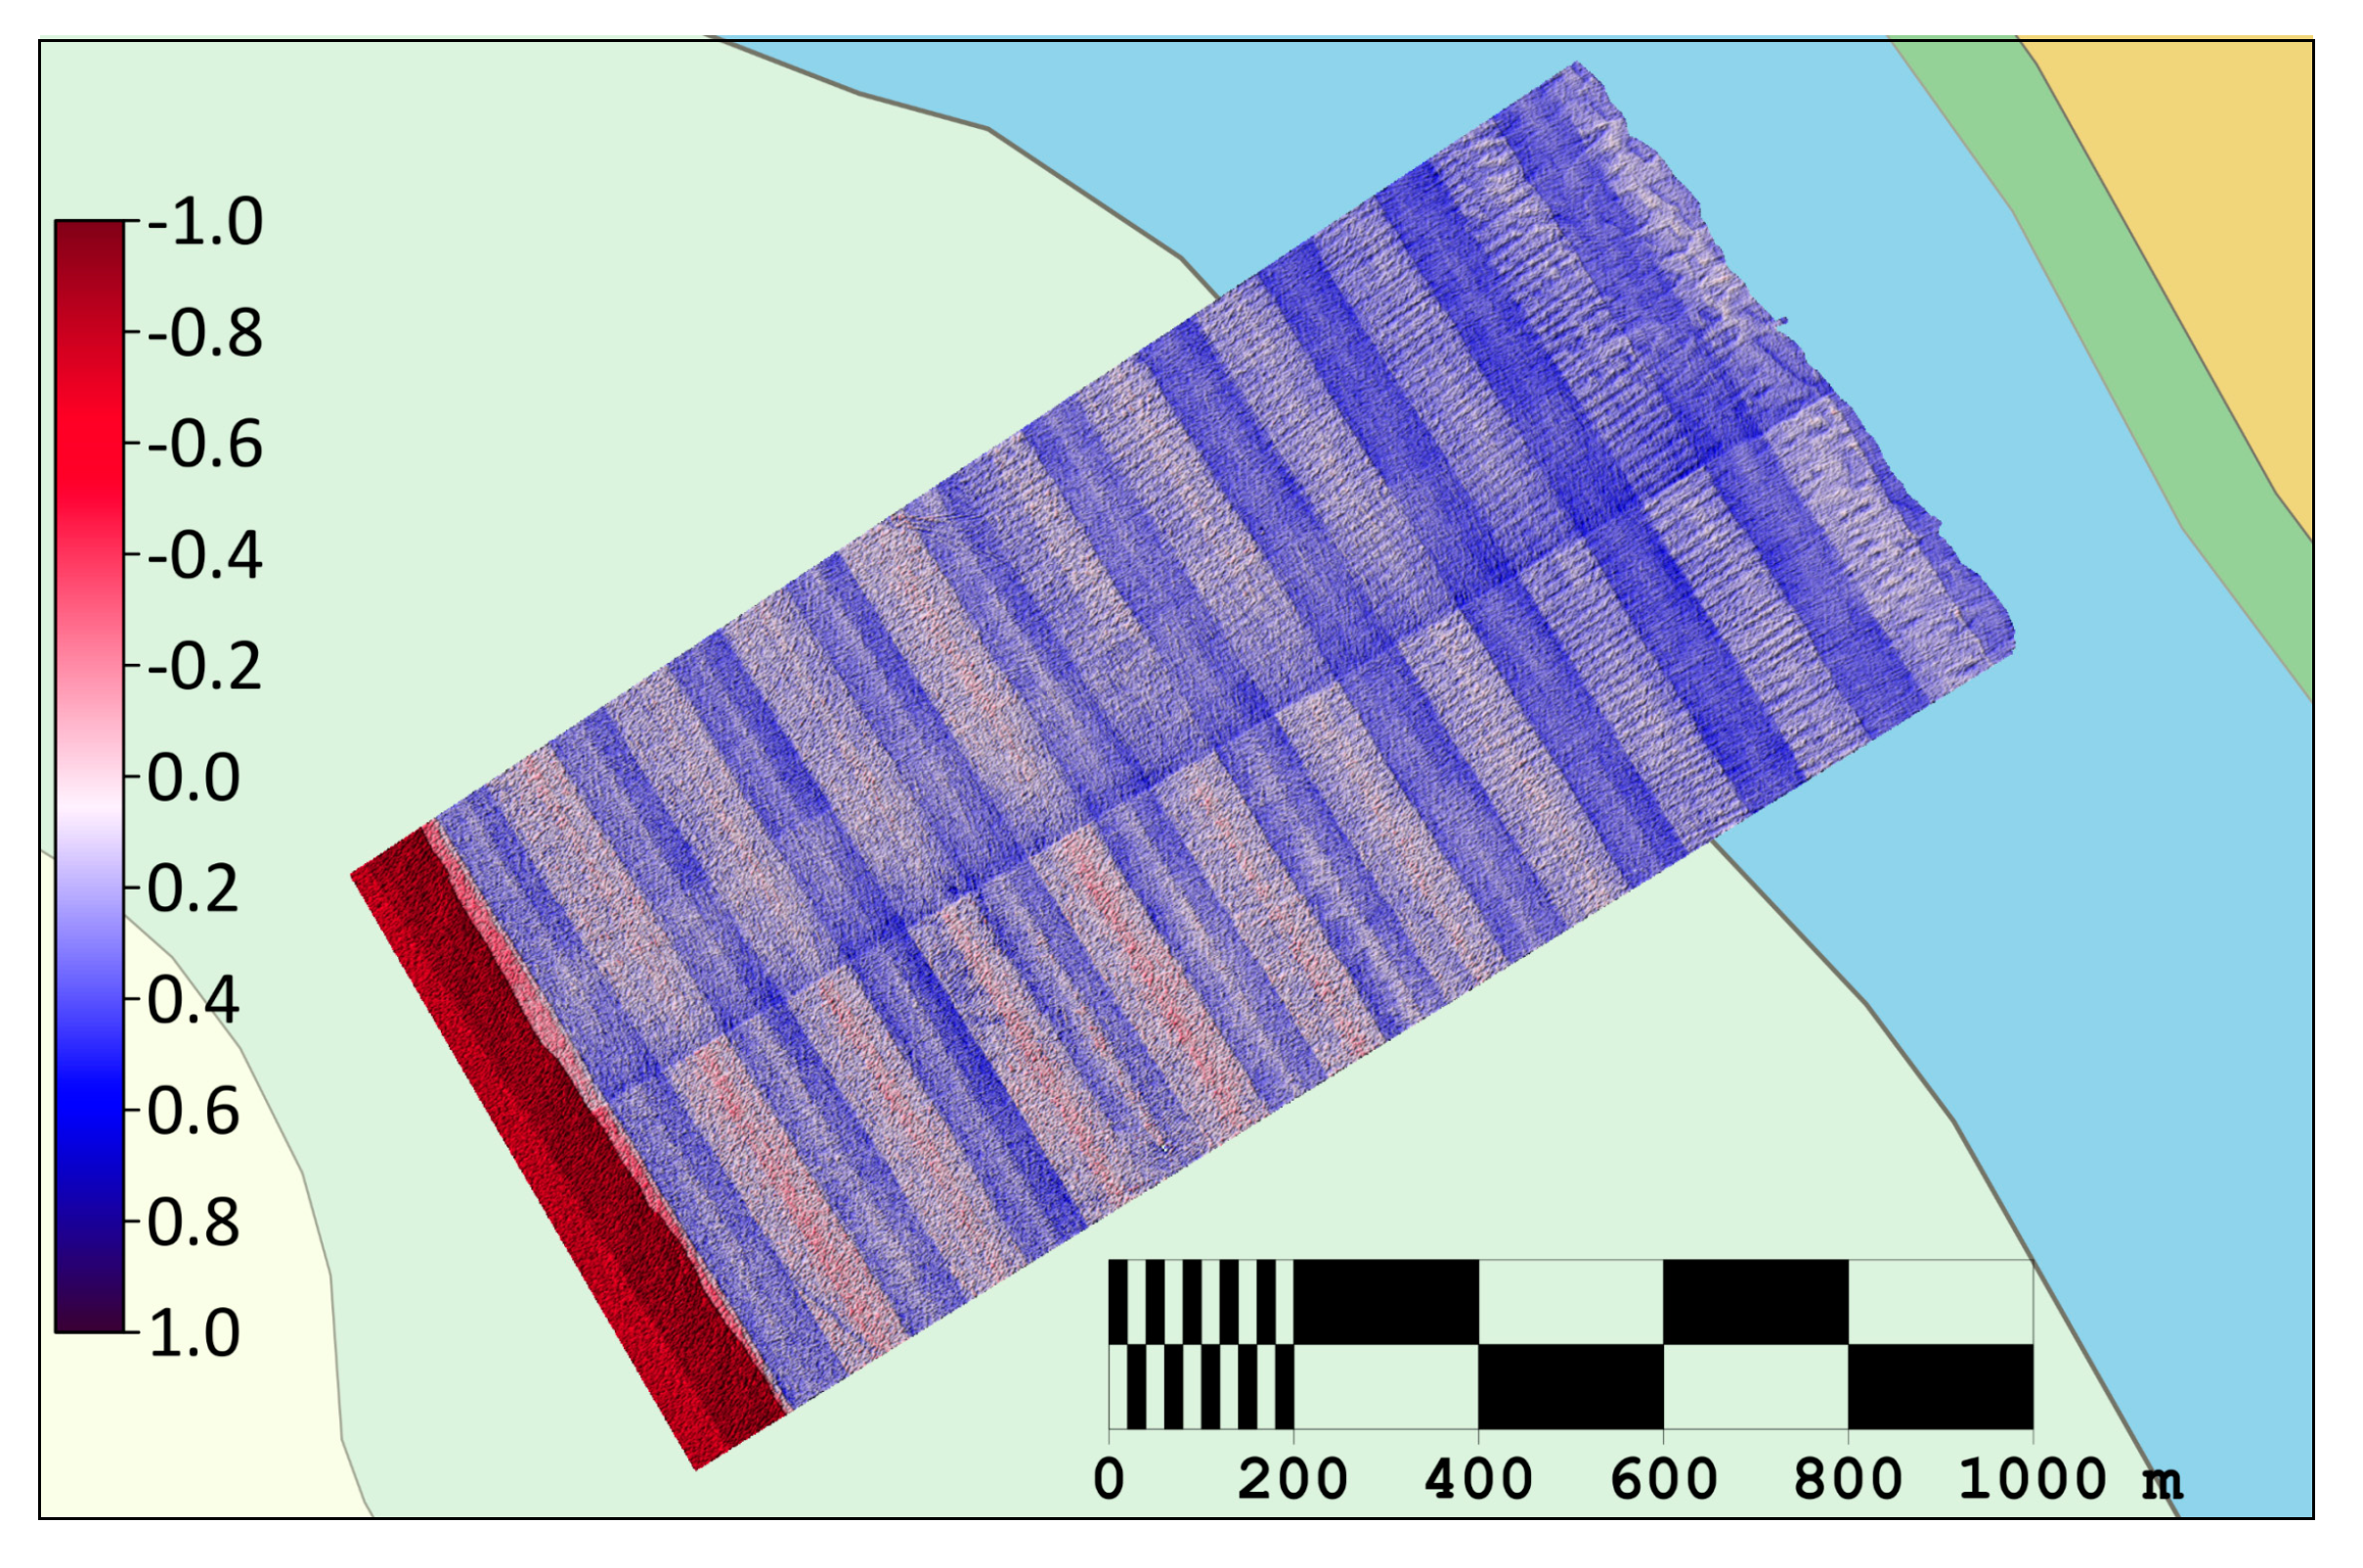
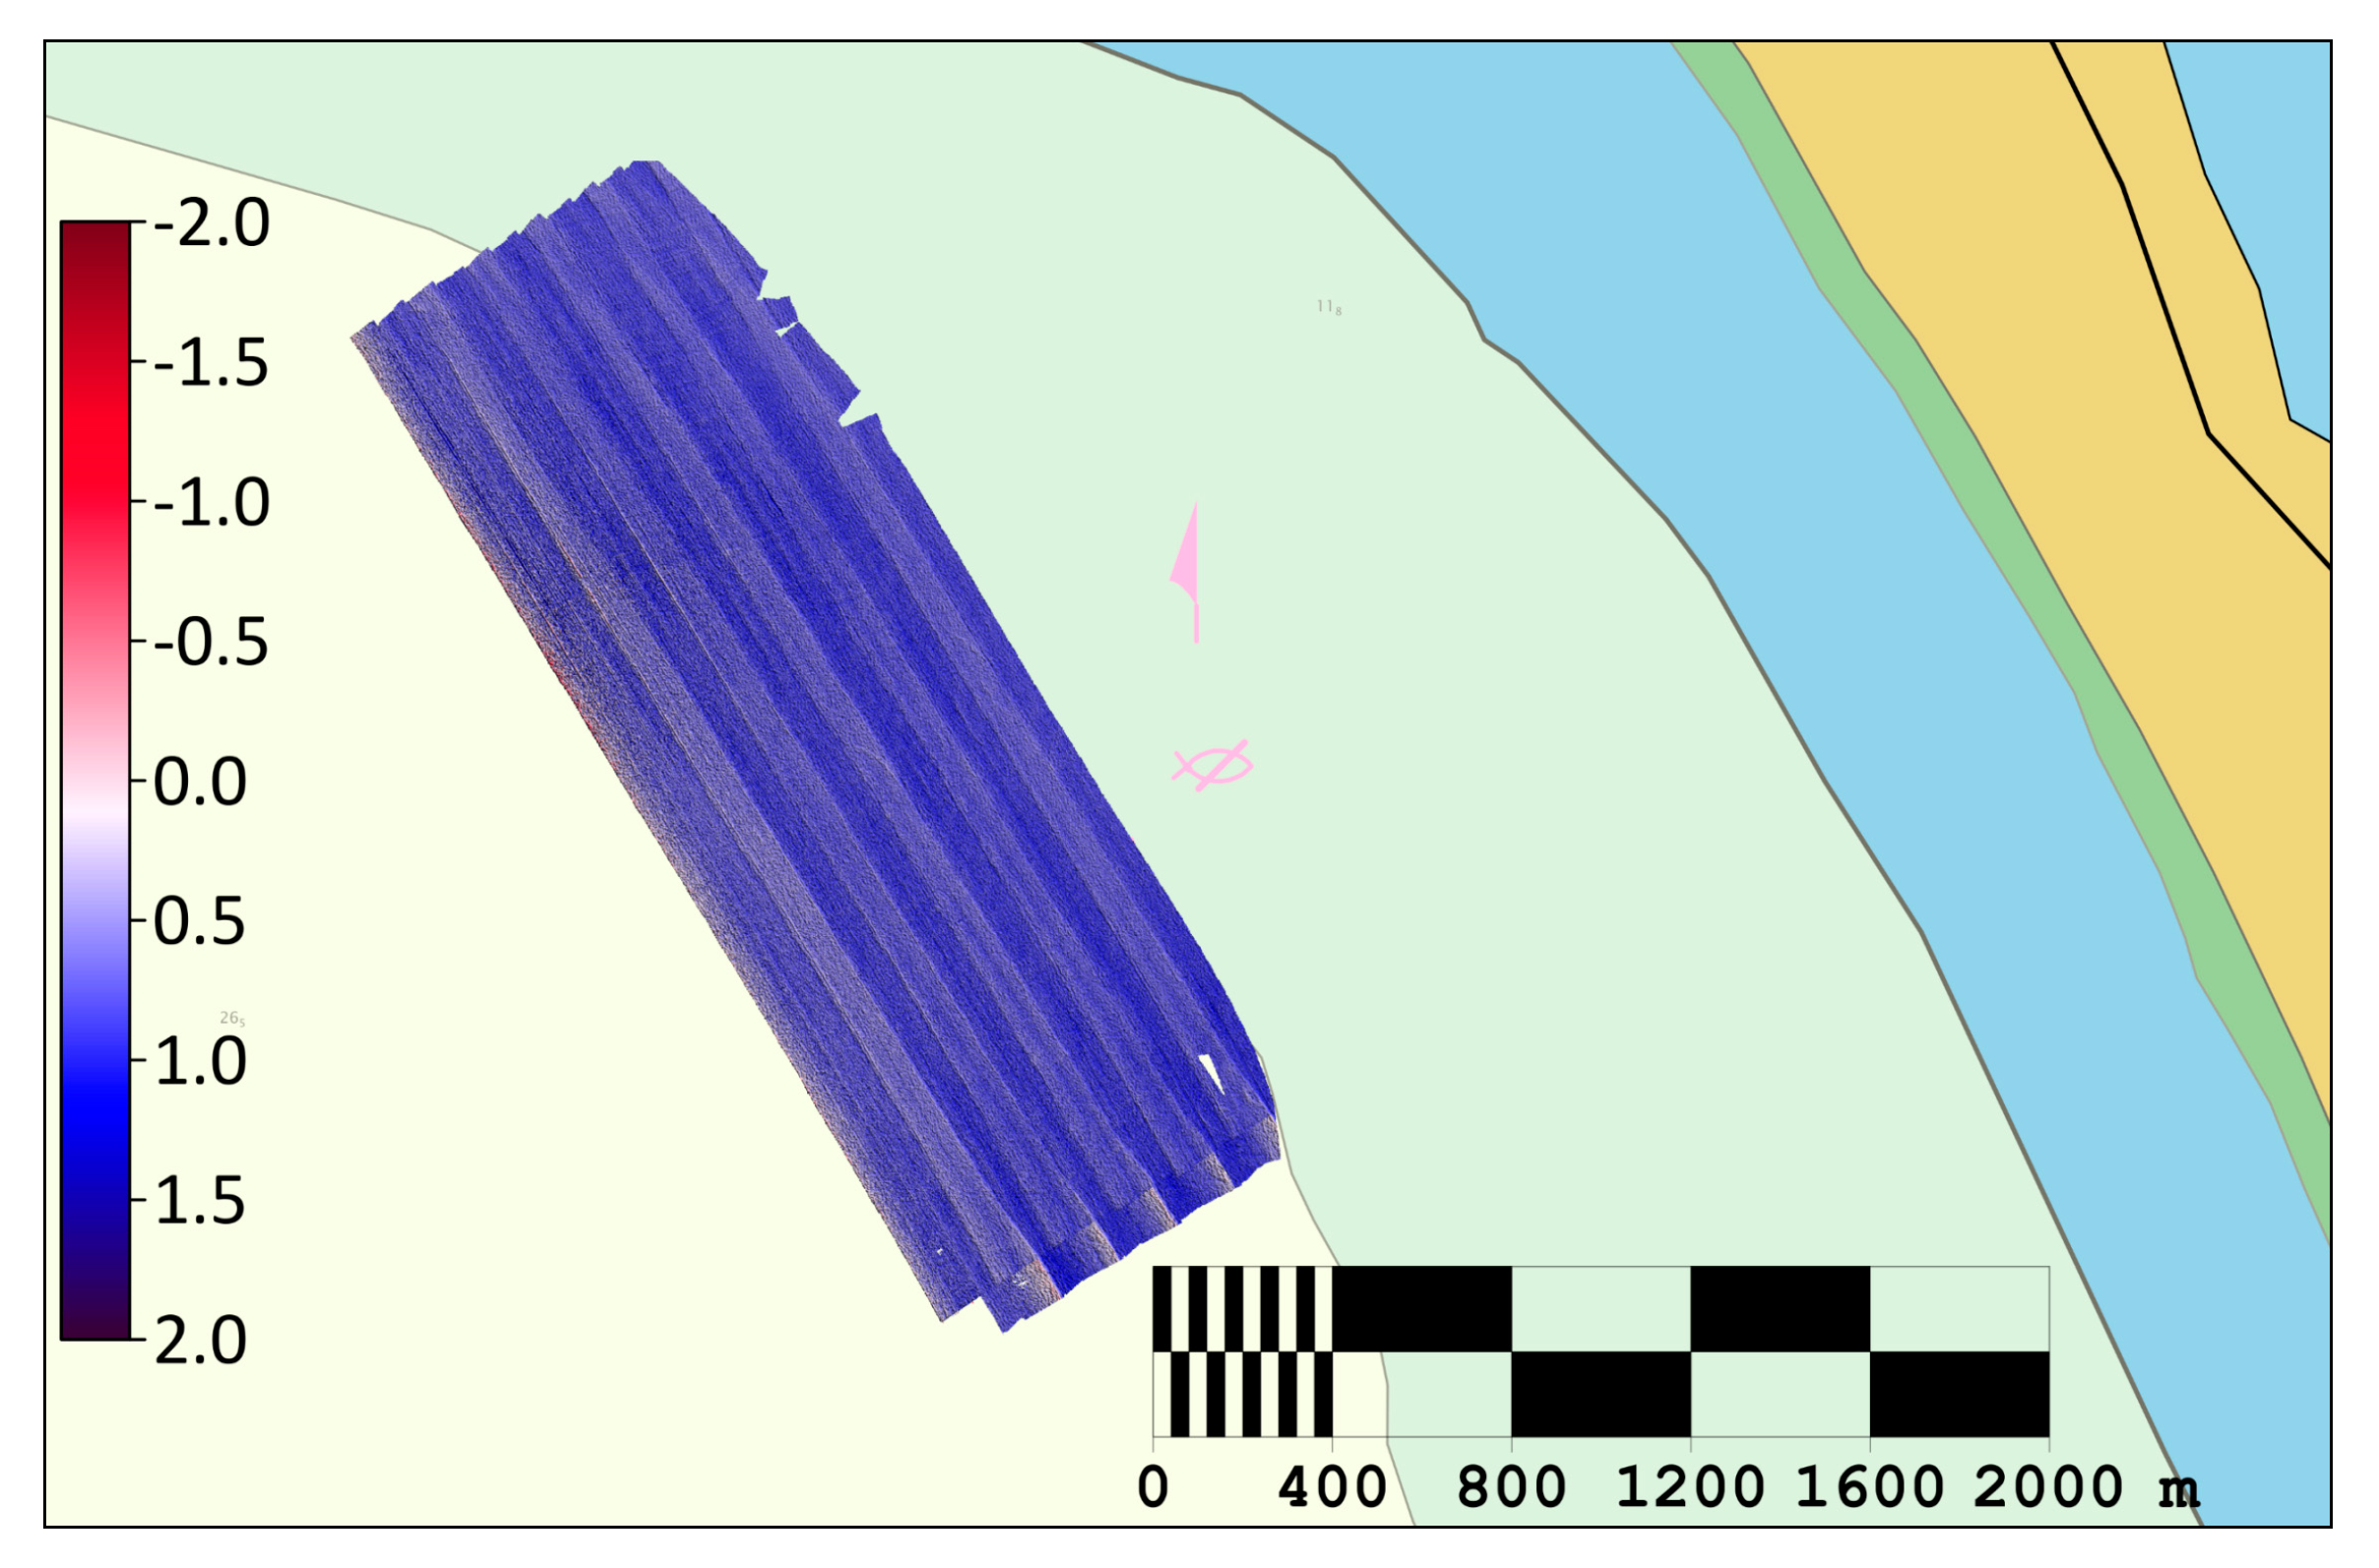
The comparative analysis of the difference surface generated by the UAV LiDAR survey and the reference survey (Figure 19) exposes discrepancies predominantly along the track of the trajectory of the LiDAR scan, where minor artefacts are observed, mainly due to the boresight calibration and the delay between the internal LiDAR systems (Figure 20). These variations, however, remain within a maximum threshold of 0.2 m.
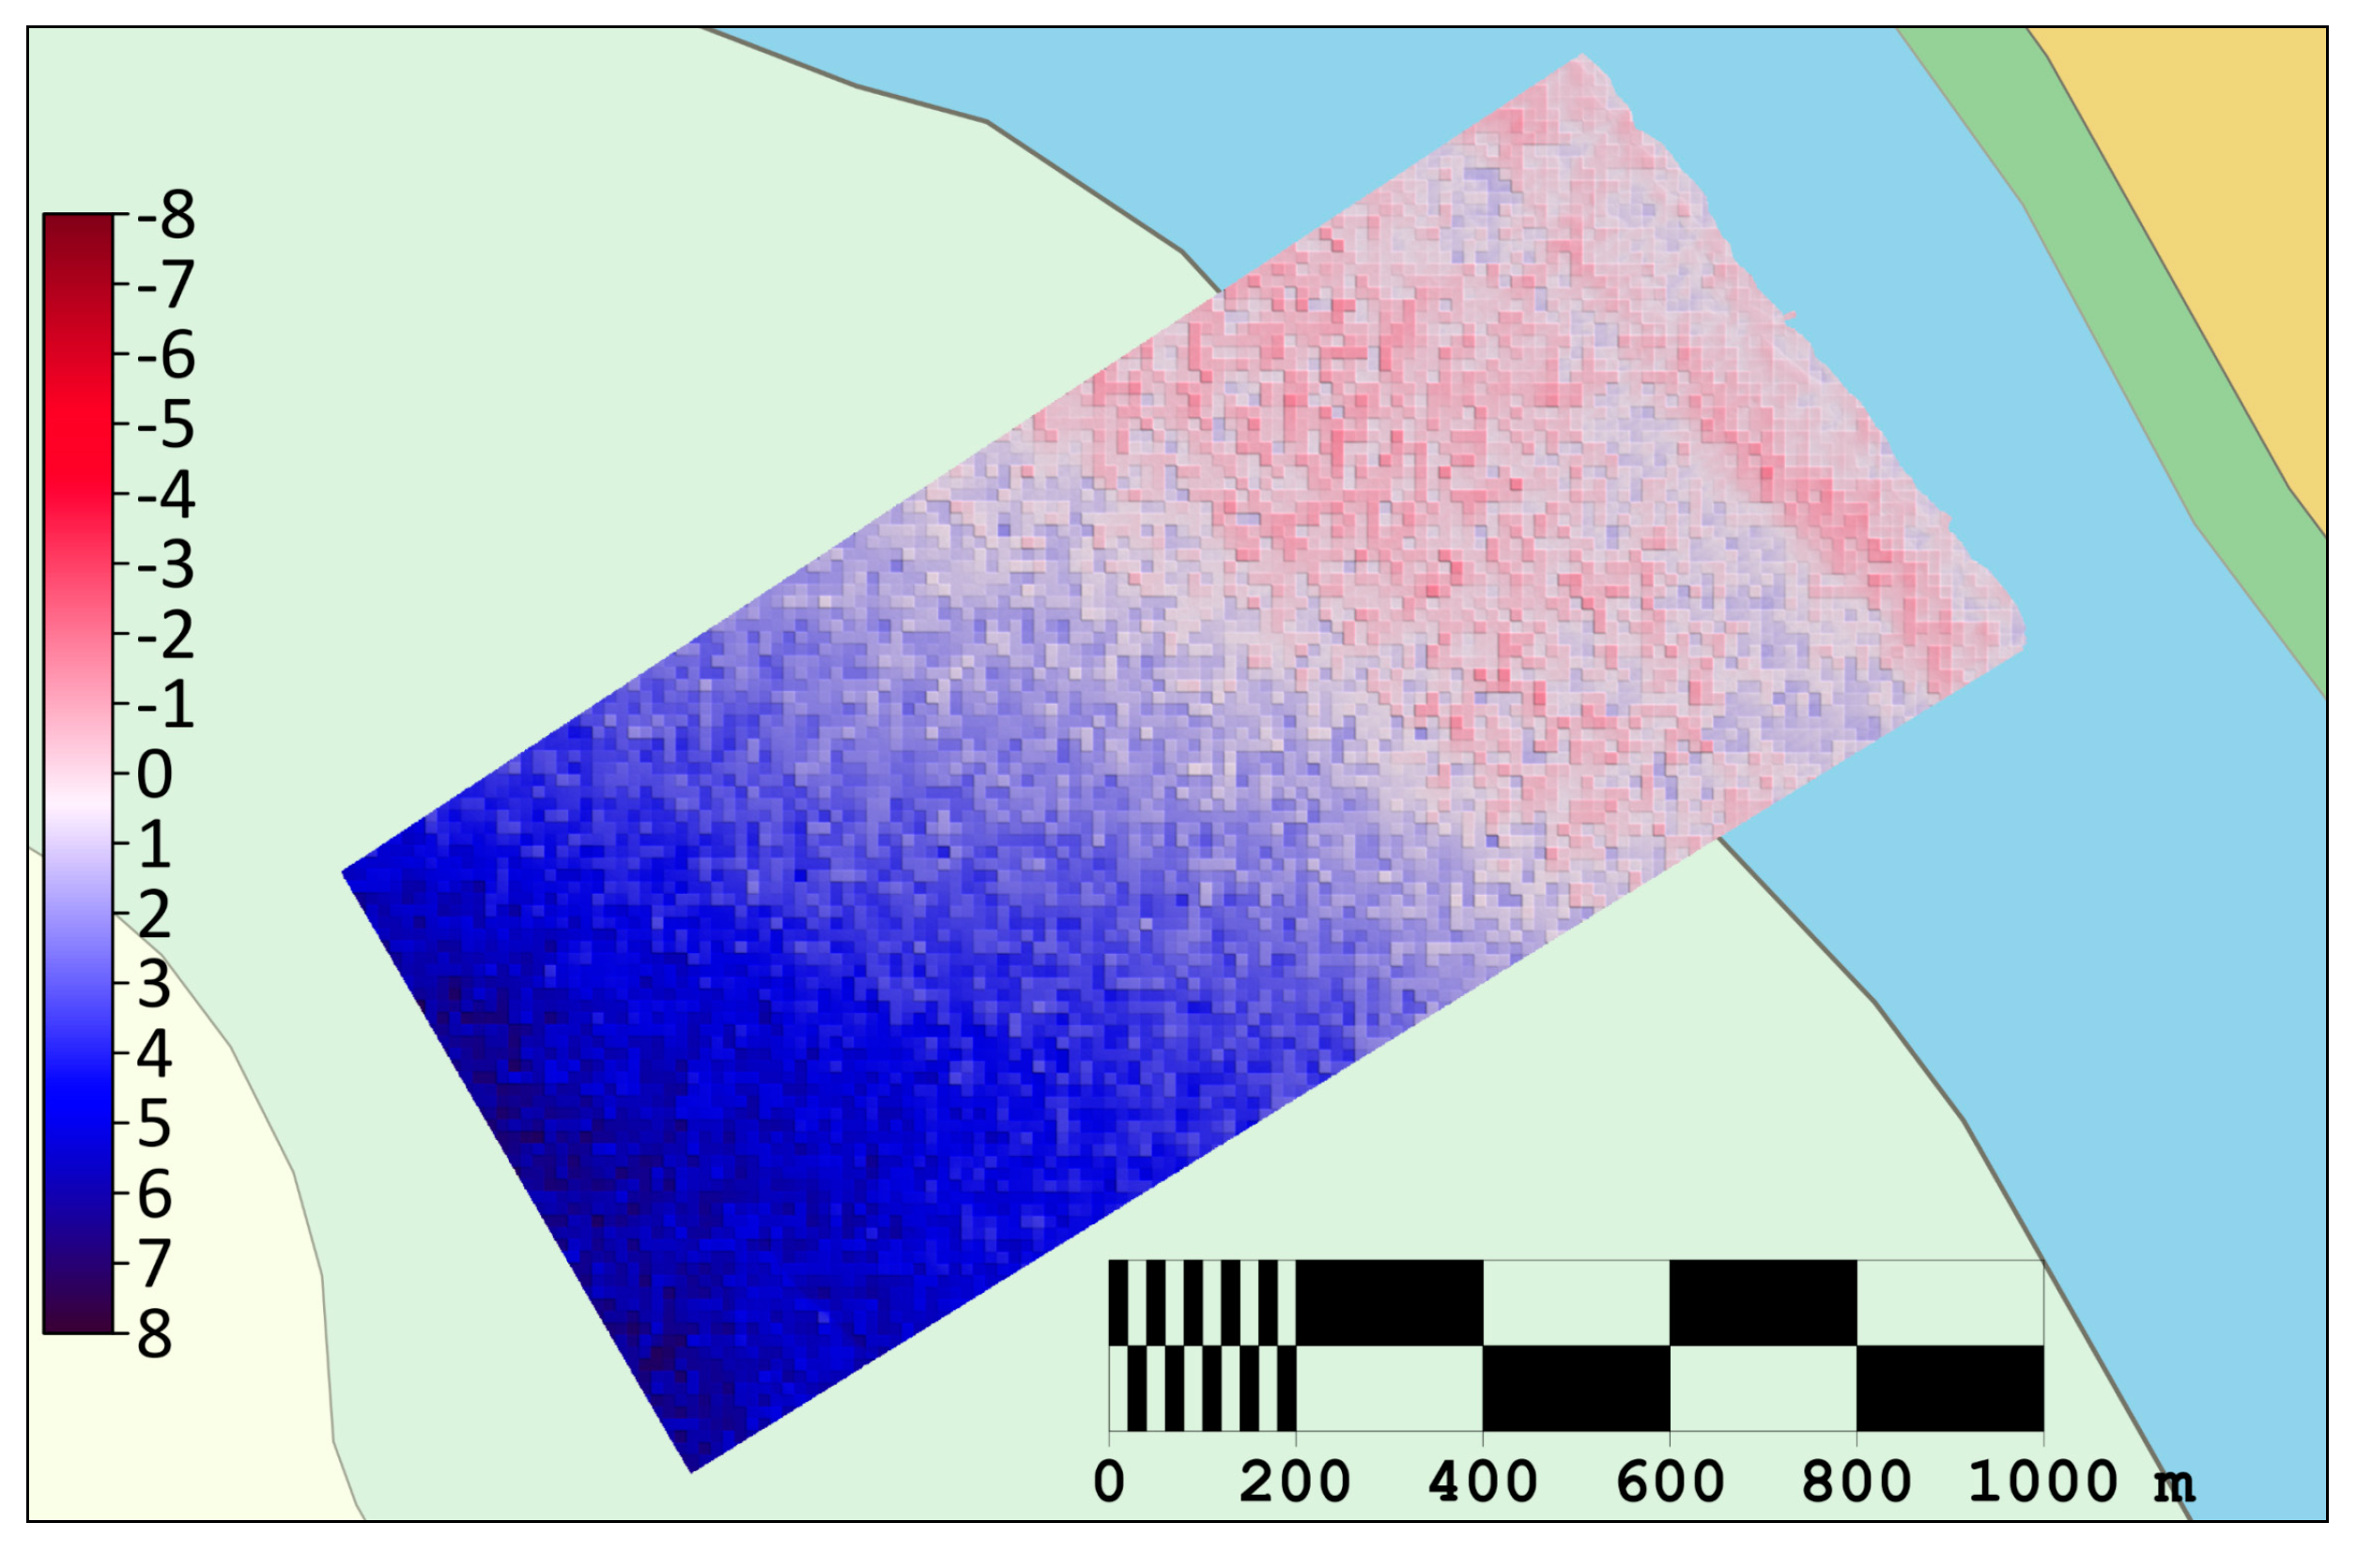
Concerning the differential analysis between the SDB and the reference survey (Figure 21), it is observed that variances are discernible with a maximal deviation of 1.8 m in the shallow water part, below a depth of 12 m. In deeper waters, the disparity becomes considerably more pronounced, attributable to the fundamental constraints of the SDB in penetrating the ocean.
Given that the USV MBES survey did not encompass the area of the reference survey area, an analytical comparison was conducted with the UAV LiDAR survey, as seen in Figure 22. It can be seen from this comparison that the differences between the two surveyed surfaces are constrained within a vertical discrepancy not exceeding 0.5 m.
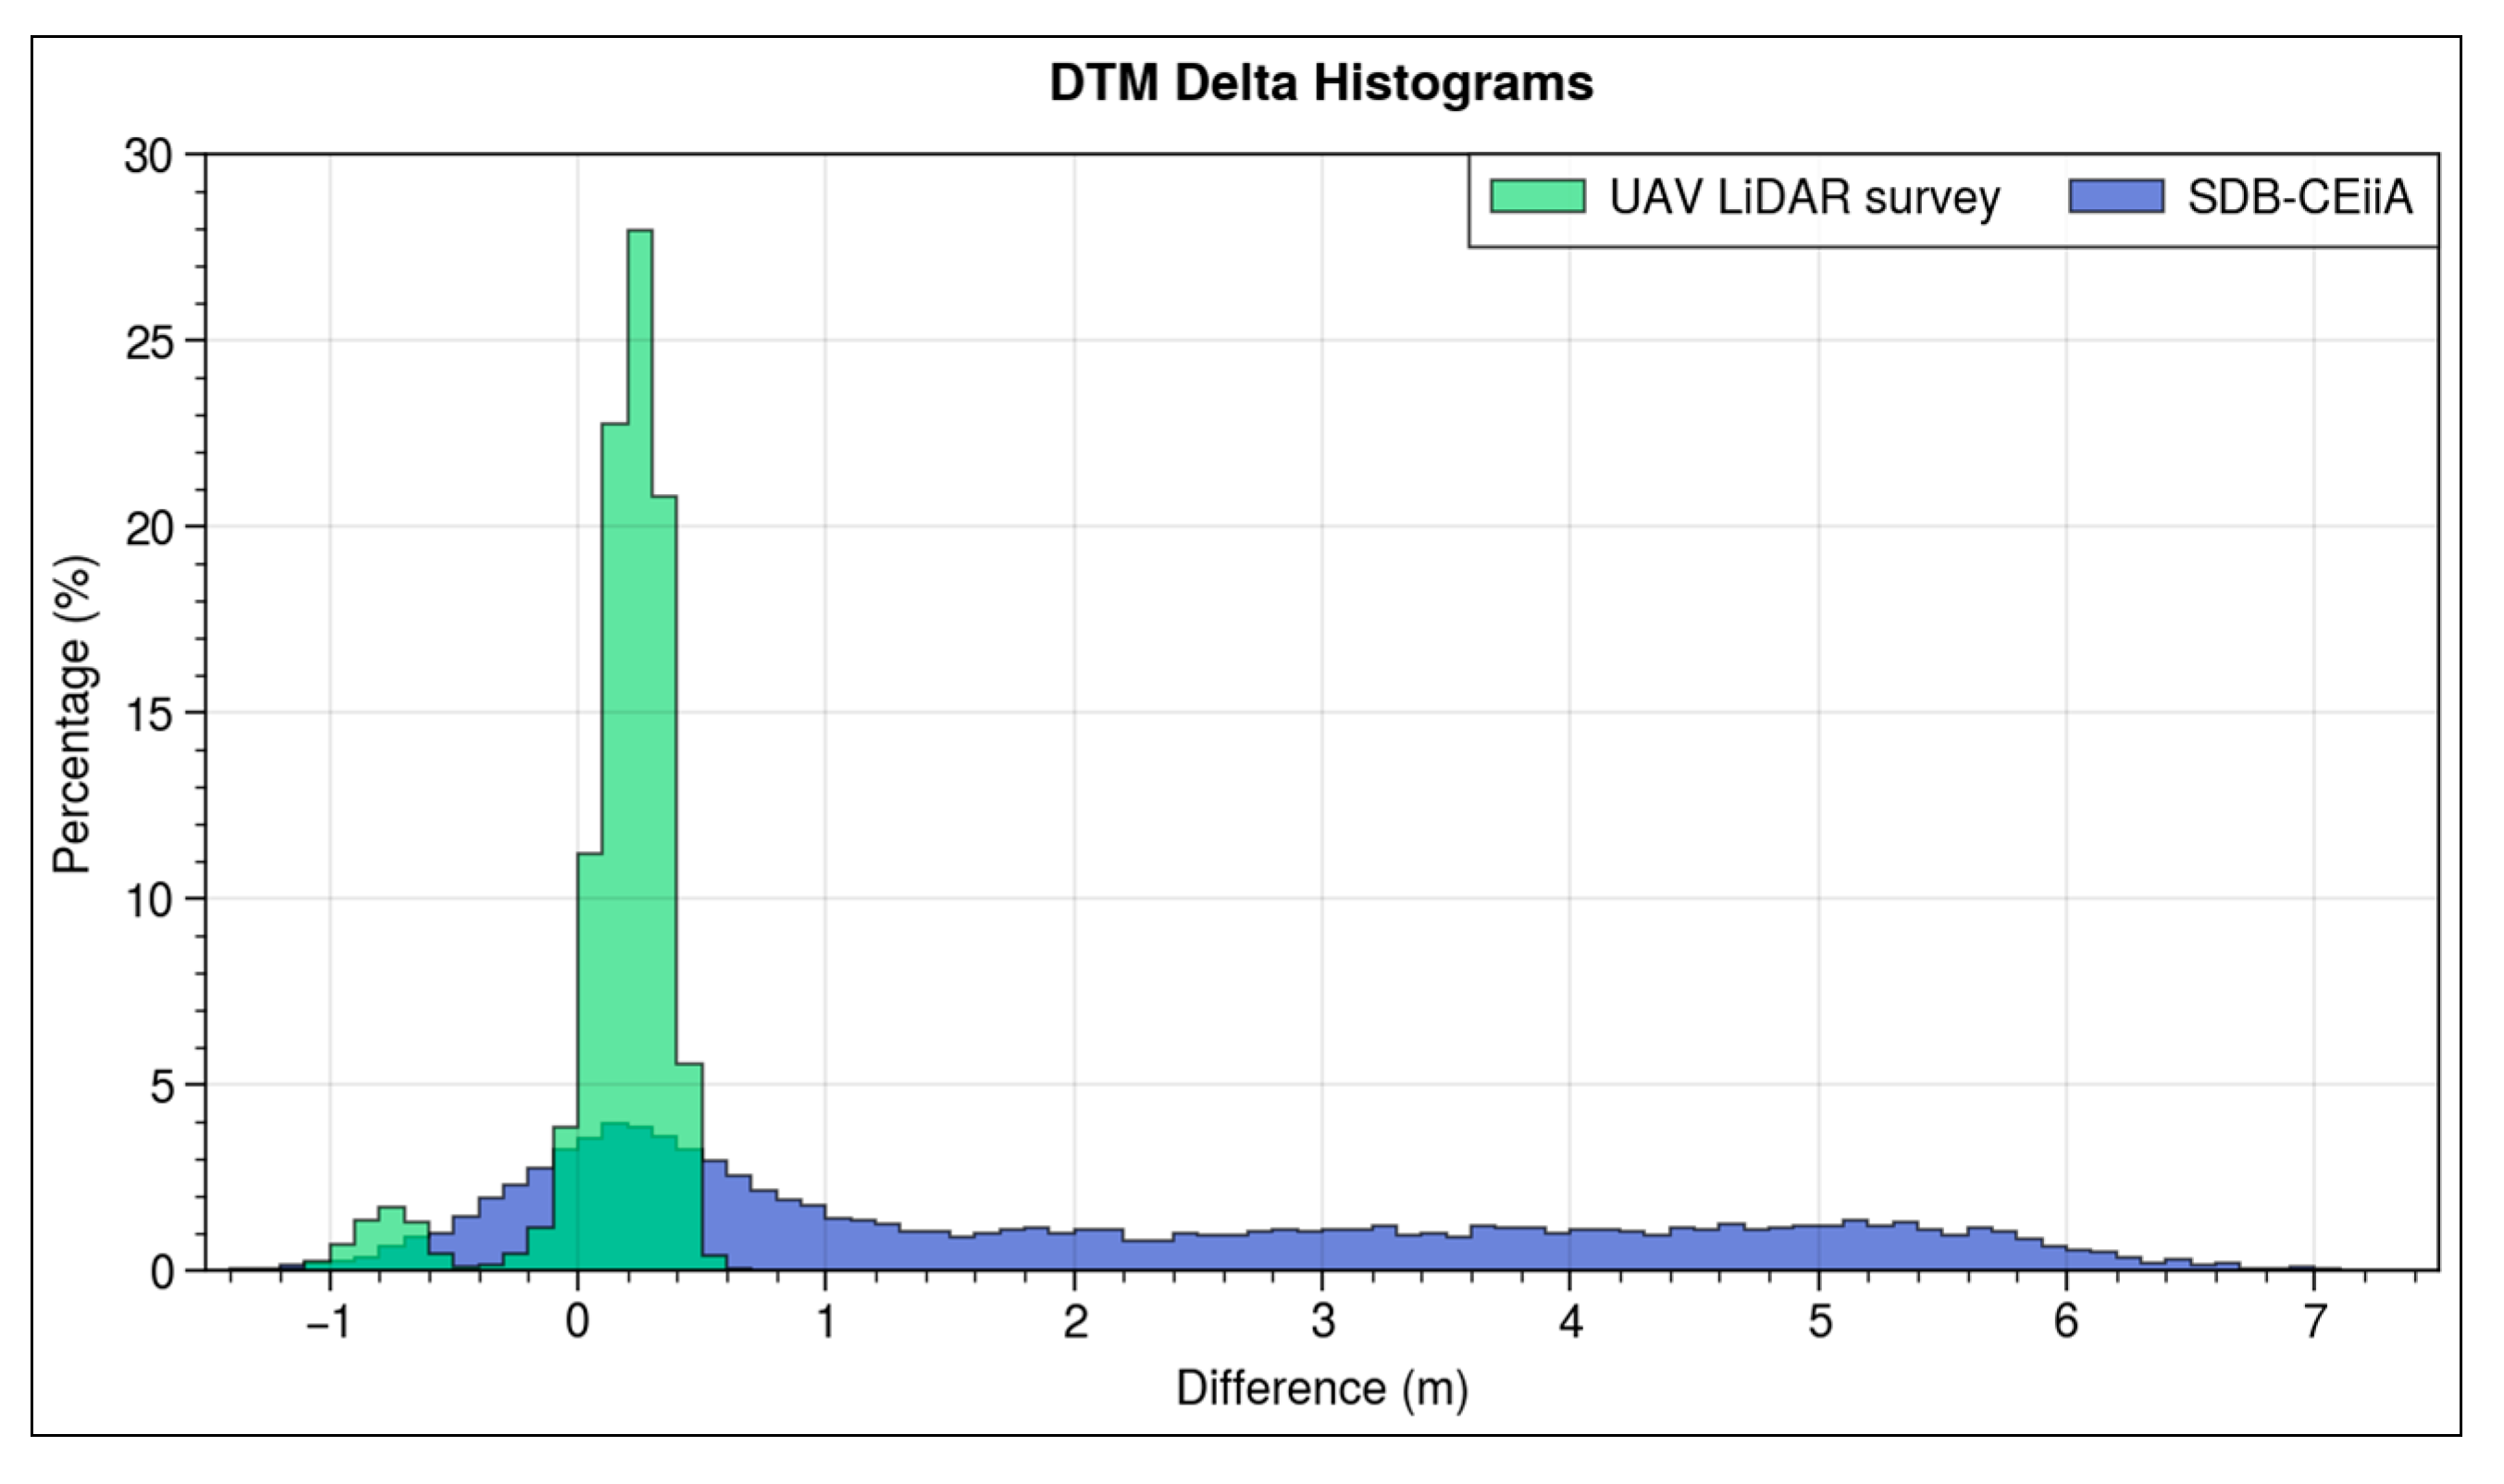
Furthermore, upon examination of the histogram of differences (Figure 23), the bathymetric measurements exhibit a robust level of reliability. The minimum, maximum, mean, and standard deviation values are presented in Table 9, with the SDB dataset demonstrating higher values attributed to the deeper areas where satellite imagery is less effective, while most LiDAR survey data are below a 0.5 m difference from the reference survey data.
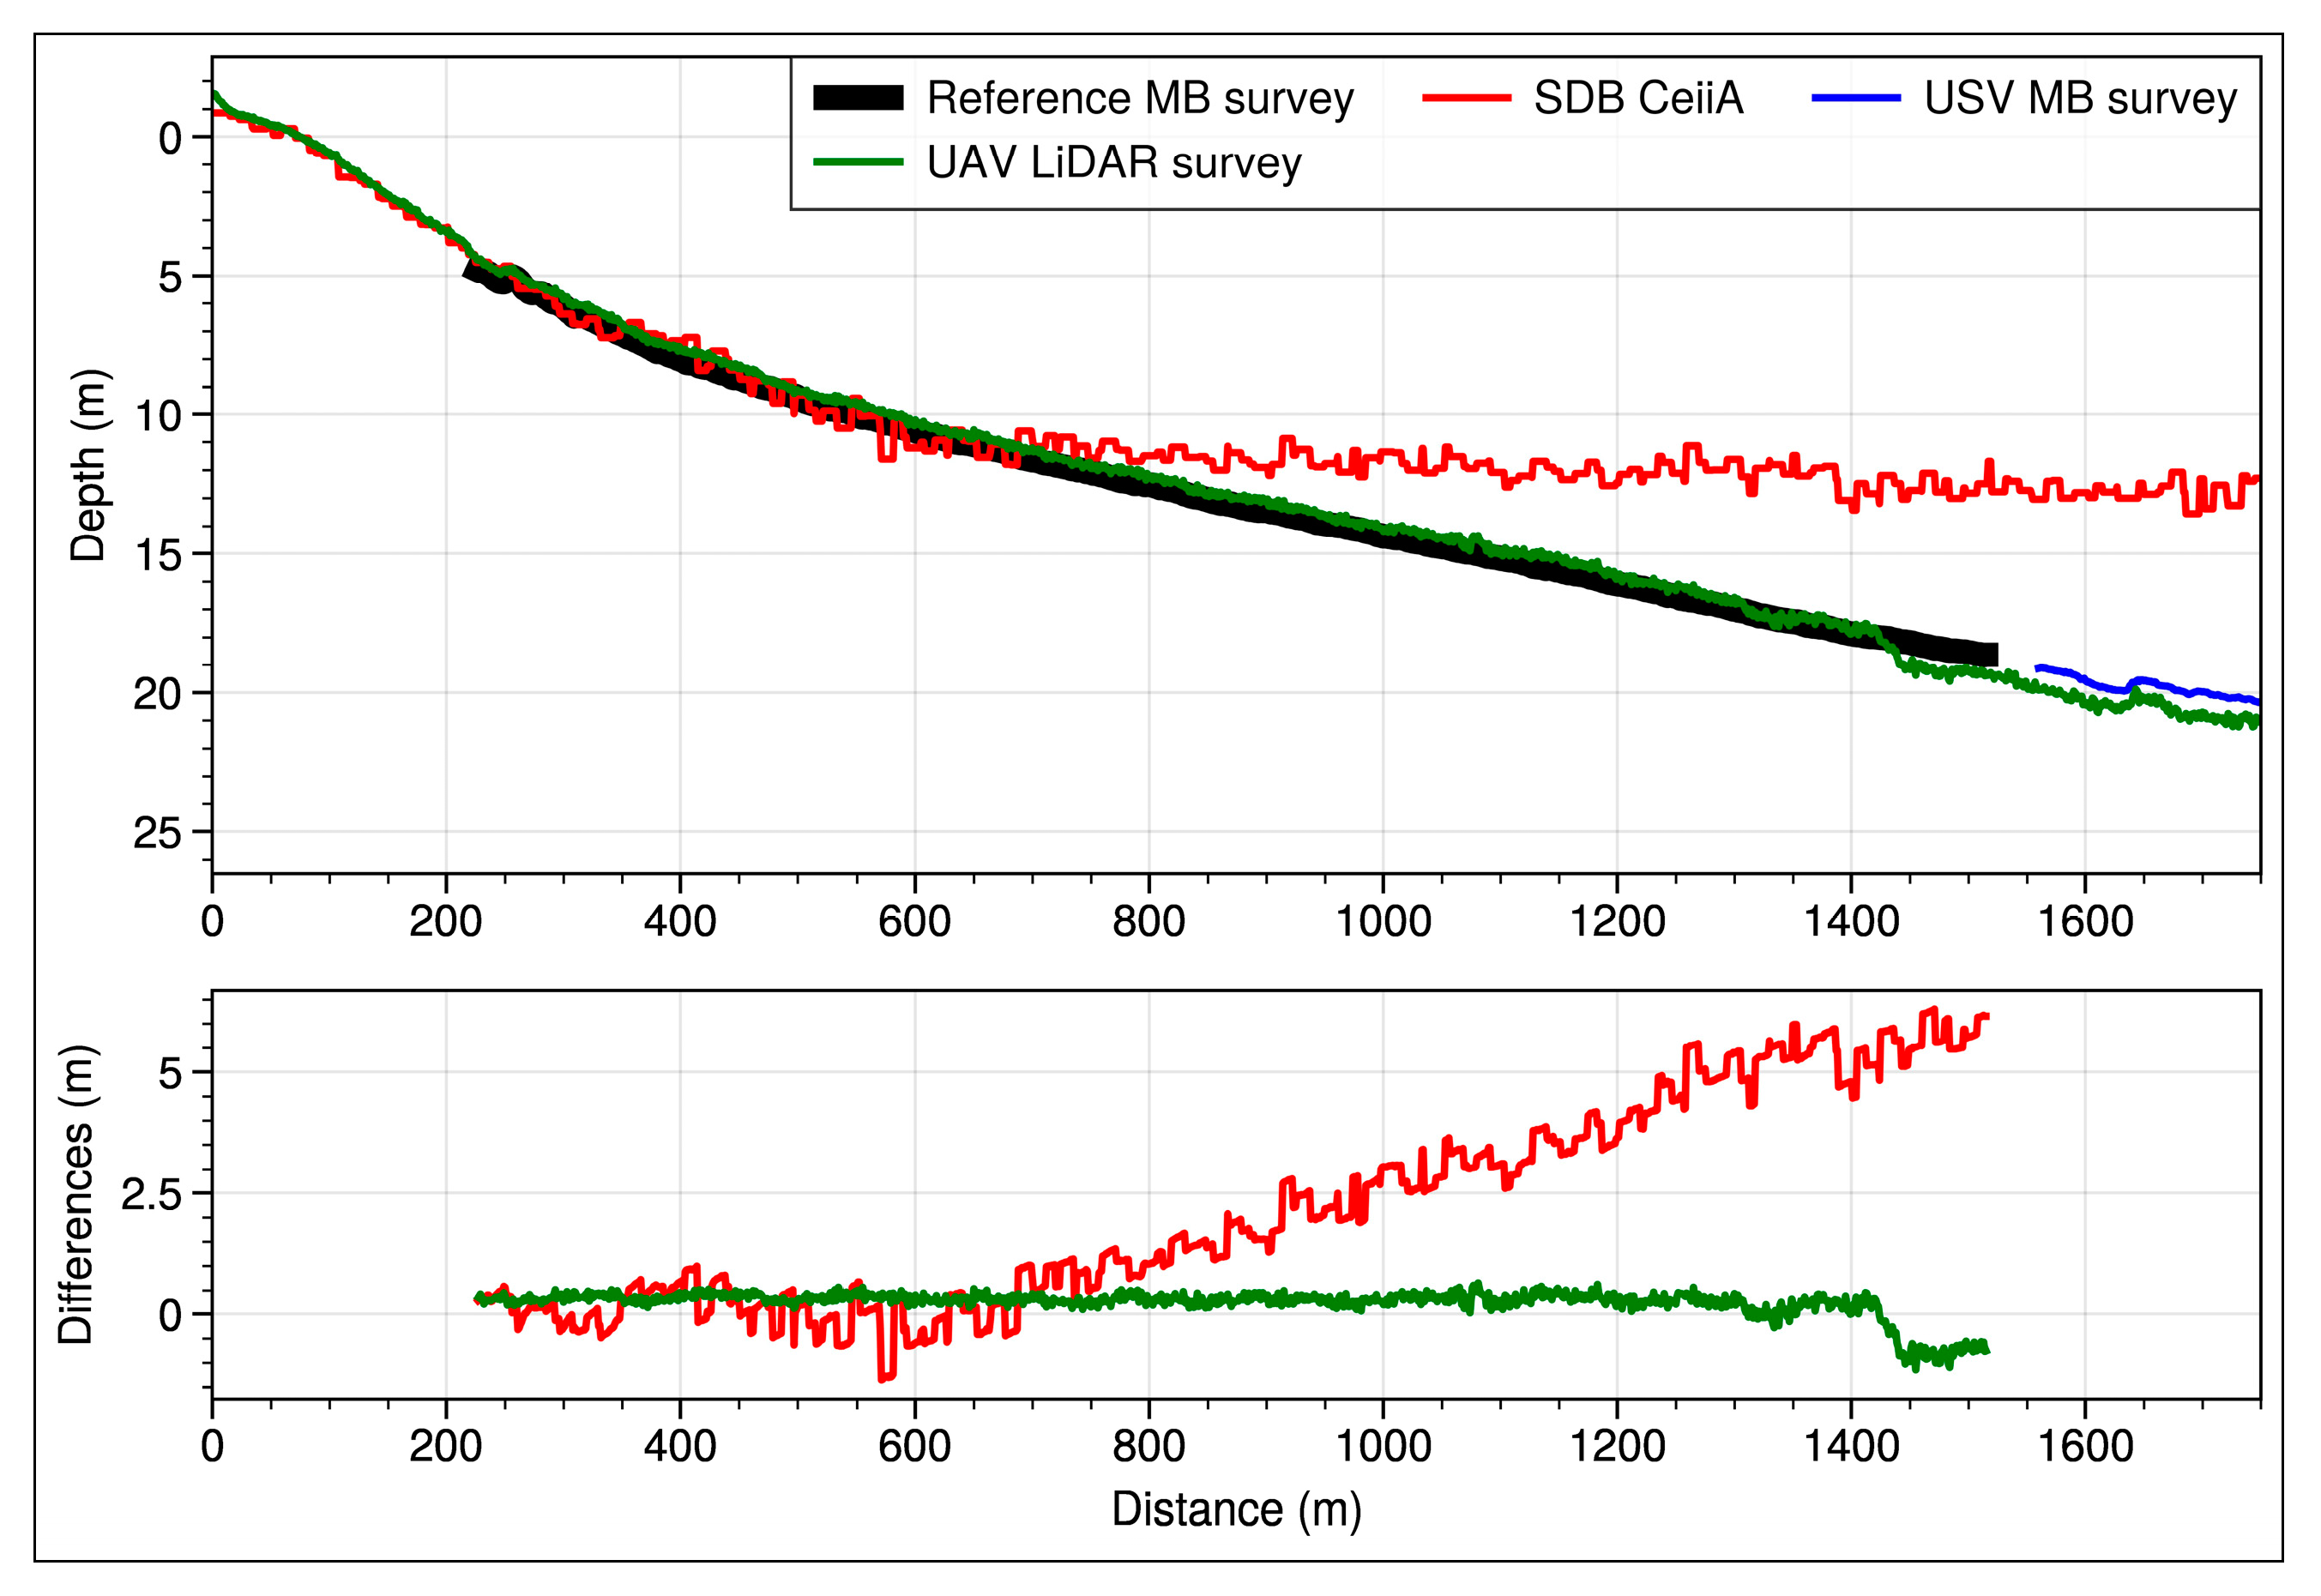
Furthermore, various profile differences were implemented to accentuate the distinctions between the reference bathymetric survey and the two SDB and LiDAR surveys (Figure 24).
3.5.3. Bathymetric Contours Comparison with the ENC
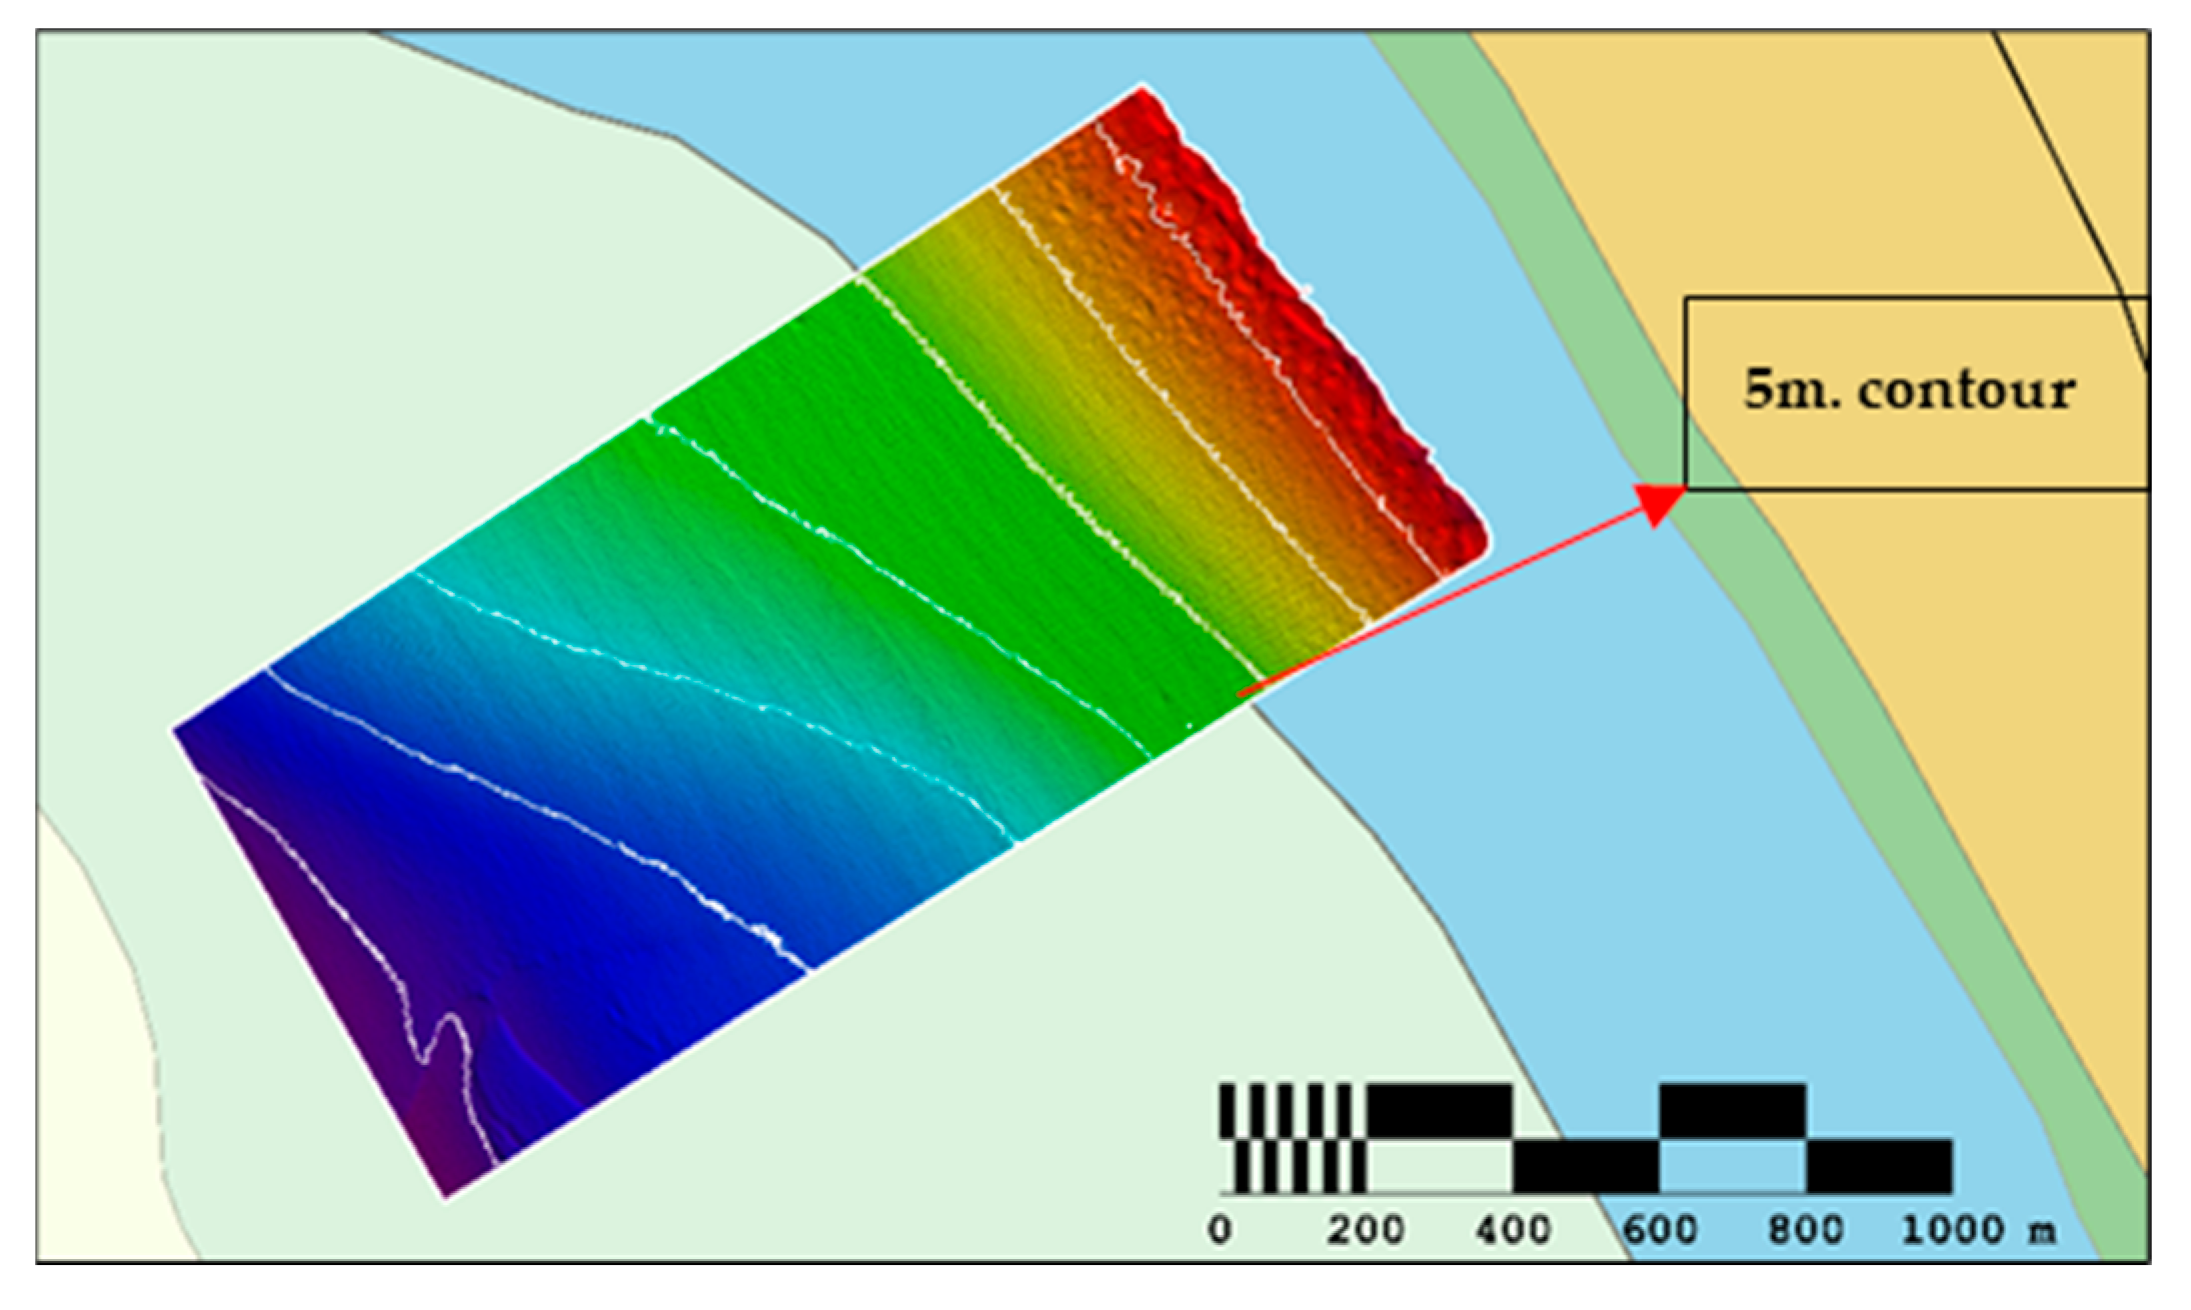
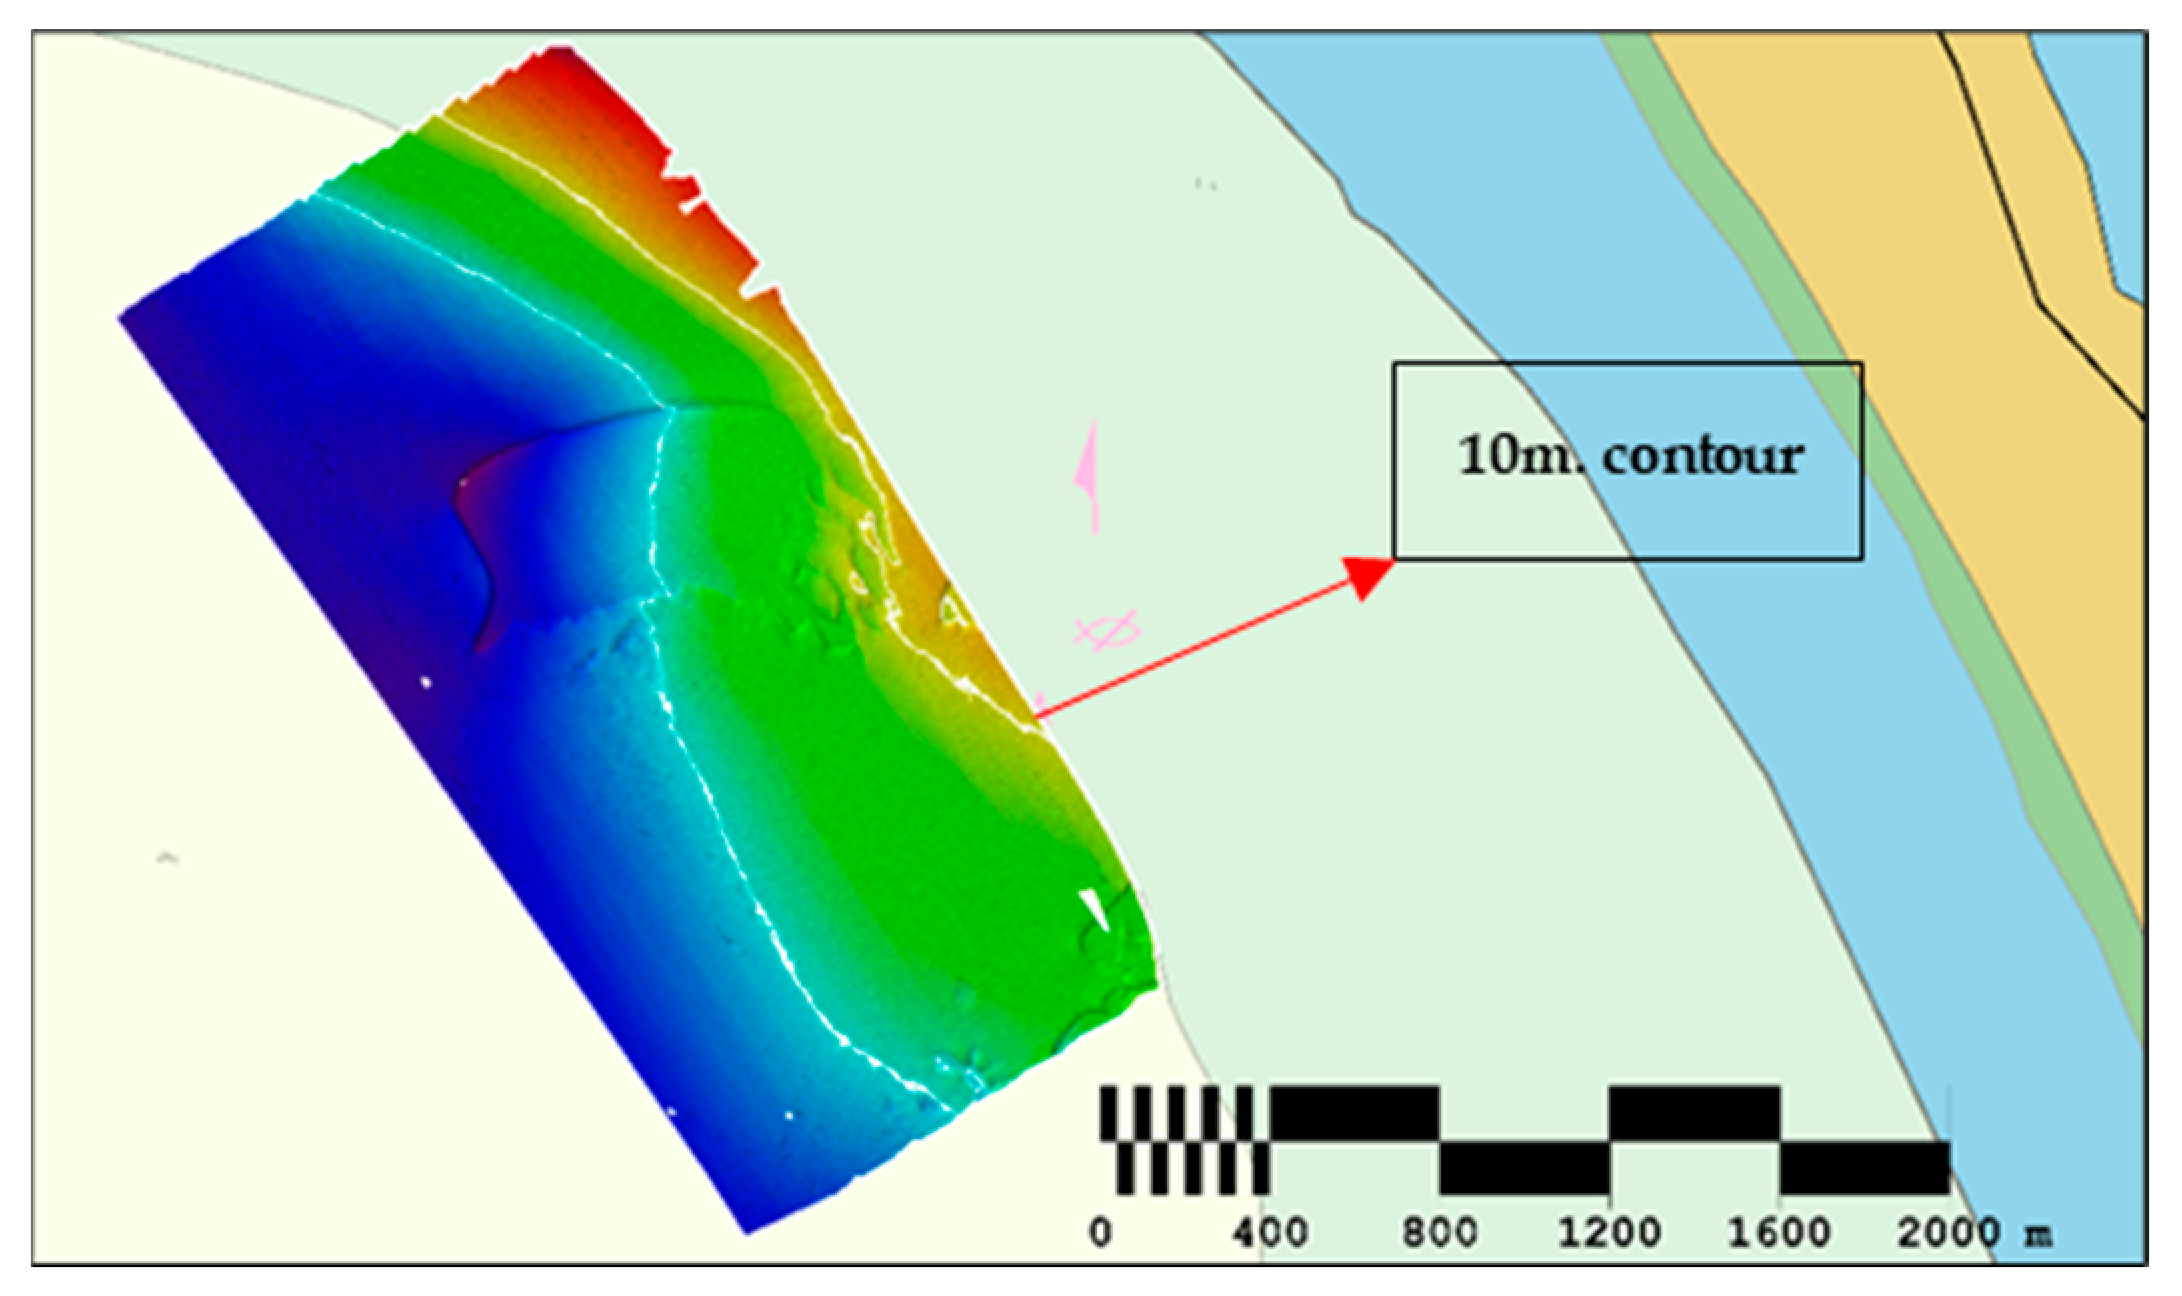
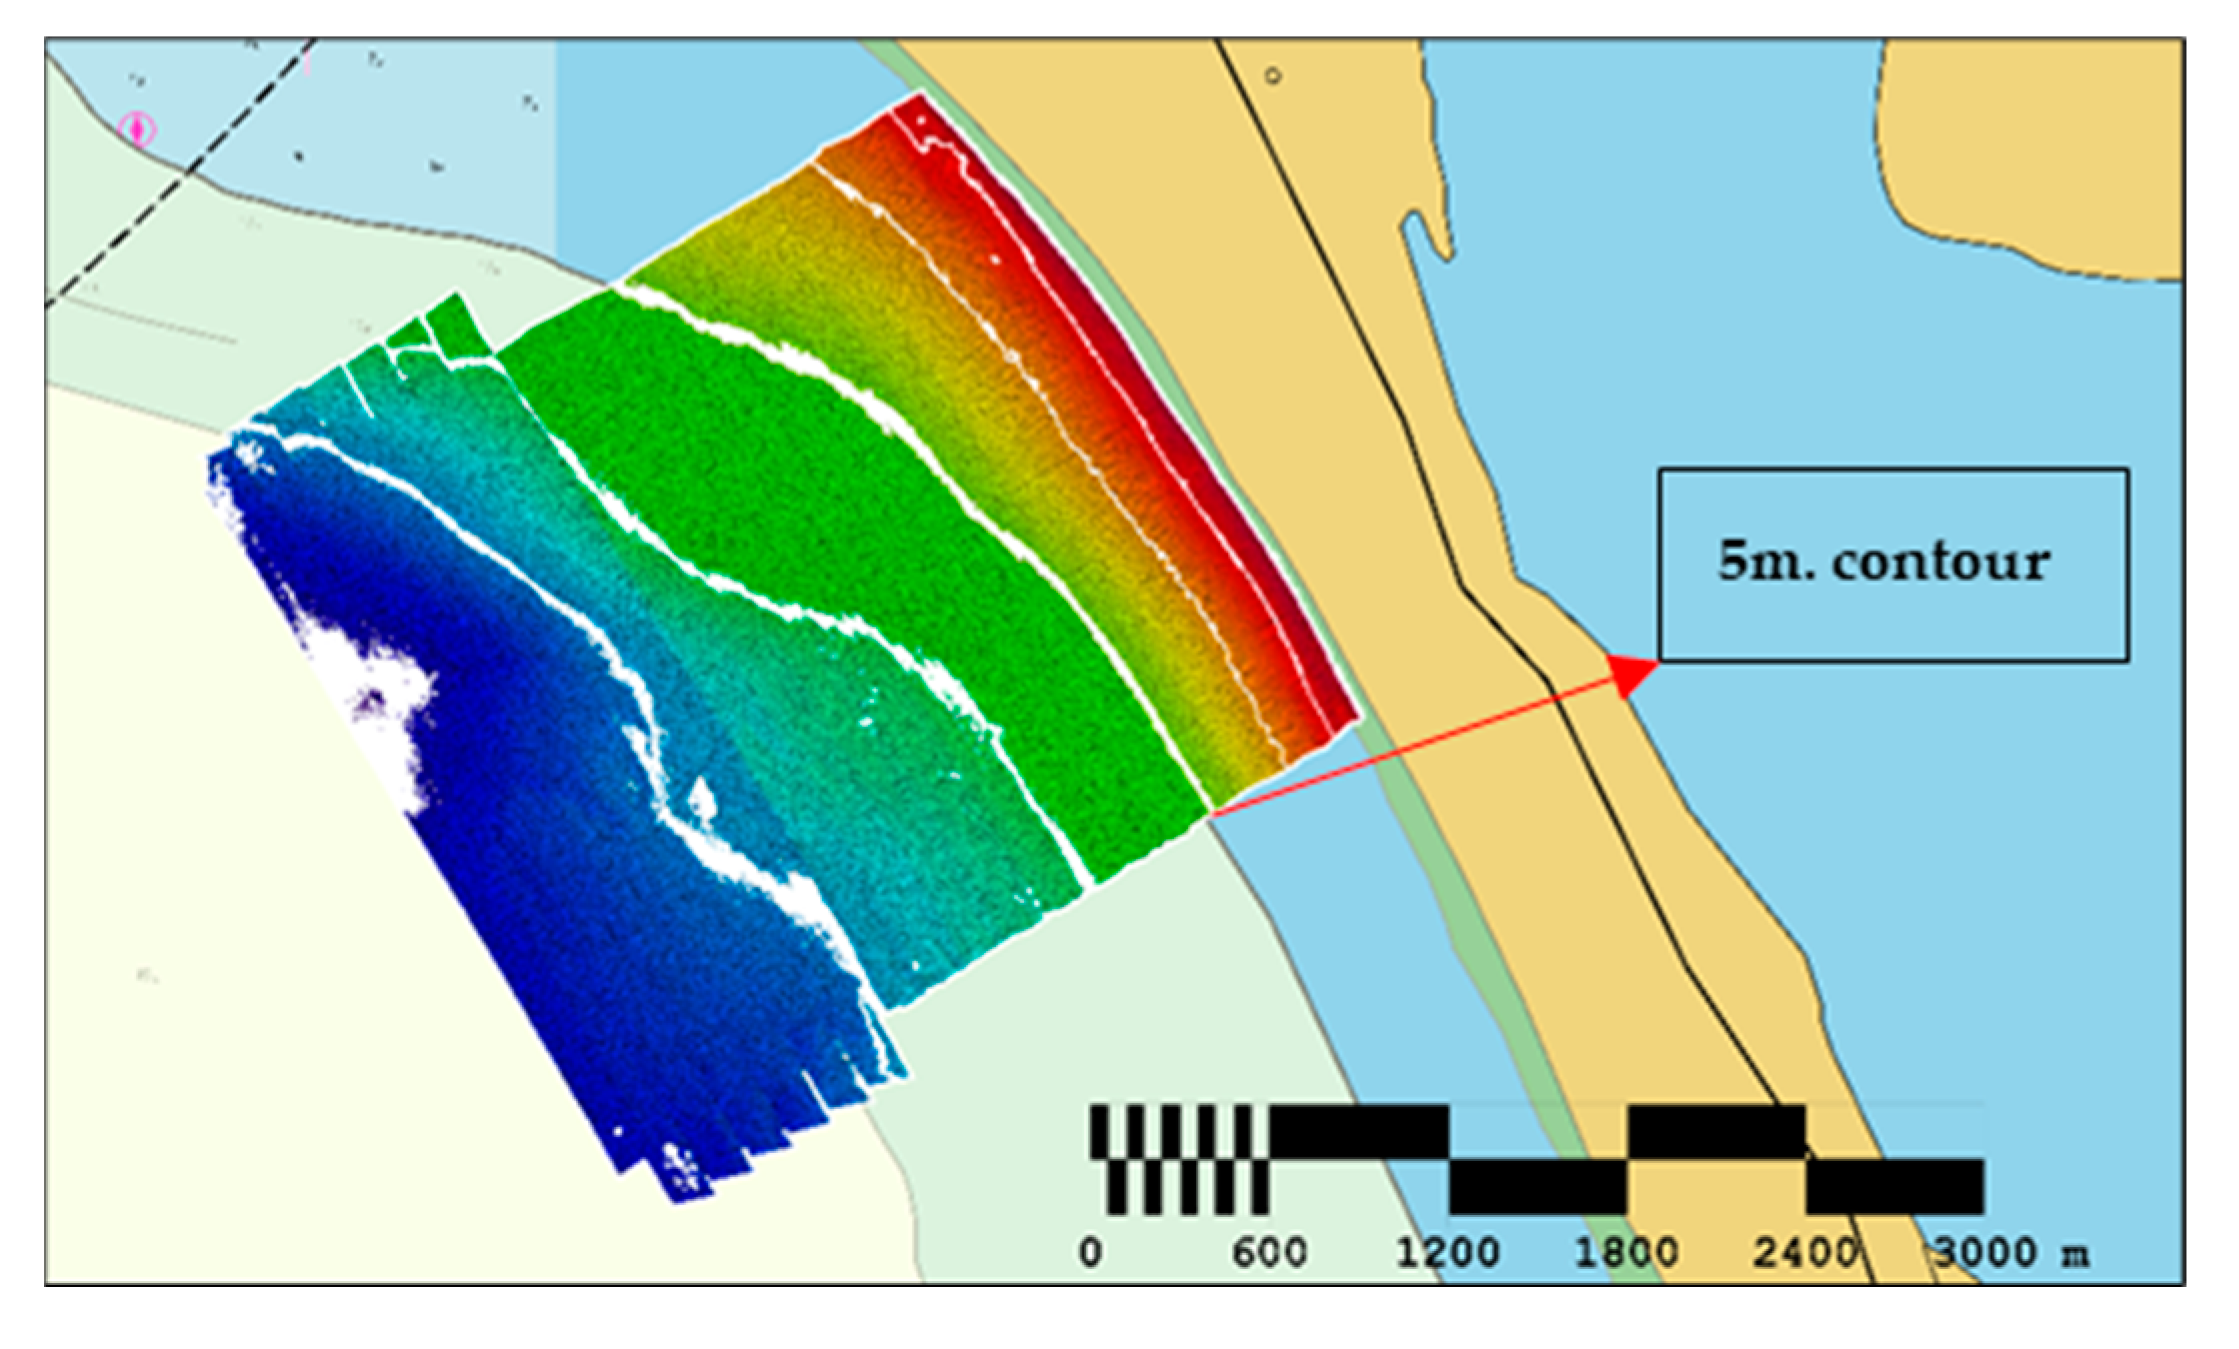
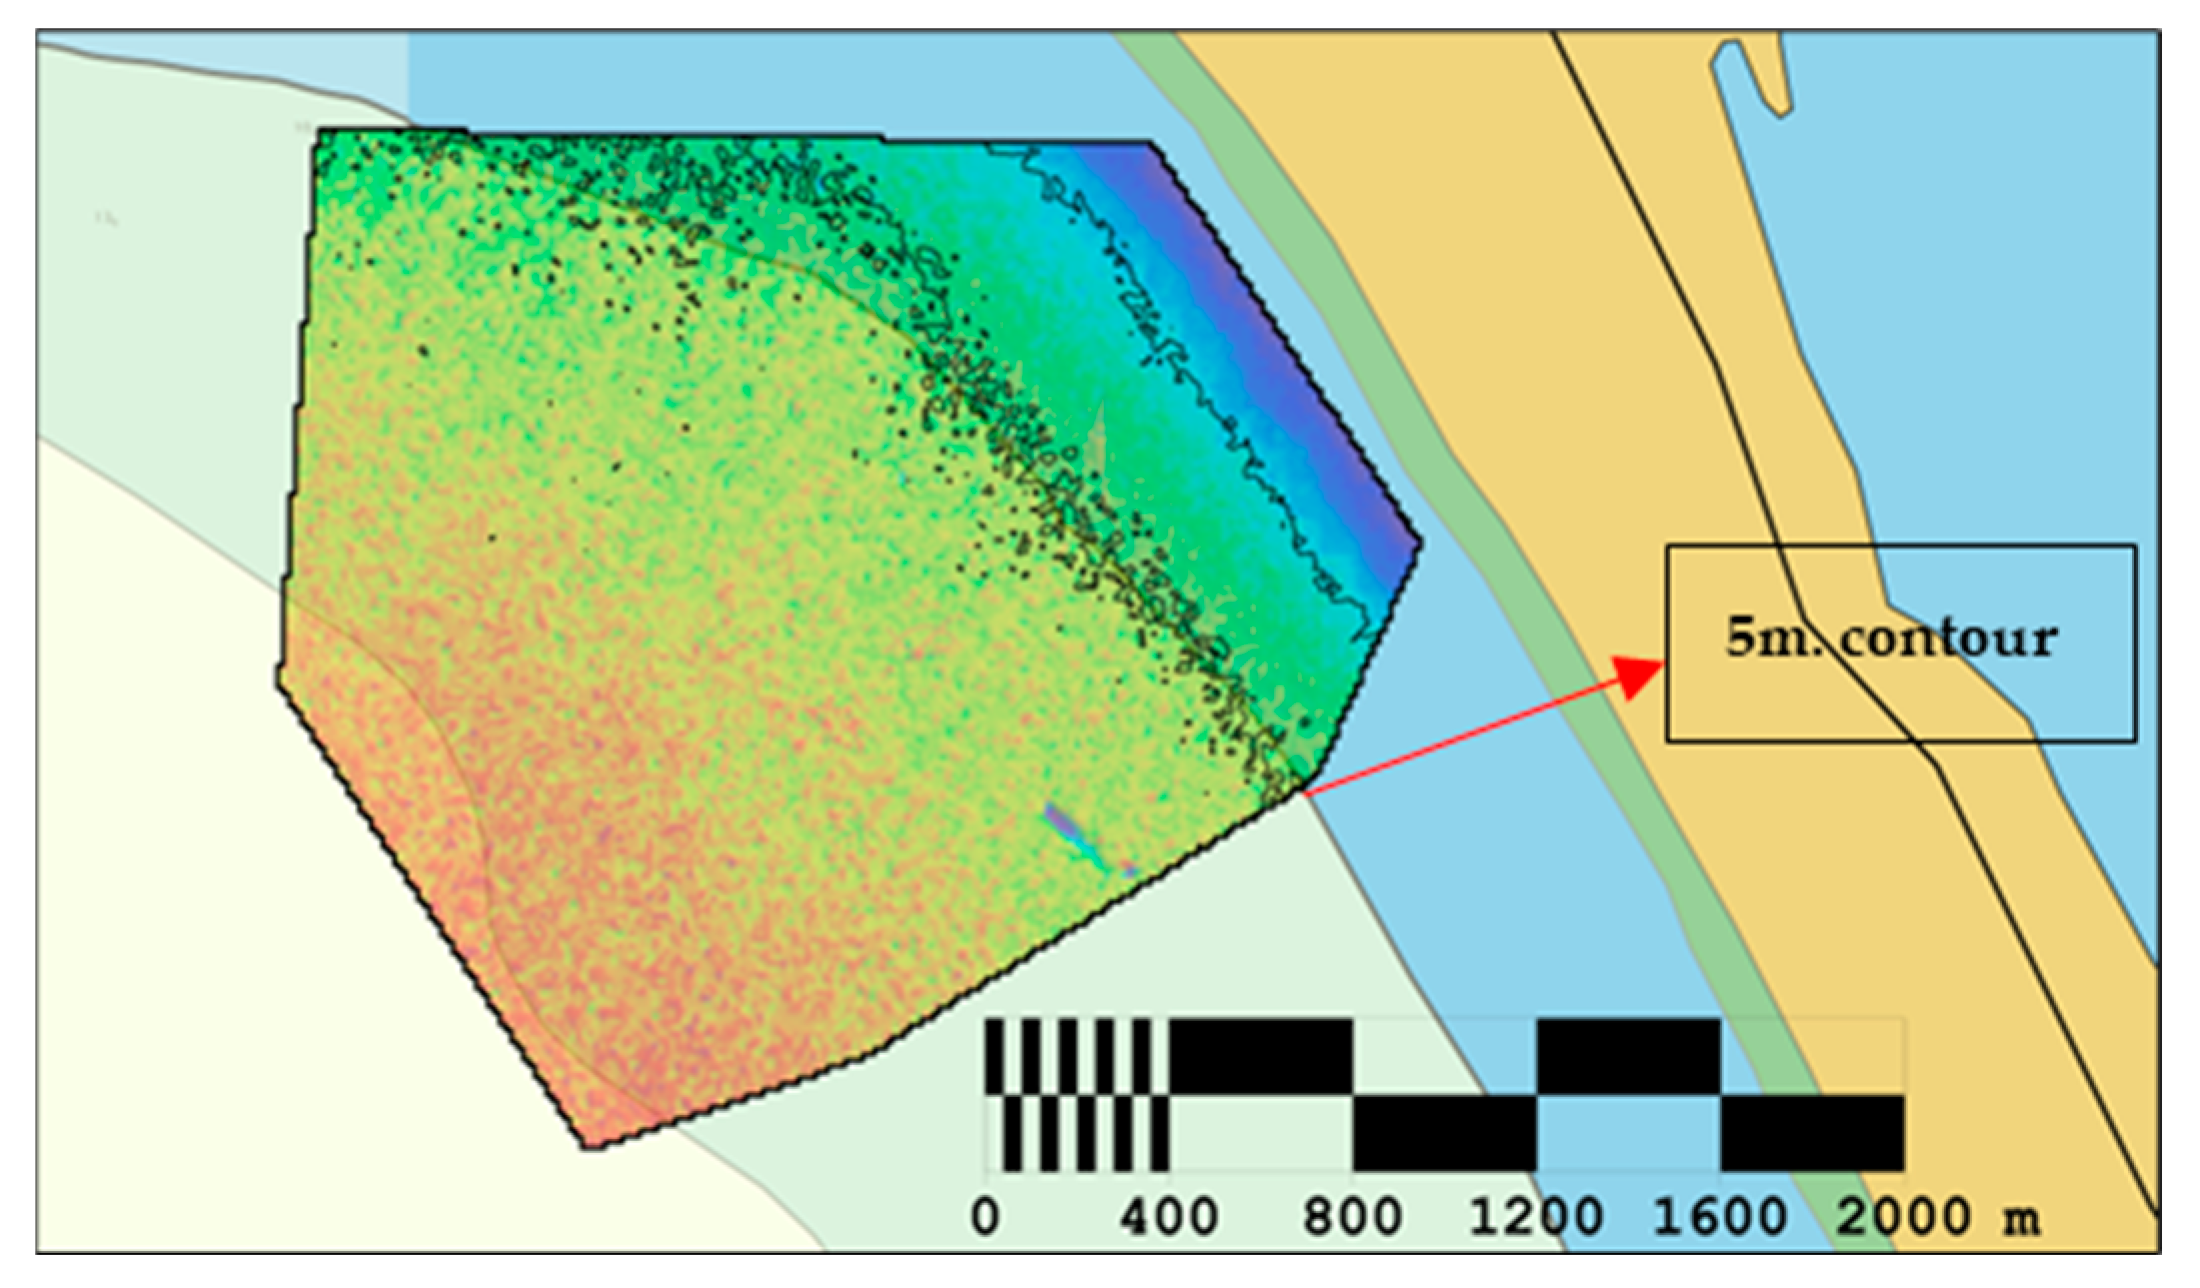
To further validate the precision and accuracy of the bathymetric data, contour lines were generated for each surface, the reference surface (Figure 25), MBES USV (Figure 26), LiDAR UAV (Figure 27), and SDB (Figure 28), and subsequently superimposed and compared with the contour lines derived from the ENC.
The results of this comparative analysis revealed a high level of bathymetric accuracy within the domain of extremely shallow waters. However, as seen in Figure 28, the contours generated by SDB do not exhibit the same level of spatial resolution as those produced by the LiDAR and MBES surveys, attributable to the inherent constraints on horizontal accuracy associated with satellite remote sensing technology.
The survey operations were characterized by a series of challenges, including the presence of turbid waters in the river inshore region, which blocked the penetration capabilities of the LiDAR system. Furthermore, the prevalence of calibration errors underscored the criticality of thorough calibration processes to optimize data quality. This includes the priority for boresight calibration of the LiDAR system and the execution of the patch test for the MBES survey, underscoring their crucial roles in ensuring the precision and accuracy of the collected data.
Furthermore, the processing methodologies associated with SDB present a considerable challenge, owing to their extensive nature and the requisite expertise of a subject matter specialist for their execution. Additionally, there persists a requirement for ground truth soundings to calibrate the model, thereby enhancing the accuracy of the resultant data. It is also noteworthy that the efficacy of SDB is profoundly influenced by the transparency of the water column and prevailing meteorological conditions. Moreover, SDB frequently encounters challenges in the precise quantification of uncertainties, a limitation that curtails its extensive scientific and operational application. Nevertheless, SDB retains the potential to greatly help in planning survey operations since it provides an approximate bathymetric picture of a location, without necessarily requiring the deployment of either assets or personnel.
Surveying in shallow water remains a particularly challenging activity within hydrographic studies. This paper delineates various methodologies aimed at addressing this issue, with the employment of uncrewed systems and remote sensing techniques, elucidating the respective advantages and disadvantages of each approach. Furthermore, the paper presents findings from pioneering systems, notably the integration of PILLS LiDAR with the Schiebel CAMCOPTER® S100, as well as the implementation of a state-of-the-art medium water multibeam system, the Kongsberg EM 712 USV, onboard the DriX USV. The investigation successfully demonstrated the ability to survey the surf zone both efficiently and in a safe manner.
It is imperative to highlight the outcomes produced by the advanced LiDAR system utilized in this study. This system demonstrated a level of accuracy and precision that is comparable to that of an MBES system, operating in challenging areas like the surf zone. Notably, it achieved survey coverage at a significantly accelerated rate compared to traditional sonar-based hydrographic survey methods.
Furthermore, the innovative integration of a medium water multibeam echosounder into an USV demonstrated a creditable degree of accuracy and precision. Consequently, this asset holds potential for future application in high-resolution hydrographic surveys within shallow water regions or offshore environments. However, it is imperative to note that the vehicle requires constant monitoring by a minimum of three personnel, and in emergencies, the presence of a manned asset in proximity is necessary for rescue purposes. The extensive endurance test granted successful results, with no instances of communication loss observed. As expected, the duration of the survey closely matched that of a manned asset survey, as the surface vehicle followed the same navigation and hydrographic survey planning and execution procedures.
From a military point of view, the uncrewed systems used for environmental monitoring present numerous operational benefits, including the augmentation of battlefield tactics, amplification of combat range, and the diminution of human life exposure to risk. They provide instantaneous data and increase situational awareness, thus supporting rapid decision-making processes and enhancing precision for other equipment employment. Moreover, MUSs limit civilian casualties and safeguard military personnel by mitigating combat zone exposure.
4. Conclusions
This study elucidates various methodologies employed in shallow water bathymetric surveys, employing diverse MUSs equipped with distinct payloads, when compared with a reference traditional bathymetric survey and cross-comparisons. In conjunction with the experimented MUS surveys, SDB was examined and evaluated using the Sentinel-2 constellation. As a disclaimer, the results do not represent the performance of each system or equipment, as some misconfigurations might have been overlooked and that is not the purpose of the research.
The SDB bathymetric model exemplified the capabilities of satellite remote sensing surveys in evaluating bathymetry within shallow oceanic regions, demonstrating accurate outcomes with inconsistencies not surpassing 1.8 m relative to the reference hydrographic survey. The penetration depth of the SDB was confined to 12 m, a constraint linked to the distinctive water transparency characteristics of the surveyed area. A suite of ML algorithms were incorporated into the processing pipeline, aiming to expedite the workflow and enhance the accuracy of the final products. The satellite constellation utilized in this process, the employment of low-orbit satellites with superior revisit frequencies, can facilitate the production of higher-resolution bathymetric outputs.
The LiDAR system described in this manuscript represents a revolutionary advancement, being utilized for the first time in this experimental context, and it is characterized by its advanced technical specifications and the remarkable efficacy of its products. The survey was strongly improved by the Schiebel CAMCOPTER® S-100 efficiency and maneuverability. The system was tested in the turbid waters of the Sado River; however, its efficacy was compromised due to the opacity of the water. The LiDAR UAV survey demonstrated rapid data acquisition, with the results indicating a vertical depth uncertainty not exceeding 0.3 m, in comparison to the reference hydrographic survey. However, certain discrepancies were observed along the survey lines, attributable to a 1 nanosecond delay between the two AITRAC lasers within the PILLS system. Additionally, the delay produced a discontinuity between the two processed bathymetric surfaces (shallow and deep water).
The USV MBES survey demonstrated a vertical depth uncertainty not surpassing 0.5 m when juxtaposed with the LiDAR survey (considering the vertical uncertainty of 0.3 m between the LiDAR and reference survey surfaces). However, it is noteworthy that this experimental assessment was constrained by the inability to survey depths shallower than 10 m and the absence of the SVP winch, necessary for a completely autonomous hydrographic survey.
The combination of mild winds, minimal rainfall, and calm seas during the survey period resulted in optimal conditions for the deployment of both UAV-based bathymetric lidar and USV-mounted multibeam echosounder systems. Additionally, these systems should be subjected to rigorous testing in more demanding conditions, such as high wave scenarios, rocky seabed, heavy precipitation, and strong wind environments, to ascertain the operational thresholds of each system and to examine the integrity of data under adverse conditions.
Future research endeavors should explore the development of SDB processing methodologies that are independent of supplementary ground truth soundings. Such advancements would facilitate a complete and entirely remote evaluation of underwater bathymetry across specified areas.
The concurrent deployment of a USV and a UAV (or a swarm version of MUSs) can potentially optimize operational efficiency and expand the scope of data acquisition and resolution by integrating complementary sensing equipment across the two platforms. This multiplatform approach may result in significant reductions in both time and financial resources by facilitating the simultaneous deployment of survey assets.
For the continuation of the study, it is imperative to conduct a comprehensive evaluation of the horizontal and vertical uncertainties and errors associated with each system integration. Subsequent research endeavors should focus on enhancing the detection capabilities of surface and seabed features, as well as the identification of contacts. Currently, the field lacks definitive standards or criteria pertaining to REA bathymetric surveys, necessitating further research to establish tailored bathymetric specifications within this domain.
Author Contributions
Writing, L.-F.C.; review and editing, methodology, A.T., R.M.C. and E.R.; data curation, L.-F.C., resources, L.-F.C.; supervision and project administration, E.R. All authors have read and agreed to the published version of the manuscript.
Funding
This work was carried out in the framework of the research project CLIMEWAR (CLimatechange IMpact Evaluation on future WAve conditions at the regional scale for the Black and Mediterranean seas marine system), supported by a grant of the Ministry of Research, Innovation, and Digitization, CNCS—UEFISCDI, project number PN-III-P4-PCE-2021-0015, within PNCDI III.
Data Availability Statement
Data are contained within the article.
Acknowledgments
We express our gratitude to the companies and organizations that agreed to share data, products, and knowledge for this research: SCHIEBEL, ARETÉ, CEIIA, Agência Regional para o Desenvolvimento da Investigação, Tecnologia e Inovação (ARDITI), Office of Naval Research (ONR), and the Portuguese Navy. We thank Steven P. Anderson, Eric Korpie (ARETÉ), Rui Caldeira (ARDITI), and Nelson Pires (CEIIA) for their contribution to this article in describing their survey details and processes used for this experiment. This research is an extension of the work presented at the 11th Scientific Conference of Doctoral Schools, Perspectives and challenges in Doctoral Research, “Dunărea de Jos” University of Galati.
Conflicts of Interest
The authors declare no conflicts of interest.
References
- Nicholls, R.J.; Cazenave, A. Sea-Level Rise and Its Impact on Coastal Zones. Science 2010, 328, 1517–1520. [Google Scholar] [CrossRef] [PubMed]
- Hoegh-Guldberg, O.; Mumby, P.J.; Hooten, A.J.; Steneck, R.S.; Greenfield, P.; Gomez, E.; Harvell, C.D.; Sale, P.F.; Edwards, A.J.; Caldeira, K.; et al. Coral Reefs under Rapid Climate Change and Ocean Acidification. Science 2007, 318, 1737–1742. [Google Scholar] [CrossRef] [PubMed]
- Zhao, J.; Ouyang, Y.; Wang, A. Status and Development Tendency for Seafloor Terrain Measurement Technology. Acta Geod. Cartogr. Sin. 2017, 46, 1786–1794. [Google Scholar] [CrossRef]
- Sam, L.; Prusty, G.; Gahlot, N. Evaluation of optical remote sensing-based shallow water bathymetry for recursive mapping. Geocarto Int. 2018, 33, 737–753. [Google Scholar] [CrossRef]
- McCombs, M.P.; Mulligan, R.P.; Boegman, L. Offshore wind farm impacts on surface waves and circulation in Eastern Lake Ontario. Coast. Eng. 2014, 93, 32–39. [Google Scholar] [CrossRef]
- Medvešek, I.G.; Šoda, J.; Karin, I.; Maljković, M. The State of the Hydrographic Survey and Assessment of the Potentially Risky Region for Navigation Safety. J. Mar. Sci. Eng. 2023, 11, 1498. [Google Scholar] [CrossRef]
- Bio, A.; Bastos, L.; Granja, H.; Pinho, J.; Gonçalves, J.; Henriques, R.; Madeira, S.; Magalhães, A.; Rodrigues, D. Methods for coastal monitoring and erosion risk assessment: Two Portuguese case studies. Rev. Gestão Costeira Integr.—J. Integr. Coast. Zone Manag. 2015, 15, 47–63. [Google Scholar] [CrossRef]
- Ni, H.; Wang, W.; Ren, Q.; Lu, L.; Wu, J.; Ma, L. Comparison of Single-beam and Multibeam Sonar Systems for Sediment Characterization: Results from Shallow Water Experiment. In Proceedings of the OCEANS 2019 MTS/IEEE SEATTLE, Seattle, WA, USA, 27–31 October 2019; pp. 1–4. [Google Scholar] [CrossRef]
- Lee, Z.; Shangguan, M.; Garcia, R.A.; Lai, W.; Lu, X.; Wang, J.; Yan, X. Confidence Measure of the Shallow-Water Bathymetry Map Obtained through the Fusion of Lidar and Multiband Image Data. J. Remote Sens. 2021, 2021, 9841804. [Google Scholar] [CrossRef]
- Wiehle, S.; Pleskachevsky, A.; Gebhardt, C. Automatic bathymetry retrieval from SAR images. CEAS Space J. 2019, 11, 105–114. [Google Scholar] [CrossRef]
- Legleiter, C.J. The optical river bathymetry toolkit. River Res. Appl. 2021, 37, 555–568. [Google Scholar] [CrossRef]
- Leder, T.D.; Baučić, M.; Leder, N.; Gilić, F. Optical Satellite-Derived Bathymetry: An Overview and WoS and Scopus Bibliometric Analysis. Remote Sens. 2023, 15, 1294. [Google Scholar] [CrossRef]
- Constantinoiu, L.-F.; Rusu, E.; Mihailov, M.-E. UXO Assessment on the Romanian Black Sea Coast. J. Mar. Sci. 2022, 4, 7–17. [Google Scholar] [CrossRef]
- Constantinoiu, L.F.; Quaresma, L.; Rusu, E. Oceanographic environmental assessment using underwater gliders. J. Mar. Technol. Environ. 2022, 2, 12–15. [Google Scholar] [CrossRef]
- Constantinoiu, L.-F.; Bernardino, M.; Rusu, E. Autonomous Shallow Water Hydrographic Survey Using a Proto-Type USV. J. Mar. Sci. Eng. 2023, 11, 799. [Google Scholar] [CrossRef]
- Ślusarczyk, J. Environmental protection in NATO policy. Sci. J. Mil. Univ. Land Forces 2023, 208, 91–103. [Google Scholar] [CrossRef]
- Lam, S.Y.W.; Yip, T.L. Hydrographic surveying and mapping for the coastal construction of Hong Kong Disneyland. Geomatica 2008, 62, 437–443. [Google Scholar]
- Janowski, L.; Wroblewski, R.; Rucinska, M.; Kubowicz-Grajewska, A.; Tysiac, P. Automatic classification and mapping of the seabed using airborne LiDAR bathymetry. Eng. Geol. 2022, 301, 106615. [Google Scholar] [CrossRef]
- Available online: https://www.nato.int/cps/en/natohq/news_218545.htm?selectedLocale=en (accessed on 20 November 2023).
- Whitehouse, B.G.; Vachon, P.W.; Thomas, A.C.; Quinn, R.J.; Renaud, W.M. Rapid environmental assessment (REA) of the maritime battlespace. Can. Mil. J. 2006. Available online: http://www.journal.forces.gc.ca/vo7/no1/opinions-eng.asp (accessed on 19 January 2024).
- Guo, X.; Jin, X.; Jin, S. Shallow Water Bathymetry Mapping from ICESat-2 and Sentinel-2 Based on BP Neural Network Model. Water 2022, 14, 3862. [Google Scholar] [CrossRef]
- Fan, J.; Pei, H.; Lian, Z. Surveying of Nearshore Bathymetry Using UAVs Video Stitching. J. Mar. Sci. Eng. 2023, 11, 770. [Google Scholar] [CrossRef]
- Specht, M.; Stateczny, A.; Specht, C.; Widźgowski, S.; Lewicka, O.; Wiśniewska, M. Concept of an Innovative Autonomous Unmanned System for Bathymetric Monitoring of Shallow Waterbodies (INNOBAT System). Energies 2021, 14, 5370. [Google Scholar] [CrossRef]
- Sallenger, A.H., Jr.; Krabill, W.B.; Swift, R.N.; Brock, J.; List, J.; Hansen, M.; Holman, R.A.; Manizade, S.; Sontag, J.; Meredith, A.; et al. Evaluation of Airborne Topographic Lidar for Quantifying Beach Changes. J. Coast. Res. 2003, 19, 125–133. Available online: http://www.jstor.org/stable/4299152 (accessed on 19 January 2024).
- Mandlburger, G.; Pfennigbauer, M.; Schwarz, R.; Flöry, S.; Nussbaumer, L. Concept and Performance Evaluation of a Novel UAV-Borne Topo-Bathymetric LiDAR Sensor. Remote Sens. 2020, 12, 986. [Google Scholar] [CrossRef]
- l Savio, A.A.; Torres, A.L.; Olivera, M.A.V.; Rojas, S.R.L.; Ibarra, G.T.U.; Neckel, A. Using UAVs and Photogrammetry in Bathymetric Surveys in Shallow Waters. Appl. Sci. 2023, 13, 3420. [Google Scholar] [CrossRef]
- Specht, M.; Specht, C.; Szafran, M.; Makar, A.; Dąbrowski, P.; Lasota, H.; Cywiński, P. The Use of USV to Develop Navigational and Bathymetric Charts of Yacht Ports on the Example of National Sailing Centre in Gdańsk. Remote Sens. 2020, 12, 2585. [Google Scholar] [CrossRef]
- Makar, A. Coastal Bathymetric Sounding in Very Shallow Water Using USV: Study of Public Beach in Gdynia, Poland. Sensors 2023, 23, 4215. [Google Scholar] [CrossRef] [PubMed]
- Naus, K.; Marchel, Ł.; Szymak, P.; Nowak, A. Assessment of the Accuracy of Determining the Angular Position of the Unmanned Bathymetric Surveying Vehicle Based on the Sea Horizon Image. Sensors 2019, 19, 4644. [Google Scholar] [CrossRef] [PubMed]
- He, J.; Lin, J.; Ma, M.; Liao, X. Mapping topo-bathymetry of transparent tufa lakes using UAV-based photogrammetry and RGB imagery. Geomorphology 2021, 389, 107832. [Google Scholar] [CrossRef]
- Yang, Y.; Li, Q.; Zhang, J.; Xie, Y. Iterative Learning-Based Path and Speed Profile Optimization for an Unmanned Surface Vehicle. Sensors 2020, 20, 439. [Google Scholar] [CrossRef]
- João Feio, M.; Ferreira, V. Rios de Portugal—Comunidades, Processos e Alterações; Coimbra University Press: Coimbra, Portugal, 2019; pp. 381–421. ISBN 978-989-26-1624-7. [Google Scholar]
- Available online: https://www.ipma.pt/en/otempo/prev-sam/?p=STB (accessed on 19 September 2023).
- Rocha, M.J.; Rocha, E. Chemical Survey and Risk Assessment of 56 Pesticides in the Sado River Estuary (Iberian Peninsula, Portugal). Toxics 2023, 11, 457. [Google Scholar] [CrossRef]
- Biguino, B.; Sousa, F.; Brito, A.C. Variability of currents and water column structure in a temperate estuarine system (Sado Estuary, Portugal). Water 2021, 13, 187. [Google Scholar] [CrossRef]
- Available online: https://www.gim-international.com/content/article/the-challenges-of-shallow-water-hydrographic-surveying (accessed on 19 January 2024).
- Liang, Y.; Cheng, Z.; Du, Y.; Song, D.; You, Z. An improved method for water depth mapping in turbid waters based on a machine learning model. Estuar. Coast. Shelf Sci. 2024, 296, 108577. [Google Scholar] [CrossRef]
- Available online: https://www.onr.navy.mil (accessed on 21 November 2023).
- Available online: https://arete.com/wp-content/uploads/2023/03/PILLS-Product-Sheet-3-1-23.pdf (accessed on 27 November 2023).
- Available online: https://iho.int/uploads/user/Inter-Regional%20Coordination/RHC/NHC/NHC63/NHC63_%20Open%20session_Fugro_RAMMS_Presentation.pdf (accessed on 19 January 2024).
- Available online: https://schiebel.net/news (accessed on 27 November 2023).
- Available online: https://www.militaryaerospace.com/uncrewed/article/14248222/sensor-uncrewed-lidar (accessed on 20 January 2024).
- Available online: https://www.arditi.pt/en/about.html (accessed on 27 November 2023).
- Available online: https://www.ixblue.com/maritime/maritime-autonomy/uncrewed-surface-vehicles (accessed on 27 November 2023).
- Available online: https://www.kongsberg.com/maritime/products/ocean-science/mapping-systems/multibeam-echo-sounders/em-712-multibeam-echosounder-max.-3600-m (accessed on 20 January 2024).
- Available online: https://www.ixblue.com/wp-content/uploads/2021/12/phins-compact-series-datasheet-2020.pdf (accessed on 19 January 2024).
- Available online: https://www.septentrio.com/en (accessed on 19 January 2024).
- Guériot, D.; Chèdru, J.; Daniel, S.; Maillard, E. The patch test: A comprehensive calibration tool for multibeam echosounders. In Proceedings of the OCEANS 2000 MTS/IEEE Conference and Exhibition, Providence, RI, USA, 11–14 September 2000; Volume 3, pp. 1655–1661. [Google Scholar] [CrossRef]
- Available online: https://www.kongsberg.com/maritime/products/ocean-science/mapping-systems/multibeam-echo-sounders/sis (accessed on 20 January 2024).
- Hughes Clarke, J.E.; Mayer, L.A.; Wells, D.E. Shallow-water imaging multibeam sonars: A new tool for investigating seafloor processes in the coastal zone and on the continental shelf. Mar. Geophys. Res. 1996, 18, 607–629. [Google Scholar] [CrossRef]
- Available online: https://www.kongsberg.com/maritime/about-us/news-and-media/news-archive/2022/em-712-usv/ (accessed on 18 January 2024).
- Available online: https://www.ceiia.com (accessed on 30 November 2023).
- Available online: https://www.esa.int/Applications/Observing_the_Earth/Copernicus (accessed on 11 September 2023).
- Katsoulis-Dimitriou, S.; Lefkaditis, M.; Barmpagiannakos, S.; Kormas, K.A.; Kyparissis, A. Comparison of iCOR and Rayleigh atmospheric correction methods on Sentinel-3 OLCI images for a shallow eutrophic reservoir. PeerJ 2022, 10, e14311. [Google Scholar] [CrossRef] [PubMed]
- Stumpf, R.P.; Holderied, K.; Sinclair, M. Determination of water depth with high-resolution satellite imagery over variable bottom types. Limnol. Oceanogr. 2003, 48, 547–556. [Google Scholar] [CrossRef]
- Available online: https://www.gebco.net/data_and_products/gridded_bathymetry_data (accessed on 11 September 2023).
- Available online: https://geomar.hidrografico.pt (accessed on 4 December 2023).
- Available online: https://iho.int/uploads/user/pubs/standards/s-44/S-44_Edition_6.1.0.pdf (accessed on 5 December 2023).
- Calder, B.R.; Mayer, L.A. Automatic Processing of High-Rate, High-Density Multibeam Echosounder Data. Geochem. Geophys. Geosyst. 2003, 4, 1048. [Google Scholar] [CrossRef]
- Calder, B.; Wells, D. CUBE User’s Manual; Center for Coastal and Ocean Mapping and NOAA/UNH Joint Hydrographic Center University of New Hampshire: Durham, NH, USA, 2007. [Google Scholar]
- Ventura, D. Coastal zone mapping with the world’s first airborne multibeam bathymetric lidar mapping system. Hydrogr. Nachrichten 2020, 115, 48–53. [Google Scholar] [CrossRef]
- Available online: https://www.hydro-international.com/case-study/this-is-how-airborne-multibeam-lidar-coastal-mapping-in-paradise-is-done (accessed on 19 January 2024).
Figure 1.
Overview of the survey areas.

Figure 2.
Meteorological conditions for the study area—significant wave height (Hs), wave period (T02), and wave direction (Dp) from the WW3 model, for the period of surveys (red area).
Figure 2.
Meteorological conditions for the study area—significant wave height (Hs), wave period (T02), and wave direction (Dp) from the WW3 model, for the period of surveys (red area).

Figure 3.
Schiebel CAMCOPTER® S-100 with Areté PILLS (RAMMS) LiDAR system [41].
Figure 3.
Schiebel CAMCOPTER® S-100 with Areté PILLS (RAMMS) LiDAR system [41].

Figure 4.
Hydrographic survey of the DriX USV during the REPMUS23 exercise.

Figure 5.
Patch test survey lines for the DriX USV.

Figure 6.
Subset of the DriX USV multibeam data suggesting sound speed was correctly sampled and applied, allowing for the proper representation of a flat seafloor (each colour represents a different survey line).
Figure 6.
Subset of the DriX USV multibeam data suggesting sound speed was correctly sampled and applied, allowing for the proper representation of a flat seafloor (each colour represents a different survey line).

Figure 7.
Subset of the reference survey multibeam data suggesting sound speed was correctly sampled and applied, allowing for the proper representation of a flat seafloor (each colour represents a different survey line).
Figure 7.
Subset of the reference survey multibeam data suggesting sound speed was correctly sampled and applied, allowing for the proper representation of a flat seafloor (each colour represents a different survey line).

Figure 8.
Overview map depicting the general location of the OFFSHORE area, and a detailed plan representing the bathymetric coverage for each dataset.
Figure 8.
Overview map depicting the general location of the OFFSHORE area, and a detailed plan representing the bathymetric coverage for each dataset.

Figure 9.
Tide table used for the survey period showing the height of the tide. Available at [57].
Figure 9.
Tide table used for the survey period showing the height of the tide. Available at [57].

Figure 10.
Reference bathymetric surface.

Figure 11.
Reference bathymetric survey statistics, (a)—node density, (b)—node standard deviation.

Figure 12.
USV MB bathymetric surface.

Figure 13.
USV MB bathymetric survey statistics, (a)—node density, (b)—node standard deviation.

Figure 14.
UAV LiDAR bathymetric surface.

Figure 15.
UAV LIDAR bathymetric survey statistics, (a)—node density, (b)—node standard deviation.

Figure 16.
(a)—location of the vertical transversal profile between the shallow and deep surfaces (b)—inconsistency step between the shallow and deep LiDAR UAV surfaces (for the profile selected between the two coloured squares).
Figure 16.
(a)—location of the vertical transversal profile between the shallow and deep surfaces (b)—inconsistency step between the shallow and deep LiDAR UAV surfaces (for the profile selected between the two coloured squares).

Figure 17.
SDB mean values (expressed in meters).

Figure 18.
Horizontal accuracy assessment of the bathymetric surfaces. (a)—MB USV, LiDAR UAV, and the reference survey overlaid focusing on a submerged sand formation, (b)—focus on the same submerged sand formation, showing the match of all the 3 surfaces.
Figure 18.
Horizontal accuracy assessment of the bathymetric surfaces. (a)—MB USV, LiDAR UAV, and the reference survey overlaid focusing on a submerged sand formation, (b)—focus on the same submerged sand formation, showing the match of all the 3 surfaces.

Figure 19.
Difference surface between reference survey and UAV LIDAR survey.

Figure 20.
LiDAR UAV along-track artefacts shown with 20× vertical exaggeration.

Figure 21.
Difference surface between reference survey and SDB.

Figure 22.
Difference surface between UAV LIDAR survey and USV MB survey.

Figure 23.
LiDAR UAV and SDB surface differences vs. reference survey histogram.

Figure 24.
Vertical profile differences between the reference survey, UAV LiDAR, USV MBES, and SDB.

Figure 25.
Reference surface depth contours vs. ENC depth contours.

Figure 26.
MBES USV depth contours vs. ENC depth contours.

Figure 27.
LiDAR UAV depth contours vs. ENC depth contours.

Figure 28.
SDB depth contours vs. ENC depth contours.


Table 1.
PILLS topo-bathymetric LiDAR technical specifications [39].
Table 1.
PILLS topo-bathymetric LiDAR technical specifications [39].
| Technical Specifications | Technical Specifications’ Values |
|---|---|
| Dimensions | 41″ × 10″ × 6″ (LxWxD) | < 2 ft2 volume |
| Weight | <13.6 kg (30 lbs.) |
| Power | <250 W |
| Transmit Specifications | Wavelength: 532 nm | Repetition Rate: 30 Hz ×2 Energy per pulse: 37 mJ | Pulse Width: 5.1 ns |
| Operational Altitude | 300 m |
| Swath Width | 0.9 nominal altitude |
| Operational Speed | Manned: 100–120 kn | Unmanned: 50–60 kn |
| Area Search Rate | Manned: 57 sq km/hr | Unmanned: 31 sq km/hr |
| Depth Penetration | 3 × d−1 |
| Operational Temperature Range | −20 °C to 50 °C |
| Point Density | 25,000 points per second |
| Feature Detection | 2 m cubic features |
| IHO Order | 1 A |
| Platforms | Small aircraft of opportunity (Cessna class and larger), unmanned (Schiebel S-100, SeaHunter UAS), rotary wing |
Table 2.
LiDAR AITRAC lasers survey parameters.
| Laser Parameters | Values |
|---|---|
| Scan Rate | 60 Hz (2 lasers combined) |
| Flight altitude | 128 m |
| Points across swath | 850 points/line |
| Scan swath width | 115 m |
| Along-track point spacing | 35–50 cm |
| Across-track points spacing | 12 cm |
| Point density | 15–20 points/m2 |
Table 3.
Kongsberg EM 712 USV multibeam technical specifications [45].
Table 3.
Kongsberg EM 712 USV multibeam technical specifications [45].
| Kongsberg EM712 USV Technical Specifications | |
|---|---|
| Frequency range | 40 to 100 kHz |
| Max ping rate | 30 Hz |
| Swath coverage sector | Up to 140° |
| Beam spacing | Equiangular, equidistant |
| Roll stabilized beams | ±15° |
| Pitch stabilized beams | ±10° |
| Transducer Tx Length | 970 mm |
| Transducer Rx Length | 970 mm |
| Angular resolution | 1° × 1° (100 kHz) |
| Max. no. of beams per ping | 800 (dual swath mode) |
Table 4.
Bathymetric survey parameters.
| Reference MB Survey | USV MB Survey | UAV LiDAR Survey | SDB-cEiiA | |
|---|---|---|---|---|
| Survey Lines Total Length (km) | 34.65 | 37.90 | 74.20 | - |
| Area Survey Time (hh: mm) | 02:49 | 03:17 | 02:21 | - |
| Survey Average Speed (kts) | 6.62 | 6.20 | 40–60 | - |
| Swath overlap (%) | 50 | 15 | 15 | - |
| Area Covered (km2) | 0.78 | 1.94 | 4.56 | 5.08 |
| OFFSHORE Area Covered (%) | 15.37 | 38.21 | 89.74 | 100 |
| Distance between survey lines (m) | 50 | 60 | 100 | - |
| Acquisition Period (DD/MM/YYYY) | 06/09/2023 | 15/09/2023 | 18/09/2023 | 04/01/2023 14/04/2023 |
Table 5.
Systems’ bathymetric datasets’ description.
| Reference MB Survey | USV MB Survey | UAV LiDAR Survey | SDB-cEiiA | SDB-AIRBUS | |
|---|---|---|---|---|---|
| Dataset type | Point Cloud | Point Cloud | Point Cloud | Raster | Raster |
| Dataset file format | KMALL | KMALL | CSVXYZ | GeoTIFF | GeoTIFF |
| DTM Gridding Method | CUBE | CUBE | Basic Weighted Mean | - | - |
| DTM Resolution (m) | 1.00 | 1.00 | 1.00 | 10.0 | 1.20 |
Table 6.
Reference survey density and standard deviation details.
| NODE DENSITY | NODE STD (m) | |
|---|---|---|
| Minimum | 1 | 0.0 |
| Maximum | 1683 | 0.1 |
| Mean | 139.66 | 0.0 |
| Standard Deviation | 59.39 | 0.0 |
Table 7.
USV MB survey density and standard deviation details.
| Node Density | Node Std (m) | |
|---|---|---|
| Minimum | 1 | 0.0 |
| Maximum | 3341 | 0.1 |
| Mean | 110.33 | 0.0 |
| Standard Deviation | 61.77 | 0.0 |
Table 8.
UAV LIDAR survey density and standard deviation details.
| NODE DENSITY | NODE STD (m) | |
|---|---|---|
| Minimum | 1 | 0.0 |
| Maximum | 1173 | 2.6 |
| Mean | 65.60 | 0.2 |
| Standard Deviation | 17.37 | 0.1 |
Table 9.
LiDAR and SDB surfaces’ histogram statistics against the reference survey.
| UAV LiDAR | SDB-cEiiA | |
|---|---|---|
| Minimum (m) | −1.3 | −1.6 |
| Maximum (m) | 0.8 | 7.2 |
| Mean (m) | 0.2 | 2.1 |
| STD (m) | 0.3 | 2.1 |
Disclaimer/Publisher’s Note: The statements, opinions and data contained in all publications are solely those of the individual author(s) and contributor(s) and not of MDPI and/or the editor(s). MDPI and/or the editor(s) disclaim responsibility for any injury to people or property resulting from any ideas, methods, instructions or products referred to in the content. |
© 2024 by the authors. Licensee MDPI, Basel, Switzerland. This article is an open access article distributed under the terms and conditions of the Creative Commons Attribution (CC BY) license (https://creativecommons.org/licenses/by/4.0/).
Share and Cite
MDPI and ACS Style
Constantinoiu, L.-F.; Tavares, A.; Cândido, R.M.; Rusu, E. Innovative Maritime Uncrewed Systems and Satellite Solutions for Shallow Water Bathymetric Assessment. Inventions 2024, 9, 20. https://doi.org/10.3390/inventions9010020
AMA Style
Constantinoiu L-F, Tavares A, Cândido RM, Rusu E. Innovative Maritime Uncrewed Systems and Satellite Solutions for Shallow Water Bathymetric Assessment. Inventions. 2024; 9(1):20. https://doi.org/10.3390/inventions9010020
Chicago/Turabian StyleConstantinoiu, Laurențiu-Florin, António Tavares, Rui Miguel Cândido, and Eugen Rusu. 2024. "Innovative Maritime Uncrewed Systems and Satellite Solutions for Shallow Water Bathymetric Assessment" Inventions 9, no. 1: 20. https://doi.org/10.3390/inventions9010020