Article

Investigation on the Crashworthiness Performance of Thin-Walled Multi-Cell PLA 3D-Printed Tubes: A Multi-Parameter Analysis

1
Department of Mechanical, Faculty of Engineering, Universitas Indonesia, Depok 16424, Indonesia
2
Research Center for Aeronautics Technology, The National Research and Innovation Agency (BRIN), Bogor 16350, Indonesia
*
Authors to whom correspondence should be addressed.
Designs 2023, 7(5), 108; https://doi.org/10.3390/designs7050108
Submission received: 29 July 2023 / Revised: 25 August 2023 / Accepted: 8 September 2023 / Published: 12 September 2023

Abstract

:
The effect of printing parameters (nozzle diameter, layer height, nozzle temperature, and printing speed), dimensions (wall thickness), and filament material on the crashworthiness performance of 3D-printed thin-walled multi-cell structures (TWMCS) undergoing quasi-static compression is presented. The ideal combination of parameters was determined by employing the Signal-to-Noise ratio (S/N), while Analysis of Variance (ANOVA) was utilized to identify the significant parameters and assess their impact on crashworthiness performance. The findings indicated that the ideal parameters for the specific energy absorption (SEA) consisted of a nozzle diameter of 0.6 mm, layer height of 0.3 mm, nozzle temperature of 220 °C, printing speed of 90 mm/s, wall thickness of 1.6 mm, and PLA(+) filament material. Afterward, the optimal parameters for crushing force efficiency (CFE) included a nozzle diameter of 0.8 mm, layer height of 0.3 mm, nozzle temperature of 230 °C, print speed of 90 mm/s, wall thickness of 1.6 mm, and PLA(ST) filament material. The optimum parameter to minimize manufacturing time is 0.3 mm for layer height and 90 mm/s for printing speed. This research presents novel opportunities for optimizing lightweight structures with enhanced energy absorption capacities. These advancements hold the potential to elevate passenger safety and fortify transportation systems. By elucidating the fundamental factors governing the crashworthiness of thin-walled multi-cell PLA 3D-printed tubes, this study contributes to a deeper understanding of the field.

1. Introduction

Thin-walled structures have gained significant attention in the field of transportation due to their remarkable energy absorption capabilities and lightweight nature, effectively ensuring passenger safety [1,2]. Many researchers attempt to achieve the objective of enhancing crashworthiness performance and minimizing the weight of structures in the development of energy absorbers. Numerous factors, including material properties, cross-sectional design, and wall thickness, affect the efficiency of energy absorption in a thin-walled tube [3]. As a result, there has been a growing interest in using multi-cell columns as energy absorbers in recent years [4,5]. According to Zhang and Cheng [6], it was highlighted that multi-cell columns of varying sizes can absorb approximately 50–100% more energy compared to foam-filled columns of equal weight. Multi-cell structures offer an efficient approach to preserving the mass effectiveness of the structure while enhancing its crashworthiness characteristics [7].
Crashworthiness is a critical factor in the design and operation of modern mass transportation systems and is essential for ensuring the safety of passengers and crew during a crash event. Additive manufacturing (AM) is particularly useful in applications such as designing protective structures and devices for automobiles, aircraft, and medical equipment [8,9]. The AM method allows for the creation of structures with precise internal geometries and internal channels, which can be filled with materials that are able to deform and absorb impact forces [10]. Furthermore, AM allows for the production of customized geometries that are not possible with traditional manufacturing methods [11], thus expanding the design space for energy-absorbing structures.
Several materials, including nylon (PA), polycarbonate (PC), acrylonitrile butadiene styrene (ABS), and polylactic acid (PLA), are available for the AM method. Among them, PLA is one of the most promising polymers due to its mechanical property profile, thermoplastic processability, and biological features such as biocompatibility, and biodegradability [12]. PLA has a relatively low-melting point, between 150 and 160 °C, which means that printing with it requires less energy and is a safer alternative to ABS plastic, which may be toxic [13]. Moreover, although PLA is stronger than ABS, it has less ductility but similar qualities [14]. Due to the advantages of PLA, extensive research has been conducted on characterizing its crashworthiness [15,16].
Several studies have explored the crashworthiness of polymeric materials created by 3D printers, such as in [17,18]. Several researchers incorporated 3D-printing methods in the production of thinned-walled tubes in order to merge the benefits of multi-cell structures, resulting in remarkable energy absorption characteristics [19,20]. Wang et al. [21] analyzed the effects of filling density and filling shape on crashworthiness characteristics of 3D-printed multi-cell structures. Based on experimental results, it was found that hexagonal tubes with medium-filling density exhibited a higher crushing force efficiency (CFE) than those with lower or higher densities. Moreover, hexagonal tubes filled with triangular cells showed the highest CFE of 85.6%, indicating good energy absorption uniformity. Tsouknidas et al. [22] investigated the effect of printing parameters on the energy absorption of structures. A 25% infill density and a layer height of 0.1 mm are used to find the best output factors in terms of energy absorption.
The effects of process parameters on the behavior of 3D-printed items have been the subject of extensive research [23,24]. Qattawi et al. [25] investigated how different process parameters impact the mechanical properties of printed items under a variety of processing settings. The researchers found that the effects of the infill pattern and infill density on the tensile characteristics were relatively minor. Hikmat et al. [26] conducted an investigation on the tensile strength properties of PLA specimens manufactured using 3D printing, employing the Taguchi method. The study identified three key parameters that significantly influenced the results: build orientation, nozzle diameter, and infill density. The majority of the study on the effects of printing parameters has mostly concentrated on their mechanical characterization, with limited research conducted on their impact on crashworthiness characterization.
This study aims to explore how to maximize the crashworthiness performance of 3D-printed multi-cell structures. Thus, various parameters such as nozzle diameter, layer height, nozzle temperature, printing speed, wall thickness, and materials combination are selected. These parameters will be investigated individually and in combination to evaluate their effect on the crashworthiness characteristics of the printed structures. Taguchi’s approach will be used to analyze the data, which is a widely used method for optimizing complex manufacturing processes. The ANOVA technique was employed to detect the significant factors and evaluate their influence on crashworthiness performance. The results of this study are expected to provide valuable insights into how to enhance the crashworthiness of 3D-printed structures and advance the knowledge in this field.

2. Experimental Procedure

2.1. Materials and Processing

In this research, the 1.75 mm diameter PLA filament was obtained from the eSun company. The mechanical properties provided by eSun are shown in Table 1.
The multi-cell tube design in this study was inspired by the new bio-inspired structure of natural honeycomb and hierarchical structure [21,28]. The specimen model was created using 3D computer-aided design (CAD) software (SolidWorks 2015, Dassault Systèmes-SolidWorks Corporation, Waltham, MA, United States), which was then exported in Standard Tessellation Language (STL) file format. The height L of specimens was designed with a length of 50 mm and the hexagonal multi-cell structures had a 35 mm diameter D. The thickness tm of the multi-cell structure was 0.8 mm and the thickness tw of the tube wall varied from 0.8 mm, 1.2 mm, and 1.6 mm. Furthermore, a trigger with a diameter of 0.5 mm at a position of 5 mm from the top of the multi-cell tube is used to reduce the initial peak crushing force [29], as shown in Figure 1a. The next step was to save the model into G-code utilizing computer-aided manufacturing (CAM) software (UltiMaker Cura 5.4, Ultimaker B.V., Utrecht, Netherlands) (Figure 1b). The PLA series (PLA(+), PLA(LW) (light weight) and PLA(ST) (tought)) specimens in this research are manufactured by a Creality 3D printer (Figure 1c).

2.2. Experimental Methods

In order to assess the quality of experimental outcomes, Taguchi improved the idea of fractional factorials by utilizing orthogonal arrays. He proposed the use of orthogonal arrays and signal-to-noise (S/N) ratios as tools to assist designers in developing a robust process with less dependence on noise considerations. There are three categories of signal-to-noise ratio (S/N ratio) that are based on the desired outcome: bigger is better, smaller is better, and nominal is better [30]. In the present study, the Taguchi method is utilized to optimize the crashworthiness characteristics of multi-cell tubes made of PLA material. For the experiments, a total of six input parameters were selected with three levels each as shown in Table 2. The L27 Taguchi orthogonal array was employed to carry out the experiments.
To optimize the crashworthiness properties, the principle of “bigger is better” is employed. Equation (1) illustrates the corresponding response.
S N = 10 log   1 n i = 1 n 1 y i 2
Additionally, “smaller is better” is followed in order to optimize manufacturing time. Equation (2) shows the expression for the corresponding response.
S N = 10 log   1 n i = 1 n y i 2
where n is the number of observations and y is the observed data.
Minitab (Minitab Statistical Software: Cloud App & Windows Desktop, Minitab, LLC., PA, United States) was used to conduct an analytical investigation to discover the major process characteristics that influence the crashworthiness of multi-cell tubes.

2.3. Determination of Optimal Printing Parameters

The ANOVA method is employed to analyze the influence of various factors on output parameters. This statistical tool helps determine the impact of different factors on process results by examining mean squares and errors at the individual level [31]. In contrast, the regression equation and its corresponding scientific model, which achieved the best fit, were forecasted using printing parameters such as nozzle diameter, layer height, nozzle temperature, printing speed, and wall thickness, which were treated as covariates. At the same time, the filament material was considered a factor.

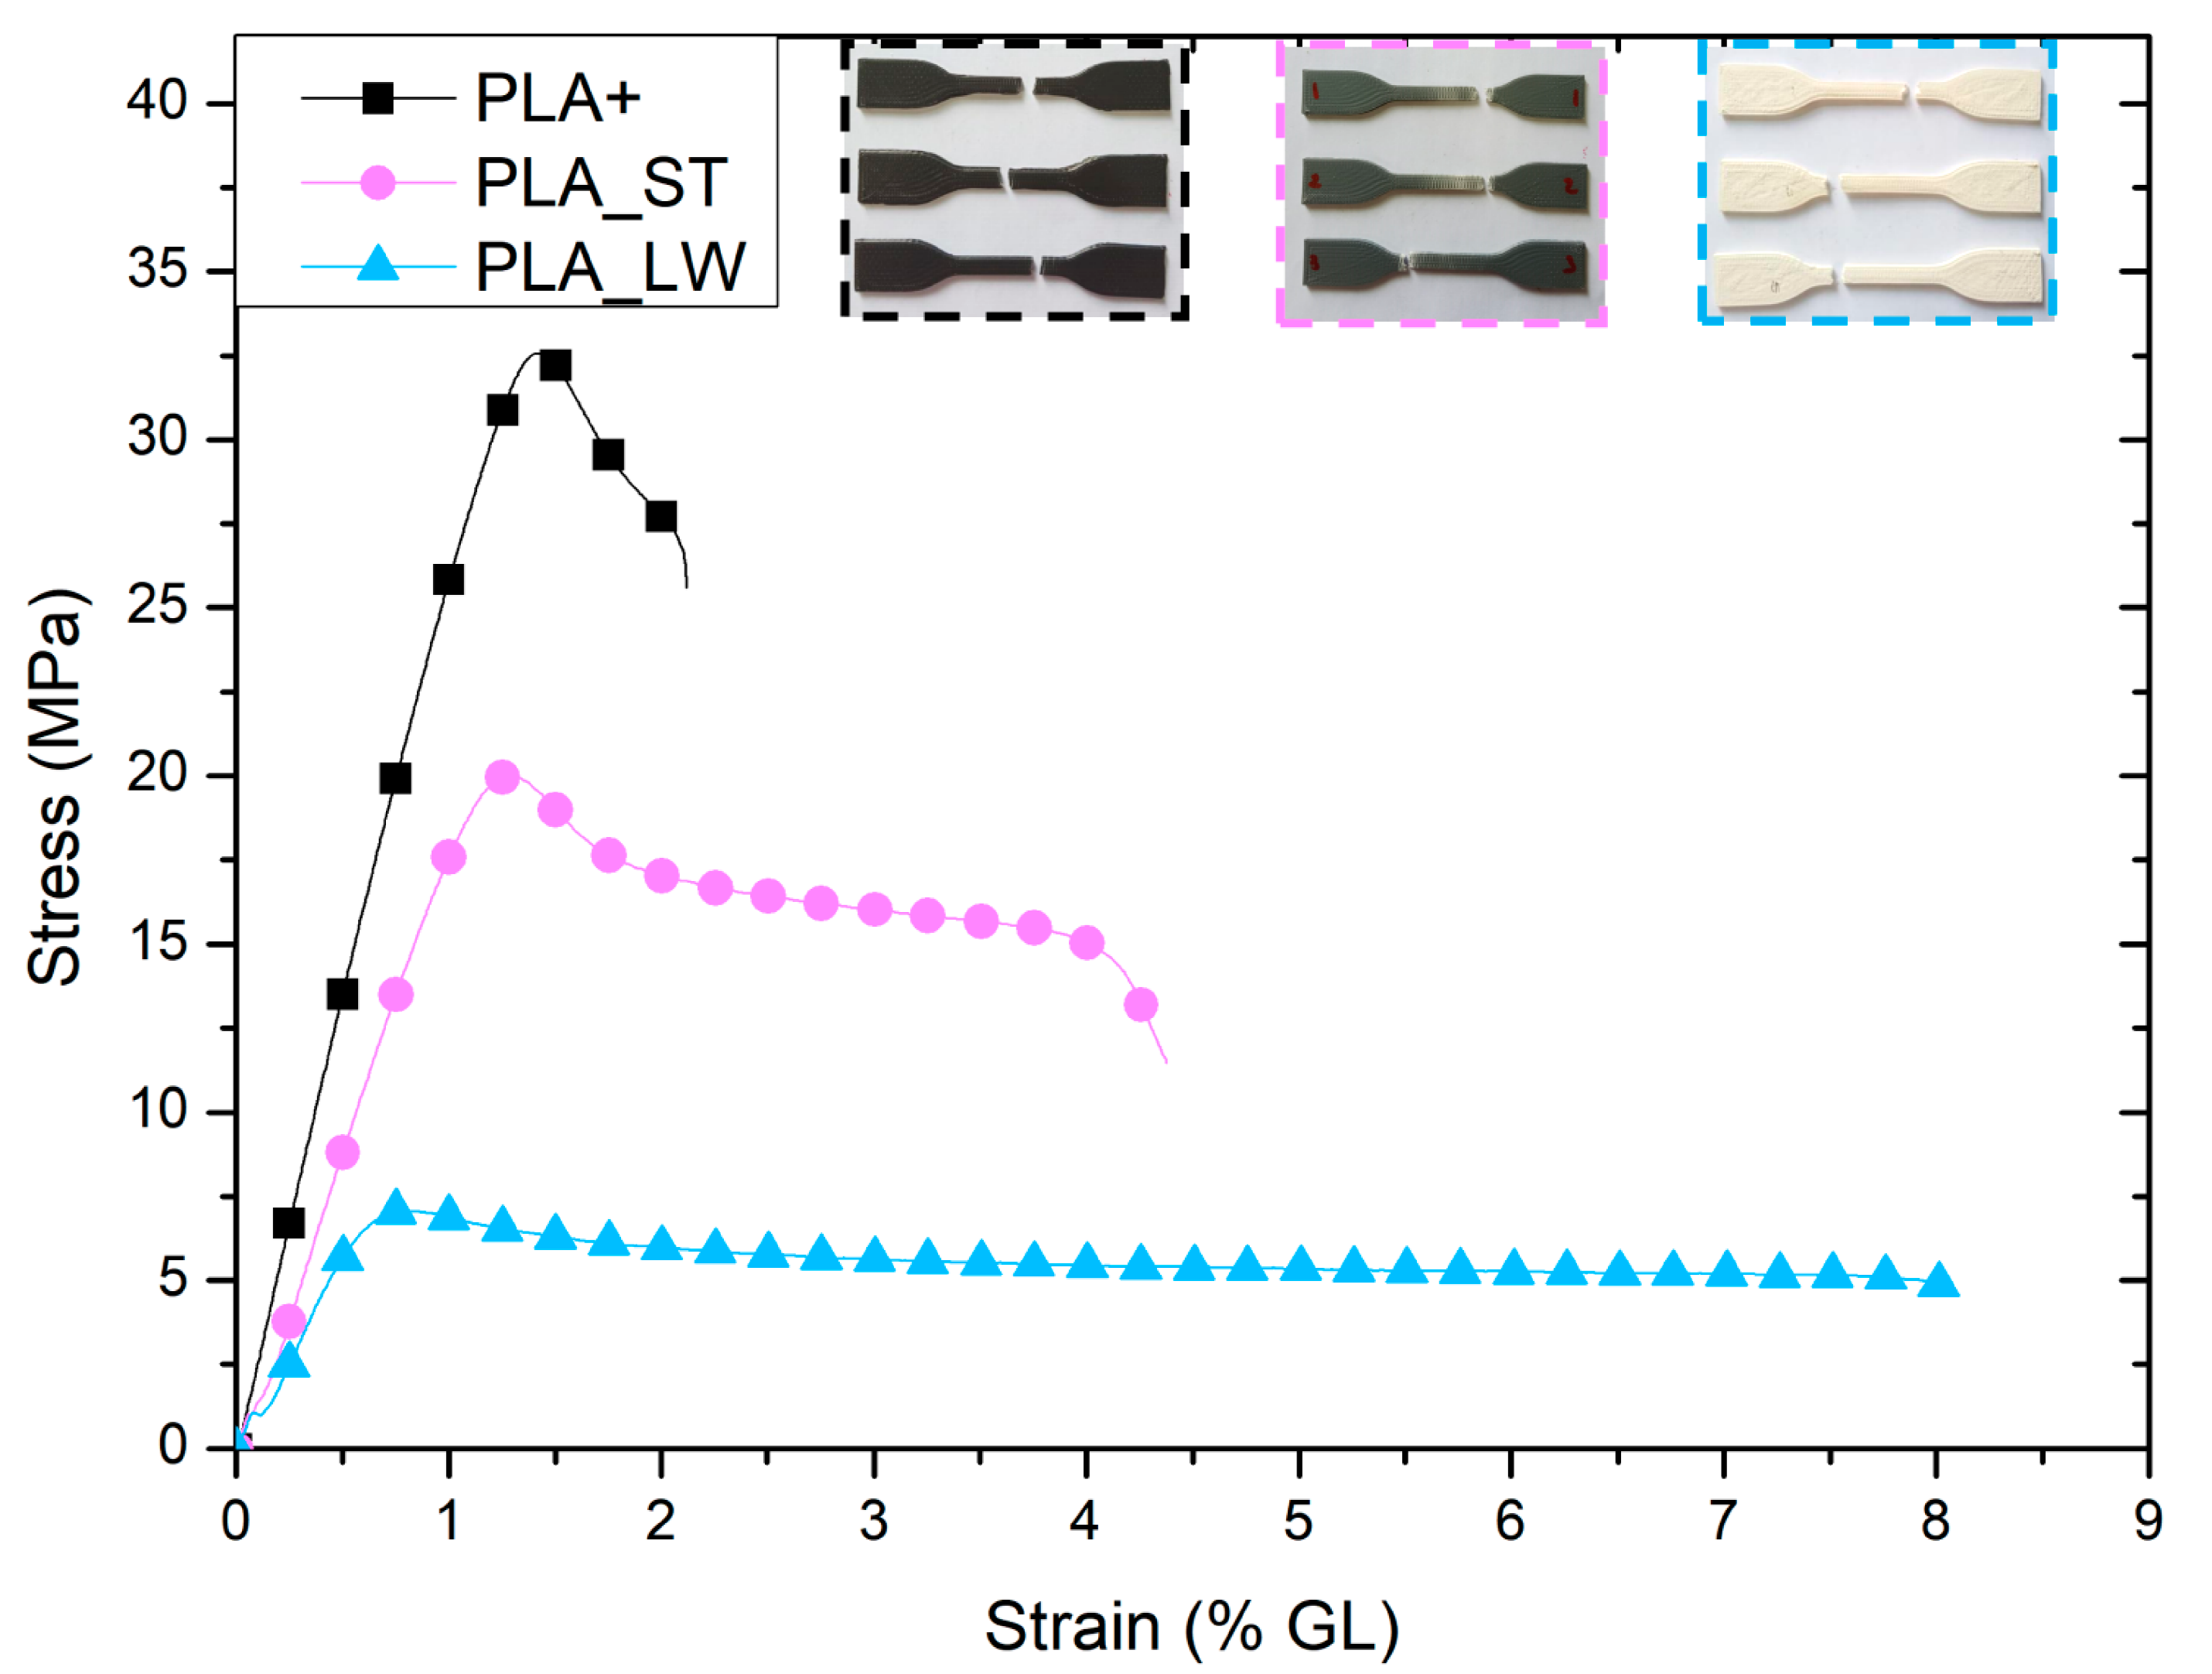
2.4. Tensile Properties

Uniaxial tensile tests were conducted using standard tensile specimens following the ASTM D638’s Type IV sample to acquire the tensile properties of the PLA series [32]. While printing, the nozzle temperature was set to 210 °C, the printing platform was kept at 60 °C, the layer height of the 3D printed samples was set to 0.3 mm, and the infill density was set to 100%. Additionally, the printing speed was set to 60 mm/s. The tensile test was conducted using the Tensilon universal testing machine, which has a capacity of 100 kN. The test speed was set to 5 mm/min, and the test was performed at room temperature.
The crushing behaviors of the PLA 3D-printed tube were investigated by axial quasi-static compressive tests utilizing a Tensilon universal mechanical testing machine as shown in Figure 2. The crosshead speed used was 5 mm/min with a maximum crushing displacement of 2/3 of the initial total height [33,34].

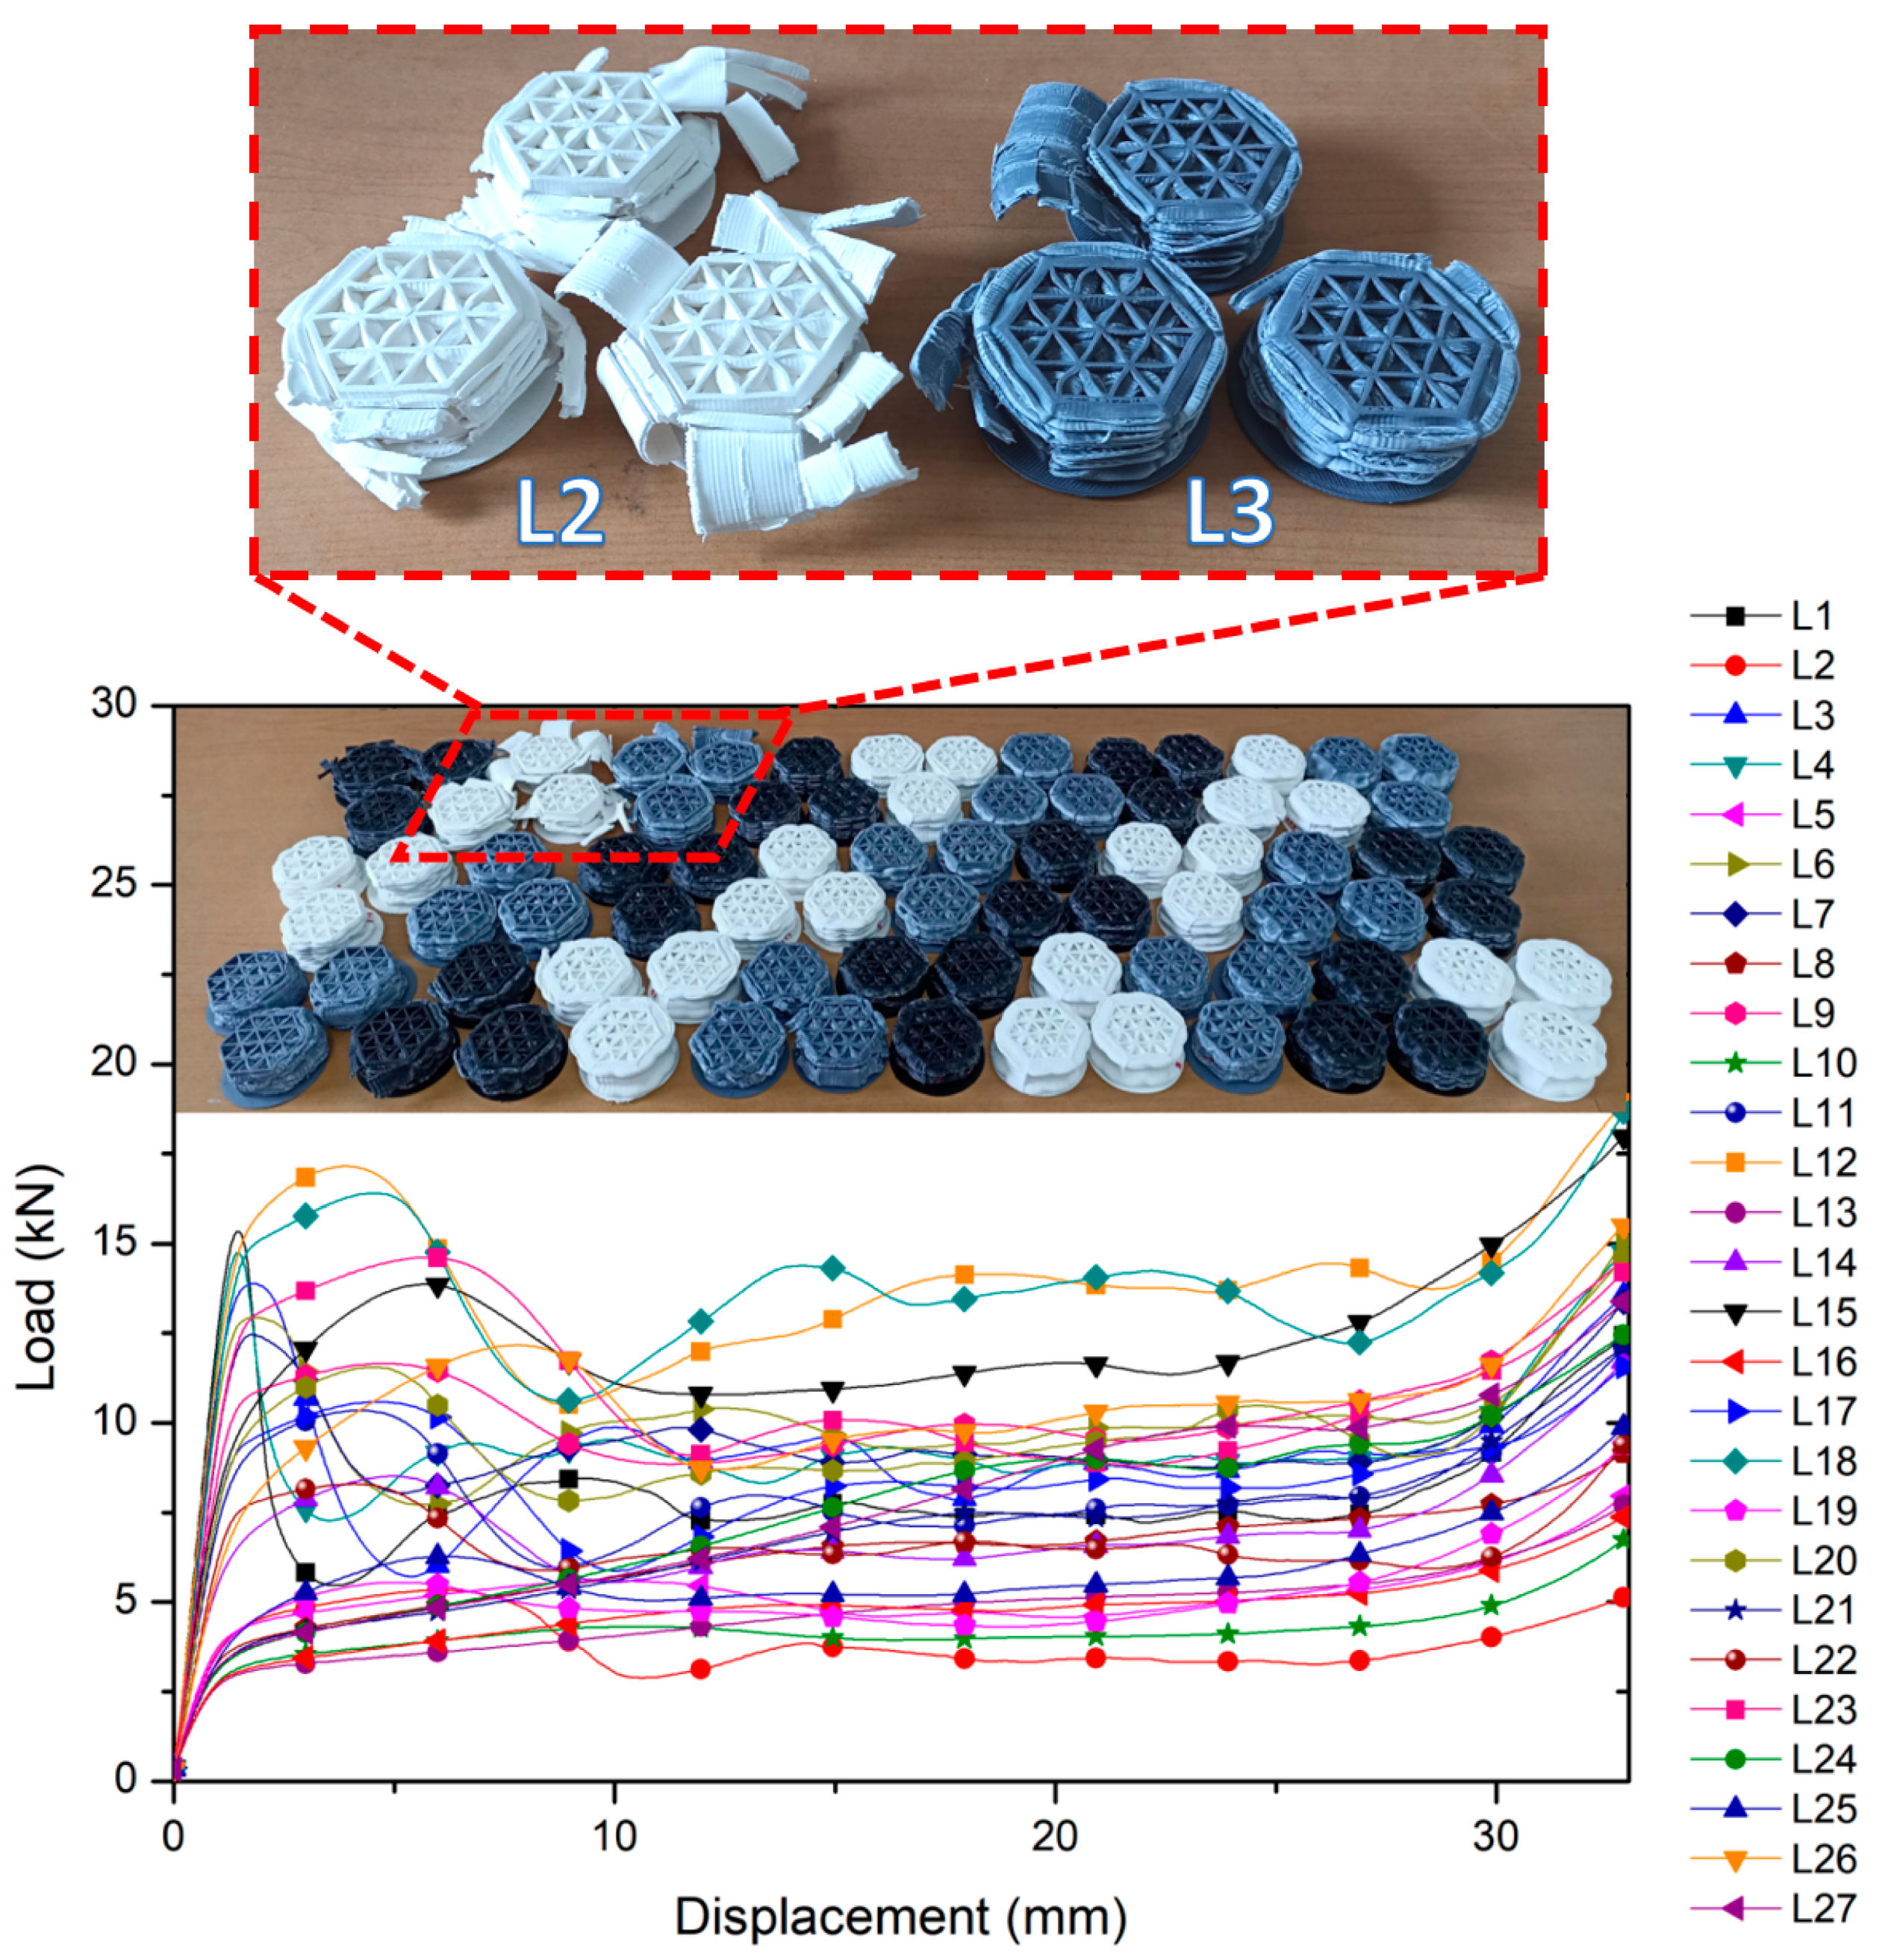
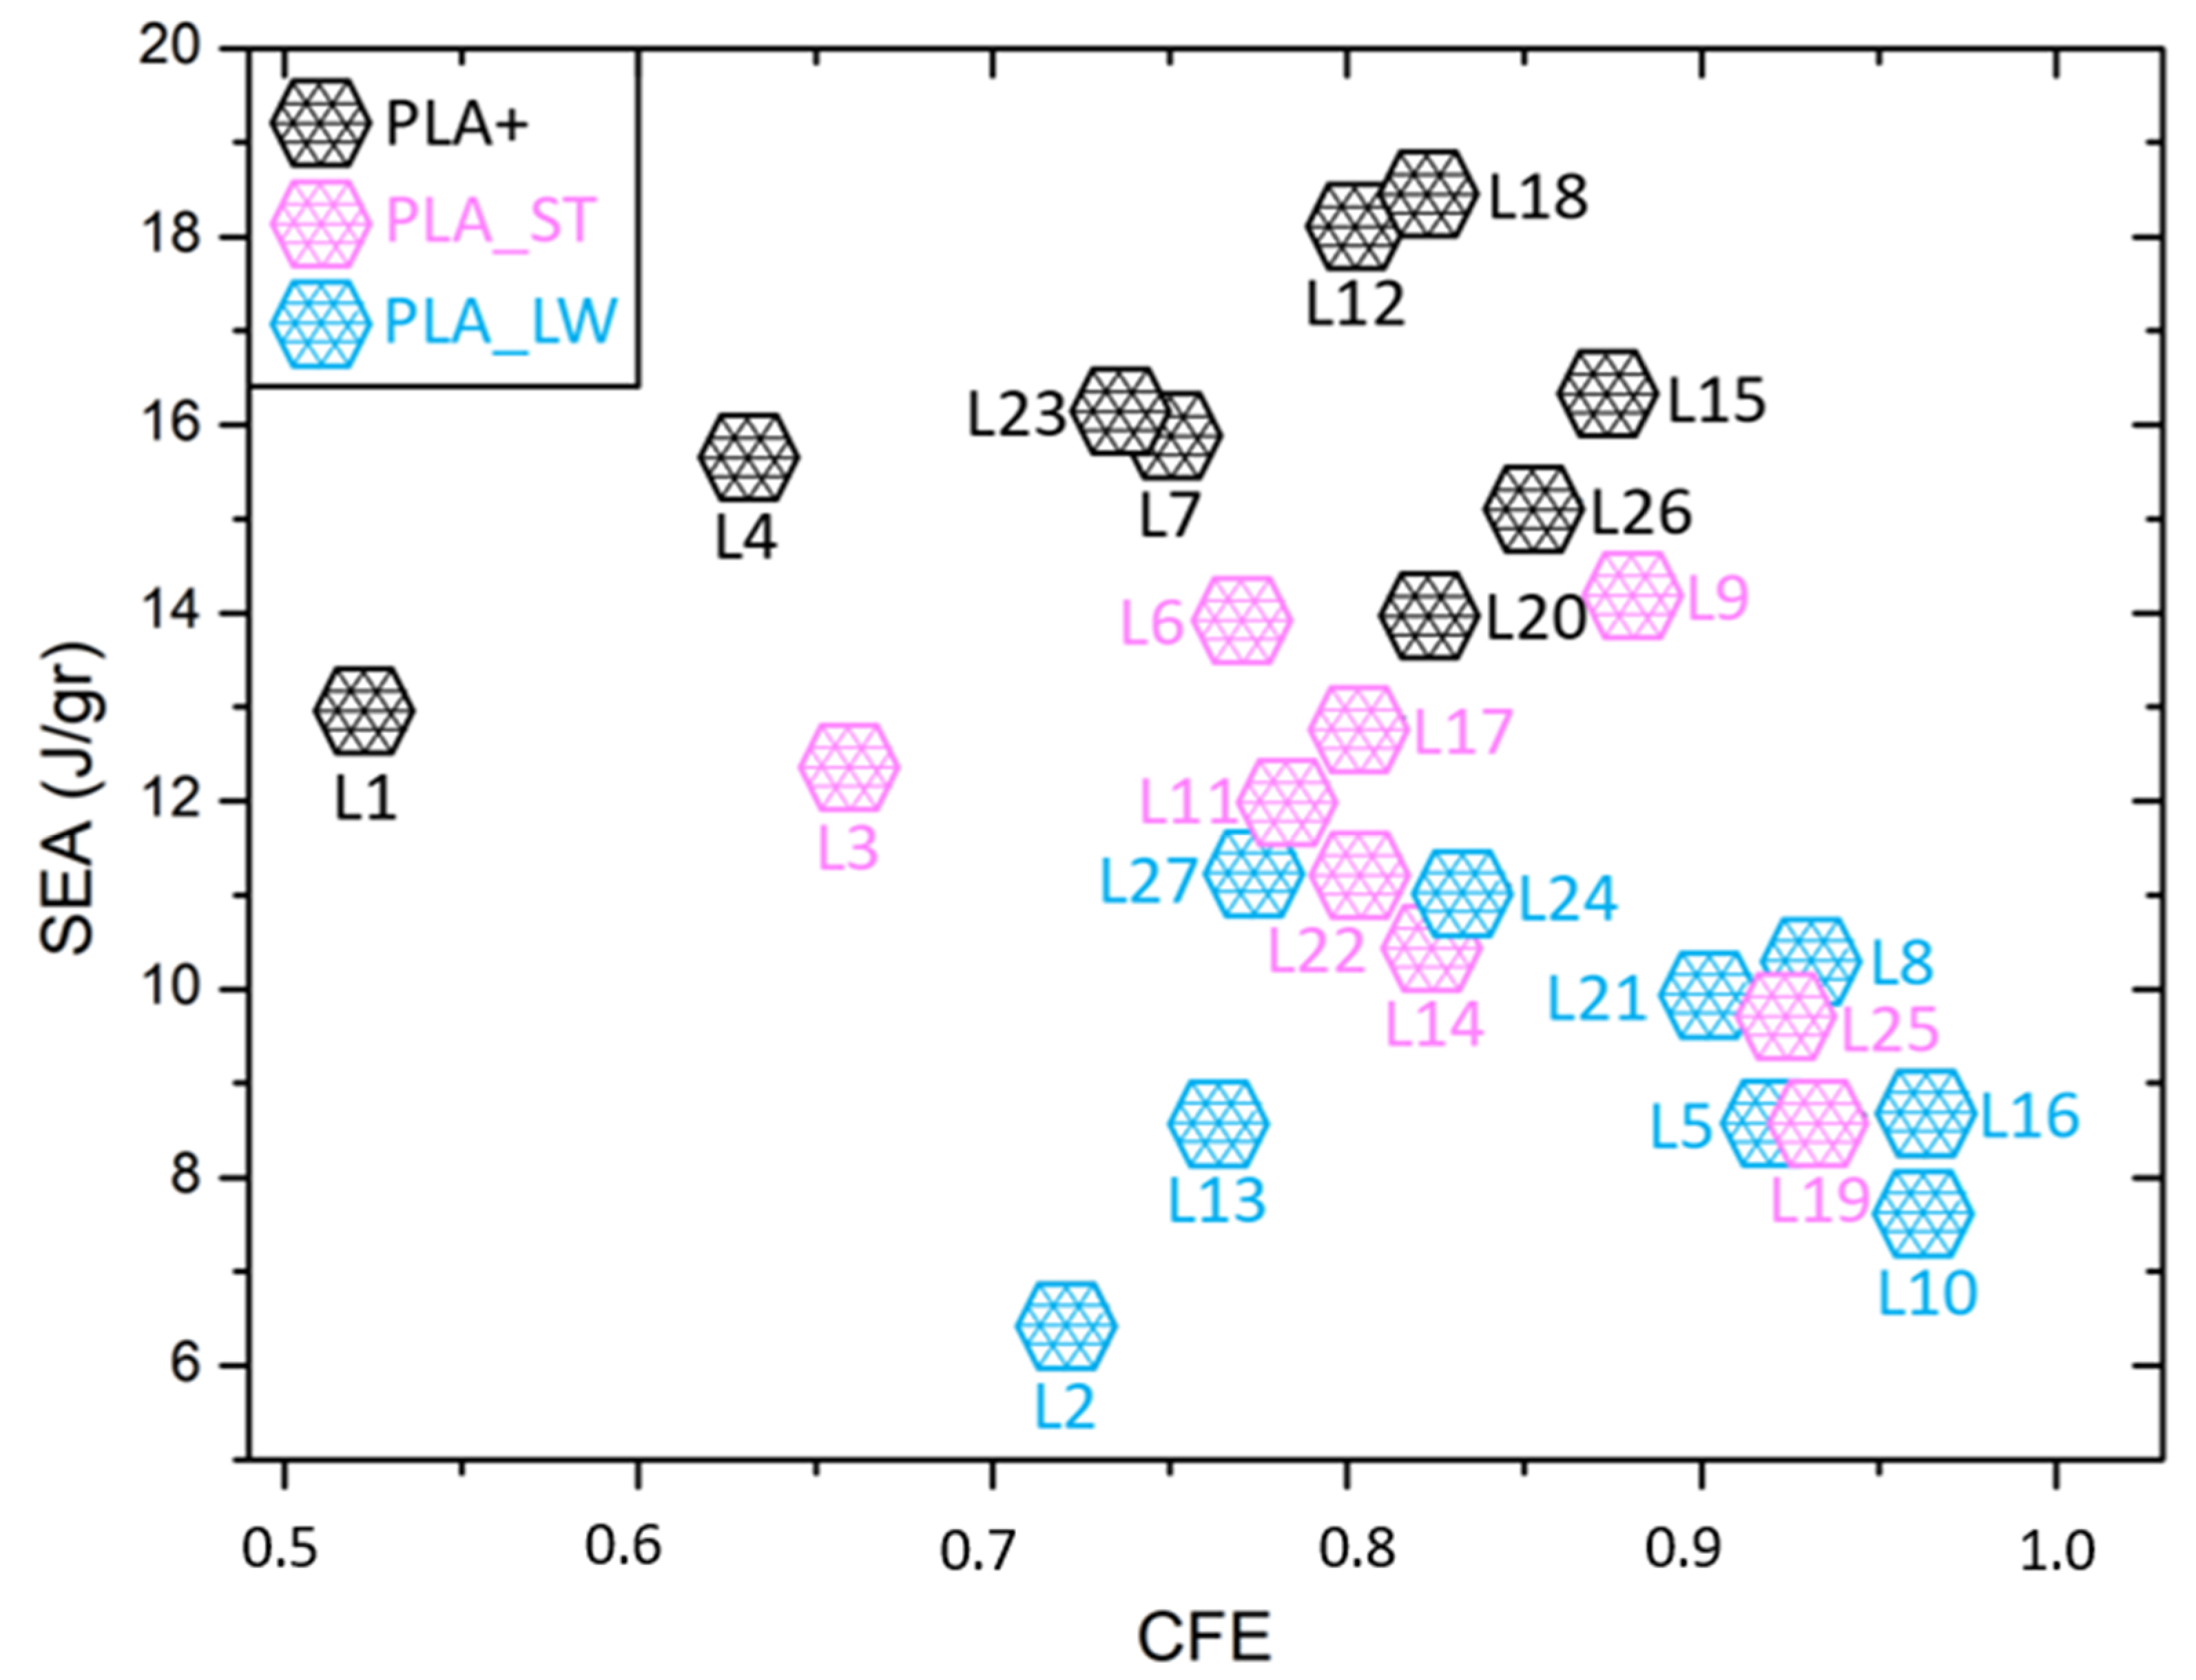
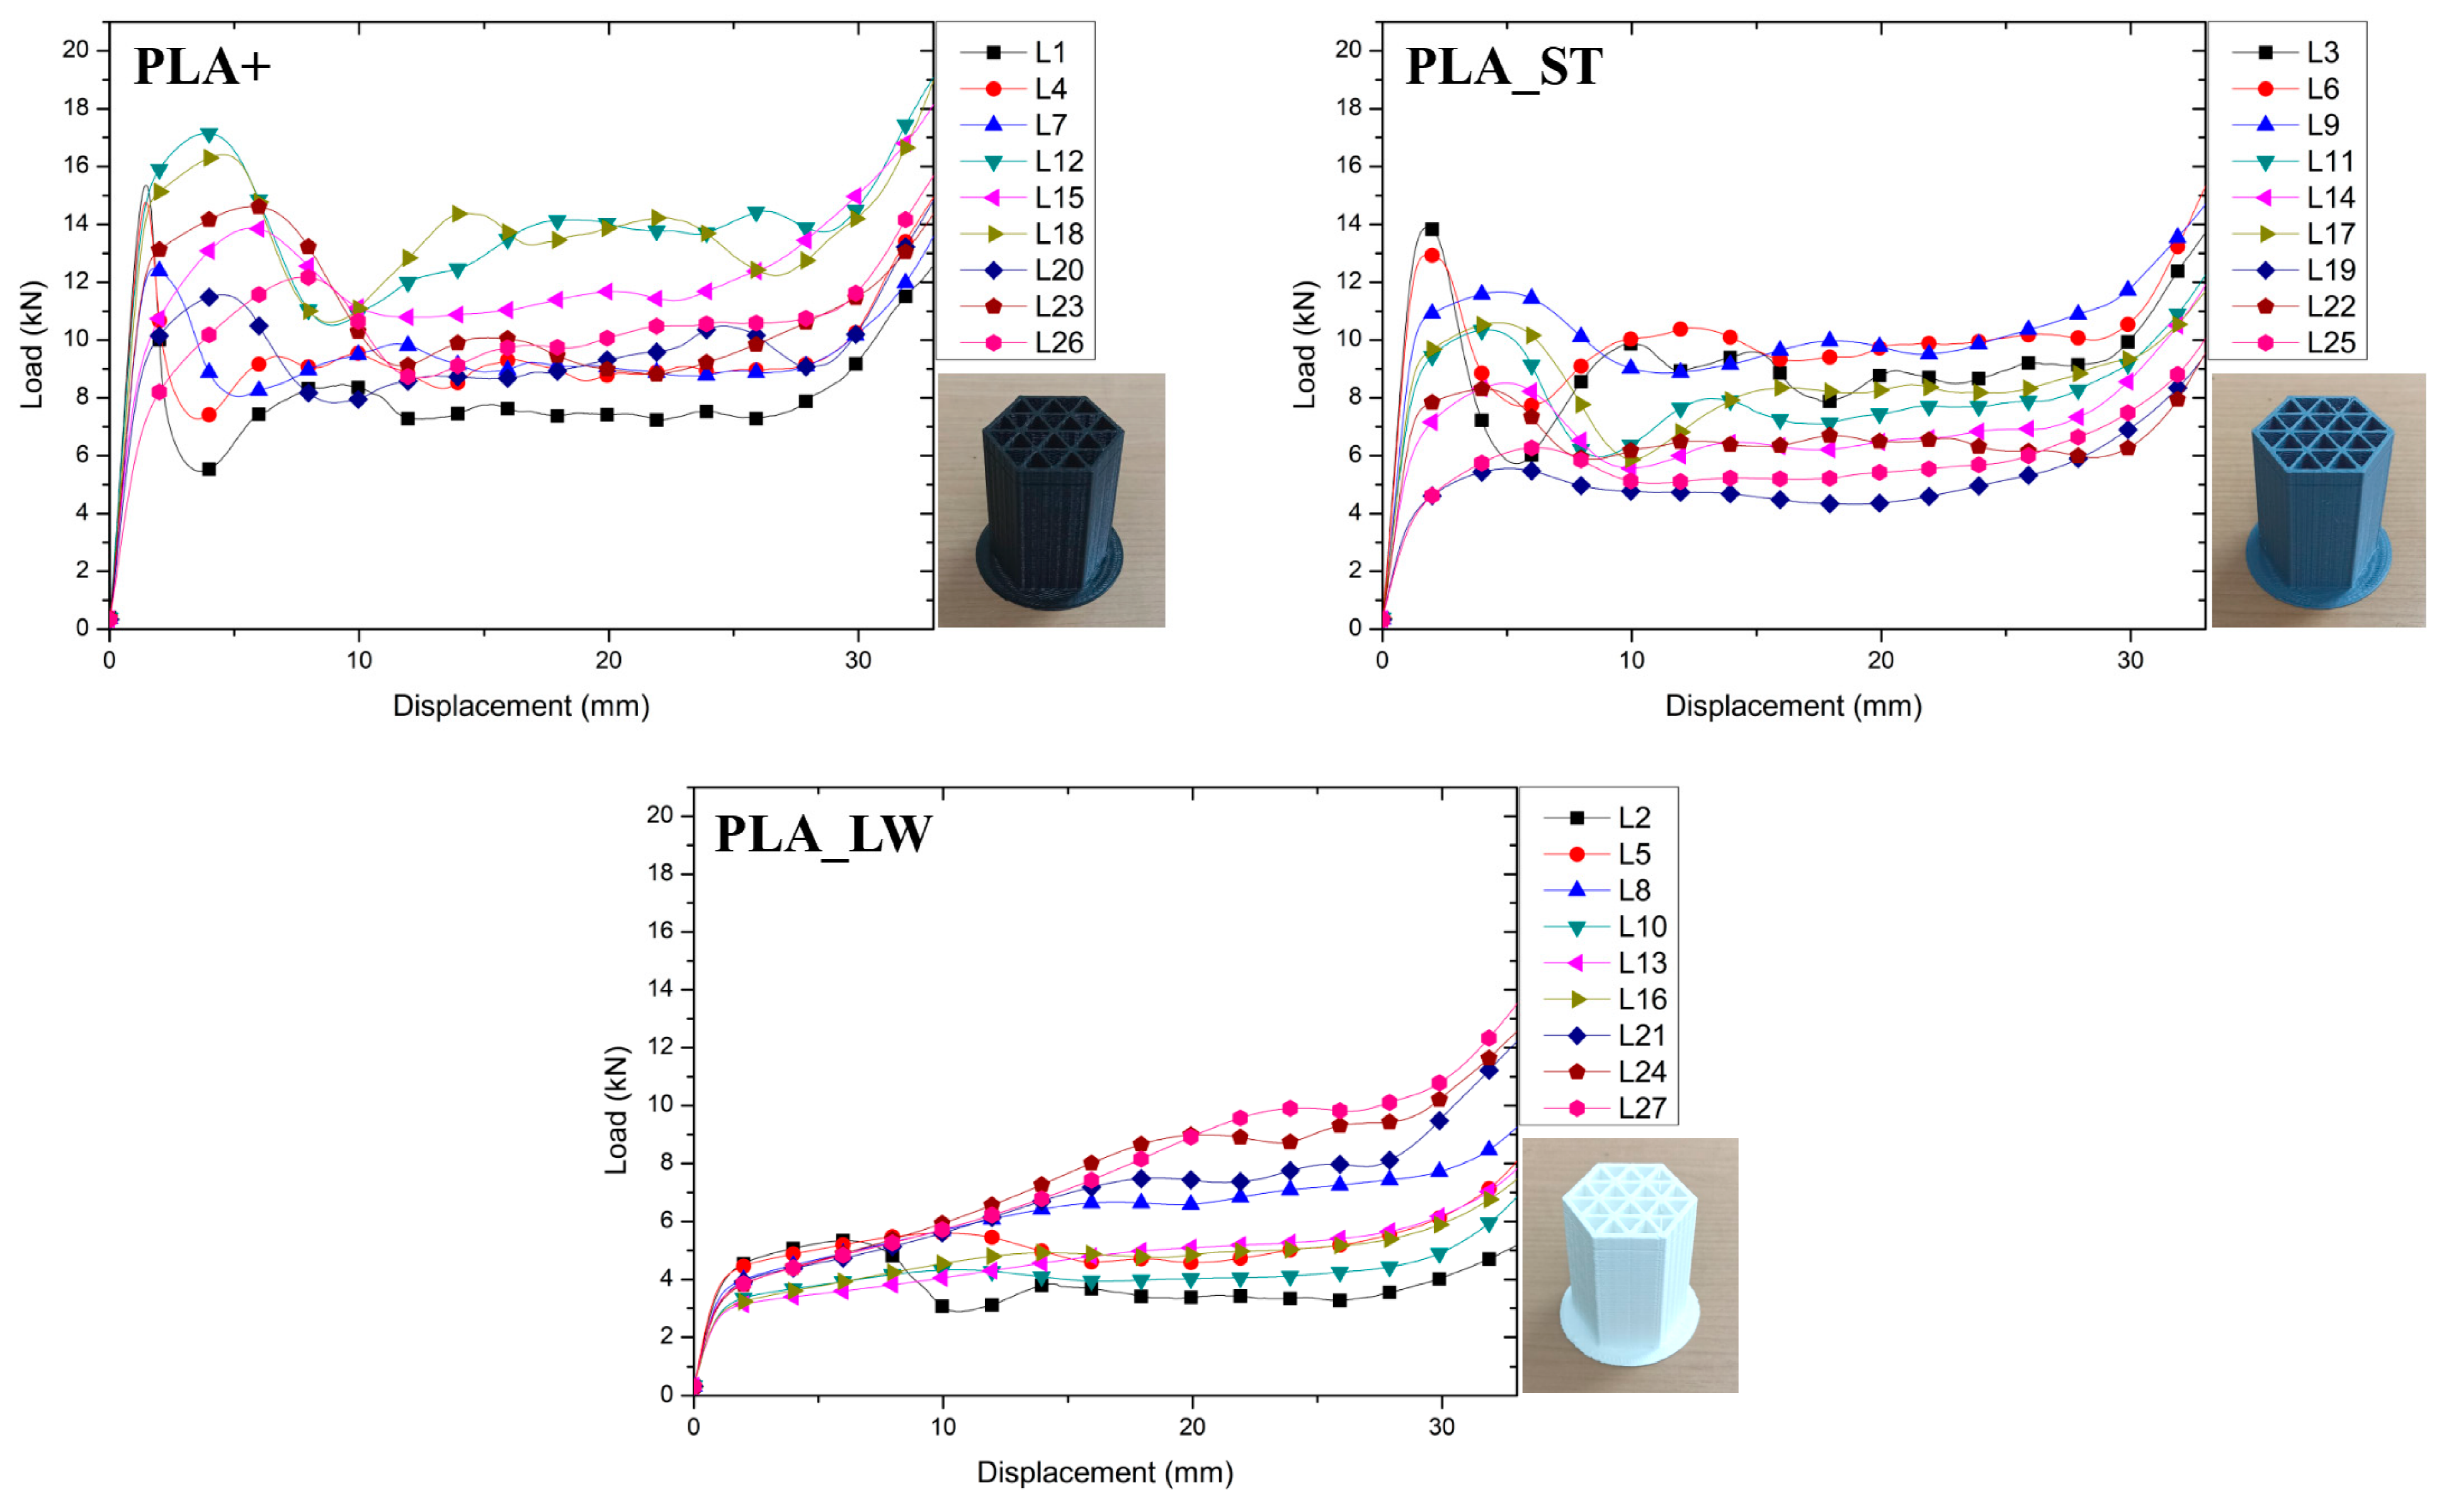
2.5. Crashworthiness Performance

There are several commonly employed criteria for evaluating crashworthiness, which include mean crushing force (MCF), initial peak crushing force (IPCF), crush force efficiency (CFE), energy absorption (Ea), and specific energy absorption (SEA) [35,36]. The mean crushing force (MCF) represents the average force exerted during the entire crushing process and can be mathematically expressed as:
MCF = 1 d 0 d F ( δ ) d δ
where F δ is the instantaneous crush force, and d is the collapse distance.
The crush force efficiency (CFE) measures the distribution of the crushing force and is determined by dividing the mean crushing force (MCF) by the initial peak crushing force (IPCF):
CFE = MCF IPCF
The energy absorption (Ea) refers to the overall amount of energy dissipated during the crushing process and can be mathematically defined as the integral of the force-displacement curve:
E a = 0 d F ( δ ) d δ
Specific energy absorption (SEA) is a measure of the energy absorbed per unit mass of the structure and is considered a critical indicator of the structure’s ability to absorb energy. It can be mathematically expressed as:
SEA = E a m

3. Results and Discussion

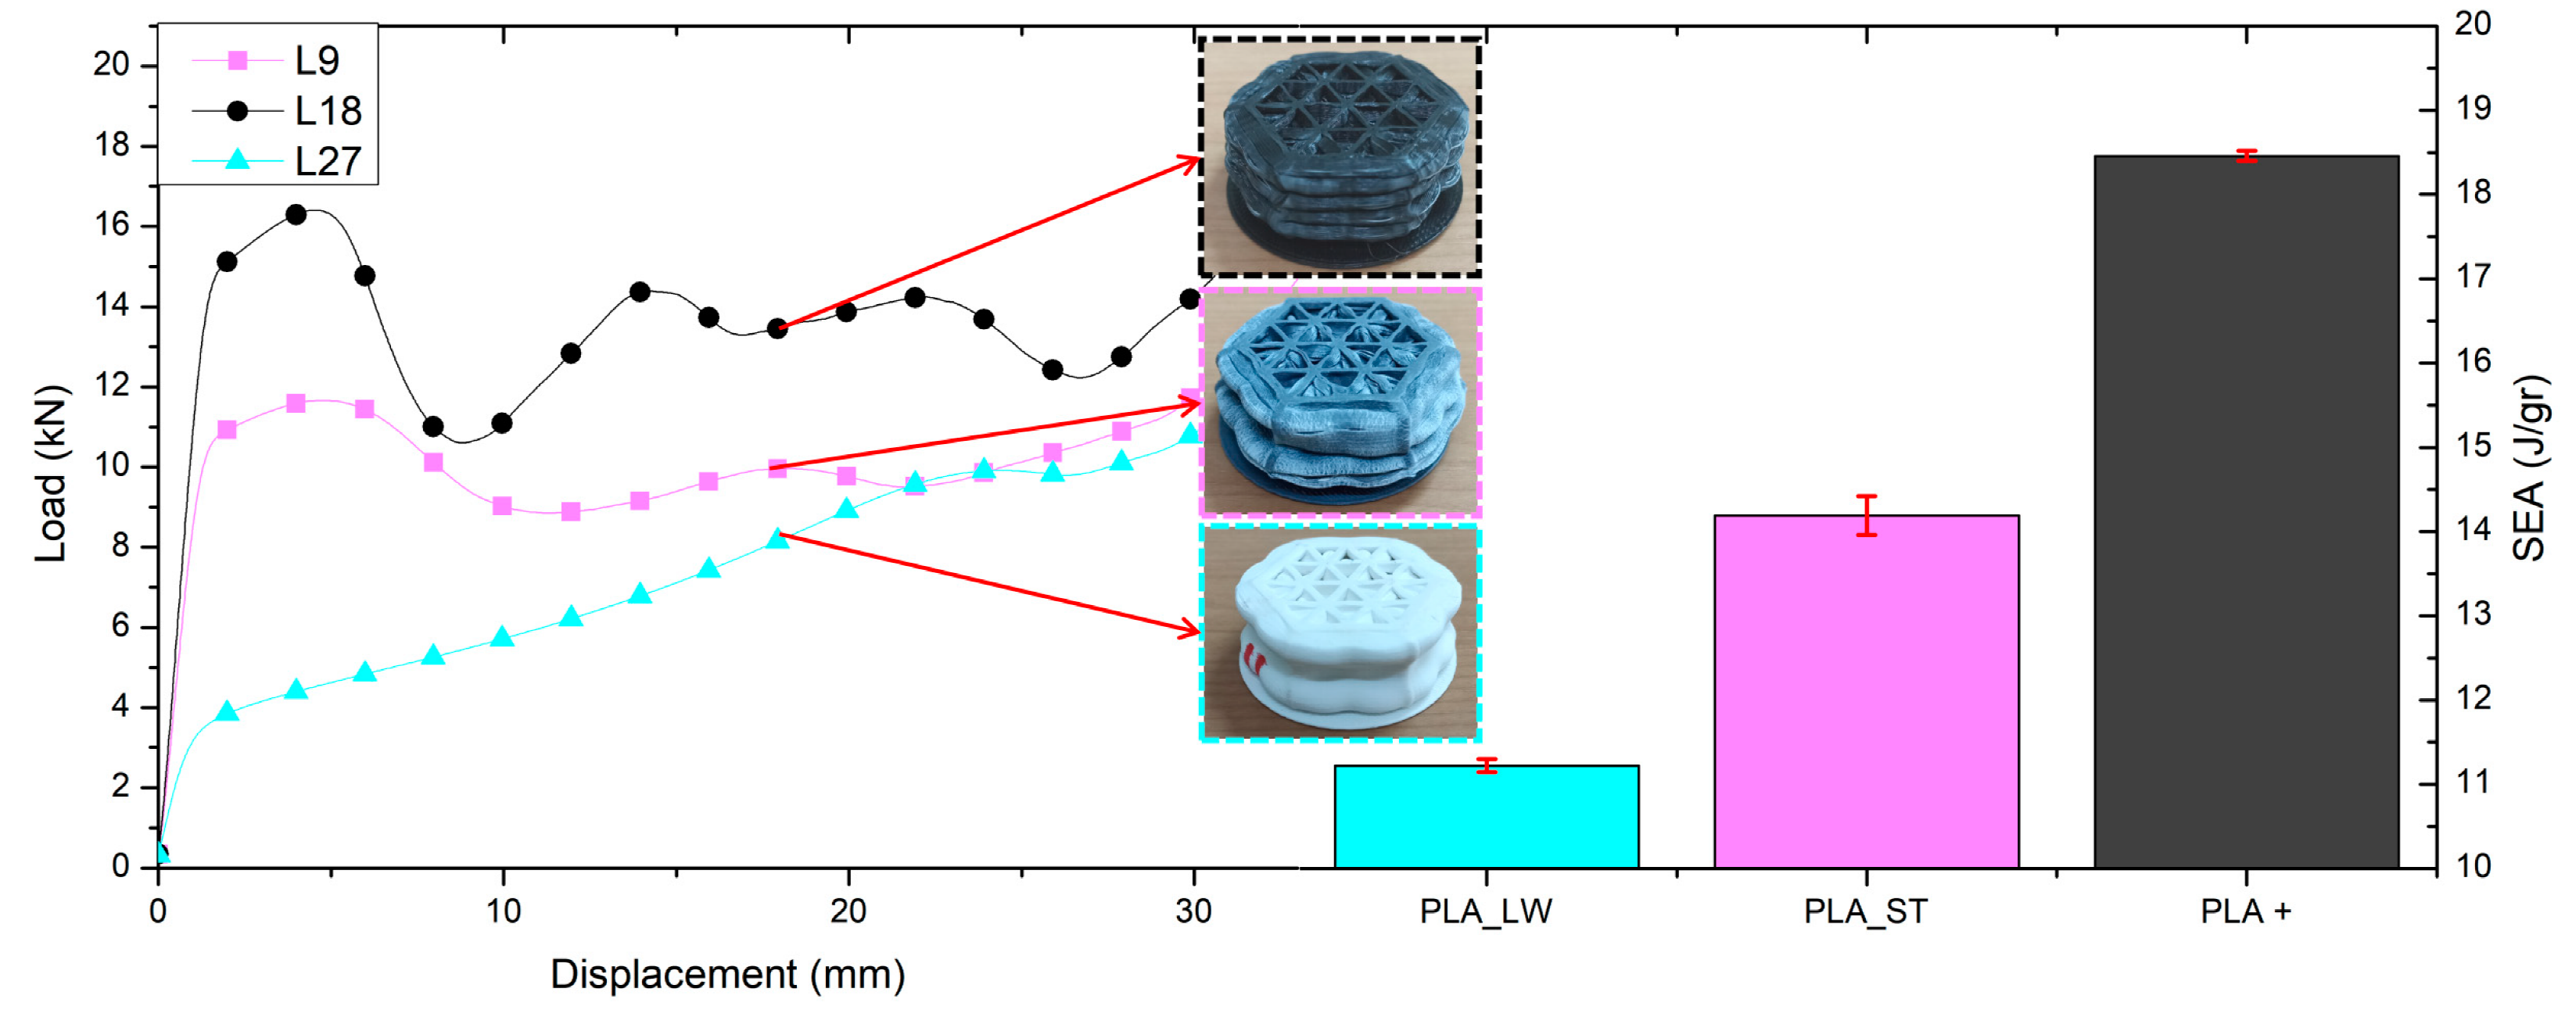
3.1. Mechanical Characterization of PLA Series

The tensile tests were conducted to determine the material property parameters of the PLA series specimens. These parameters, such as the elastic modulus, maximum tensile strength, and breakpoint strain, were obtained through uniaxial tension tests. The stress–strain curves of the PLA series is shown in Figure 3. Compared to PLA_ST and PLA_LW, PLA(+) has a larger elastic area, but the specimen fractures with less elongation, making the portion more brittle. The elongation areas of PLA_ST and PLA_LW are greater than those of PLA(+), which exhibits more plastic deformation and more ductile behavior.
As observed, the sample demonstrated linear elastic behavior until it underwent 31.48 MPa of stress for PLA(+), 6.96 MPa for PLA(LW), and 20.93 MPa for PLA(ST). Beyond this point, it entered a non-linear phase until it reached its maximum stress capacity. Subsequently, there was a stress reduction with increasing strain after the peak stress until failure. These results are consistent with the discoveries made by Agaliotis et al. [37] and Mahmoud M. Awd Allah et al. [38].
Table 3 displays the material properties of the PLA series. The results showed that the modulus of elasticity and tensile strength of PLA(+) was the highest among the other PLA series, namely 2.72 GPa and 31.48 MPa, respectively. Compared to the filament properties outlined in Table 1, the tensile strength of the PLA(LW) specimens exhibited a threefold reduction in the tensile strength values during the tensile testing, whereas in PLA(ST) the tensile strength only drops by 60% when compared to the tensile strength of the filament, and the PLA(+) tensile test specimen has a tensile strength of only half of the tensile strength of the filament. Based on Liao et al. [39], the decline in mechanical properties can be attributed to several factors, including increased porosity resulting from the printing process, void formation between printed layers and beads, and a reduction in molecular weight caused by extrusion and printing. PLA(LW) is more ductile than PLA(ST) and PLA(+) and can be categorized as a hyperelastic material [40].

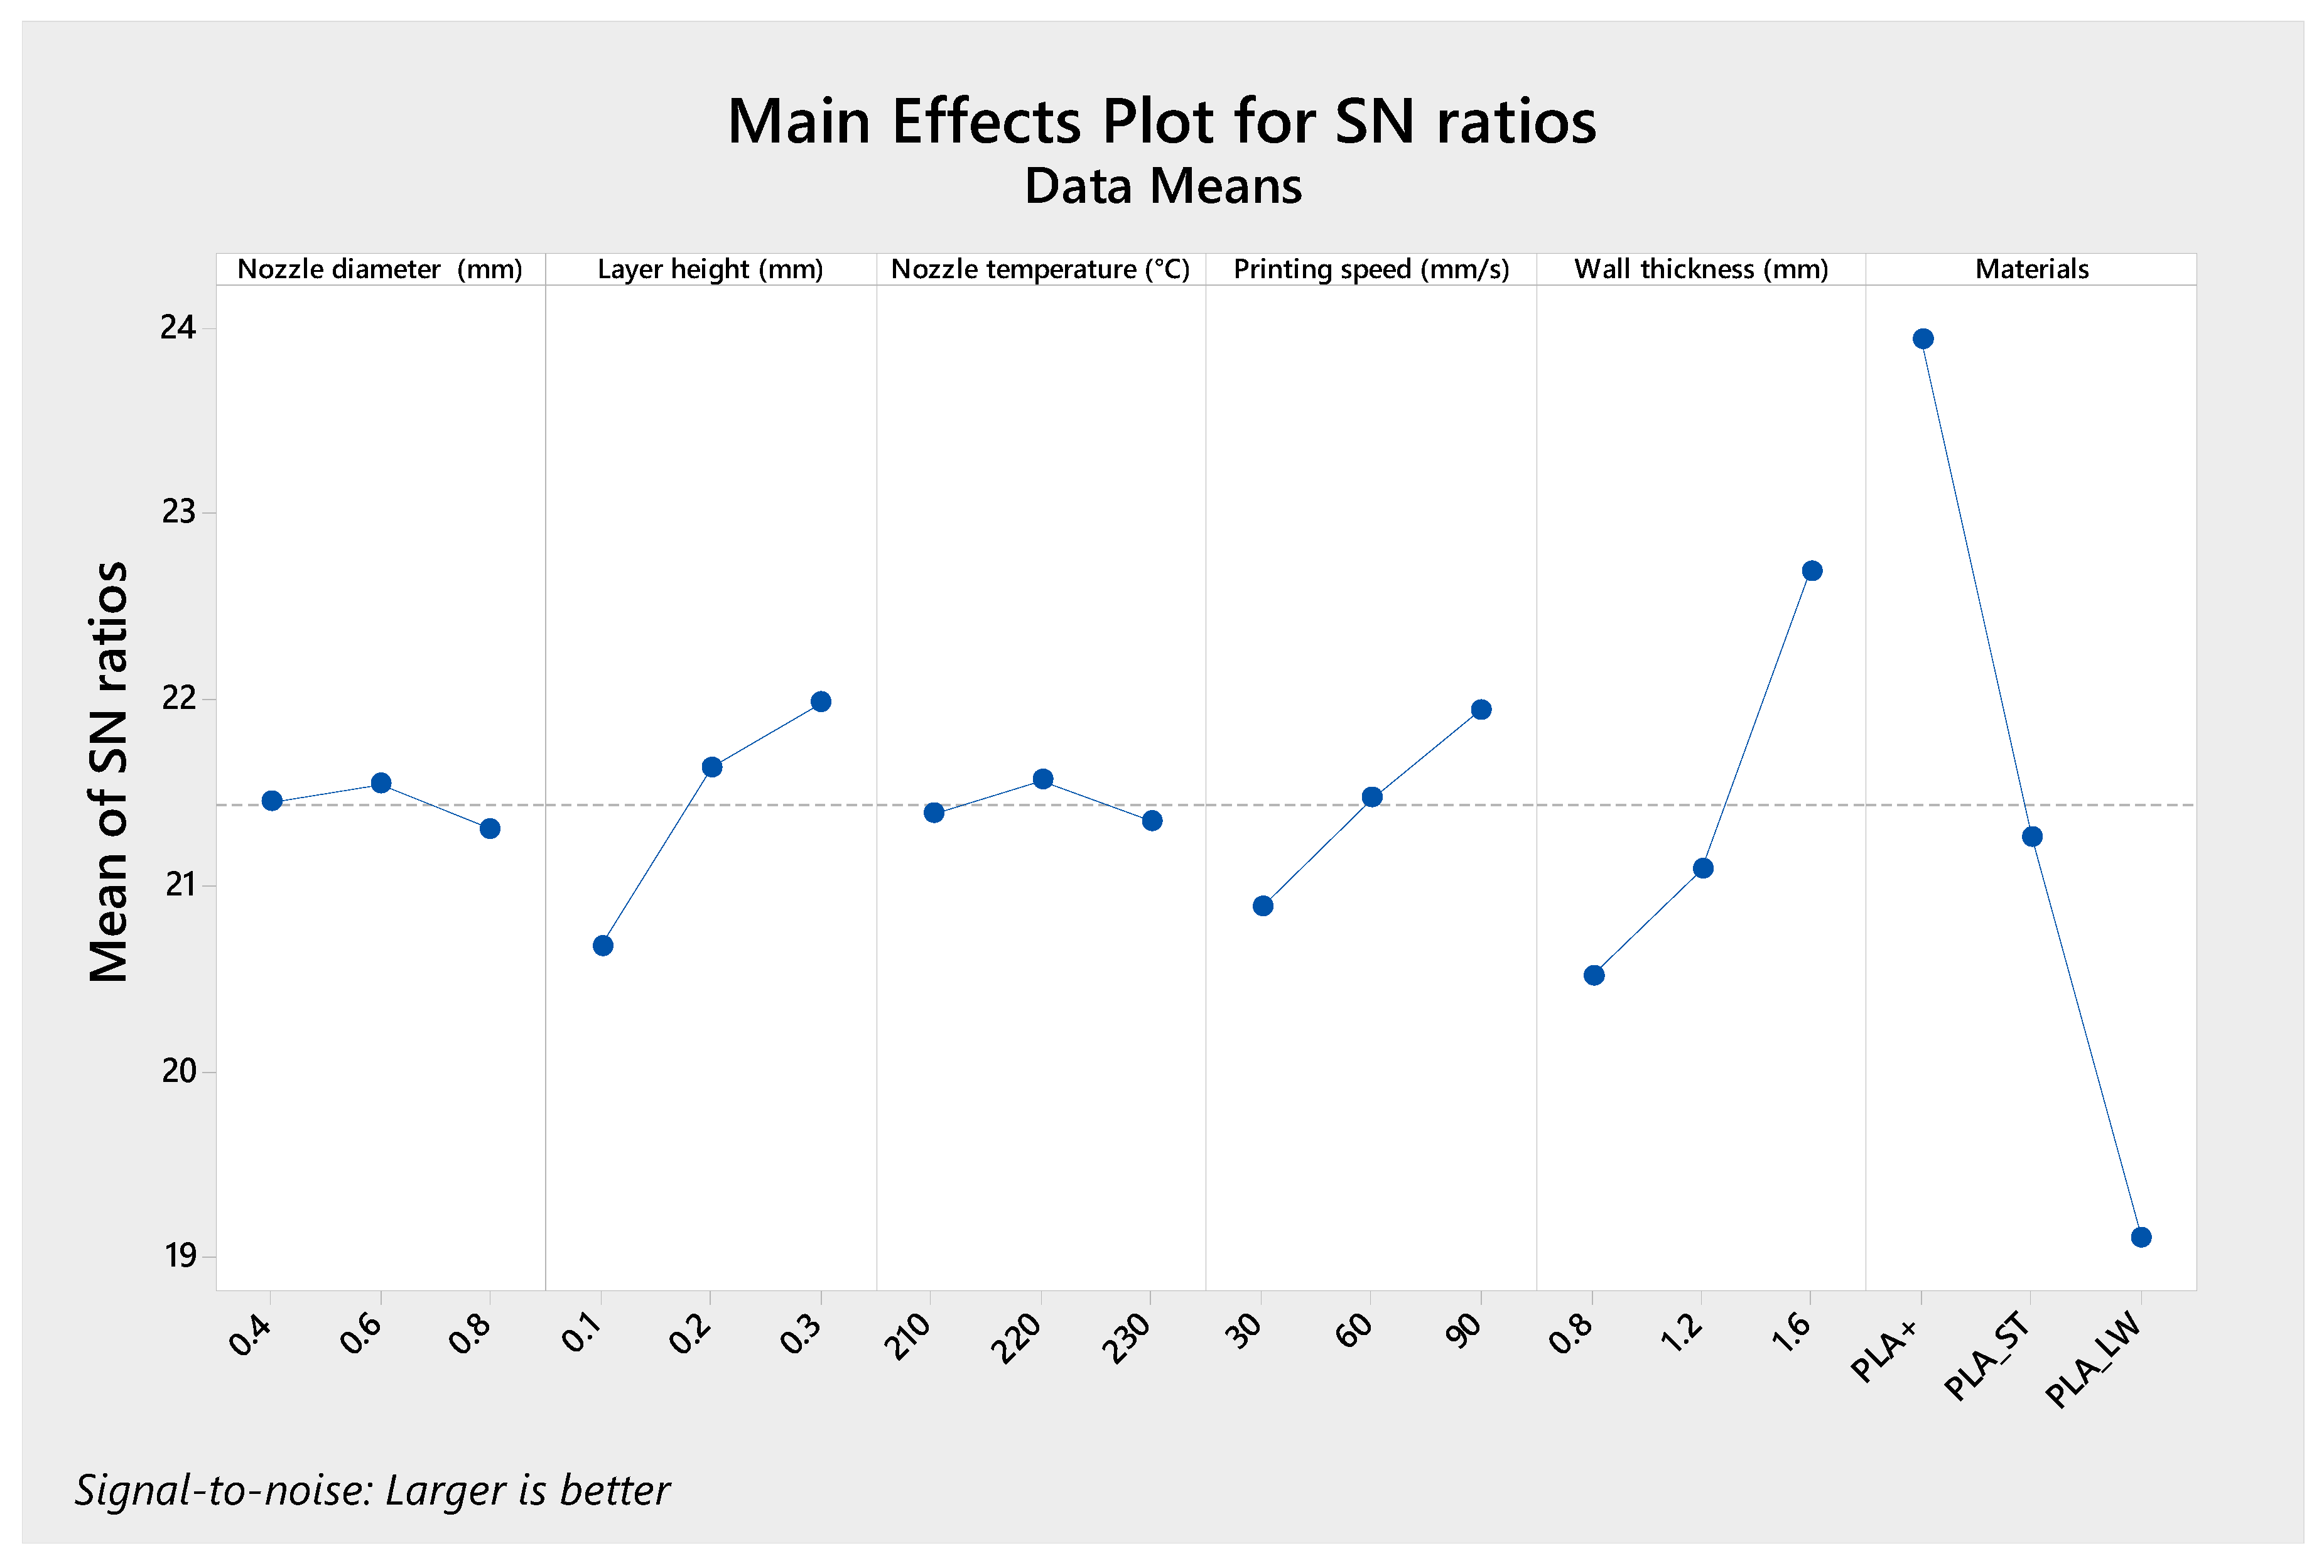
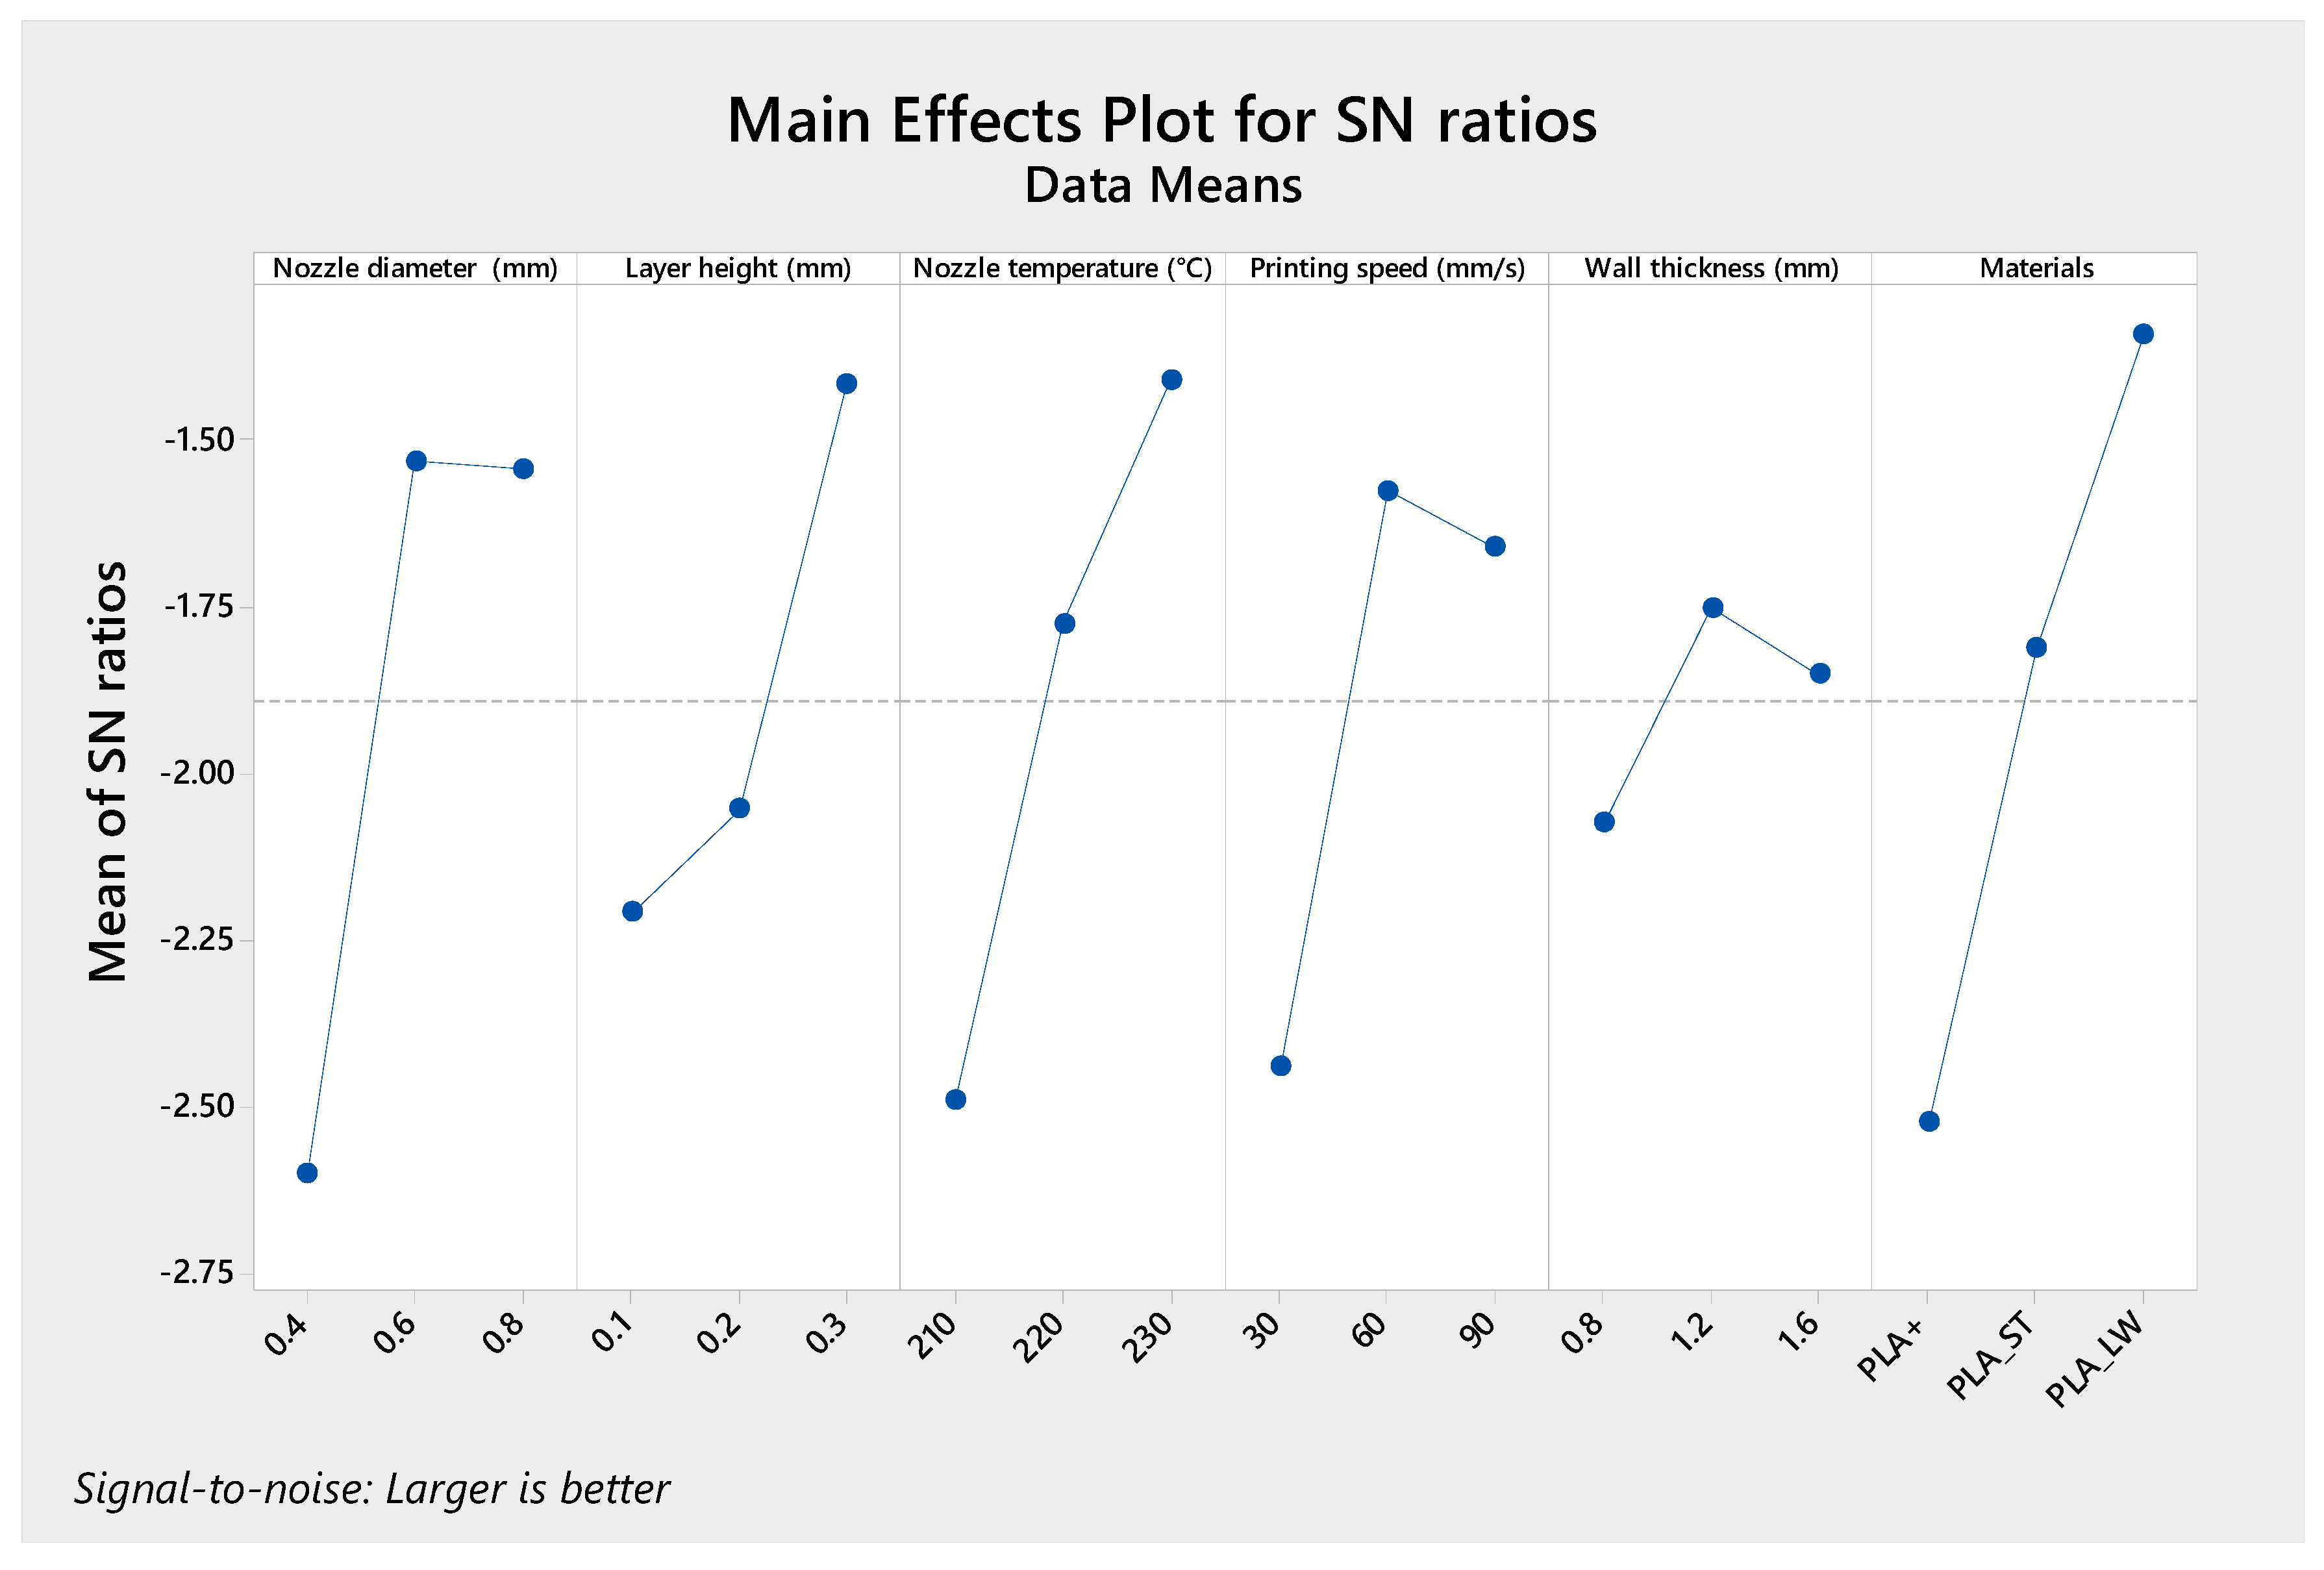
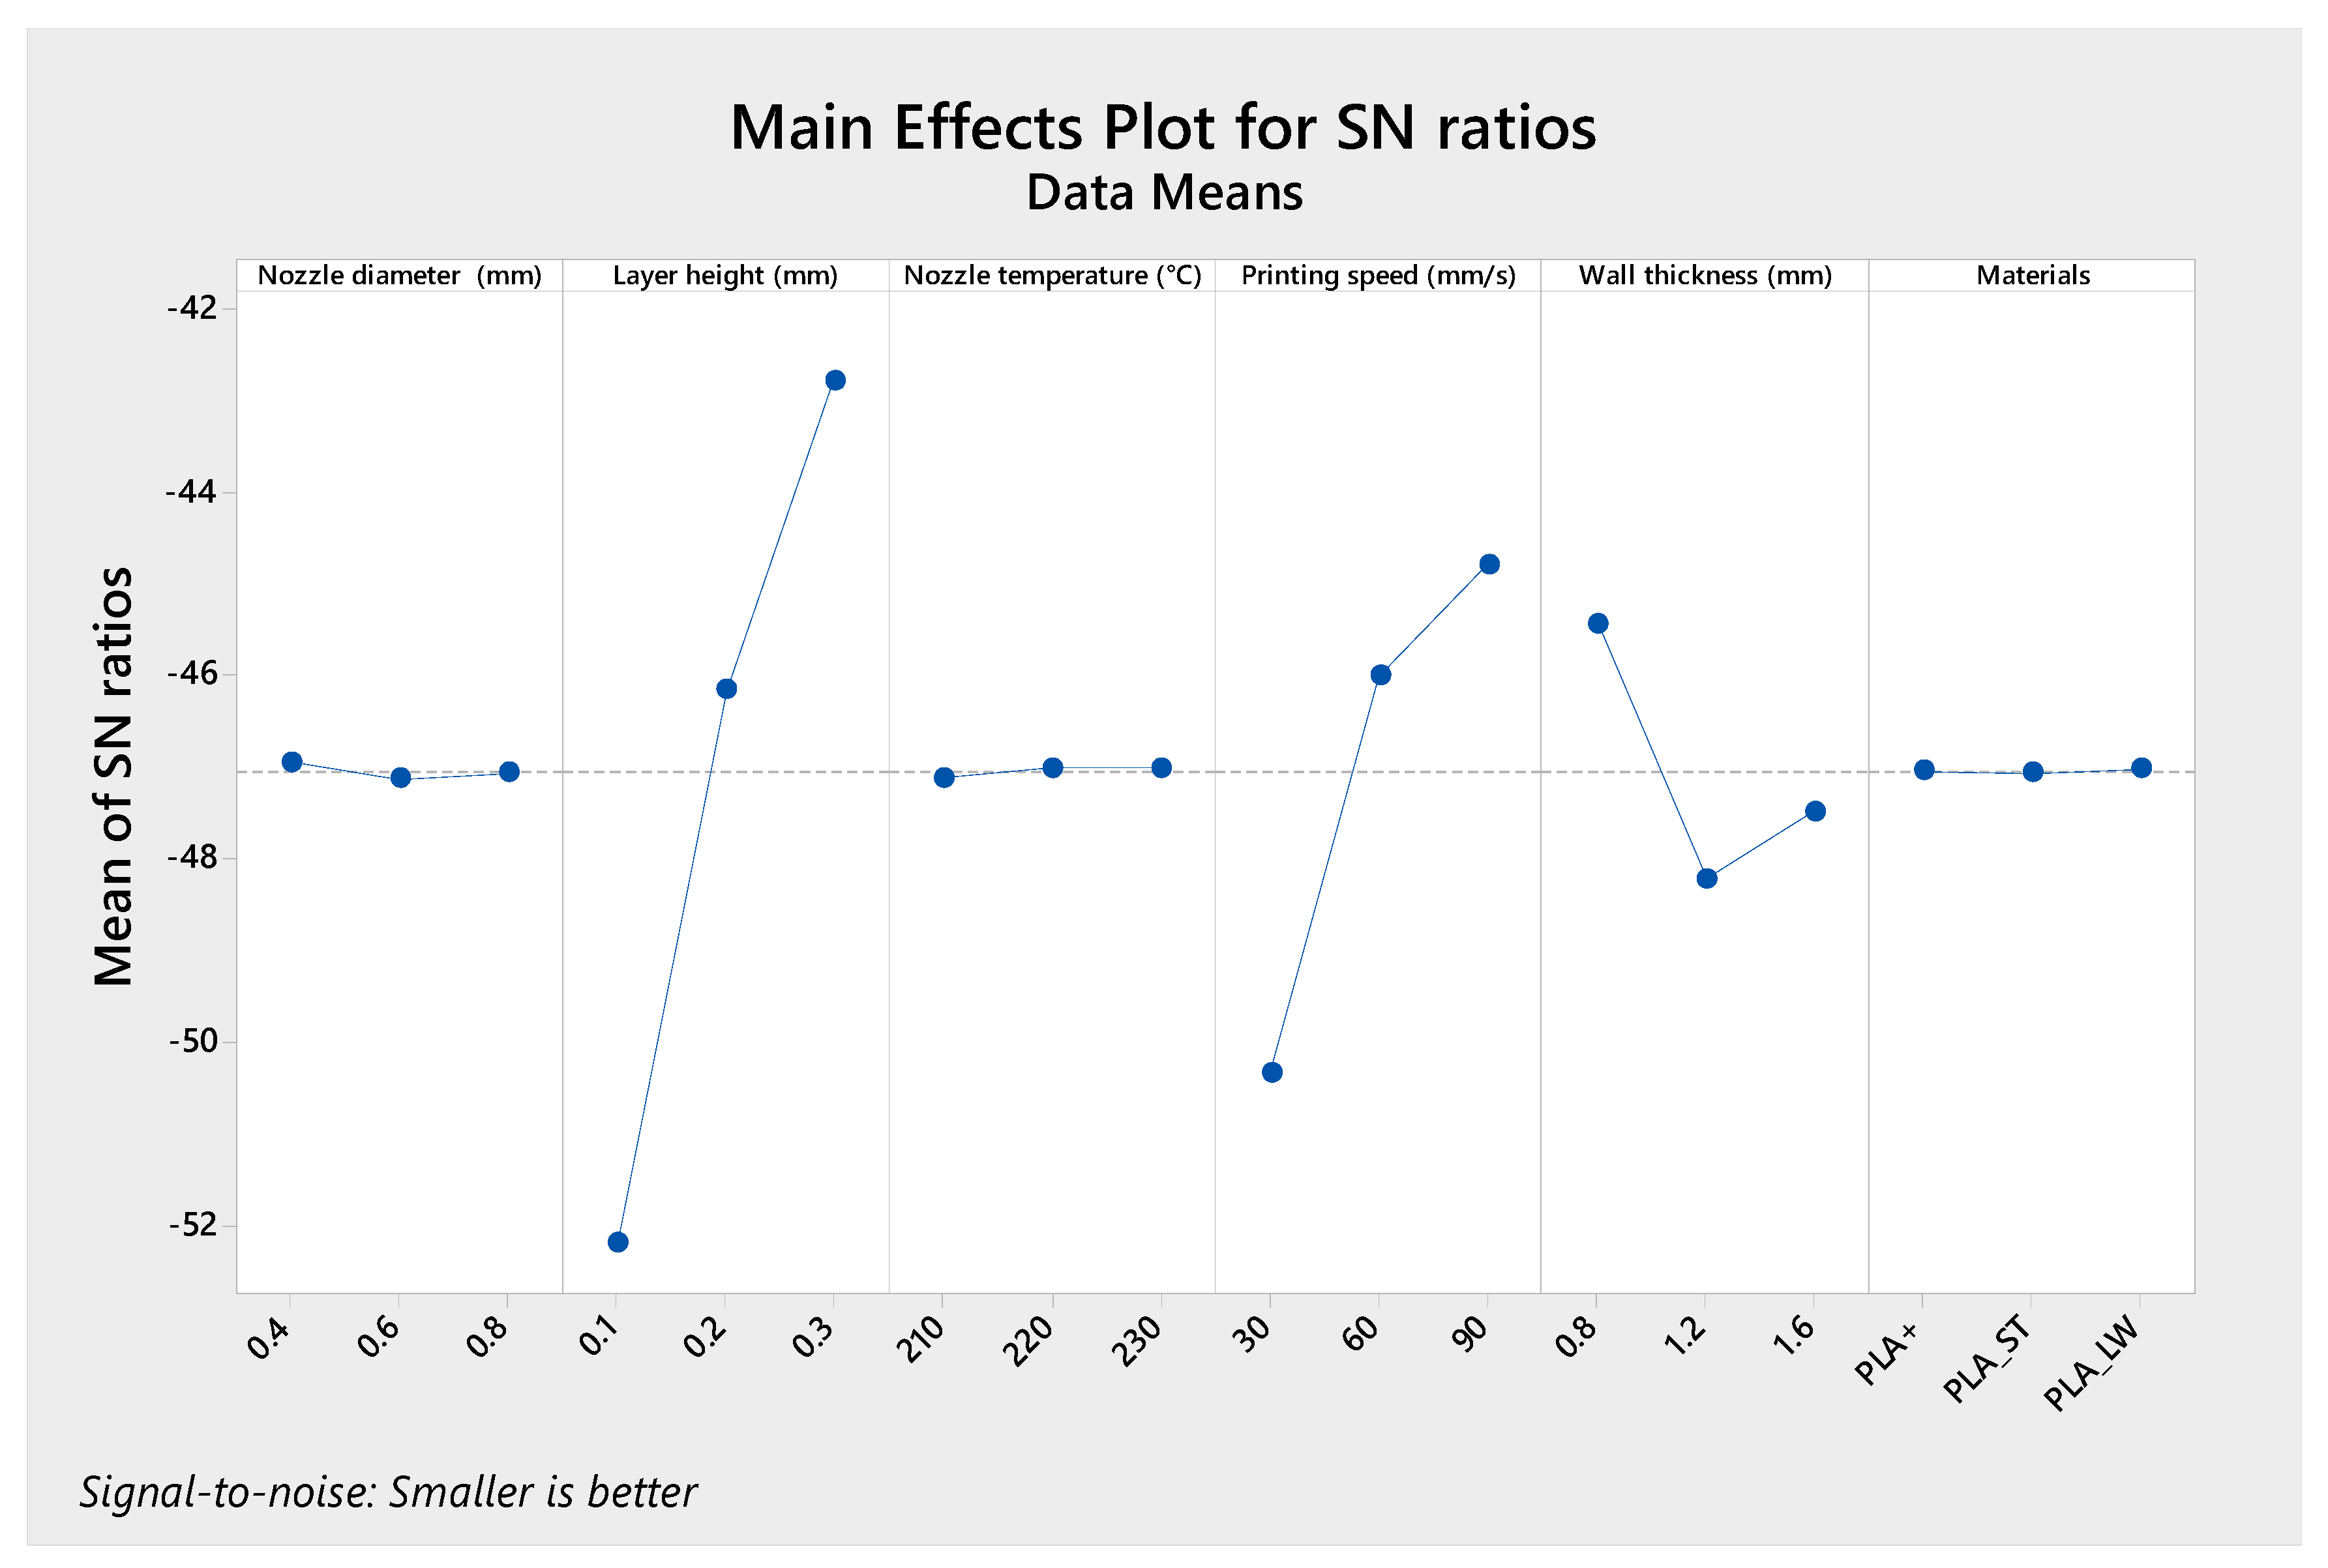
3.2. Analysis of S/N Ratio for Crashworthiness Performance

According to Taguchi’s classification, there are two types of factors: control factors and noise factors. Control factors are variables that can be set or adjusted by the designer, while noise factors are those that are difficult to control, such as environmental humidity and temperature [30]. In the Taguchi method, the goal is to create a robust system that is less affected by changes in noise factors. The signal-to-noise ratio (S/N ratio) is utilized to achieve this.
Figure 4 shows the experimental force-displacement curve of the 27 different printed condition hexagonal multi-cell tubes. Throughout the compression phase, hexagonal multi-cell tubes exhibited a consistent and uniform plastic deformation, leading to a regularly progressive collapse behavior across all configurations. Such behavior indicates a progressive mode, which was observed in all specimens, as well as the formation of large fragments on the walls of the L2 and L3 specimen tubes. The initial peak crushing force (IPCF) of all specimens appeared at displacements between 1 mm to 24 mm. The highest IPCF value of 17.15 kN was in specimen L12, while the lowest IPCF value was in the L10 specimen of 4.33 kN.
Table 4 displays the L27 orthogonal array and the output data for the hexagonal multi-cell tubes, including manufacturing time and crashworthiness parameters. The printed samples for the various experimental printing settings of the hexagonal multi-cell tube samples are numbered L1 to L27, as shown in Table 4. The highest CFE was 0.96, and the maximum SEA was 18.46 J/gr for L10 and L18, respectively. The minimum production time was 81 min for L7.
Figure 5 illustrates the crashworthiness characteristics (SEA and CFE) of hexagonal multi-cell tubes made from various materials, wall thicknesses, nozzle diameters, layer heights, nozzle temperatures, and printing speeds. Compared to PLA_ST and PLA_LW, multi-cell hexagonal tubes manufactured with PLA(+) exhibit a higher SEA value. This can be attributed to the fact that PLA(+) has greater tensile strength than PLA_ST and PLA_LW, as demonstrated by the tensile test results in Table 3. In contrast to PLA_ST and PLA_LW, PLA(+) demonstrates lower CFE values, which should be taken into consideration. This is due to the increased initial peak crushing force resulting from the higher strength of PLA(+).
Figure 6 presents the force-displacement curves that characterize the mechanical properties of hexagonal multi-cell structures. The IPCF is observed in PLA(+) at displacements ranging from 1 to 8 mm for all hexagonal multi-cell topologies, while in PLA_ST, IPCF is observed at displacements ranging from 2 to 6 mm. The IPCF value in a multi-cell hexagonal tube made of PLA(+) is influenced by the thickness of the tube. Thinner tubes tend to exhibit an earlier appearance of IPC with sharper peaks. On the other hand, the IPCF value in the hexagonal multi-cell tube made of PLA_ST is also affected by the tube’s thickness. However, unlike the PLA(+) hexagonal multi-cell tube, thicker tubes with high IPCF values show an earlier onset of IPCF and sharper peak responses. For PLA(LW), IPCF is observed at displacements ranging from 6 to 24 mm for all hexagonal multi-cell configurations. The characteristics of PLA(LW) material, known for its ductility and classification as hyperelastic, have a significant impact on the occurrence of peak forces in TWMCS. The resulting peak force tends to exhibit a sloping pattern, and in certain specimens, accurately determining the exact position of the peak force proves challenging. The geometry and material characteristics had a notable impact on both the magnitude of the peak load and the average load [41].
Crashworthy elements are primarily engineered to efficiently dissipate the highest level of impact energy. The specific mechanisms and progression of failure heavily rely on factors such as structural geometry, material, testing velocity, and triggers for failure initiation [38]. Illustrations of crushed tubes, possessing identical wall thickness but varying materials, are presented in Figure 7. The failure mode observed in PLA(+) and PLA(ST) involves the initiation of progressive folds at the upper end of the tubes, resulting in asymmetric deformation. This phenomenon consequently contributes to an enhancement in the overall crashworthiness capabilities. The failure mechanism observed in PLA(LW) is associated with a collapse occurring near the midpoint, accompanied by a type of catastrophic damage at the center of the tube, ultimately resulting in suboptimal performance.
According to the data presented in Table 3, it is evident that the tensile strength of PLA(+) exceeds that of PLA(LW) by 77.8%. Meanwhile, in the context of IPCF, the PLA(+) multi-cell tubes exhibit a 40% increment compared to PLA(LW) multi-cell tubes, as illustrated in Figure 7. The IPCF initiation for PLA(+) multi-cell tubes occurs at a 5 mm deflection, while PLA(LW) multi-cell tubes demonstrate IPCF initiation at a 24 mm deflection. The hyperelastic nature of PLA(LW) resulted in a reduction of the IPCF value and a delay in the initiation of IPCF in multi-cell tubes crafted from PLA(LW). While the tensile strength of PLA(ST) is 33.5% lower than that of PLA(+) (Table 3), it demonstrates greater ductility, as evident from Figure 3. The observed variation in IPCF values between multi-cell tubes constructed from PLA(+) and PLA(ST), as illustrated in Figure 7, is 29%.
The force-displacement curve of the multi-cell hexagonal tube with the greatest SEA value among the tested PLA series is depicted in Figure 7. Three folds are shown in the PLA(+) tube, each of which has three peaks on the force-displacement curve. The PLA(ST) tube, in comparison, only exhibits two folds, and the outer surface of the folds exhibits delamination. Only one fold forms in the PLA(LW) tubes. The highest SEA value of the TWMCS tube from the PLA(+) filament was 18.46 J/gr, while PLA(ST) and PLA(LW) were 23% and 39% lower than PLA(+), respectively.
Figure 8 shows the S/N ratio for the crashworthiness characteristics of hexagonal multi-cell tubes with effect on multi-parameters such as nozzle diameter, layer height, nozzle temperature, printing speed, wall thickness, and materials. The effect of nozzle diameter against SEA on an experimental result state that a higher S/N ratio (SEA) of 21.55 was observed when the hexagonal multi-cell tubes were manufactured at 0.6 mm nozzle diameter. The lowest value on the nozzle diameter of 0.8 mm is 21.31. From Table 5, it is known that the diameter of the nozzle does not significantly affect the SEA value of the multi-cell hexagonal tube made of PLA series filament. Nozzle diameter ranks fifth out of six parameters that affect the value of SEA.
The influence of the layer height on the SEA value result declares that a higher S/N ratio of 21.99 was observed when the tube was manufactured at 0.3 mm layer height. Layer height can influence the porosity of the printed part, with significant layer heights potentially resulting in higher porosity due to inadequate material flow. It was observed that an increase in layer height value leads to an increase in the specific energy absorption (SEA) value. This observation is supported by the findings of Huo et al. [42], who conducted tests demonstrating that porous materials exhibit high-impact energy absorption characteristics. The layer height also influences the quality of the printed surface. From the ultimakerCura application, the highest layer height value is 0.3 mm, if it is more than that, a warning appears.
Nozzle temperature is the last parameter that affects the SEA value, as shown in Table 5. The highest signal-to-noise ratio (SEA value) of 21.57 was noticed when the hexagonal multi-cell tubes were manufactured using a nozzle temperature of 220 °C, as shown in Figure 6. The PLA filament material undergoes consistent melting at a temperature of 220 °C, resulting in enhanced bonding between each layer of the material and the subsequent layer of the material. When exposed to temperatures below 220 °C, the filament may not sufficiently melt to achieve the desired viscosity, resulting in weak bonding between adjacent particles and layers [43].
Figure 8 depicts the effect of printing speed on the crashworthiness performance of hexagonal multi-cell tubes. According to the results of the experiment, manufacturing hexagonal tubes at a printing speed of 90 mm/s resulted in a higher S/N ratio (SEA) of 21.95. The porosity between the layers that make up the tube might rise when the print speed is 90 mm/s. The results from the study of Tsouknidas [22] demonstrate that porous samples tend to dissipate energy more efficiently since the infill density is practically proportionately correlated with the specimens’ ability to absorb energy.
The effect of the wall thickness on the SEA value result declares that a higher S/N ratio of 22.70 was noticed when the tube was manufactured at 1.6 mm wall thickness. The lowest value on the wall thickness of 0.8 mm is 20.52. From Table 5, it is known that the wall thickness significantly affects the SEA value of the multi-cell hexagonal tube made of the PLA series filament. Wall thickness ranks second out of six parameters that affect the value of SEA. The thicker the wall of the tube, the greater its ability to absorb energy. This correlation was also demonstrated by Tang et al. [3]. In their research, both energy absorption and SEA consistently increased with the wall thickness of the multi-cell tubes.
The effect of material against SEA on the experimental result shows that a higher S/N ratio (SEA) of 23.94 was observed when the hexagonal multi-cell tubes were manufactured utilizing PLA(+) filament. The lowest value on the material of PLA(LW) is 19.11.
Figure 9 depicts the influence of the multi-parameter effect on the CFE value of hexagonal multi-cell tubes made from PLA series utilizing the FDM. The optimal parameters were determined by choosing the highest signal-to-noise (S/N) ratio for each parameter, aiming to maximize the CFE value. The optimum parameter is 0.6 mm for nozzle diameter, 0.3 mm for layer height, 230 °C for nozzle temperature, 60 mm/s for printing speed, 1.2 mm for wall thickness, and utilizing PLA(LW) for the filament material. As shown in Table 5, the material, nozzle temperature, and nozzle diameter are the parameters that most influence the CFE value.
The influence of nozzle diameter against CFE on the experimental result shows that a higher S/N ratio of −1.53 was observed when the hexagonal multi-cell tubes were manufactured at 0.6 mm nozzle diameter. The lowest value on the nozzle diameter of 0.4 mm is −2.60. From Table 6, it is known that the diameter of the nozzle significantly affects the CFE value of the multi-cell hexagonal tube made of the PLA series filament. Nozzle diameter ranks third out of six parameters that affect the value of CFE.
The effect of the layer height on the CFE value result declares that a higher S/N ratio of −1.42 was observed when the tube was manufactured at 0.3 mm layer height. The lowest value on the layer height of 0.1 mm is −2.21. From Table 6, it is known that the layer height does not significantly affect the CFE value of the multi-cell hexagonal tube made of PLA series filament. Layer height ranks fifth out of six parameters that affect the value of CFE.
Nozzle temperature has the second largest effect on the CFE value, as shown in Table 6. The highest signal-to-noise ratio (CFE value) of −1.41 was noticed when the hexagonal multi-cell tubes were manufactured using a nozzle temperature of 230 °C, as shown in Figure 5. The PLA filament material undergoes consistent melting at a temperature of 230 °C, resulting in enhanced bonding between each layer of the material and the subsequent layer of the material. When exposed to temperatures below 220 °C, the filament may not sufficiently melt to achieve the desired viscosity, resulting in weak bonding between adjacent particles and layers [43].
The effect of a printing speed on the CFE value result declares that a higher S/N ratio of −1.58 was observed when the tube was manufactured at a printing speed of 60 mm/s. Printing speed ranks fourth out of six parameters that affect the value of CFE, as shown in Table 6.
The effect of wall thickness on the CFE value was investigated, revealing a higher S/N ratio of −1.75 for a tube with a wall thickness of 1.2 mm. Analysis from Table 6 indicates that wall thickness has no significant impact on the CFE value of the multi-cell hexagonal tube. However, it should be noted that wall thickness is the second parameter that affects the SEA value. The energy absorption capacity of the tube increases with the increase in the tube wall thickness but, as a consequence, the IPCF value also increases. A similar indication was detected by Hou et al. [4]; they conclude that an increase in the thickness of the multi-cell tube wall results in a corresponding increase in both the SEA and the IPCF experienced during crushing. An increase in the IPCF value is associated with a decrease in the CFE value.
Figure 10 depicts the influence of the multi-parameter effect on the manufacturing time of hexagonal multi-cell tubes made from PLA series utilizing the FDM. The optimal parameters were determined by choosing the highest signal-to-noise (S/N) ratio for each parameter, aiming to minimize manufacturing time. The optimum parameter is 0.4 mm for nozzle diameter, 0.3 mm for layer height, 220 °C for nozzle temperature, 90 mm/s for printing speed, and 0.8 mm for wall thickness. The type of PLA filament did not affect manufacturing time. Decreasing printing times generally has a positive impact on the overall cost [43]. As can be seen in Table 7, the layer height, printing speed, and wall thickness are the parameters that most influence manufacturing time.

3.3. Analysis of Variance

The investigation of variables, such as the kind of PLA filament, the wall thickness, and printing process parameters (layer height, printing speed, nozzle diameter, and nozzle temperature), was performed as part of the research on the crashworthiness characterization of hexagonal multi-cell tubes. The values of SEA, CFE and manufacturing time were significantly influenced by these variables.
As clarified in the ANOVA table (Table 8), the significant contributing parameters and their respective percentage contributions to the SEA value are as follows: material (73.70%), wall thickness (14.17%), layer height (4.16%), printing speed (3.42%), nozzle diameter (0.25%), and nozzle temperature (0.07%). On the contrary, with concern to CFE value, the parameters, such as the material of 17.5%, nozzle diameter of 11.88%, nozzle temperature of 13.49%, the printing speed of 6.58%, layer height of 6.68%, and the wall thickness, have a minor contribution of 0.13%. The error in accounting for parameters contributing to the CFE value amounts to 43.70%. This discrepancy can be attributed to the significant fluctuation of force caused by stress waves, resulting in a notable deviation in the measured peak forces. Consequently, this factor may have a particular impact on comparing CFE values among the specimens [44]. For manufacturing time, the only significant parameters are layer height (59.13%), printing speed (21.57%) and wall thickness (2.06%), while other parameters are only below 2%.

3.4. Regression Analysis

The experiment yielded results by differentiating multiple parameters, including the influence of printing parameters (nozzle diameter, layer height, nozzle temperature, and printing speed), dimensions (wall thickness), and filament material. These results were utilized to develop regression equations. A suitable mathematical model was constructed for each output response, such as SEA, CFE, and manufacturing time, considering the various input multi-parameters. In the General Linear Model, printing parameters (nozzle diameter, layer height, nozzle temperature, and printing speed) and dimensions (wall thickness) were treated as covariates, while the filament material was considered a factor. The factors and covariates were combined in the analysis using statistical software to build the equations.
Regression analysis was used to analyze the SEA, and Equation (7) presents the best fit for SEA.
SEA = Constant − 0.98 Nozzle diameter + 8.01 Layer height − 0.0102 Nozzle temperature + 0.02421 Printing speed + 3.696 Wall thickness
where the constant for PLA(LW), PLA(ST), and PLA(+) were 4.49, 7.04, and 11.17, respectively.
The regression analysis is employed for the CFE, and Equation (8) presents the best fit for CFE.
CFE = Constant + 0.2160 Nozzle diameter + 0.324 Layer height + 0.00460 Nozzle temperature + 0.001072 Printing speed + 0.0113 Wall thickness
where the constant for PLA(LW), PLA(ST), and PLA(+) were −0.424, −0.469, and −0.528, respectively.
The regression analysis is employed for the manufacturing time, and Equation (9) presents the best fit obtained for manufacturing time.
Manufacturing time = 1121 − 129.2 Nozzle diameter − 1408 Layer height − 1.86 Nozzle temperature − 2.835 Printing speed + 65.7 Wall thickness
The filament material does not affect the manufacturing time of the specimen. Therefore, the constants in the Equation remain the same

3.5. Experimental Verification of the Optimal Combinations

The acquired experiment findings clearly suggest an optimum combination for various output responses, including SEA and CFE values for hexagonal multi-cell structures. Table 9 displays the predicted and experimental outcomes for the hexagonal multi-cell tubes made under optimal circumstances. Figure 11 shows the force-displacement curve for the optimized printing combination of parameters for printing the thin-walled multi-cell structures.
To achieve optimal SEA and CFE, it is advisable to employ a layer height of 0.3 mm during the 3D-printing process. This choice of layer height significantly influences the resulting surface roughness of the printed tube. Nevertheless, it is important to note that the specific location of the energy absorption components, which are strategically placed in concealed areas devoid of direct visibility, obviates the necessity for post-processing treatments such as surface smoothing. The underlying rationale for this decision is rooted in the functional orientation of these components, where their operational efficacy, mechanical robustness, and energy-absorption capabilities remain paramount.
Figure 12 displays the comparative outcomes of the structures investigated in this research and other multi-cell hexagonal tubes documented in the literature. It is noteworthy that the majority of the multi-cell hexagonal tubes mentioned in the literature were constructed using aluminum and PACF (the short carbon fiber reinforced polyamide). The structures examined in this study showcased comparable SEA values to those of aluminum and PACF structures while demonstrating superior levels of CFE. This implies that the 3D-printed multi-cell tubes that are recommended have improved crashworthiness performance. Furthermore, the contemporary focus on energy absorption components crafted through 3D printing has heightened interest in numerical modeling [45]. A notable example is the work of Yousefi [46], demonstrating the FEM’s proficiency in faithfully reproducing key experimental findings with remarkable precision.

4. Conclusions

The effects of printing parameters (nozzle diameter, layer height, nozzle temperature, and printing speed), dimensions (wall thickness), and material of filament on the crashworthiness of 3D-printed TWMCS were investigated in a series of experiments designed using the Taguchi method. The results indicate that the optimum parameters for SEA are nozzle diameter (0.6 mm), layer height (0.3 mm), nozzle temperature (220 °C), printing speed 90 mm/s), wall thickness (1.6 mm), and material of filament (PLA(+)), with a maximum contribution of 73.70% for the material of filament, and a minimum contribution of 0.07% for nozzle temperature. The optimal parameters for CFE are nozzle diameter (0.8 mm), layer height (0.3 mm), nozzle temperature (230 °C), print speed (90 mm/s), wall thickness (1.6 mm), and filament material (PLA(ST)), with a maximum contribution of 17.53% for filament material, and a minimum contribution of 0.13% for wall thickness. The main parameters for manufacturing time are only affected by layer height (0.3 mm), printing speed (90 mm/s), and wall thickness (0.8 mm), with a maximum contribution of 59.13% for layer height, 21.57% for printing speed and 2.06% for wall thickness.
This research provides new opportunities for the optimization of lightweight structures with greater energy absorption capacities, which will enhance passenger safety and make transportation systems safer by clarifying the fundamental elements determining the crashworthiness of thin-walled multi-cell PLA 3D-printed tubes. Although numerous facets have been examined in this study, there is a potential for further research to enhance the widespread implementation of the additive manufacturing technique. Exploring the utilization of mechanical joints and adhesives for joining 3D-printed materials based on Fused Deposition Modeling (FDM) also presents an intriguing area for investigation.

Author Contributions

Conceptualization, D.H., J.I. and D.A.S.; methodology, J.I., D.H. and D.A.S.; validation, J.I., F.K. and D.A.S.; formal analysis, D.H., J.I., F.A.W., R.A. and A.N.; investigation, R.A., F.A.W., D.H. and A.N.; writing—original draft preparation, D.H.; writing—review and editing, D.H., J.I. and F.K.; visualization, D.H.; supervision, J.I. and F.K. All authors have read and agreed to the published version of the manuscript.

Funding

This research is funded by the Directorate of Research and Development, Universitas Indonesia under Hibah PUTI 2022 (Grant No. NKB-335/UN2.RST/HKP.05.00/2022).

Data Availability Statement

The data presented in this study are available on request from the corresponding author.

Acknowledgments

The authors thank the facilities and technical support from Aeronautics Laboratories Rumpin, National Research and Innovation Agency through E-Layanan Sains-BRIN.

Conflicts of Interest

The authors declare no conflict of interest.

References

  1. Palomba, G.; Epasto, G.; Crupi, V. Lightweight sandwich structures for marine applications: A review. Mech. Adv. Mater. Struct. 2022, 29, 4839–4864. [Google Scholar]
  2. Mou, H.; Xie, J.; Feng, Z. Research status and future development of crashworthiness of civil aircraft fuselage structures: An overview. Prog. Aerosp. Sci. 2020, 119, 100644. [Google Scholar]
  3. Tang, Z.; Liu, S.; Zhang, Z. Analysis of energy absorption characteristics of cylindrical multi-cell columns. Thin-Walled Struct. 2013, 62, 75–84. [Google Scholar]
  4. Hou, S.; Li, Q.; Long, S.; Yang, X.; Li, W. Multiobjective optimization of multi-cell sections for the crashworthiness design. Int. J. Impact Eng. 2008, 35, 1355–1367. [Google Scholar]
  5. Qiu, N.; Gao, Y.; Fang, J.; Feng, Z.; Sun, G.; Li, Q. Crashworthiness analysis and design of multi-cell hexagonal columns under multiple loading cases. Finite Elem. Anal. Des. 2015, 104, 89–101. [Google Scholar]
  6. Zhang, X.; Cheng, G. A comparative study of energy absorption characteristics of foam-filled and multi-cell square columns. Int. J. Impact Eng. 2007, 34, 1739–1752. [Google Scholar]
  7. Sun, G.; Liu, T.; Huang, X.; Zheng, G.; Li, Q. Topological configuration analysis and design for foam filled multi-cell tubes. Eng. Struct. 2018, 155, 235–250. [Google Scholar]
  8. Sathies, T.; Senthil, P.; Anoop, M. A review on advancements in applications of fused deposition modelling process. Rapid Prototyp. J. 2020, 26, 669–687. [Google Scholar]
  9. Mohammadi, M.; Kouzani, A.Z.; Bodaghi, M.; Xiang, Y.; Zolfagharian, A. 3D-Printed Phase-Change Artificial Muscles with Autonomous Vibration Control. Adv. Mater. Technol. 2023, 2300199. [Google Scholar] [CrossRef]
  10. Meram, A.; Sözen, B. Experimental investigation on the effect of printing parameters on the impact response of thin-walled tubes produced by additive manufacturing method. Int. J. Crashworth. 2022, 28, 32–45. [Google Scholar]
  11. Zeenat, L.; Zolfagharian, A.; Sriya, Y.; Sasikumar, S.; Bodaghi, M.; Pati, F. 4D Printing for Vascular Tissue Engineering: Progress and Challenges. Adv. Mater. Technol. 2023, 2300200. [Google Scholar] [CrossRef]
  12. Gupta, B.; Revagade, N.; Hilborn, J. Poly (lactic acid) fiber: An overview. Prog. Polym. Sci. 2007, 32, 455–482. [Google Scholar]
  13. Wittbrodt, B.; Pearce, J.M. The effects of PLA color on material properties of 3-D printed components. Addit. Manuf. 2015, 8, 110–116. [Google Scholar]
  14. Lokesh, N.; Praveena, B.; Reddy, J.S.; Vasu, V.K.; Vijaykumar, S. Evaluation on effect of printing process parameter through Taguchi approach on mechanical properties of 3D printed PLA specimens using FDM at constant printing temperature. Mater. Today: Proc. 2022, 52, 1288–1293. [Google Scholar]
  15. Isaac, C.W.; Duddeck, F. Current trends in additively manufactured (3D printed) energy absorbing structures for crashworthiness application—A review. Virtual Phys. Prototyp. 2022, 17, 1058–1101. [Google Scholar]
  16. Hidayat, D.; Istiyanto, J.; Nabilah, J.D.; Ardiansyah, R.; Saptari, S.A.; Kurniawan, F.; Sumarsono, D.A. Experimental investigation on axial quasi-static crushing of Al/PLA hybrid tubes. In Proceedings of the 2022 International Conference on Mechanical, Aerospace and Automotive Engineering, Beijing, China, 2–4 December 2023; 2023. [Google Scholar]
  17. Fu, X.; Zhang, X.; Huang, Z. Axial crushing of Nylon and Al/Nylon hybrid tubes by FDM 3D printing. Compos. Struct. 2021, 256, 113055. [Google Scholar]
  18. Wang, J.; Xiang, J.; Lin, H.; Wang, K.; Yao, S.; Peng, Y.; Rao, Y. Effects of scanning strategy and printing temperature on the compressive behaviors of 3D printed polyamide-based composites. Polymers 2020, 12, 1783. [Google Scholar]
  19. Nian, Y.; Wan, S.; Li, M.; Su, Q. Crashworthiness design of self-similar graded honeycomb-filled composite circular structures. Constr. Build. Mater. 2020, 233, 117344. [Google Scholar]
  20. Liu, Y.; Wang, J.; Cai, R.; Xiang, J.; Wang, K.; Yao, S.; Peng, Y. Effects of loading rate and temperature on crushing behaviors of 3D printed multi-cell composite tubes. Thin-Walled Struct. 2023, 182, 110311. [Google Scholar]
  21. Wang, K.; Liu, Y.; Wang, J.; Xiang, J.; Yao, S.; Peng, Y. On crashworthiness behaviors of 3D printed multi-cell filled thin-walled structures. Eng. Struct. 2022, 254, 113907. [Google Scholar]
  22. Tsouknidas, A.; Pantazopoulos, M.; Katsoulis, I.; Fasnakis, D.; Maropoulos, S.; Michailidis, N. Impact absorption capacity of 3D-printed components fabricated by fused deposition modelling. Mater. Des. 2016, 102, 41–44. [Google Scholar] [CrossRef]
  23. Nugroho, A.; Ardiansyah, R.; Rusita, L.; Larasati, I.L. Effect of layer thickness on flexural properties of PLA (PolyLactid Acid) by 3D printing. In Journal of Physics: Conference Series; IOP Publishing: Bristol, UK, 2018. [Google Scholar]
  24. Harpool, T.D. Observing the Effect of Infill Shapes on the Tensile Characteristics of 3D Printed Plastic Parts. Master’s Thesis, Wichita State University, Wichita, KS, USA, 2016. [Google Scholar]
  25. Qattawi, A.; Alrawi, B.; Guzman, A. Experimental optimization of fused deposition modelling processing parameters: A design-for-manufacturing approach. Procedia Manuf. 2017, 10, 791–803. [Google Scholar]
  26. Hikmat, M.; Rostam, S.; Ahmed, Y.M. Investigation of tensile property-based Taguchi method of PLA parts fabricated by FDM 3D printing technology. Results Eng. 2021, 11, 100264. [Google Scholar] [CrossRef]
  27. Shenzhen Esun Industrial Co., Ltd. 2023. Available online: https://www.esun3d.com/ (accessed on 7 February 2023).
  28. Wang, Z.; Zhang, J.; Li, Z.; Shi, C. On the crashworthiness of bio-inspired hexagonal prismatic tubes under axial compression. Int. J. Mech. Sci. 2020, 186, 105893. [Google Scholar] [CrossRef]
  29. Yang, Z.; Yu, Y.; Wei, Y.; Huang, C. Crushing behavior of a thin-walled circular tube with internal gradient grooves fabricated by SLM 3D printing. Thin-Walled Struct. 2017, 111, 1–8. [Google Scholar] [CrossRef]
  30. Taguchi, G.; Phadke, M.S. Quality Engineering through Design Optimization. Quality Control, Robust Design, and the Taguchi Method; Springer: Boston, MA, USA, 1989; pp. 77–96. [Google Scholar]
  31. De Bruijn, A.C.; Gómez-Gras, G.; Fernández-Ruano, L.; Farràs-Tasias, L.; Pérez, M.A. Optimization of a combined thermal annealing and isostatic pressing process for mechanical and surface enhancement of Ultem FDM parts using Doehlert experimental designs. J. Manuf. Process. 2023, 85, 1096–1115. [Google Scholar] [CrossRef]
  32. ASTM D638-14; Standard Test Method for Tensile Properties of Plastics. ASTM: West Conshohocken, PA, USA, 2014.
  33. Sun, G.; Li, S.; Liu, Q.; Li, G.; Li, Q. Experimental study on crashworthiness of empty/aluminum foam/honeycomb-filled CFRP tubes. Compos. Struct. 2016, 152, 969–993. [Google Scholar] [CrossRef]
  34. Hidayat, D.; Nurrohmad, A.; Nugroho, A.; Isna, L.R. Experimental investigation on crashworthiness characteristics of e-glass–lycal composite tube and local product aluminum tube using quasi-static crushing test. In AIP Conference Proceedings; AIP Publishing LLC: Melville, NY, USA, 2020. [Google Scholar]
  35. Zhu, G.; Liao, J.; Sun, G.; Li, Q. Comparative study on metal/CFRP hybrid structures under static and dynamic loading. Int. J. Impact Eng. 2020, 141, 103509. [Google Scholar] [CrossRef]
  36. Yao, R.; Pang, T.; Zhang, B.; Fang, J.; Li, Q.; Sun, G. On the crashworthiness of thin-walled multi-cell structures and materials: State of the art and prospects. Thin-Walled Struct. 2023, 189, 110734. [Google Scholar] [CrossRef]
  37. Agaliotis, E.M.; Ake-Concha, B.D.; May-Pat, A.; Morales-Arias, J.P.; Bernal, C.; Valadez-Gonzalez, A.; Herrera-Franco, P.J.; Proust, G.; Koh-Dzul, J.F.; Carrillo, J.G.; et al. Tensile Behavior of 3D Printed Polylactic Acid (PLA) Based Composites Reinforced with Natural Fiber. Polymers 2022, 14, 3976. [Google Scholar] [CrossRef]
  38. MAwd Allah, M.; Abdel-Aziem, W.; AAbd El-baky, M. Collapse Behavior and Energy Absorbing Characteristics of 3D-Printed Tubes with Different Infill Pattern Structures: An Experimental Study. Fibers Polym. 2023, 24, 2609–2622. [Google Scholar] [CrossRef]
  39. Liao, Y.; Liu, C.; Coppola, B.; Barra, G.; Di Maio, L.; Incarnato, L.; Lafdi, K. Effect of porosity and crystallinity on 3D printed PLA properties. Polymers 2019, 11, 1487. [Google Scholar] [CrossRef] [PubMed]
  40. Afshar, R.; Jeanne, S.; Abali, B.E. Nonlinear Material Modeling for Mechanical Characterization of 3-D Printed PLA Polymer With Different Infill Densities. Appl. Compos. Mater. 2023, 30, 987–1001. [Google Scholar] [CrossRef]
  41. Bakar, M.S.A.; Salit, M.S.; Yusoff MZ, M.; Zainudin, E.S.; Ya, H.H. The crashworthiness performance of stacking sequence on filament wound hybrid composite energy absorption tube subjected to quasi-static compression load. J. Mater. Res. Technol. 2020, 9, 654–666. [Google Scholar] [CrossRef]
  42. Huo, X.; Sun, G.; Zhang, H.; Lv, X.; Li, Q. Experimental study on low-velocity impact responses and residual properties of composite sandwiches with metallic foam core. Compos. Struct. 2019, 223, 110835. [Google Scholar] [CrossRef]
  43. Abeykoon, C.; Sri-Amphorn, P.; Fernando, A. Optimization of fused deposition modeling parameters for improved PLA and ABS 3D printed structures. Int. J. Lightweight Mater. Manuf. 2020, 3, 284–297. [Google Scholar] [CrossRef]
  44. Huang, Z.; Zhang, X.; Yang, C. Static and dynamic axial crushing of Al/CRFP hybrid tubes with single-cell and multi-cell sections. Compos. Struct. 2019, 226, 111023. [Google Scholar] [CrossRef]
  45. Zolfagharian, A.; Bodaghi, M.; Hamzehei, R.; Parr, L.; Fard, M.; Rolfe, B.F. 3D-printed programmable mechanical metamaterials for vibration isolation and buckling control. Sustainability 2022, 14, 6831. [Google Scholar] [CrossRef]
  46. Yousefi, A.; Jolaiy, S.; Dezaki, M.L.; Zolfagharian, A.; Serjouei, A.; Bodaghi, M. 3D-Printed Soft and Hard Meta-Structures with Supreme Energy Absorption and Dissipation Capacities in Cyclic Loading Conditions. Adv. Eng. Mater. 2023, 25, 2201189. [Google Scholar] [CrossRef]
  47. Zhang, Y.; Wang, J.; Wang, C.; Zeng, Y.; Chen, T. Crashworthiness of bionic fractal hierarchical structures. Mater. Des. 2018, 158, 147–159. [Google Scholar] [CrossRef]
Figure 1. Specimen preparation (a) specimens dimension; (b) sequence of processes; (c) printed hexagonal multi-cell.
Designs 07 00108 g001
Figure 2. A quasi-static set-up for compression test.
Designs 07 00108 g002
Figure 3. Stress–strain curve of PLA series.
Designs 07 00108 g003
Figure 4. The Force-displacement curve of hexagonal multi-cell tubes.
Designs 07 00108 g004
Figure 5. Comparison of CFE and SEA values on all specimens.
Designs 07 00108 g005
Figure 6. Hexagonal multi-cell tube force-displacement curves for different PLA series.
Designs 07 00108 g006
Figure 7. The force-displacement curve on maximal SEA from different PLA series and their crushing behavior.
Designs 07 00108 g007
Figure 8. The mean of SN ratios for SEA.
Designs 07 00108 g008
Figure 9. The mean of SN ratios for CFE.
Designs 07 00108 g009
Figure 10. The mean of SN ratios for manufacturing time.
Designs 07 00108 g010
Figure 11. The force-displacement curve for the optimized condition tubes.
Designs 07 00108 g011
Figure 12. Comparison of SEA and CFE values for various structures subjected to quasi-static axial compression from the research of K. Wang [21], Z. Wang [28], and Zhang [47].
Designs 07 00108 g012
Table 1. PLA filament properties [27].
PropertiesPLA(+)PLA(LW)PLA(ST)
Density (g/cm3)1.231.21.25
Tensile Strength (MPa)6332.234.3
Elongation at Break (%)2068.990
Flexural Strength (MPa)7441.3143
Flexural Modulus (MPa)197317011477
IZOD Impact Strength (kJ/m2)98.5863
Table 2. Parameters and levels for manufacturing PLA multi-cell hexagonal tubes.
SymbolParameterLevelUnit
123
ANozzle diameter0.40.60.8mm
BLayer height0.10.20.3mm
CNozzle temperature210220230°C
DPrinting speed306090mm/s
EWall thickness0.81.21.6mm
FMaterialsPLA(+)PLA(LW)PLA(ST)-
Table 3. Material Properties.
FilamentYoung’s Modulus
(GPa)
Tensile Strength
(MPa)
Breakpoint Strain
(% GL)
PLA(+)2.7231.481.46
PLA(LW)1.436.960.35
PLA(ST)2.1420.930.91
Table 4. Experimental results for crashworthiness performance and manufacturing time.
Experiment
Number
ParameterSEACFEManufacturing Time
ABCDEF(J/gr)(min)
L10.40.1210300.8PLA(+)12.980.52515
L20.40.1210301.2PLA(LW)6.440.72658
L30.40.1210301.6PLA(ST)12.370.66613
L40.40.2220600.8PLA(+)15.640.63147
L50.40.2220601.2PLA(LW)8.620.92203
L60.40.2220601.6PLA(ST)13.920.77187
L70.40.3230900.8PLA(+)15.890.7581
L80.40.3230901.2PLA(LW)10.250.93124
L90.40.3230901.6PLA(ST)14.190.88114
L100.60.1220900.8PLA(LW)7.570.96252
L110.60.1220901.2PLA(ST)11.970.78367
L120.60.1220901.6PLA(+)18.120.80340
L130.60.2230300.8PLA(LW)8.580.76260
L140.60.2230301.2PLA(ST)10.500.82331
L150.60.2230301.6PLA(+)16.300.87308
L160.60.3210600.8PLA(LW)8.720.96103
L170.60.3210601.2PLA(ST)12.790.80142
L180.60.3210601.6PLA(+)18.460.82132
L190.80.1230600.8PLA(ST)8.590.93304
L200.80.1230601.2PLA(+)13.940.82423
L210.80.1230601.6PLA(LW)9.940.90364
L220.80.2210900.8PLA(ST)11.240.80126
L230.80.2210901.2PLA(+)16.030.74184
L240.80.2210901.6PLA(LW)11.010.83171
L250.80.3220300.8PLA(ST)9.700.92175
L260.80.3220301.2PLA(+)15.110.85223
L270.80.3220301.6PLA(LW)11.220.77207
Table 5. Response Table for various parameters regarding SEA.
LevelNozzle
Diameter
(mm)
Layer
Height
(mm)
Nozzle Temperature
(°C)
Printing Speed
(mm/s)
Wall Thickness
(mm)
Materials
121.4520.6821.3920.8820.5223.94
221.5521.6421.5721.4721.0921.26
321.3121.9921.3521.9522.7019.11
Delta0.241.310.221.072.184.84
Rank536421
Table 6. Response Table for various parameters regarding CFE.
LevelNozzle
Diameter (mm)
Layer
Height
(mm)
Nozzle
Temperature
(°C)
Printing
Speed
(mm/s)
Wall
Thickness
(mm)
Materials
1−2.60−2.21−2.49−2.44−2.07−2.52
2−1.53−2.05−1.77−1.58−1.75−1.81
3−1.54−1.42−1.41−1.66−1.85−1.34
Delta1.070.791.080.860.321.18
Rank352461
Table 7. Response Table for various parameters regarding manufacturing time.
LevelNozzle
Diameter (mm)
Layer
Height
(mm)
Nozzle
Temperature
(°C)
Printing
Speed
(mm/s)
Wall
Thickness
(mm)
Materials
1−46.94−52.19−47.11−50.33−45.43−47.04
2−47.13−46.15−47.00−46.01−48.21−47.07
3−47.06−42.78−47.01−44.79−47.48−47.02
Delta0.199.410.115.542.780.05
Rank415236
Table 8. Analysis of variance of SEA, CFE and manufacturing time.
SEA (J/gr)
SourceSEA
DFContribution (%)Adj SSAdj MSp-Value
Nozzle diameter (mm)10.250.6920.6920.303
Layer height (mm)14.1611.54311.5430.000
Nozzle temperature (°C)10.070.1870.1870.589
Printing speed (mm/s)13.429.4959.4950.001
Wall thickness (mm)114.1739.34039.3400.000
Materials273.70204.577102.2890.000
Error194.2311.7470.618
Total26100.00
CFE
SourceCFE
DFContribution (%)Adj SSAdj MSp-Value
Nozzle diameter (mm)111.880.0335990.0335990.035
Layer height (mm)16.680.0188920.0188920.105
Nozzle temperature (°C)113.490.0381450.0381450.026
Printing speed (mm/s)16.580.0186050.0186050.107
Wall thickness (mm)10.130.0003690.0003690.814
Materials217.530.0495730.0247860.041
Error1943.700.1235600.006503
Total26100.00
Manufacturing time (min)
SourceTime
DFContribution (%)Adj SSAdj MSp-Value
Nozzle diameter (mm)11.9912,01312,0130.119
Layer height (mm)159.13357,013357,0130.000
Nozzle temperature (°C)11.03623562350.255
Printing speed (mm/s)121.57130,220130,2200.000
Wall thickness (mm)12.0612,42912,4290.114
Materials20.001780.998
Error1914.2285,8614519
Total26100.00
Table 9. Predicted and experimental outcomes of hexagonal multi-cell tubes produced under optimized conditions.
Response ParameterVariableSettingPrediction ValueExperimental ValuePercentage Error (%)
SEA (J/gr)Nozzle diameter (mm)0.619.4119.081.73
Layer height (mm)0.3
Nozzle temperature (°C)220
Printing speed (mm/s)90
Wall thickness (mm)1.6
MaterialsPLA(+)
CFENozzle diameter (mm)0.80.970.916.85
Layer height (mm)0.3
Nozzle temperature (°C)230
Printing speed (mm/s)90
Wall thickness (mm)1.6
MaterialsPLA(ST)
Disclaimer/Publisher’s Note: The statements, opinions and data contained in all publications are solely those of the individual author(s) and contributor(s) and not of MDPI and/or the editor(s). MDPI and/or the editor(s) disclaim responsibility for any injury to people or property resulting from any ideas, methods, instructions or products referred to in the content.

