

Effects of 3D Printing Parameters on Mechanical Properties of ABS Samples


1
Faculty of Industrial and Manufacturing Technology and Engineering, Universiti Teknikal Malaysia Melaka, Hang Tuah Jaya, Durian Tunggal, Melaka 76100, Malaysia
2
Centre of Smart System and Innovative Design, Universiti Teknikal Malaysia Melaka, Hang Tuah Jaya, Durian Tunggal, Melaka 76100, Malaysia
*
Author to whom correspondence should be addressed.
Designs 2023, 7(6), 136; https://doi.org/10.3390/designs7060136
Submission received: 7 November 2023
/
Revised: 15 November 2023
/
Accepted: 22 November 2023
/
Published: 24 November 2023
(This article belongs to the Topic Efficient Manufacturing: Materials, Processes, and Systems)
Abstract
:The most modern technique utilized to create intricate manufactured parts for a variety of applications is called additive manufacturing (AM). Fused deposition modeling (FDM) has been acknowledged as the greatest consideration in the development and industrial sectors. The main objective of this study was to investigate how printing factors affected the mechanical characteristics of printed samples. Samples were produced via an FDM 3D printer in compliance with an ASTM D638 using a variety of input settings, including orientation, layer thickness, speed, and infill pattern. Tensile tests and morphological analysis using a scanning electron microscope (SEM) were done on the printed samples. The results of this study demonstrate that factors including layer thickness, printing speed, and orientation significantly affect the tensile strength of the ABS-printed samples. The 45° orientations, 0.3 mm thickness, and normal speed had a significant impact on the tensile strength of the ABS-printed samples. On the other hand, samples with a 90° orientation, 0.4 mm thickness, and fast speed show better elongation performance than other samples, according to Young’s modulus results. The SEM results for microscopic analysis show that samples S2 (loose infill, 45° orientation, 0.3 mm thickness, and normal speed), S5 (solid infill, 45° orientation, 0.3 mm thickness, and normal speed), and S8 (hollow infill, 45° orientation, 0.3 mm thickness, and normal speed) had a highly packed structure and robust. Discovering the parameter settings that could lead to greater mechanical and physical characteristics would undoubtedly assist designers and manufacturers worldwide as the FDM 3D printer becomes more and more crucial in manufacturing engineering parts.
1. Introduction
The process of synthesizing layers of materials to produce precise parts or finished goods is known as additive manufacturing [1]. A computer-aided design (CAD) model serves as the blueprint for the additive manufacturing process, which entails building three-dimensional parts by gradually integrating material in the form of layers [2]. The process of additive manufacturing may create parts with decent precision and a small amount of waste [3]. The ability of AM technology to get a product to market more quickly than traditional techniques has caused its use to explode over the past few decades [4]. According to Forbes (2016), 95% of manufacturing firms believe that 3D printing technology offers a sizable competitive edge. In fact, 57% of worldwide companies made investments in 3D printing research and development [5]. Additionally, research demonstrates that 47% of 3D printing companies have had greater success than in past years. According to estimates, the AM industry will increase by an average of 24%, or 35 billion US dollars, during the next five years from 2019 [6,7]. The AM sector expanded by 7.5%, or roughly $12.8 billion US dollars, in 2020. AM is currently an area of interest for bio-printing and is employed in a wide range of industries, including ceramic, polymer, biomedical, and industrial composite materials [8,9,10]. Additive manufacturing is defined as follows in the ISO/ASTM 52900 standard [11]: “process of joining materials to make parts from 3D model data, usually layer upon layer, as opposed to subtractive manufacturing and formative manufacturing methodologies”. Powder bed fusion, direct energy deposition, material extrusion, binder jetting, material jetting, sheet lamination, and VAT photopolymerization are some of the various types of AM technology [12]. Material extrusion (MEX) methods are often referred to as fused deposition modeling (FDM), and fused filament fabrication (FFF).
Polymers are used as an FDM, sometimes referred to as the material extrusion AM technology. Typically, the filament is heated until it becomes molten, at which point it is extruded through the machine’s nozzle. A significant reduction in processing time can be achieved by using lightweight materials to create complex shapes with the FDM technique [13,14]. When compared to other AM methods that make use of various laser systems, powders, and resins, it stands out as a widely used technology that extrudes semi-solid thermoplastic material via a nozzle [15]. Due to its simplicity, adaptability, speed of processing, cheap cost, dependability, low waste, range of materials, and ability to deal with new materials, FDM is also among the most extensively used methods. The FDM technology was created in 1989 by Stratasys, Ltd., one of the leading participants in the global marketplace for 3D printing. FDM technology makes up over 40% of the global market. The most widely used AM technology is FDM because of its speed production, accessibility, cost-effectiveness, wide range of material versatility, and capacity to create complicated parts [16]. The most comprehensively researched thermoplastic polymer materials used in the FDM method consist of acrylonitrile butadiene styrene (ABS), polylactic acid (PLA), polypropylene (PP), polyethylene terephthalate (PET), nylon and high-density polyethylene (HDPE) [17,18,19].
Numerous earlier scholars investigated the effect of the FDM 3D printer’s printing parameters. They researched variables such as printing speed, layer thickness, orientation, raster angle, and pattern infill [20,21,22,23]. ABS material was utilized by Sharma et al. [24] and Vicente et al. [25] to examine the influence of layer thickness on mechanical behavior. The FDM factors that received the greatest attention throughout the research were the base orientation, layer thickness, raster orientation, air gap, infill density, and raster width. The most significant variables affecting the product’s mechanical properties, dimensional accuracy, and surface roughness, according to previous studies, are thickness and orientation. The support material and fabrication time optimization on FDM were examined by Gurrala and Regalla et al. [26] using the DOE approach. According to the analysis of variance (ANOVA) results, the sample’s orientation was determined to be essential for minimizing build time, and build time is reduced when the raster angle, raster width, layer thickness, and contour width rise. According to Nancharaiah et al.’s ANOVA analysis [27], the raster width and layer thickness had a substantial impact on the product’s part accuracy and surface finish. In order to prepare the sample and conduct mechanical experiments, research organizations used ASTM-established standards. Moradi et al. [28] applied an RSM method to identify variables that impact mechanical performance. For instance, practically all research organizations that tested for tensile testing employed the ASTM D638 [29].
A high percentage of studies indicated that the process variables primarily influence the part’s tensile strength, elongation, and elastic modulus. Furthermore, mechanical performance was shown to depend on printing conditions in almost all the research published [30]. The part orientation and the inadequate interlayer bonding have the biggest impacts on the sample’s tensile strength. Additionally, both parallel and longitudinal materials can produce materials that have elevated tensile in the printing direction [31]. Hossain et al. [32] investigated methods to manipulate the contour width, air gap, build orientation, and raster angle to increase Young’s modulus, ultimate tensile strength, and tensile strain. The evaluation has been conducted using the default, visual response, and insight methods. The results showed that by employing the insight approach to optimize process parameters, a greater UTS could be achieved. The mechanical characteristics and microstructure of the FDM-printed ABS parts at various raster angle orientations were investigated by Fatimatuzahraa et al. [33]. The results demonstrated that constructions with a cross-sectional angle of 45° have greater performance for impact, flexural, and deflection tests.
Researchers frequently used the scanning electron microscope (SEM) technology in their research. It is an accurate and efficient approach to evaluate a material’s surface morphology. The samples’ fractured surfaces underwent morphological examination by Atakok et al. [34]. The test parts’ resistance to deformation was decreased by their porous structure and the significant surface voids that they had created. The parallel layers created by the FDM process are clearly visible in the cross-section of the fracture test parts. According to Lyu et al. [35], the interlayer bonding of the three samples had similarities as seen in the SEM images. The number of pores and adhesion between the filaments were greatly influenced by the 3D printing parameters, which in turn affected the samples’ yield strength. For SEM microscopy investigation, the samples with the finest fracture were chosen [36]. The outcome demonstrates that when the infill percentage declined, the amount of infill voids grew larger. Therefore, the characteristics dropped as the size of the voids increased and the interaction between the layers became weaker.
The literature showed that the effect of the configurations for the FDM 3D printer, UpPlus model using the ABS filament had not received much attention. Moreover, the less comprehensive study revealed the porosity and microstructure of printed materials. Most of the previous research investigates the effects of parameter settings for the CubePro, FlashForge, and MakerBot models of 3D printers. In order to better understand how 3D printing factors affect important mechanical characteristics including tensile strength and tensile modulus of ABS material produced by an FDM 3D printer, this study will investigate those effects. This study also discovered a morphological study of the fractured surface and porosity of the ABS samples.
2. Materials and Methods
2.1. Filaments and Printing Parameters
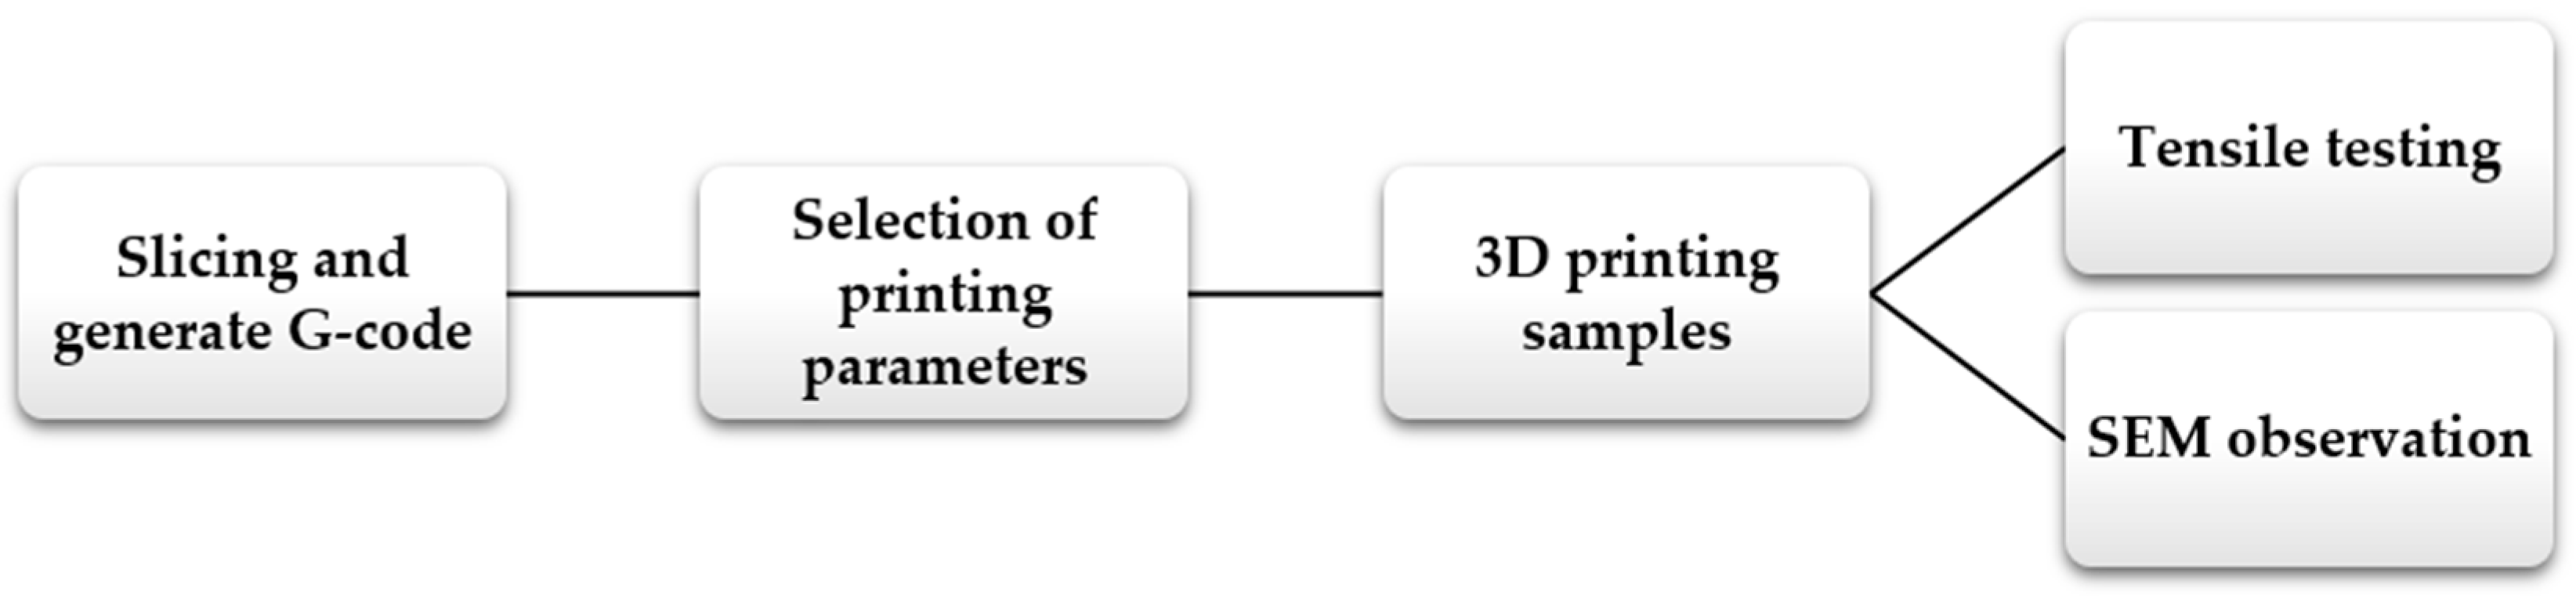
The ABS filament was purchased from the eSUN in Shenzhen, China. The ideal printing temperature and the optimal printing bed temperature were 245 °C and 80 °C, respectively. The nozzle diameter was 0.4 mm, whereas the filaments had a 1.75 mm diameter. An experimental setup flow chart for this work is shown in Figure 1. Catia V9 software was used to create the CAD model in accordance with the ASTM D638 standards. Then, this model was transferred to Slicing UP Studio 3 software. The samples were then printed using the generated G-code on an FDM 3D printer.
Table 1 shows infill pattern, orientation, layer thickness, and printing speed have been selected as printing parameters used to produce the samples. To determine the impact these factors had on the mechanical characteristics, the specimens were created using three different infill patterns (loose, solid, and hollow), layer thicknesses (0.2 mm, 0.3 mm, and 0.4 mm), orientations (0°, 45°, and 90°), and speeds (fine, normal, and fast). Compared to other types of samples, those that had lower layer thicknesses and faster printing speeds took less time to print. The 3D printer, UP Plus 2, Beijing, China was used to print the specimens. The specifications of the 3D printer are displayed in Table 2. This 3D printer can print parts or products that have a maximum dimension of 140 mm width, 140 mm depth, and 135 mm height. Furthermore, it is capable of achieving an accuracy of up to 150 µm. Right after the printing method, all samples undergo tensile testing and SEM examination.
2.2. Tensile Testing
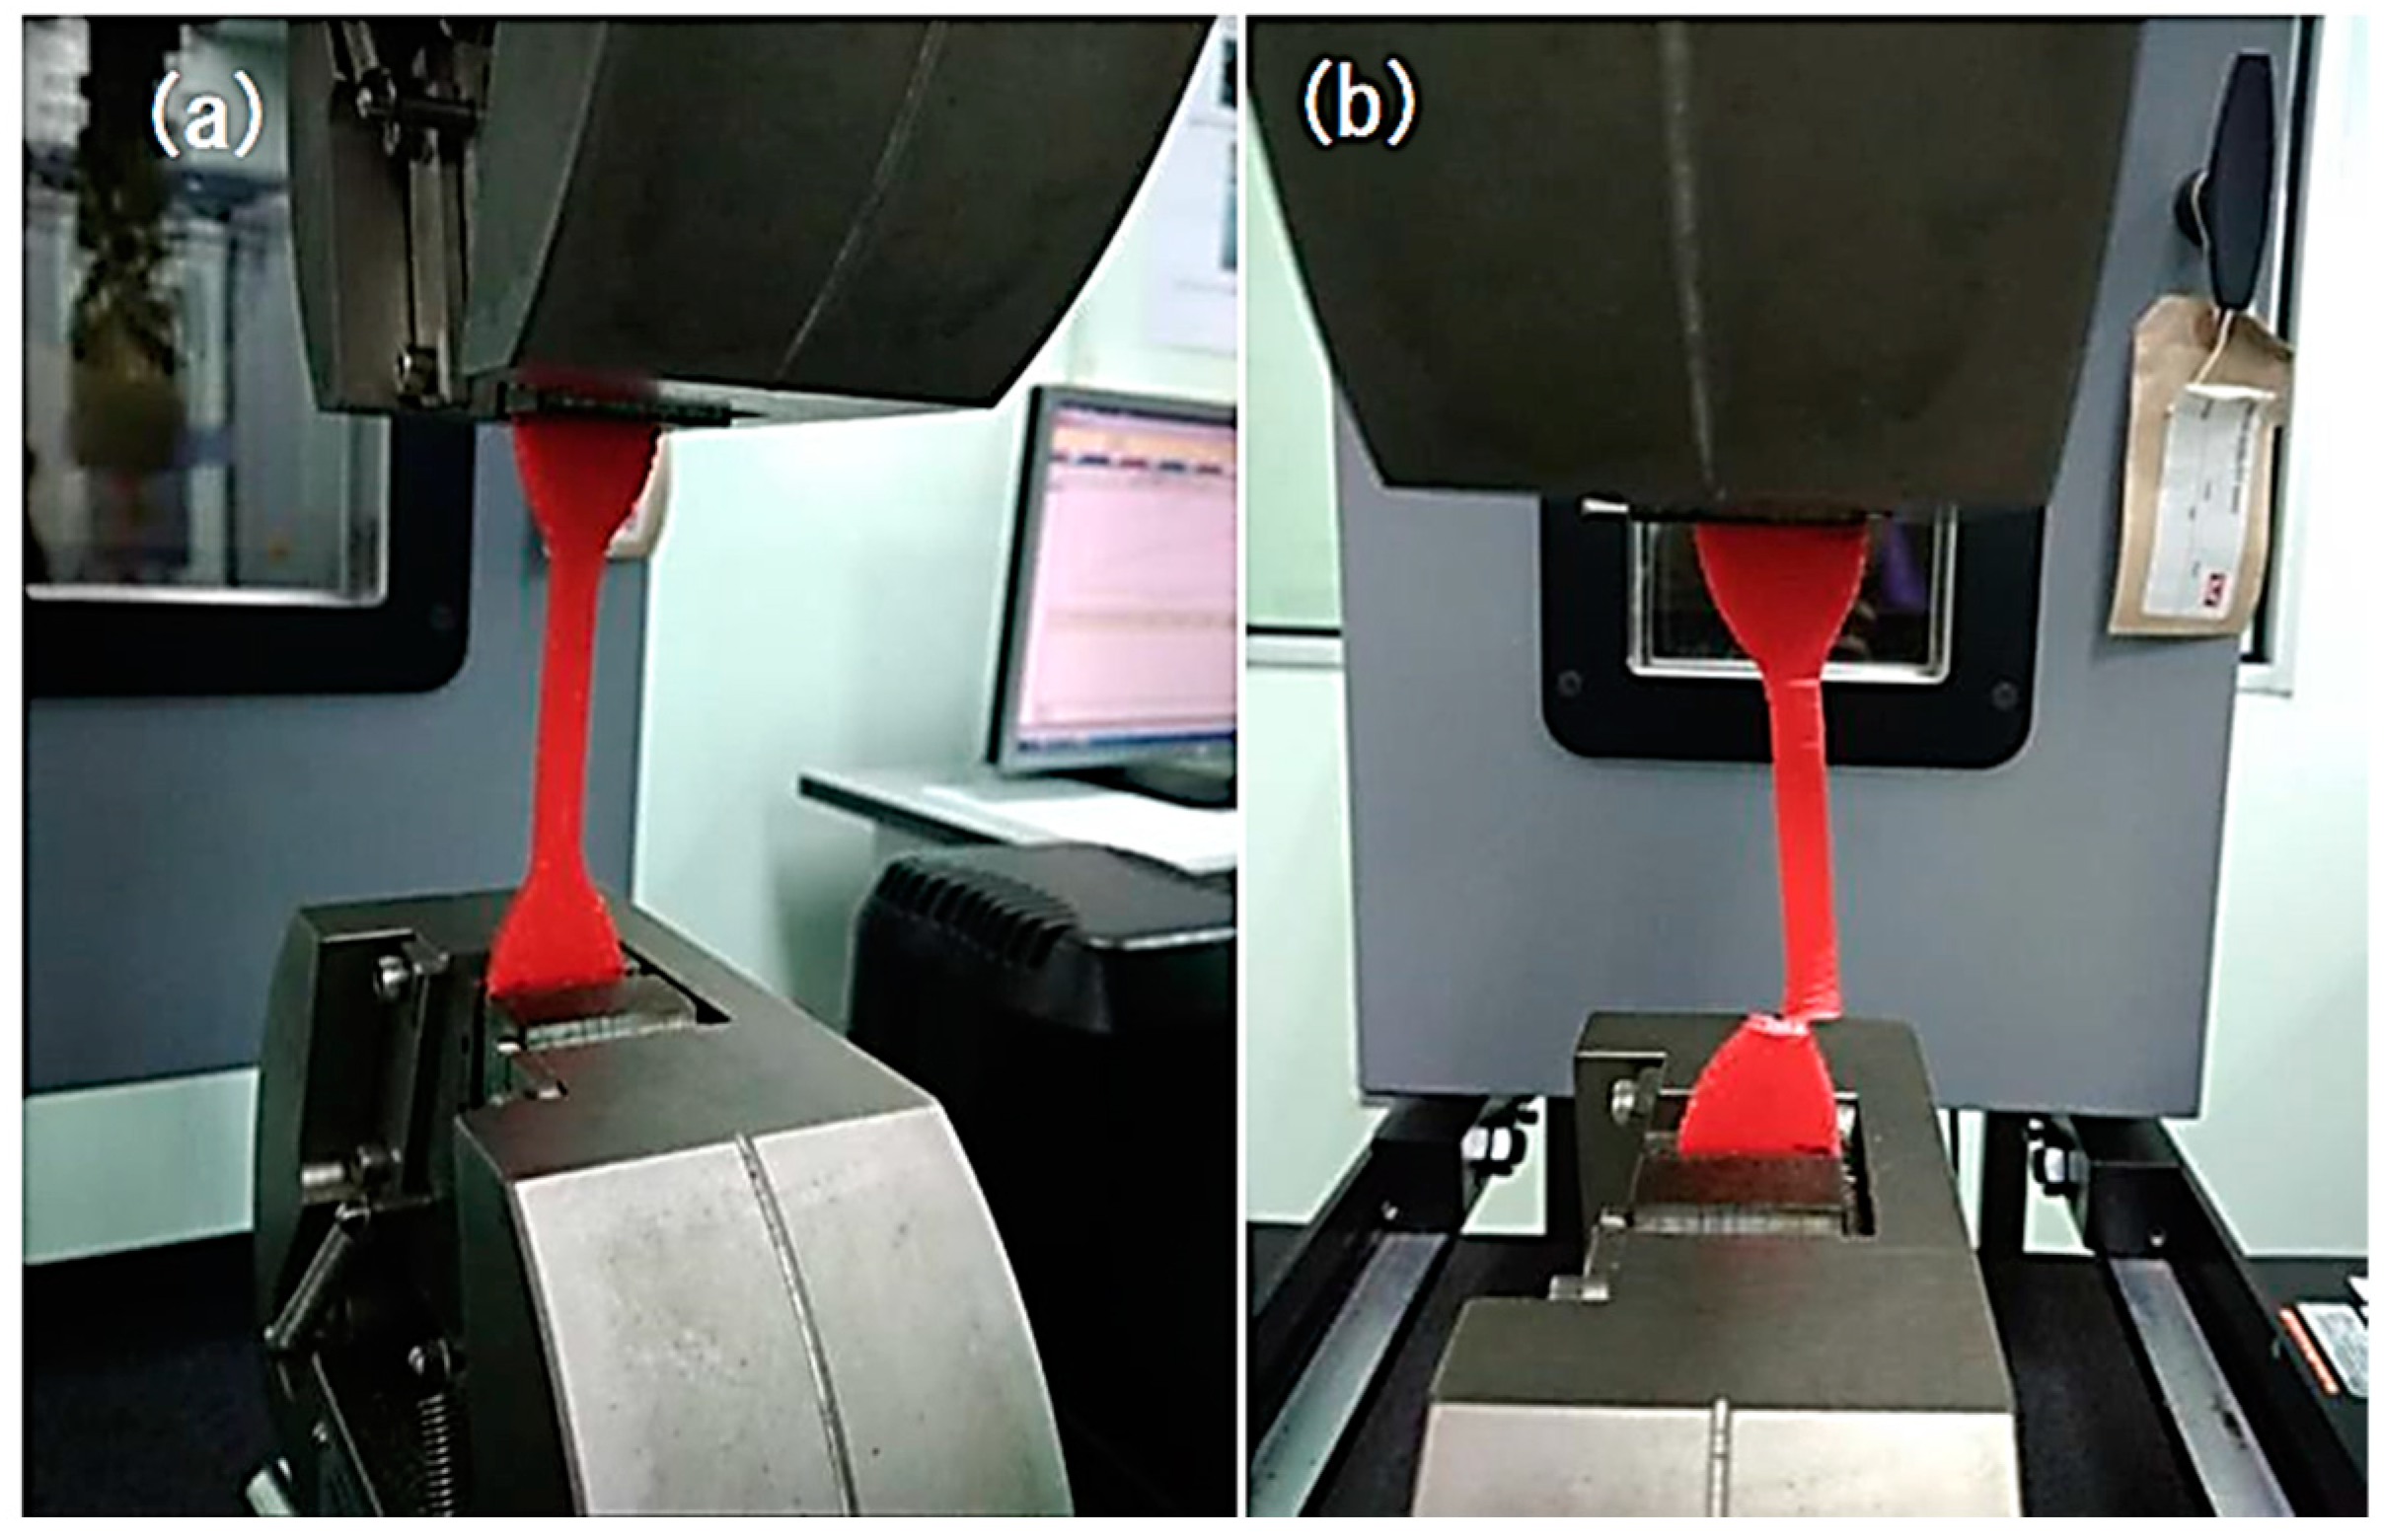
Tensile strength is a measurement of how much a material can be stretched before breaking or how far it can be stretched before cracking. An extensometer was fastened to the sample at its focus point to perform the tensile test. A universal testing machine (Instron 5969, Instron, MA, USA) with a 50 kN load cell and a constant crosshead speed of 5 mm/min was used to measure the tensile strength, modulus, and elongation. For tensile and modulus properties, the testing was done in accordance with the ASTM D638 [37]. The tensile test setup for ABS-printed samples is shown in Figure 2. In addition, the ductile modulus, rigidity, and elongation at the breaking point, among other tensile parameters, were identified. Calculating elasticity and modulus is done using Equations (1) and (2), where σ indicates the tensile strength at yielding, A denotes the cross-section area, F represents the applied load (kN), E stands for the elastic modulus (MPa), and ϵ for the sample’s strain (mm/mm).
2.3. Porosity Measurement
The porosity of the ABS-printed samples was measured by applying the Archimedes principle. The buoyant force on an object that is submerged equal to the weight of the fluid that the object displaces is known as the Archimedes principle, according to Berger [38]. The weight of the samples was measured with a balance (Ohaus, EX224 Explorer Analytical, Ohaus Corporation, NJ, USA). The weight of the ABS samples measured in air (dry) and water was used to calculate the density. Equation (3) was used to calculate the density of the samples:
2.4. Scanning Electron Microscope (SEM)
A scanner electron microscopy (SEM) analysis was performed to examine the top surface of the fracture morphology with a 20 kV acceleration voltage, the JEOL JSM-6010PLUS/LV (Tokyo, Japan). Before the experiment, all samples had been trimmed to a uniform size and coated with platinum. After inspection, all test specimens were sealed in zip-top plastic bags.
2.5. Analysis of Variance (ANOVA)
With regard to mechanical characteristics, a one-way ANOVA was employed to assess the significance and comparative importance of the primary variables. The one-way ANOVA was performed by Ahmad et al. [39] to analyze the mechanical characteristics of oil palm fiber composite for FDM-3D printer and assess the impact of each mean value (p-value less than 0.05).
3. Results and Discussion
3.1. Mechanical Properties
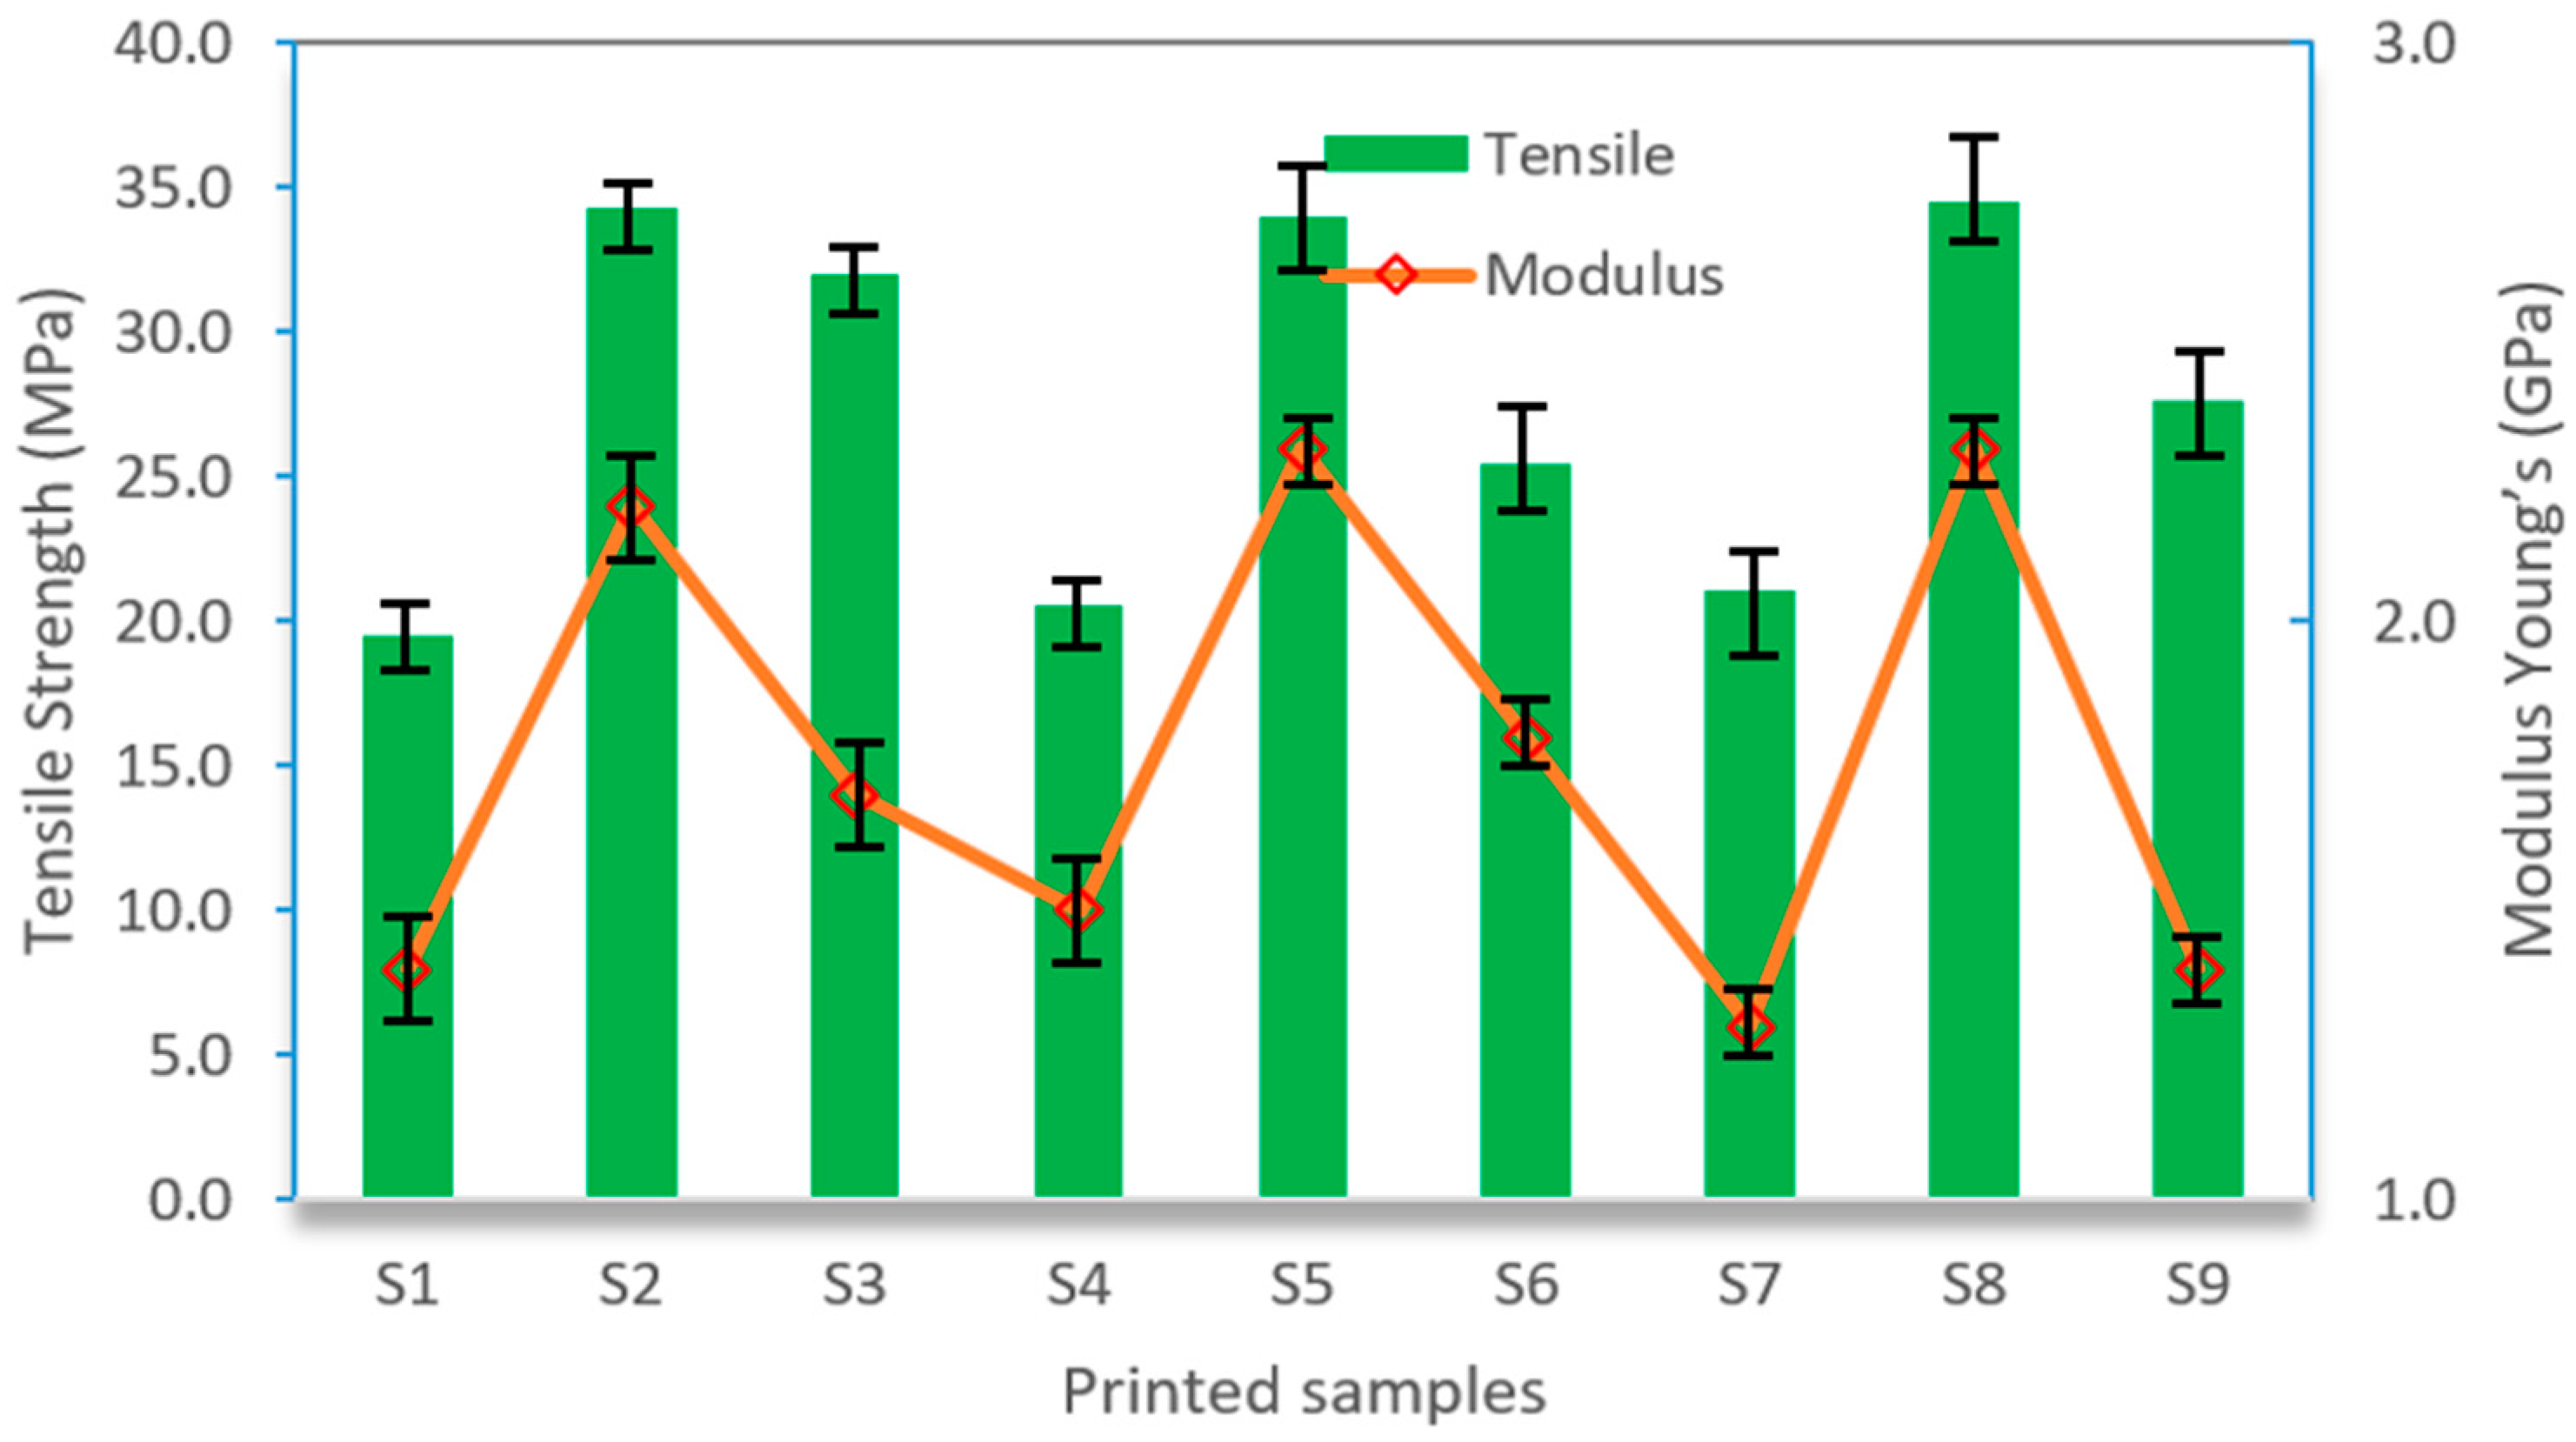
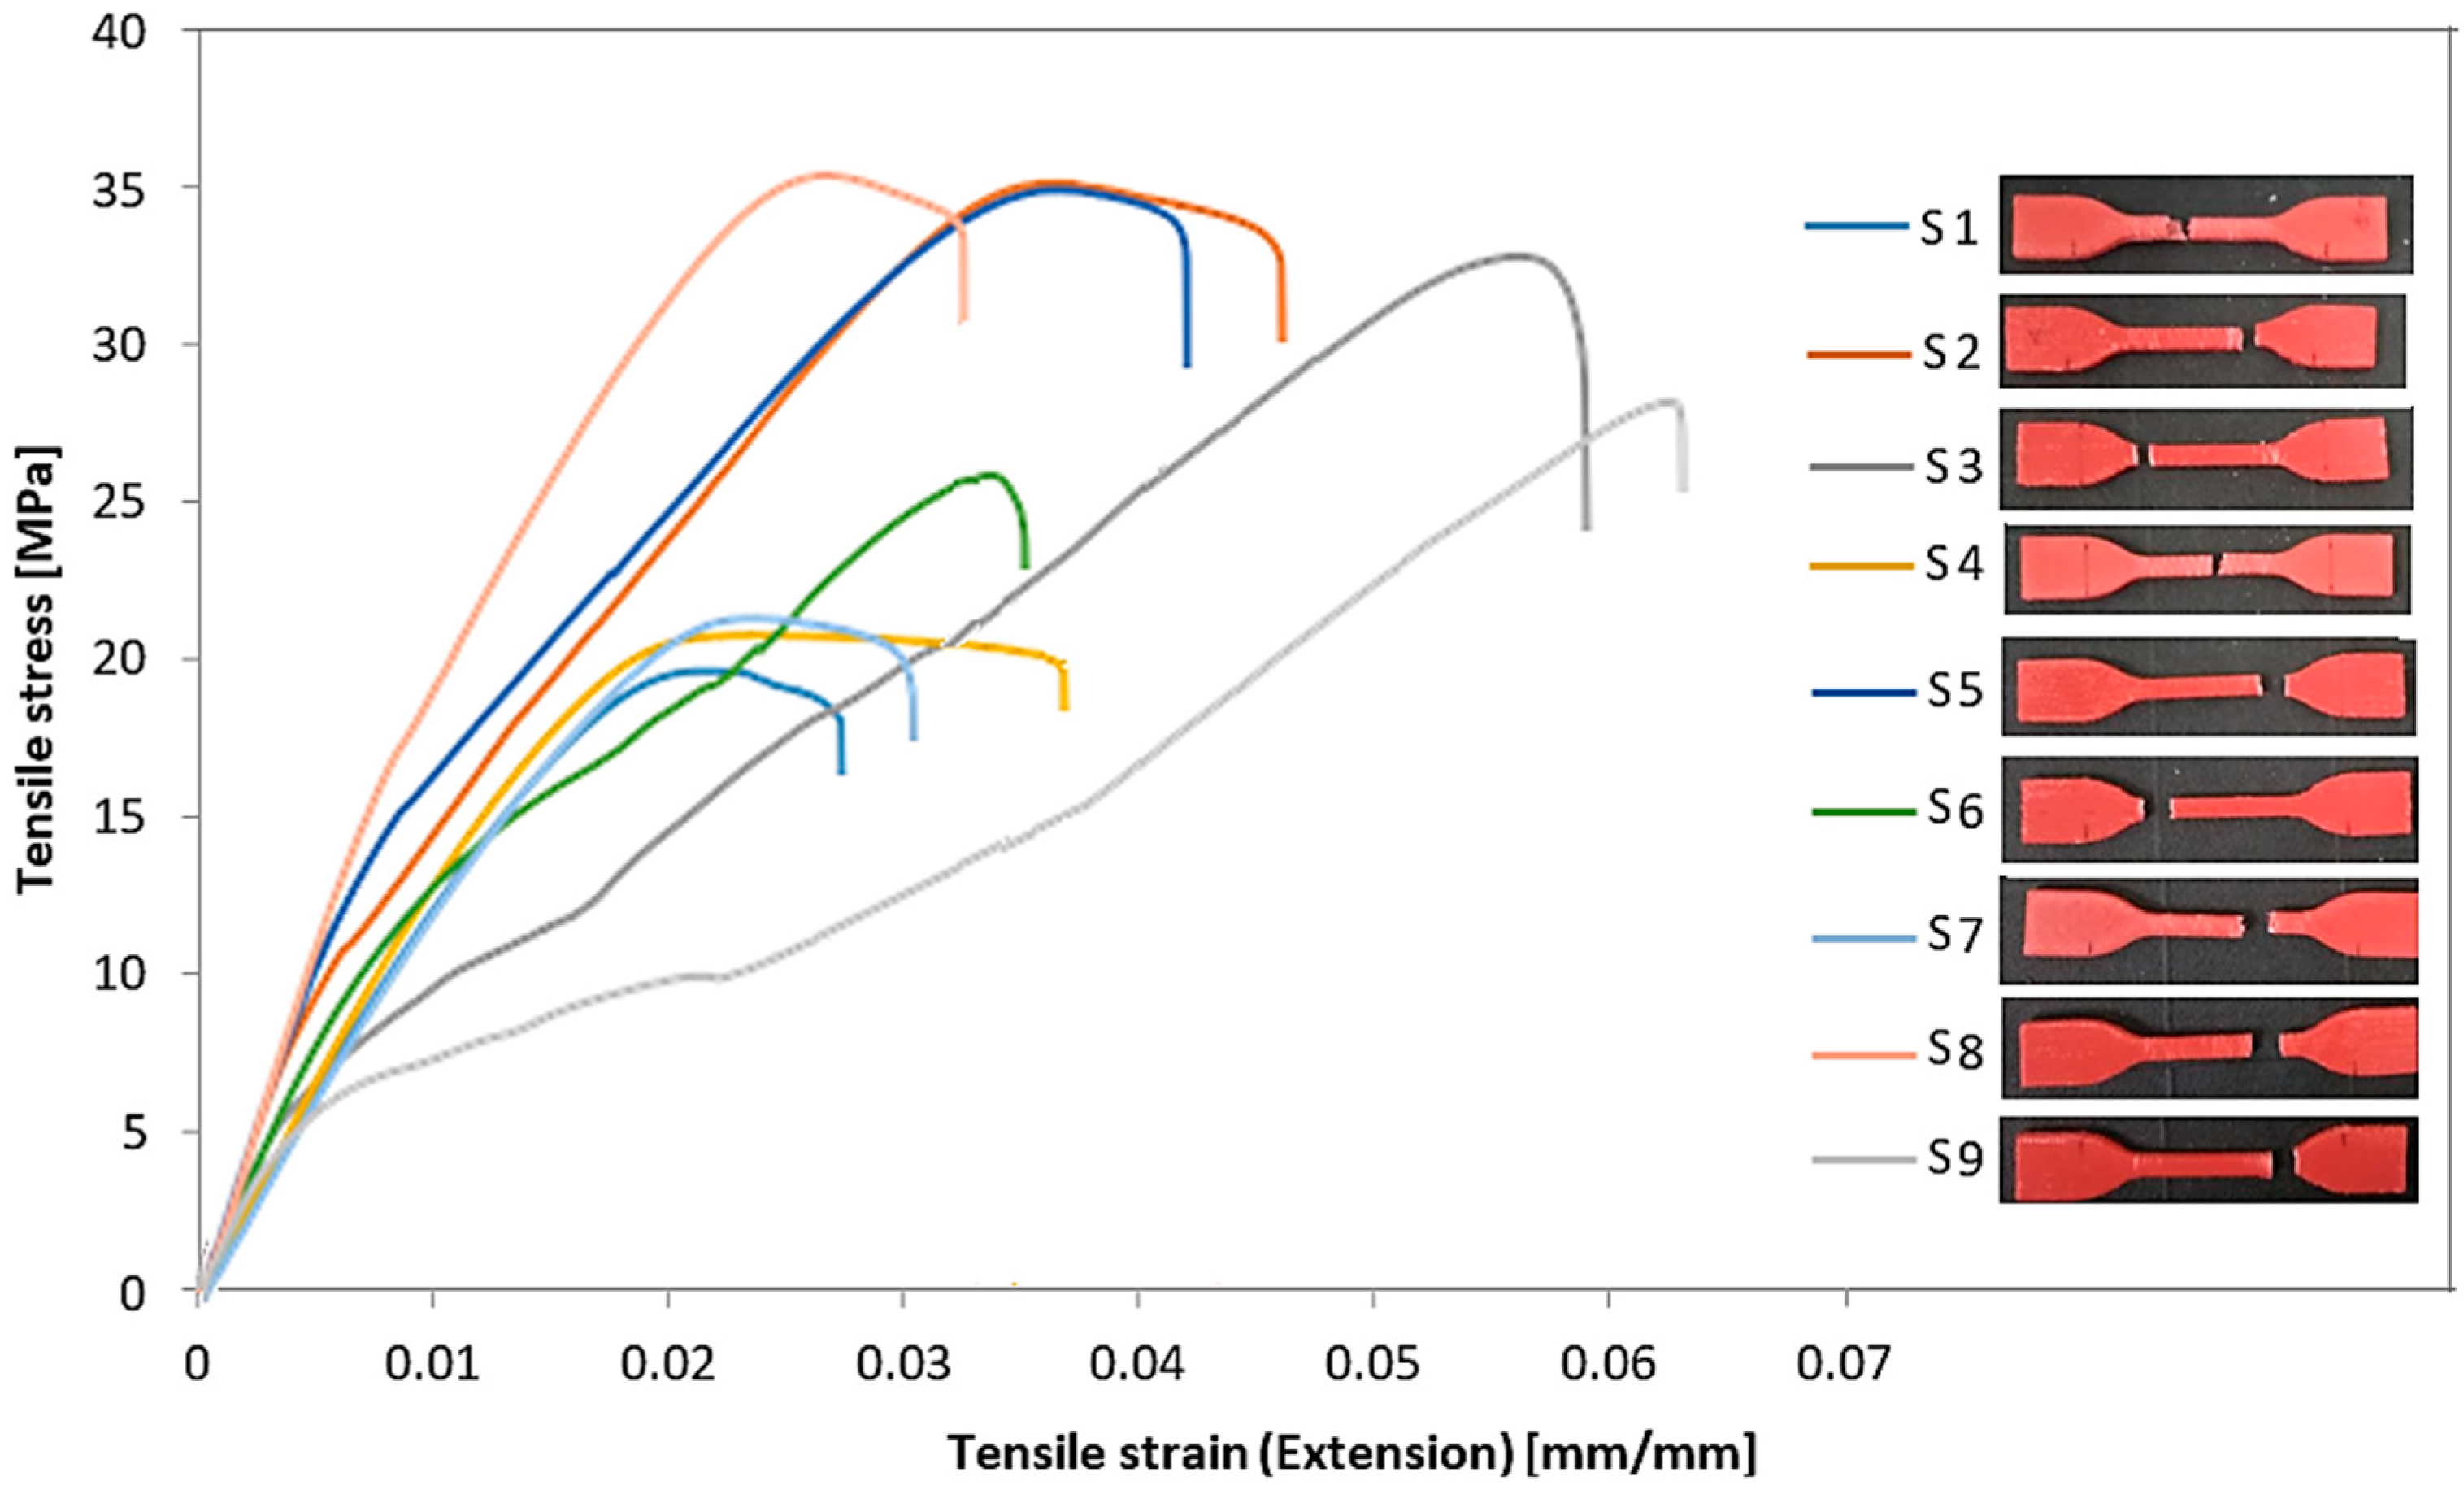
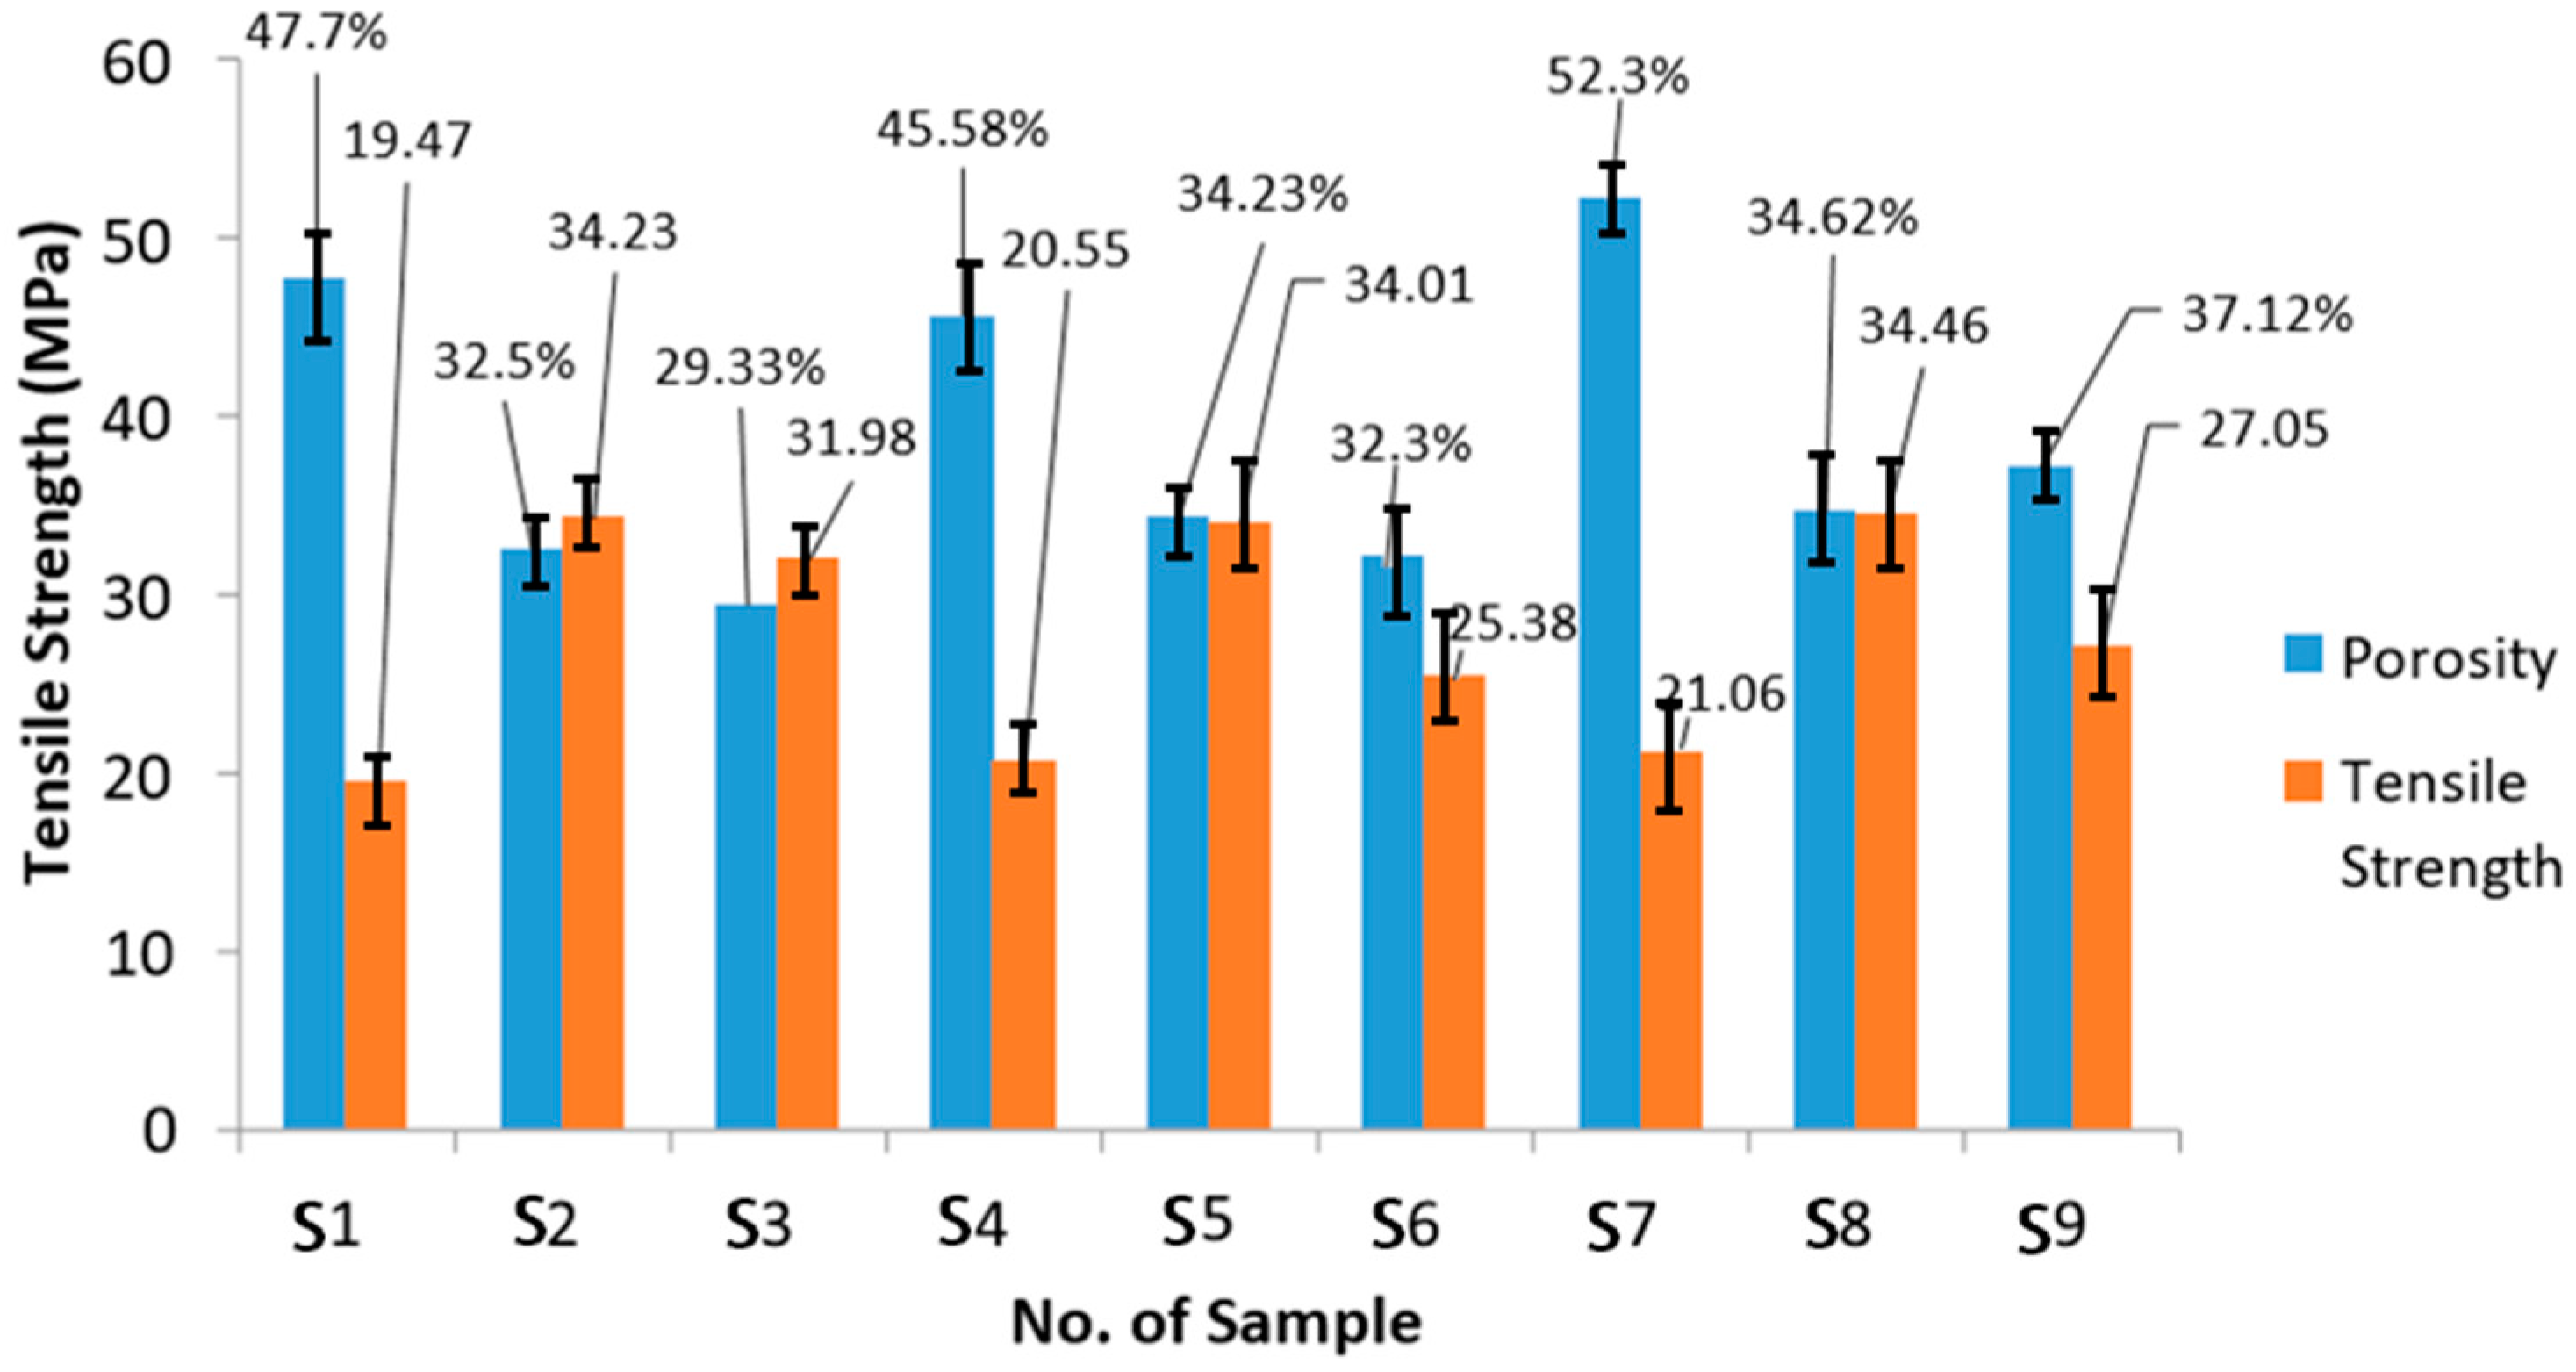
Figure 3 shows the result of tensile strength, tensile modulus, and a typical failure mode of ABS-printed samples. Tensile test specimens do not typically break in the middle because the material is designed to have a uniform cross-section and consistent properties throughout the entire length of the specimen. However, as the SEM images show, these specimens tend to shatter near the end because of the internal structure that has larger voids. Weak interlayer bonding, caused by cooling and volumetric shrinkage of the solidified polymer, also drove the failure process. The development of the neck between adjacent filaments and molecular diffusion and randomization along the interface were the main factors affecting bonding quality. Additionally, it has the effect of decreasing the mechanical properties. When printing at a faster speed than at a slower one, interlayer bonding could be affected. The influence of FDM-3D printing parameters on tensile strength and Young’s modulus resulted in a similar pattern. The result shows that the parameters were set to 45° orientation, 0.3 mm thickness, and normal speed had contributed the highest value of tensile strength (34.5 MPa) and tensile modulus (2.3 GPa). These significant results were contributed by samples no. 2, 5, and 8. Otherwise, parameter setting (sample no. 1, 4, and 7) with 0° orientation, 0.2 mm thickness, and fine speed contributed to the lower tensile strength and tensile modulus, which is 19.5 MPa and 1.4 GPa respectively. In reality, it depends on how the printed parts are assembled layer by layer in the direction of the applied force. Whereas horizontal forces typically distribute those loads along the filament strands, vertical forces will split parts along layer lines. This is in accordance with a study by Rankouhi et al. [40] that examined how layer thickness affected the mechanical characteristics of ABS parts. As indicated by the study, samples with thinner layer heights exhibited superior mechanical capabilities over those with thicker layer heights. Similar findings by Shergill et al. [41] and Ahmad et al. [39], they found that printing the parts using the ABS filament with lower layer thickness had achieved a good result in tensile strength. Additionally, Shashikumar [42] reported that significant improvements in tensile strength were seen after implementing the technique known as FDM technological advances, especially when employing thinner layer thicknesses. According to Sharma et al. [24], the strength increased from 33 to 42 MPa when the layer thickness was increased from 0.1 mm to 0.3 mm. This was explained by the fact that shear stress generated on the primary plane during deformation causes the specimen to fail. Five various build orientation parameter levels, such as 0°, 45°, and 90° in the XY plane and 45°, and 90° in the Z plane, were chosen by Hernandez et al. [43]. Tensile, compressive, and flexural strength data were used to discuss the mechanical strength of ABS parts. The main results demonstrated that 90° in the XY plane was necessary to obtain the maximum tensile strength of 10.8 MPa. Figure 4 shows a graph of the S-N curve of nine printed samples of the ABS. By measuring the area under the S-N curve, tensile toughness was identified. The results analysis showed that the ABS samples had ductile fracture behavior. According to the results, sample no. 3 and 9 (90° orientation, 0.4 mm thickness, fast speed) perform better in terms of elongation than the others. The alteration in intermolecular interaction and segmental chain mobility in those samples could have been the cause of the higher elongation [44]. Beyond the yield point, the stress values in the situation of ABS material gradually rise till ultimate tensile strength then decrease until the breaking point. The stress-strain behavior of ABS, an amorphous copolymer, exhibits necking after the UTS. Owolabi et al. [45], who printed the parts using a 3D printer, reported a similar S-N behavior in ABS. Lastly, it appears that the filament material has an impact on the layer height as well. The ABS part was discovered to be only slightly responsive to the layer thickness’s effect. Comparing this effect on ABS and PLA filaments, Panes et al. [46] discovered that even though the effect of layer height on ABS material is negligible, the result for PLA material is consistent with the previously reported findings. Samykano et al. [47] also reported comparable results. This seems to be caused by the filament material’s intrinsic mechanical and chemical characteristics. It is still unknown, though, how this phenomenon is causally related. The study by Shergil et al. [41] also discovered that the mechanical properties of the ABS specimens decreased with increasing layer thickness. Figure 5 shows a relationship between tensile strength and porosity, showing that in cases where the tensile strength is greater, the porosity will be less. The highest tensile strength was measured at a layer thickness of 0.3 mm, whereas the lowest tensile strength was 19.47 MPa. Therefore, it is concluded that the porosity of any sample will decrease if the tensile strength is increased. This finding also occurred at the modulus result. Buj et al. [48] examined how printing parameters affected porosity and discovered that layer height was the factor that affected porosity the most, followed by speed and temperature.
3.2. Morphological Analysis
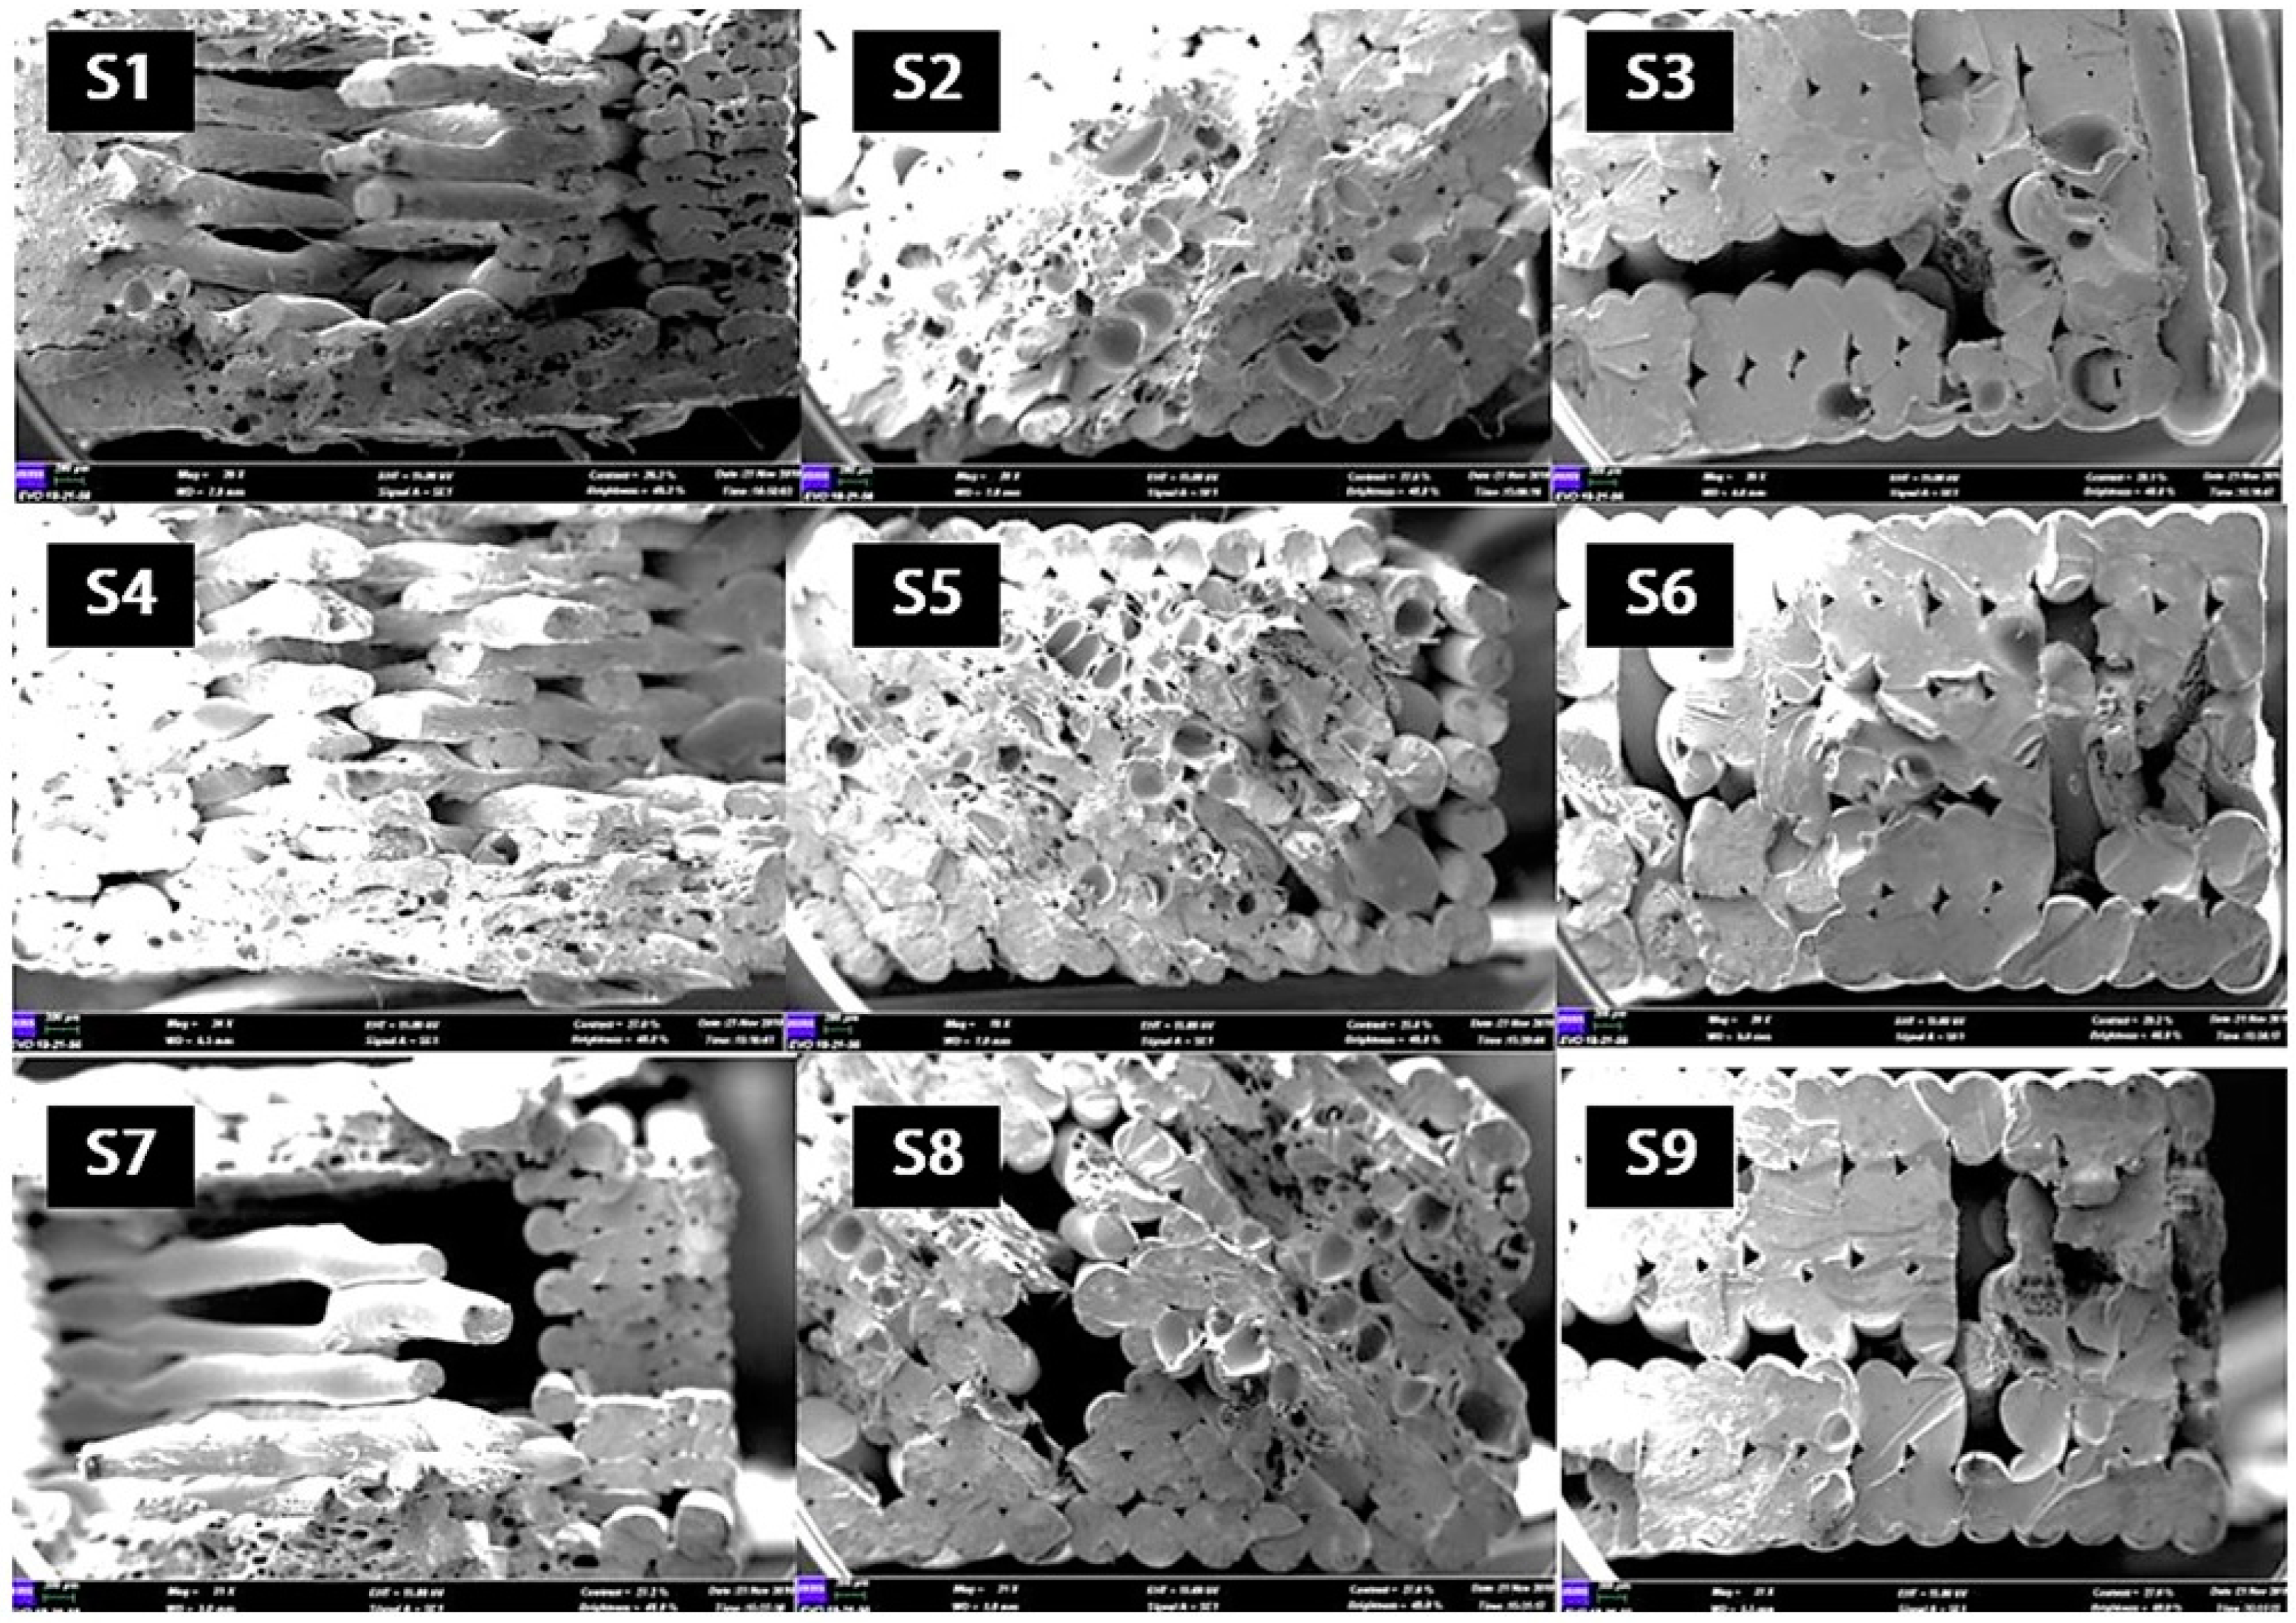
The scanning electron microscope (SEM) method used in this research is a precise and quick way to examine the microscopic topology and surface morphology of a material. The printed samples’ fracture surfaces showed a ductile particular type of fracture. The material was stretched and then re-oriented, which ultimately caused the distortion. Figure 6 depicts the SEM images of nine ABS-printed samples that have undergone a tensile test. The fractured samples’ surface morphology also shows a distinct fracture pattern. In comparison to other samples, the result demonstrates that samples S2 and S5 have a robust packed structure and high structural integrity. Then, it led to higher tensile strength and Young’s modulus values. Therefore, samples printed at a normal speed and with a 45° orientation setting could produce tough structures. In the meanwhile, bigger voids were discovered in samples S6, S7, and S9. It implies that samples with 0 and 90° orientations would have an inferior structure and more voids. Due to the weak adhesion between layers, the voids between layers grew, which ultimately reduced the strength of the ABS samples. The same finding was reported by Casavola et al. [49], ABS samples with a setting of 0° orientation show the presence of voids between beads. It results from a decrease in the component’s net segment and density as well as from the existence of a cavity at the interface between the beads. Utilizing the ABS plastic, Onwubolu and Rayegani [50] investigated the impact of the raster orientation on the tensile strength of FDM printed items. The two raster orientation levels—0° and 45°—were chosen. The full factorial design was used in the experiment’s setup, and the differential evolution approach was used to determine the ideal process parameter levels. The key findings demonstrate a direct correlation between printed part tensile strength and raster orientation. For instance, parts with 0° and 45° raster orientations have tensile strengths of 32.56 MPa and 34.61 MPa, respectively. Thus, to enhance the specimen’s microstructure, the build orientation and printing speed must be properly selected. In summary, there was a clear relationship between the experimental results and the structure morphological investigation.
3.3. Analysis of Variance (ANOVA)
ANOVA is a statistical technique that classifies experimental findings based on a common parameter and a function with objective characteristics or responses [51]. It is used for optimizing process parameters. An ANOVA with a confidence interval of 95% was used to examine the main effects of input parameters on each response. Table 3 exhibits the results of a one-way ANOVA for tensile strength and Young’s modulus. The p-value calculated the results’ significance or how much a parameter influences the objective function. Concerning responses, the parameter is significant if the p-value is less than 0.05. In this study, orientation had the greatest impact on the value of tensile strength. It has been proved that the SEM morphological analysis has demonstrated that printing samples at a 45° orientation results in strong structures. p-values larger than 0.05 indicated that the remaining variables, such as infill, thickness, and speed, were not significant. In addition, with a p-value less than 0.05, orientation had the greatest influence on Young’s modulus response. The build orientation has the largest influence on mechanical properties, according to Hikmat et al. [18], who also found the same result.
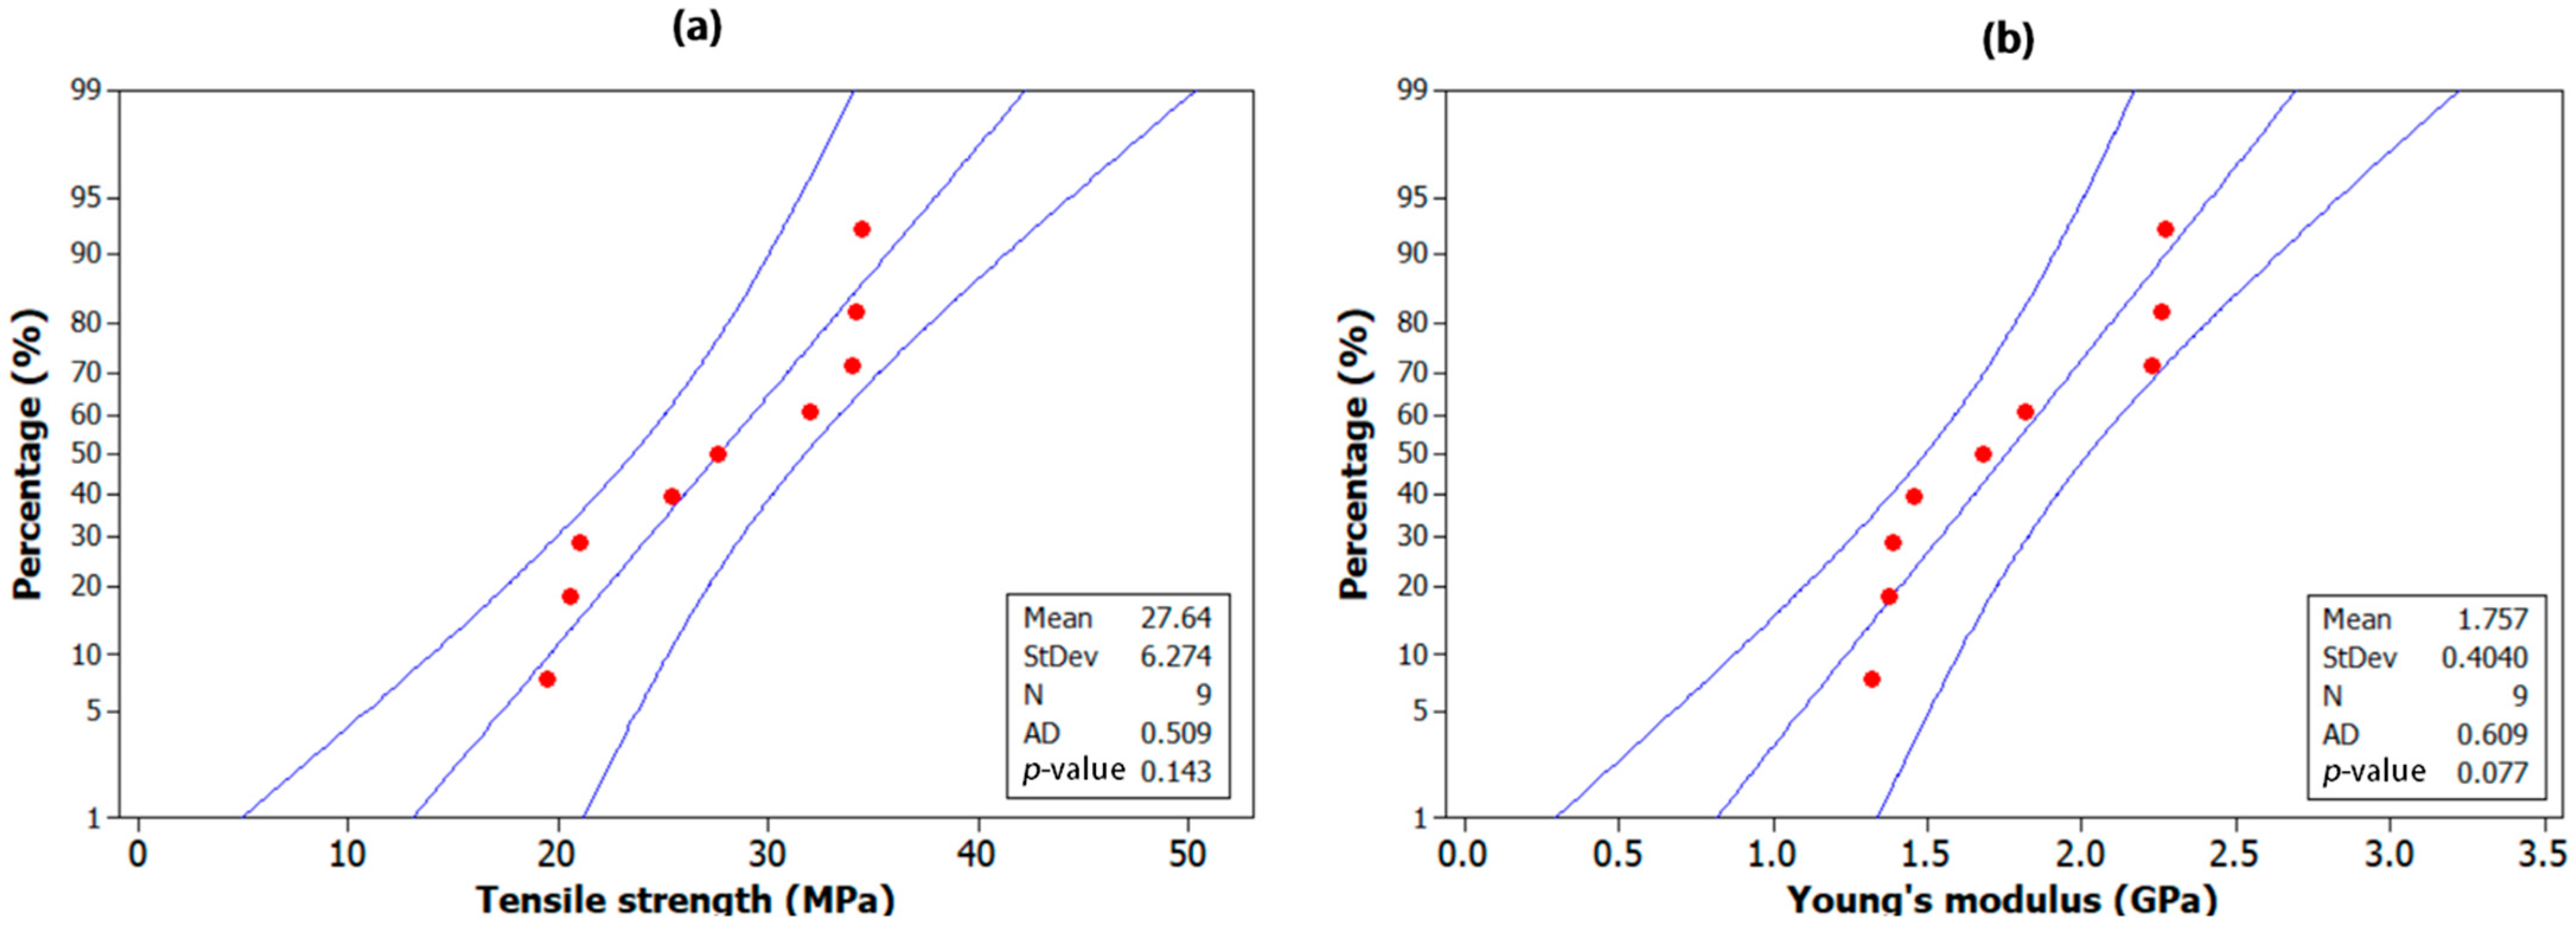
Normal probability graphs are employed to determine a situation where the data distribution is normal. In this study, probability plots were applied to determine the distribution of experimental results of tensile strength, and Young’s modulus test of ABS samples. The essential assumption of the statistical approach is that the pattern of distribution is normal [52]. Normal probability plots may offer reassurance that the assumption is sound or serve as an indication that the assumption is flawed based on the outcome. The normality assumption is verified using the Ander-son Darling (AD) test [53]. To find outliers from normalcy, a complex statistical approach is used. Typically, normality studies combine normal probability plots and normality-related hypothesis tests. When all those data points fall inside the region of the line in a normal probability plot, the assumption of normality is acceptable. Otherwise, the points will deviate off the line, making the assumption of normality unnecessary. Figure 7 shows that the data from the experiment is closer to the fitted line across all the responses, the AD’s results are small, and the p-values for both responses are 0.143 and 0.077, indicating that the data has a normal distribution. The normal probability plots demonstrate that every point has an even distribution and is nearly parallel to a straight line, with none of the outliers. However, it also indicates that the errors are dispersed normally. The distribution of residuals throughout each run is also demonstrated by this pattern.
4. Conclusions
In this work, the effect of printing parameters on the mechanical characteristics of the ABS-printed samples using FDM was examined. The samples were examined in accordance with the ASTM D638 standards. The study found that the tensile strength of ABS-printed samples was significantly affected by the parameters of 45° orientation, 0.3 mm thickness, and normal speed. In contrast, the results for Young’s modulus demonstrate that samples with a 90° orientation, 0.4 mm thickness, and fast speed exhibit greater elongation performance than other samples. The SEM results for microscopic inspection reveal that samples S2, S5, and S8 have a solid-packed structure and strong structural integrity. It proves that those samples have a greater mechanical strength value. The findings of the experimental data and the structure morphological investigations were shown to have a good relationship. The ANOVA analysis revealed that build orientation had the biggest impact on the tensile strength and Young’s modulus response, with a p-value of less than 0.05. The factors that influence mechanical performance can be ranked in order of preference based on experiments: orientation, layer thickness, printing speed, and infill. This study offers sufficient data on FDM-3D printing using the ABS filament in the polymer, automobile parts, and consumer product industries.
For future recommendations, it is advised that the printing process be carried out in a chamber (vacuum) to enhance the final result of the print. This is because the nozzle will transfer less heat, resulting in a smooth and gradual drop in the polymer’s heat, which will strengthen the bond between the layers. Furthermore, incorporating ultrasonic frequency into the test specimen printing process has the potential to enhance the characteristics and quality of printed parts.
Author Contributions
Conceptualization—M.N.A.; Methodology—M.N.A. and A.Y.; Validation—M.N.A.; Original draft preparation—M.N.A. and A.Y.; Review and editing—M.N.A.; Supervision—M.N.A.; Project administration—M.N.A. All authors have read and agreed to the published version of the manuscript.
Funding
This research received no external funding.
Data Availability Statement
Data will be made available on request.
Acknowledgments
The authors wish to thank the Universiti Teknikal Malaysia Melaka for supporting this research. Special appreciation and gratitude to the Centre of Research and Innovation Management and the Faculty of Industrial and Manufacturing Technology and Engineering for giving their full cooperation towards this research.
Conflicts of Interest
The authors declare no conflict of interest.
References
- Pedram, P.; Lin, D. A review on additive manufacturing of polymer-fiber composites. Compos. Struct. 2017, 182, 36–53. [Google Scholar]
- Liu, G.; Zhang, X.; Chen, X.; He, Y.; Cheng, L.; Huo, M.; Yin, J.; Hao, F.; Chen, S.; Wang, P.; et al. Additive manufacturing of structural materials. Mater. Sci. Eng. R Rep. 2021, 145, 100596. [Google Scholar] [CrossRef]
- Javaid, M.; Haleem, A.; Singh, R.P.; Suman, R.; Rab, S. Role of additive manufacturing applications towards environmental sustainability. Adv. Ind. Eng. Polym. Res. 2021, 4, 312–322. [Google Scholar] [CrossRef]
- Wang, X.; Jiang, M.; Zhou, Z.; Gou, J.; Hui, D. 3D printing of polymer matrix composites: A review and prospective. Compos. Part B Eng. 2017, 110, 442–458. [Google Scholar] [CrossRef]
- Columbus, C. 7 Ways 3D Printing Is Making Manufacturing More Competitive. Forbes. 2016. Available online: https://www.forbes.com/sites/louiscolumbus/2016/04/24 (accessed on 1 November 2023).
- Bai, X.; Wu, J.; Liu, Y.; Xu, Y.; Yang, D. Exploring the characteristics of 3D printing global industry chain and value chain innovation network. Inf. Dev. 2020, 36, 559–575. [Google Scholar] [CrossRef]
- Vialva, T. 3D Hubs 3D Printing Trends Report Forecasts 24% Growth in 3D Printing Industry over 5 Years—3D Printing Industry. 2020. Available online: https://3dprintingindustry.com/news/3d-hubs-3d-printing-trends-report-forecasts-24-growth-in-3d-printingindustry-over-5-years-167998 (accessed on 1 November 2023).
- Abhishek, J.; Mathur, T.; Pandian, N.K.R.; Selahi, A. Organ-on-a-chip and 3D printing as preclinical models for medical research and practice. In Precision Medicine for Investigators, Practitioners and Providers; Academic Press: Cambridge, MA, USA, 2020; pp. 83–95. [Google Scholar]
- Durfee, K.; Iaizzo, P.A. Medical Applications of 3D Printing. In Engineering in Medicine; Elsevier Ltd.: Duxford, UK, 2019; Chapter 21; pp. 495–509. [Google Scholar]
- Rouf, S.; Malik, A.; Singh, N.; Raina, A.; Naveed, N.; Siddiqui, M.I.H.; Haq, M.I.U. Additive manufacturing technologies: Industrial and medical applications. Sustain. Oper. Comput. 2022, 3, 258–274. [Google Scholar] [CrossRef]
- ISO/ASTM 52900; Additive Manufacturing. General Principles. Terminology. ISO/ASTM: 2015. Available online: https://www.iso.org/standard/74514.html (accessed on 1 November 2023).
- Ahmad, M.N.; Ishak, M.R.; Mohammad Taha, M.; Mustapha, F.; Leman, Z. A Review of Natural Fiber-Based Filaments for 3D Printing: Filament Fabrication and Characterization. Materials 2023, 16, 4052. [Google Scholar] [CrossRef]
- Jayawardane, H.; Davies, I.J.; Leadbeater, G.; John, M.; Biswas, W.K. ‘Techno-eco-efficiency’ performance of 3D printed impellers: An application of life cycle assessment. Int. J. Sustain. Manuf. 2021, 5, 44. [Google Scholar] [CrossRef]
- Nagarjuna, M.; Suresh, G.; Venkata Rao, K. Assessing the effect of FDM processing parameters on mechanical properties of PLA parts using Taguchi method. J. Thermoplast. Compos. Mater. 2023, 36, 1472–1488. [Google Scholar]
- Jayawardane, H.; Davies, I.J.; Gamage, J.R.; John, M.; Biswas, W.K. Investigating the ‘techno-eco-efficiency’ performance of pump impellers: Metal 3D printing vs. CNC machining. Int. J. Adv. Manuf. Technol. 2022, 121, 6811–6836. [Google Scholar] [CrossRef]
- Kumaresan, R.; Samykano, M.; Kadirgama, K.; Sharuzi, W.; Harun, W.; Rahman, M. Fused deposition modeling: Process, materials, parameters, properties, and applications. Int. J. Adv. Manuf. Technol. 2022, 120, 1531–1570. [Google Scholar]
- Sabil, M.; Prabhakar, D.A.P. Optimisation of Extrusion Temperature and Infill Density of PLA material by using L16 Orthogonal Array. Aust. J. Mech. Eng. 2022. [Google Scholar] [CrossRef]
- Hikmat, M.; Rostam, S.; Ahmed, Y.M. Investigation of tensile property-based Taguchi method of PLA parts fabricated by FDM 3D printing technology. Results Eng. 2021, 11, 100264. [Google Scholar] [CrossRef]
- González-Estrada, O.A.; Comas, A.D.P.; Rodríguez, J.G.D. Monotonic load datasets for additively manufactured thermoplastic reinforced composites. Data Brief 2020, 29, 105295. [Google Scholar] [CrossRef]
- Ahmad, M.N.; Tarmeze, A.A.; Rasib, A.H.A. Capability of 3D printing technology in producing molar teeth prototype. Int. J. Eng. Appl. 2020, 8, 64. [Google Scholar] [CrossRef]
- Ahmad, M.N.; Mohamad, A.R. Analysis on dimensional accuracy of 3D printed parts by Taguchi approach. In Advances in Mechatronics, Manufacturing, and Mechanical Engineering: Selected Articles from MUCET 2019; Springer: Singapore, 2021; pp. 219–231. [Google Scholar]
- Heidari-Rarani, M.; Ezati, N.; Sadeghi, P.; Badrossamay, M. Optimization of FDM process parameters for tensile properties of polylactic acid specimens using Taguchi design of experiment method. J. Thermoplast. Compos. Mater. 2020, 35, 2435–2452. [Google Scholar] [CrossRef]
- Aslani, K.E.; Chaidas, D.; Kechagias, J.; Kyratsis, P.; Salonitis, K. Quality Performance Evaluation of Thin Walled PLA 3D Printed Parts Using the Taguchi Method and Grey Relational Analysis. J. Manuf. Mater. Process. 2020, 4, 47. [Google Scholar] [CrossRef]
- Sharma, M.; Sharma, V.; Kala, P. Optimization of process variables to improve the mechanical properties of FDM structures. J. Phys. Conf. Ser. 2019, 1240, 012061. [Google Scholar] [CrossRef]
- Vicente, C.; Martins, T.; Leite, M.; Ribeiro, A.; Reis, L. Influence of fused deposition modeling parameters on the mechanical properties of ABS parts. Polym. Adv. Technol. 2019, 31, 501–507. [Google Scholar] [CrossRef]
- Gurrala, P.K.; Regalla, S.P. Optimization of support material and build time in fused deposition modeling (FDM). Appl. Mech. Mater. 2012, 110–116, 2245–2251. [Google Scholar] [CrossRef]
- Nancharaiah, T.; Raju, D.R.; Raju, V.R. An experimental investigation on surface quality and dimensional accuracy of FDM components. Int. J. Emerg. Technol. 2010, 1, 106–111. [Google Scholar]
- Moradi, M.; Rezayat, M.; Rozhbiany, F.A.; Meiabadi, S.; Casalino, G.; Shamsborhan, M.; Bijoy, A.; Chakkingal, S.; Lawrence, M.; Mohammed, N.; et al. Correlation between Infill Percentages, Layer Width, and Mechanical Properties in Fused Deposition Modelling of Poly-Lactic Acid 3D Printing. Machines 2023, 11, 950. [Google Scholar] [CrossRef]
- Nabipour, M.; Akhoundi, B.; Bagheri Saed, A. Manufacturing of polymer/metal composites by fused deposition modeling process with polyethylene. J. Appl. Polym. Sci. 2020, 137, 48717. [Google Scholar] [CrossRef]
- Letcher, T.; Waytashek, M. Material property testing of 3D-printed specimen in PLA on an entry-level 3D printer. In ASME International Mechanical Engineering Congress and Exposition; American Society of Mechanical Engineers: New York, NY, USA, 2016; pp. 1–8. [Google Scholar]
- Türk, D.A.; Brenni, F.; Zogg, M.; Meboldt, M. Mechanical characterization of 3D printed polymers for fiber reinforced polymers processing. Mater. Des. 2017, 118, 256–265. [Google Scholar] [CrossRef]
- Shojib Hossain, M.; Espalin, D.; Ramos, J.; Perez, M.; Wicker, R. Improved mechanical properties of fused deposition modeling-manufactured parts through build parameter modifications. J. Manuf. Sci. Eng. 2014, 136, 061002. [Google Scholar] [CrossRef]
- Fatimatuzahraa, A.W.; Farahaina, B.; Yusoff, W.A. The effect of employing different raster orientations on the mechanical properties and microstructure of Fused Deposition Modeling parts. In Proceedings of the 2011 IEEE Symposium on Business, Engineering and Industrial Applications (ISBEIA 2011), Langkawi, Malaysia, 25–28 September 2011. [Google Scholar]
- Atakok, G.; Kam, M.; Koc, H.B. Tensile, three-point bending and impact strength of 3D printed parts using PLA and recycled PLA filaments: A statistical investigation. J. Mater. Res. Technol. 2022, 18, 1542–1554. [Google Scholar] [CrossRef]
- Lyu, Y.; Zhao, H.; Wen, X.; Lin, L.; Schlarb, A.K.; Shi, X. Optimization of 3D printing parameters for high-performance biodegradable materials. J. Appl. Polym. Sci. 2021, 138, 50782. [Google Scholar] [CrossRef]
- Retolaza, J.; Gondra, K.; Ansola, R.; Allue, A. Mechanical research to optimize parameter selection for PPS material processed by FDM. Mater. Manuf. Process. 2022, 37, 1332–1338. [Google Scholar] [CrossRef]
- ASTM D638; Standard Test Method for Tensile Properties of Plastics. ASTM International: West Conshohocken, PA, USA, 2003.
- Berger, B. The importance and testing of density/porosity/permeability/pore Size for Refractories. In The Southern African Institute of Mining and Metallurgy Refractories Conference. 2010, pp. 111–116. Available online: https://www.saimm.co.za/Conferences/Refractories2010/101-116_Berger.pdf (accessed on 1 November 2023).
- Ahmad, M.N.; Ishak, M.R.; Mohammad Taha, M.; Mustapha, F.; Leman, Z.; Anak Lukista, D.D.; Ghazali, I. Application of taguchi method to optimize the parameter of fused deposition modeling (FDM) using oil palm fiber reinforced thermoplastic composites. Polymers 2022, 14, 2140. [Google Scholar] [CrossRef]
- Rankouhi, B.; Javadpour, S.; Delfanian, F.; Letcher, T. Failure analysis and mechanical characterization of 3D printed ABS with respect to layer thickness and orientation. J. Fail. Anal. Prev. 2016, 16, 467–481. [Google Scholar] [CrossRef]
- Shergill, K.; Chen, Y.; Bull, S. An investigation into the layer thickness effect on the mechanical properties of additively manufactured polymers: PLA and ABS. Int. J. Adv. Manuf. Technol. 2023, 126, 3651–3665. [Google Scholar] [CrossRef]
- Shashikumar, S.; Sreekanth, M.S. The effect of printing parameters on tensile properties of thermoplastics prepared by fused deposition modeling (FDM) based additive manufacturing technique. Mater. Today Proc. 2023, 90, 256–261. [Google Scholar] [CrossRef]
- Hernandez, R.; Slaughter, D.; Whaley, D.; Tate, J.; Asiabanpour, B. Analyzing the tensile, compressive, and flexural properties of 3D printed ABS P430 plastic based on printing orientation using fused deposition modeling. In Proceedings of the 27th Annual International Solid Freeform Fabrication Symposium, Austin, TX, USA, 8–10 August 2016; pp. 939–950. [Google Scholar]
- Galeski, A. Strength and toughness of crystalline polymer systems. Prog. Polym. Sci. 2003, 28, 1643–1699. [Google Scholar] [CrossRef]
- Owolabi, G.; Peterson, A.; Habtour, E.; Riddick, J.; Coatney, M.; Olasumboye, A.; Bolling, D. Dynamic response of acrylonitrile butadiene styrene under impact loading. Int. J. Mech. Mater. Eng. 2016, 11, 3. [Google Scholar] [CrossRef]
- Rodríguez-Panes, A.; Claver, J.; Camacho, A.M. The influence of manufacturing parameters on the mechanical behaviour of PLA and ABS pieces manufactured by FDM: A comparative analysis. Materials 2018, 11, 1333. [Google Scholar] [CrossRef] [PubMed]
- Samykano, M.; Selvamani, S.; Kadirgama, K.; Ngui, W.; Kanagaraj, G.; Sudhakar, K. Mechanical property of FDM printed ABS: Influence of printing parameters. Int. J. Adv. Manuf. Technol. 2019, 102, 2779–2796. [Google Scholar] [CrossRef]
- Buj-Corral, I.; Bagheri, A.; Sivatte-Adroer, M. Effect of printing parameters on dimensional error, surface roughness and porosity of FFF printed parts with grid structure. Polymers 2021, 13, 1213. [Google Scholar] [CrossRef]
- Casavola, C.; Cazzato, A.; Moramarco, V.; Renna, G. Mechanical behaviour of ABS-Fused Filament Fabrication compounds under impact tensile loadings. Materials 2019, 12, 1295. [Google Scholar] [CrossRef]
- Onwubolu, G.C.; Rayegani, F. Characterization and optimization of mechanical properties of ABS parts manufactured by the fused deposition modelling process. Int. J. Manuf. Eng. 2014, 2014, 598531. [Google Scholar] [CrossRef]
- Chen, W.H.; Uribe, M.C.; Kwon, E.E.; Lin KY, A.; Park, Y.K.; Ding, L.; Saw, L.H. A comprehensive review of thermoelectric generation optimization by statistical approach: Taguchi method, analysis of variance (ANOVA), and response surface methodology (RSM). Renew. Sustain. Energy Rev. 2022, 169, 112917. [Google Scholar] [CrossRef]
- Montgomery, D.C. Design and Analysis of Experiments; John Wiley & Sons: Hoboken, NJ, USA, 2017. [Google Scholar]
- Stephens, M.A. EDF statistics for goodness of fit and some comparisons. J. Am. Stat. Assoc. 1974, 69, 730–737. [Google Scholar] [CrossRef]
Figure 1.
Flow chart of the experimental setup for the ABS-printed samples.

Figure 2.
Tensile testing setup using a universal testing machine (Instron 5969) (a) undeformed and (b) deformed.
Figure 2.
Tensile testing setup using a universal testing machine (Instron 5969) (a) undeformed and (b) deformed.

Figure 3.
Result of tensile strength and Young’s modulus of ABS-printed samples.

Figure 4.
Graph of S-N curve of ABS-printed samples.

Figure 5.
Comparison between porosity and tensile strength results.

Figure 6.
SEM images of fractured ABS samples (S1–S9) with 20× magnifications.

Figure 7.
Probability graph of (a) tensile strength and (b) Young’s modulus.


Table 1.
Printing parameters for ABS-printed samples.
| Sample No. | Infill Pattern | Orientation (°) | Thickness (mm) | Speed(cm3/h) |
|---|---|---|---|---|
| S1 | Loose | 0° | 0.2 | Fine |
| S2 | 45° | 0.3 | Normal | |
| S3 | 90° | 0.4 | Fast | |
| S4 | Solid | 0° | 0.2 | Fine |
| S5 | 45° | 0.3 | Normal | |
| S6 | 90° | 0.4 | Fast | |
| S7 | Hollow | 0° | 0.2 | Fine |
| S8 | 45° | 0.3 | Normal | |
| S9 | 90° | 0.4 | Fast |
Table 2.
3D printer specifications.
| Specifications | Values |
|---|---|
| Printing technology | Melted Extrusion Modeling |
| Build platform | 140 mm width, 140 mm depth, 135 mm height |
| Optimum Layer Resolution | 150 microns |
| Dimension | 245 mm width, 260 mm depth, 350 mm height |
| Weight | 5 kg |
| Power input | 110–220 VAC, 50–60 Hz, 220 W |
Table 3.
One-way ANOVA for tensile strength and Young’s modulus.
| Response | Source | DF * | SS * | MS * | F-Value | p-Value * | Significant (Yes/No) |
|---|---|---|---|---|---|---|---|
| Tensile strength | Infill | 2 | 5.5 | 2.8 | 0.05 | 0.948 | No |
| Orientation | 2 | 290.83 | 145.41 | 36.17 | 0.000 | Yes | |
| Thickness | 2 | 10.2 | 5.1 | 0.10 | 0.906 | No | |
| Speed | 2 | 8.4 | 4.2 | 0.08 | 0.922 | No | |
| Error | 6 | 24.12 | 4.02 | ||||
| Total | 8 | 314.95 | |||||
| Young’s modulus | Infill | 2 | 0.05 | 0.03 | 0.13 | 0.880 | No |
| Orientation | 2 | 1.19 | 0.60 | 32.06 | 0.001 | Yes | |
| Thickness | 2 | 0.03 | 0.01 | 0.07 | 0.937 | No | |
| Speed | 2 | 0.03 | 0.02 | 0.07 | 0.935 | No | |
| Error | 6 | 1.25 | 0.21 | ||||
| Total | 8 | 1.31 |
* p-value < 0.05 is significant; DF is the degree of freedom; SS is the sum of squares; MS is the mean square.
Disclaimer/Publisher’s Note: The statements, opinions and data contained in all publications are solely those of the individual author(s) and contributor(s) and not of MDPI and/or the editor(s). MDPI and/or the editor(s) disclaim responsibility for any injury to people or property resulting from any ideas, methods, instructions or products referred to in the content. |
© 2023 by the authors. Licensee MDPI, Basel, Switzerland. This article is an open access article distributed under the terms and conditions of the Creative Commons Attribution (CC BY) license (https://creativecommons.org/licenses/by/4.0/).
Share and Cite
MDPI and ACS Style
Ahmad, M.N.; Yahya, A. Effects of 3D Printing Parameters on Mechanical Properties of ABS Samples. Designs 2023, 7, 136. https://doi.org/10.3390/designs7060136
AMA Style
Ahmad MN, Yahya A. Effects of 3D Printing Parameters on Mechanical Properties of ABS Samples. Designs. 2023; 7(6):136. https://doi.org/10.3390/designs7060136
Chicago/Turabian StyleAhmad, Mohd Nazri, and Abdullah Yahya. 2023. "Effects of 3D Printing Parameters on Mechanical Properties of ABS Samples" Designs 7, no. 6: 136. https://doi.org/10.3390/designs7060136