
Predicting Quality of Modified Product Attributes to Achieve Customer Satisfaction


Faculty of Mechanical Engineering and Aeronautics, Rzeszow University of Technology, 35-959 Rzeszów, Poland
*
Author to whom correspondence should be addressed.
Designs 2024, 8(2), 36; https://doi.org/10.3390/designs8020036
Submission received: 21 March 2024
/
Revised: 8 April 2024
/
Accepted: 18 April 2024
/
Published: 20 April 2024
(This article belongs to the Special Issue Mixture of Human and Machine Intelligence in Digital Manufacturing)
Abstract
:In the era of the competitive environment, the improvement in current products is ensured through activities aimed at increasing a product’s quality level and, consequently, reducing the amount of waste. The dynamically changing production environment and sudden changes in customer expectations force us to take precise and well-thought-out development steps. Furthermore, it is important to anticipate favourable product changes to prepare for market changes over time. This is still an open problem. The aim of this study was to develop a method to predict the quality of potential product prototypes resulting from the proposed modifications of the product features. This methodology takes into account current customer expectations. The method was created based on the principles of creating Quality Function Deployment (QFD) in the context of taking into account current and future customer expectations regarding product features. This is a new approach to analysing product quality within the principles of the traditional QFD method. The originality of the study is the technique used in the method to estimate the expected values of product features and their importance (weights), taking into account current customer expectations. Its originality is also manifested in drawing conclusions supporting the decision-making process of product improvement, because it involves ensuring the pro-quality modification of selected features of current products in the order that is most advantageous from the customer’s point of view. The use of the proposed method allows for the analysis of the impact of modifying the current value of a product feature. The method is illustrated with an example of a vacuum cleaner for home use. However, the proposed method can be applied to the design of any product to predict products that will meet customer expectations.
1. Introduction
The improvement in product quality covers a product’s customisation to expectations [1,2,3]. In this regard, it is necessary to have a skilful shape of the attributes of a product to achieve product quality that meets the level of expectation. This shaping includes acquiring the Voice of Customers (VoC) [4,5], and then involves its analysis and transformation in product attributes [6,7,8]. The product quality level mentioned is the level of compliance of a product with customers’ expectations and refers only to specific product uses. On the other hand, customer expectations (i.e., their desires and assumptions in the context of the future) are customer satisfaction with what they received (current product) and what they expected (product they expected) [9,10,11]. Despite that, designing products is still a problem; therefore, a search for methods to solve this problem is needed.
After reviewing the literature, it was concluded that the House of Quality (HoQ) [12] i.e., Quality Function Deployment (QFD) [13], is the most popular and most-used method to design a satisfactory product [14,15,16,17,18]. This method is a correlation matrix. The method supports the process of design by collecting and verifying expectations, e.g., of customers and the producer, to achieve the required product quality level. Previous work as part of HoQ concerns mainly the validity (weights) of customer requirements, e.g., mainly as part of the use of the AHP method (Analytic Hierarchy Process) [15,19,20,21]. Also, as part of HoQ, the customers’ requirements were specified, mainly using the fuzzy Saaty scale and FAHP method (Fuzzy Analytic Hierarchy Process) [16,22,23]. For this purpose, the HoQ with the AHP method and the Kano model have been integrated relatively often [21,24,25], where the objective of this combination is to precisely determine the importance of customer expectations in the context of product satisfaction. This precision was achieved by using the 2-tuple linguistic [17], in which the customer’s needs were characterised by description and number, which is a distance of the central value of the linguistic term. Despite this, the importance of customers’ requirements in the HoQ was determined by implementing a mathematical model according to LGP (Linear Goal Programming), in which the ordinal scale was used [26]. Another example is a combination of the HoQ with the Yager algorithm [27] to determine customer requirement weights also in the case of indifferent requirements. Another example concerning the design of the expected product is the combination of the HoQ method with the TRIZ method (Theory of Innovative Problem Solving) [28,29,30]. This combination encompasses determining customers’ requirements and their expectations as part of providing a satisfactory product.
Based on a literature review in the context of the popular HoQ method, it was shown that it is known how to design a product [18,23,27,31] and also how to verify the importance of product attributes [15,16,19,22,32]. As shown, the QFD method is one of the most popular methods for transforming customer expectations into technical features of the product. It has been modified many times, but its attributes have not yet been used as a framework for predicting the ranking of pro-quality modifications to existing product attributes. Therefore, there is no method or transformation method that would indicate how to modify the product to meet customer expectations. Hence, a method to predict the pro-quality modification of product attributes, i.e., the modification (changes) of important product attributes for customers, that allows achieving the expectation of customers of the product quality level is needed. This prediction is passing, guessing, or expecting a satisfactory product. Therefore, the lack of this method has been recognised as a gap.
It is possible to create the main question as follows: How can we predict the pro-quality modification of product attributes to achieve a product quality level that satisfies customers?
Hence, the purpose of this study is to propose a method to predict the quality of product attribute modifications considering the current customers’ expectations. The proposed method is preferred to determine the order of product attribute changes based on customer information to achieve desired quality. Additionally, the method can provide the anticipation of beneficial activities of the manufacturer to achieve the product quality level expected by customers. The added value is the presentation of a method (according to the principles of the QFD method) according to which it is possible to predict which features of a product should be modified and how to achieve a competitive product. It is an original proposition to the application of the framework of the QFD method, which will support producers in making modifications to current product attributes ahead of the competition to design a product that is expected by customers. It is important to note that this method makes it easier to predict (in advance) what changes to make. Therefore, it provides time for appropriate preparatory activities for enterprises, and the achieved design results may be satisfactory to customers, which increases the accuracy of design decisions and, consequently, the quality level of the offered products.
The originality of the presentation of this method (according to the principles of the QFD method) regards its ability to predict which features of the product should be modified and how to achieve a competitive product.
The developed method is presented in the following parts of the article (Section 2). The method was characterised in ten main stages, taking into account the assumptions adopted for the method. The characteristics include a general methodology, so it can be used for any product. Section 3 tests and illustrates the method using the example of a home vacuum cleaner. The method test is presented stage by stage, as adopted in the general description of the method. Section 4 is the discussion, where the analysis is further deepened based on comparisons of the results obtained from the method test. The main advantages of the method, business implications, and limitations and directions for future research are presented. Section 5 is a summary covering the main findings of the study.
2. Materials and Methods
The method aims to predict the pro-quality modifications of product attributes considering current customers’ expectations. The method was developed by transforming the House of Quality in the context of considering the current and future expectations of customers of the state of product attributes. A mathematical model was implemented to calculate the quality of attribute states and their importance. Additionally, the method allows one to make the product features dependent on their importance (weights). As a result, it is possible to rank the product attribute changes and also to predict expectations of the product quality level.
The structure of the research is as follows. The analysis of the product selected for the research is based on the customer requirements, which are obtained as part of the research of the survey. Customers rate the importance of product criteria and their satisfaction with these criteria in the current state and the proposed modified state (above and below the current state). These requirements are processed in subsequent stages of the method. Initially, the criteria important for the client are determined according to the Pareto–Lorenz principle. Pro-quality activities are planned for these important criteria. Then, the quality level is calculated for the current state of the product criteria and their modifications, and the impact of modifying the current values of the product attributes is estimated. A mathematical model developed for this purpose is used. As a result, a ranking of modifications of important product features is obtained in order to achieve the expected level of product quality. On this basis, a pro-quality modification of the product is planned, i.e., one that meets customer expectations.
The algorithm of the proposed method and the zones in a new House of Quality is shown in Figure 1.
The method in ten main stages was designed as follows:
Stage 1. Determining the purpose of the research.
Stage 2. Acquiring the customer’s requirements.
Stage 3. Determining important product attributes based on customer expectations (II zone in HoQ).
Stage 4. Noting the current and modification values for important product attributes (I and V zones in HoQ).
Stage 5. Calculating the quality of product attributes on a point scale (III and VII zones in HoQ).
Stage 6. Calculating the quality of product attributes considering the weights of attributes (IV and VIII zones in HoQ).
Stage 7. Calculating the quality changes in the current product attribute values (IX zone in HoQ).
Stage 8. Calculating product quality for current important product attribute values (X zone in HoQ).
Stage 9. Calculating the impact of the attribute values of the modification of the current product (XI zone in HoQ).
Stage 10. Predicting the modification of the pro-quality product (XII zone in HoQ).
The short characteristic of the method stages is shown in the next part of the article.
2.1. Stage 1: Determining the Purpose of the Research
As part of determining the purpose, it is necessary to use the SMART method (Specific, Measurable, Achievable, Relevant, Time-bound) [33]. In the proposed approach, the purpose is to predict a high-quality modification of product attributes.
2.2. Stage 2: Acquiring the Customers’ Requirements
This purpose of this stage is to acquire customers’ requirements, that is, Voice of Customers (VoC) [34,35] about product attributes. To achieve this, it is possible to use survey research, which is the most popular approach [7,36,37], with scoring on a Likert scale [26,38]. The sample size to predict expected product quality is preferably determined according to the method shown in [9]. Customers should be the users of the product. Furthermore, the entity that uses the proposed method should select the area of research depending on the market in which it will offer its modified product. As part of acquiring customers’ requirements, determining the importance (weights) of product attributes, e.g., in the context of use of the product, should be allowed. Additionally, the customers’ requirements have to refer to assessments of customer satisfaction of current product attributes and their modifications. For this reason, the characteristics of the product to be tested are initially defined. The selection of product attributes can be made based on the product catalogue (specification) by determining 14 to 25 attributes [19,39,40]. Next, by using a catalogue of a product, the current and modification values, e.g., values or range of values (parameters), must be noted for each attribute. The current value is the current state of the attribute. In turn, the modification value is the predicted state (future, not existing at present). From the obtained customers’ requirements, the important attributes for customers will be selected, i.e., which attributes will have the greatest importance for product level quality.
2.3. Stage 3: Determining the Important Product Attributes Based on Customers’ Expectations (II Zone in HoQ)
This purpose of this stage is to determine the attributes that are important (significant) to customers in the context of using the product. For these attributes, the pro-quality changes of the product features are predicted. The important features for customers are chosen based on the weights of product attributes according to the Pareto rule (20/80), i.e., even a small number of important attributes has a significant impact on product quality, where the impacts of other attributes are less [41]. This stage is shown in five main steps.
2.3.1. Step 3.1: Determining the Weights of Attributes
For each product attribute, the weights are calculated as an arithmetic average from assessments of the importance of the product attributes (1):
where Aw is the arithmetic average of the product attribute weights, w is the customer assessment of product attribute importance, n is the number of assessments, and i = 1, 2, 3, …, n.
The application of the arithmetic average results from the fact that it is an unencumbered estimator [42], and at the same time it has the highest reliability of the value of the expected random variable when the number of events is large enough (>100) or the distribution of the variable is normal. The median is better if a small number of observations is obtained or the distribution is not normal, e.g., there are outliers.
2.3.2. Step 3.2: Ordering the Product Attribute Weights
The first stage is to order the weights of the product attributes. For this purpose, it is necessary to sort in descending order the weights of the attributes of the product [41].
2.3.3. Step 3.3: Calculating Cumulative Values of Product Attribute Weights
Cumulative values are calculated on the basis of ordered values of product attribute weights. The first value is equal to the maximum value of the weight of the attribute of the product (2):
In turn, other cumulative values are calculated with Equation (3):
where C1 is the first value of the cumulative values, is the maximum product attribute weight, Aw is the product attribute weight, and i = 2, 3, 4, …, n.
The cumulative values of product attribute weights are calculated for all ordered values of product attribute weights.
2.3.4. Step 3.4: Calculating the Percentage Cumulative Values of Product Attribute Weights
The percentage cumulative values of the product attribute weights [43,44] are based on the cumulative values from Section 2.3.2. For this purpose, the following Equation (4) is used:
where C% is the percentage cumulative value of the product attribute weight, C is the cumulative value of the product attribute weight, Cmax is the maximum cumulative value of all product attribute weights, and i is 1, 2, 3, …, n.
The percentage cumulative values of the product attribute weights should be calculated for all cumulative values of the product attribute weights.
2.3.5. Step 3.5: Selecting the Product Attributes Important to Customers
The selection of features is made on the basis of the percentage values of cumulative product feature weights. For this, the Pareto rule (20/80) is used [43,44].
The percentage cumulative value of the weight of the product attribute close to 20% determines the group of important product attributes (GI) and the group of unimportant attributes for the customer (GN) (5):
where C% is the percentage cumulative value of the product attribute weight, i = 1, 2, 3, …n, GI is the group of important product attributes, and GN is the group of unimportant attributes.
2.4. Stage 4: Noting the Current and Modification Values for Important Product Attributes (I and V Zones in HoQ)
The purpose of the fourth stage is to note the current and modification values for important product attributes. It refers to filling the I zone of the HoQ by current attribute values and filling the V zone of the HoQ by values of the modification of these attributes. These values were determined in the second stage of the method.
2.5. Stage 5: Calculating the Quality of Product Attributes on a Point Scale (III and VII Zones in HoQ)
The purpose of the fifth stage is to calculate the quality of the attributes of the product on a point scale. It refers to determining the sum of the points that the customers have given to important attributes of the product (in stage 2). The quality (current or modified) of the product attribute on a point scale is expressed by Equation (6):
where P is the points given by customers, c is the current product attribute value, m is the modification product attribute value, and i = 1, 2, 3, …, n.
The quality of the current product attribute is noted in the III zone of the HoQ. In turn, the quality of the modified product attribute is noted in the VII zone of the HoQ.
2.6. Stage 6: Calculating the Quality of Product Attributes Considering Weights of Attributes (IV and VIII Zones in HoQ)
The purpose of the sixth stage is to calculate the quality of the attributes of the product considering the weights of the attributes. This stage refers to calculating the quality for each of the important attributes of the product. This quality is determined for current attributes (IV zone in HoQ) and for their modifications (VIII zone of HoQ).
The quality of the current product attribute is estimated as the quotient of the attribute weight and the sum of the customers’ assessments, which refers to satisfaction with the current value of this attribute (7):
where Aw is the weight of the product attribute, S is the quality of the product attribute, c is the current product attribute, and i = 1, 2, 3, …, n.
The quality of the modification product attribute is estimated as the quotient of the attribute weight and the sum of the customers’ assessment, which refers to satisfaction with the modified value of this attribute (8):
where Aw is the weight of the product attribute, S is the quality of the product attribute, m is the modification of the product attribute value, and i = 1, 2, 3, …, n.
The obtained quality values of important current and modified product attributes are noted, respectively, in the IV and VIII zones of the HoQ.
2.7. Stage 7: Calculating the Changes in Quality of Current Product Attribute Values (IX Zone in HoQ)
The purpose of the seventh stage is to calculate the quality changes in the current product attribute values (IX zone in HoQ). This refers to a comparison of the quality of the current and modified product considering the weights of these attributes, that is, (9):
where Q is the quality of the product attribute, Aw is the weight of the product attribute, c is the current value of the product attribute, m is the modified value of the product attribute, and i = 1, 2, 3, …, n.
The obtained values are noted in the IX zone of the HoQ.
2.8. Stage 8: Calculating the Product Quality for Current Important Product Attribute Values (X Zone in HoQ)
The purpose of the eighth stage is to calculate the quality of the product via the values of the current important attributes of the product. The quality of the product regarding the current values of the important product attributes is obtained from Equation (10):
where Q is the quality of the product attribute, Aw is the weight of the product attribute, c is the current value of the product attribute, and i—1, 2, 3…, n.
Based on the product quality for the current values of important product attributes, it is possible to estimate the changes (impact) in the modification of these attribute values. This is shown in the next stage of the method.
2.9. Stage 9: Calculating the Impact of Modification of Current Product Attribute Values (XI Zone in HoQ)
The purpose of stage nine is to calculate the impact of the modification of current product attribute values. This refers to determining the ratio of the change value of the current attribute quality to the level of quality of the modification. The purpose is to determine the relevance of changing the current product attribute value to the modified value, i.e., (11):
where J is the quality of the attribute value, I is the quality of current attribute values, and i is 1, 2, 3…, n.
The higher the value of , the greater (more beneficial) the impact of modifying the current value of the product feature from the customer’s point of view.
2.10. Stage 10: Predicting the Pro-Quality Product Modification (XII Zone in HoQ)
The tenth stage predicts the modification of the product. The purpose of this stage is to create a ranking of the modification of important product attributes as part of achieving the expected level of product quality. It consists of arranging in descending order the value of the impact of modifying the current product attribute value (from the XI zone of the HoQ). The first position, the maximum value, is the priority modification, i.e., the most important in the view of the customers, which ensures a significant increase in product satisfaction.
Based on ranking, it is possible to predict which attributes should be primarily modified and also which attributes allow the achievement of a quality product. Because in the research important product attributes were included, it is assumed that each modification has a significant impact on the level of product quality. However, it is possible to schedule these modifications depending on the manufacturer’s needs and the company’s production capacity.
It should be remembered that the proposed method is a possible alternative for managers to support themselves in the decision-making process related to product improvement. Since the proposed method refers to potential prototypes of the same product, the results were not verified in comparison to those of other methods. Other methods operate according to different assumptions. Depending on the assumptions made, appropriate to the analysed product, the decision maker selects the appropriate method, and the selected method leads to suggestions regarding solutions that modify the product.
3. Results
The test research for the method was conducted using an example of a domestic vacuum cleaner. The vacuum cleaner test presented in this article should be treated as a pilot study. It shows the possibility of using the proposed methodology. The choice of the vacuum cleaner was based on its availability and universality, and it is a widely known and used product. As part of the first stage, the purpose of the research was determined, i.e., to predict the quality of the modification of vacuum cleaner attributes considering the expectations of current customers. According to the second stage, the customer expectations about product attributes were acquired. The survey was conducted electronically using MS Forms. The customers were people who used the vacuum cleaner, and therefore their opinions were considered relatively trustworthy. Research samples of 166 customers were obtained, and this sample size was a preliminary sample (for pilot studies). The sample size was calculated based on the method presented in [9]. Furthermore, following the authors of the studies [44], it was considered sufficient within the proposed method. A certain limitation was collecting information from respondents coming only from Poland and mainly from customers belonging to the Z formation. Customers’ expectations were acquired as part of a survey using the five-point Likert scale. According to the assumptions obtained in the second stage of the method, the product was described by 20 attributes. The attributes were selected as part of brainstorming (BM) based on a product catalogue. Five employees familiar with the product participated in the brainstorming session. These were managers from the production plant whose knowledge and experience related to the product are the greatest. They know the real scope of product improvement possibilities but also know about the current, successful, and unsuccessful areas of improvement. However, in the future, the user of this proposed method will decide who will work in the brainstorming session because this is a very important decision. The research included the stage of satisfaction assessment with the current and modified values of the product features and the stage of determining the validity (weights) of the product attributes.
The current product attribute was determined by values and the metric unit according to the product specifications. In turn, the modifications of the product attributes were determined as values above and below current states. The customers’ expectations were reliably obtained by comparing the current value with the modified value. Then, according to the third stage of the method, the important attributes of the product were determined. For these attributes, in the next part, the pro-quality changes were predicted. These attributes were selected using the Pareto (20/80) rule. Initially, for each of the product attributes, the weights were calculated as an arithmetic average of customers’ assessments of the importance of product attributes. Subsequently, the attribute weights were ordered in descending order, and cumulative values and percentages of product feature weights were calculated. Then, according to the 20/80 rule, the important attributes and the unimportant attributes for the customers were selected. The results are shown in Table 1.
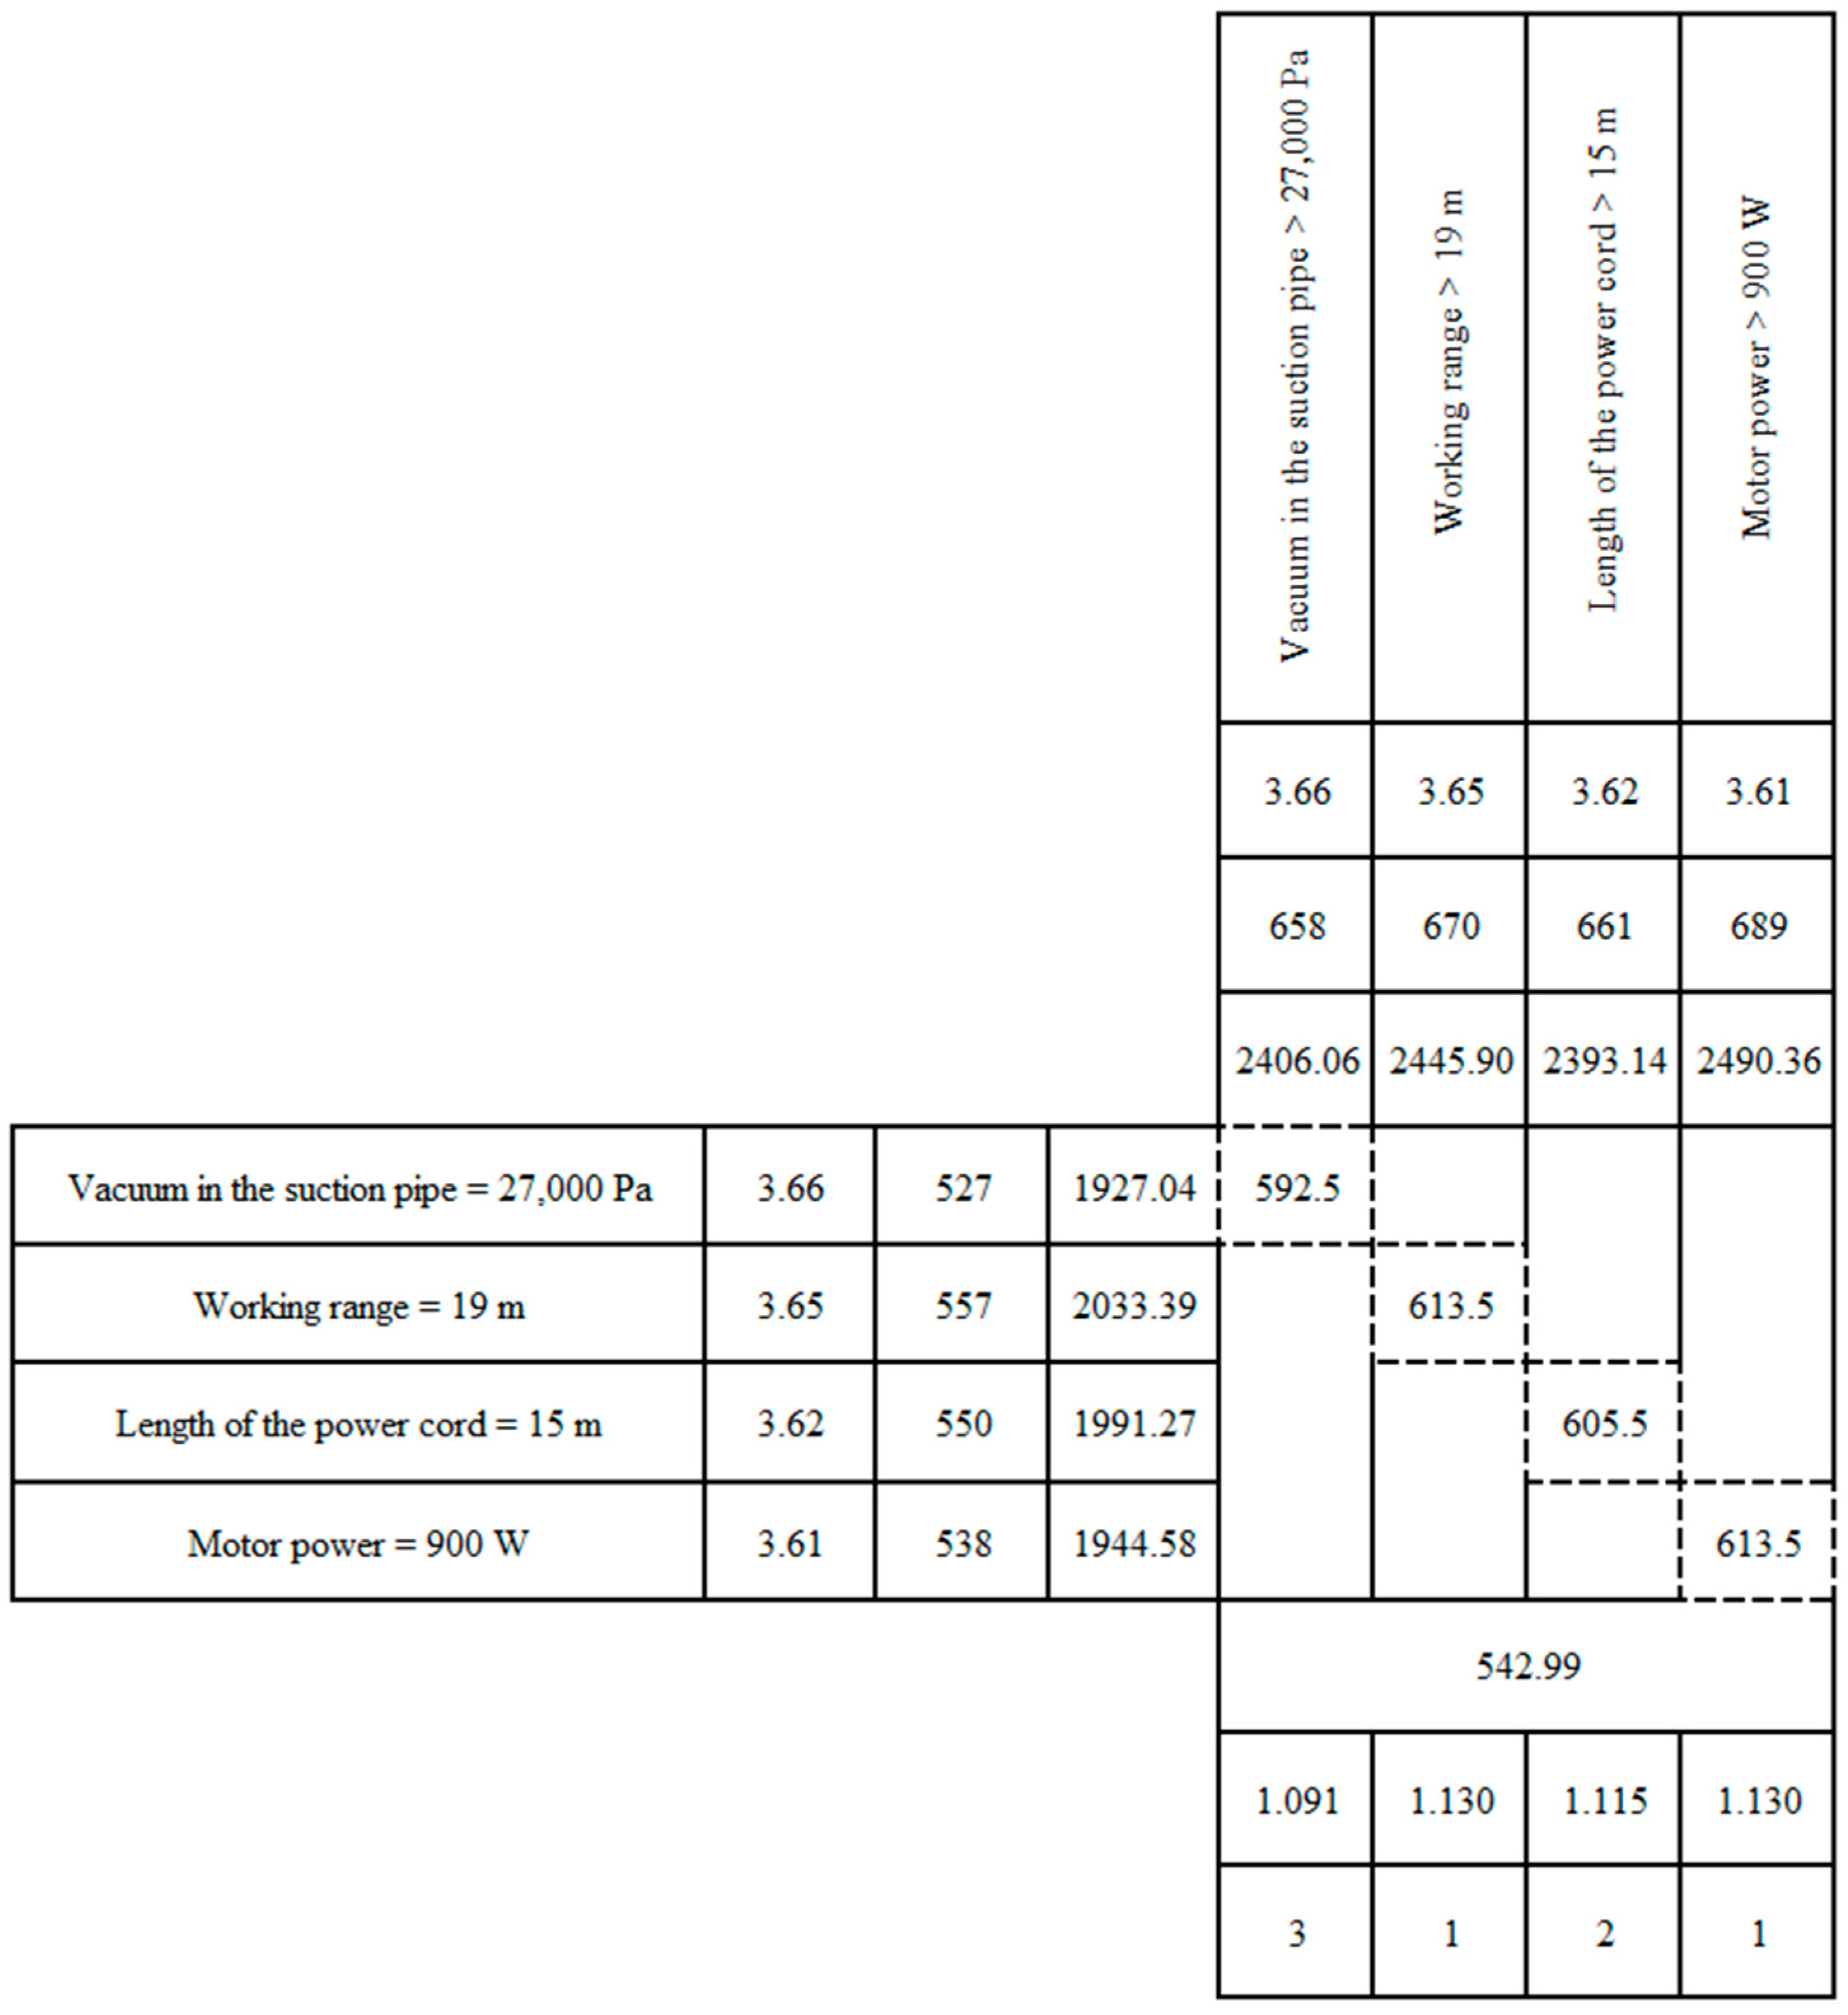
The important product attributes were the vacuum in the suction pipe, working range of the vacuum cleaner connected to the power cord, length of the power cord, and vacuum cleaner motor power. The weights of important attributes for customers were noted in the II zone of the HoQ, that is, (12):
where Aw the weight of the product attribute, and 1, …, 4 is the number of attributes.
According to the fourth stage, the weights of important product attributes were described as current values (I zone of the HoQ) and modification of these values (V zone of the HoQ). The modification values of the product attributes were noted for the product state that was more favourably assessed by the customers (had a higher number of total points, which meant greater customer satisfaction). Subsequently, in the fifth stage, the quality of the product state was estimated on a point scale. For this purpose, the sum of points granted by customers for important product values was calculated (13):
where Sc is the quality of the current product attribute on a point scale, Sm is the quality of the modified product attribute on a point scale, and 1, …, 4 is the number of attributes.
In the III zone of the HoQ, the number of points obtained for the current values was noted, and in the VII zone of the HoQ, the number of points obtained for the modification values was noted. According to the sixth stage, the quality of the attributes of the product was estimated considering the weights of the attributes (14):
where Qc is the quality of the current product attribute value, Qm is the quality of the modification product attribute value, and 1, …, 4 is the number of attributes.
The results were observed in the IV and VIII zones of the HoQ. Then, as shown in the seventh stage, the changes in quality of the current product attribute values were estimated (15):
where J is the change in quality of the current product attribute values and 1, …, 4 is the number of attributes.
The changes in the quality of the current product attribute values as part of converting them to modification product attribute values were observed in the IX zone of the HoQ. Next, as part of the eighth stage of the method, the quality of the product was estimated for the current important attribute values (16):
The estimated product quality for the current important attribute values was noted in the X zone of the HoQ. Then, as in the nine stages of the method, the influence of the modification of the current attribute values was estimated (17). The values obtained were noted in the XI zone of the HoQ:
In the last stage of the method, the pro-quality modifications of the product were predicted. In this stage, the ranking (order) of the product attribute changes was predicted in the context of achieving the expected product quality level. It was considered that in the first order, the working range (above 19 m) and motor power (above 900 W) should be changed. It has been predicted that making changes to these attributes allows an expected increase in the product quality level. Then, it is necessary to consider changing the length of the power cord to above 15 m and the vacuum in the suction pipe to above 27,000 Pa. It is possible to consider the simultaneous modification of several product features, where this decision depends on the needs of the manufacturer and the company’s production capabilities. The ranking of the predicted order of modifications of product attributes in the XII zone of the HoQ was observed. The new House of Quality designed to predict the pro-quality modification of the product attributes is shown in Figure 2.
Depending on the needs, it is possible to modify the presented House of Quality. For example, additional space in the HoQ can be filled with complaints or competitive products.
The test of the method shows that the proposed methodology is applicable to determining the ranking of potential product prototypes. This ranking would advise decision makers of which variants of the modified product would be most desired by customers and would be rated the highest. The proposed methodology can also be applied to intangible products, i.e., services. The proposed calculations are not complex and can be performed using a computer, significantly increasing the possibility of repeated use of the proposed method not only for one product but even for different products.
4. Discussion
As part of the test of the proposed method, the differences obtained between the estimated values were verified. It was shown that the values of the modification of the current product attributes (XI zone of the HoQ) and also the ranking of the predicted changes in the attributes (XII zone of HoQ) are characterised by slight differences.
It was concluded that relatively minor differences between the values of the predicted pro-quality modification of the product attributes resulted from minor differences between the values of the current product attribute levels, the values of the modification of the product attribute levels, and the product attribute weights. The differences between the values, which have an impact on the results of the method, are shown in Figure 3.
The quality level of the attributes of the current product is relatively high. Despite that, the differences between the values of the current and modified attributes are important from a customer’s point of view. The difference between the maximum current attribute value (557) and the maximum modification of the attribute value (689) is about 132 points. This is an increase in product quality of about 20%. Hence, the obtained values allow us to estimate the increase in the current product quality level after modification. The main advantages of the proposed method are as follows:
- Predicting pro-quality modifications of product attributes;
- Predicting product attribute changes based on current customers’ expectations;
- Predicting the growth in the product quality level depending on product attribute modifications;
- Creating a ranking of product attribute modifications;
- Determining important product attributes and their modifications;
- Designing a product by including the importance of product attributes and the quality level of these attributes (current and modified);
- Supporting enterprise actions in the pro-quality design of a product.
- Additionally, the proposed method has the following business implications:
- Providing a low-cost method for designing important customer changes in an existing product;
- Predicting in advance a satisfactory product that will be competitive in the market;
- Making the right decisions about the need to modify product attributes and their order;
- Waste reduction, e.g., unnecessary changes to the product and time spent on strategic actions;
- An accurate definition of customer expectations.
- There are also disadvantages of the proposed method, as follows:
- The possibility of the occurrence of small differences (or a lack thereof) between predicted values, which generates a problem in creating ranking;
- A lack of a complex analysis of all product attribute values, which determines the lack of precision in determining the product quality level after modification;
- Creating voluminous matrices of HoQ, e.g., as a result of analysing a large number of product features.
A certain limitation of the method is the assumption that for all attributes, the modifications occur as values above and below the current state. This resulted from the assumptions regarding the uniformity of the method. The departure from this principle may constitute the basis for a new, perhaps even more utilitarian, attractive method. This would constitute an improvement of the currently proposed method and perhaps become the basis for further research. Improvements in the methodology should concern the analysis of a larger number of criteria, which is somewhat of a limitation of the current proposal. This is due to the fact that the number of criteria increases the number of possible modifications of these criteria to be considered, and thus the House of Quality becomes extensive, and the results obtained may be problematic in a comprehensive analysis. However, to solve this problem, we plan to develop several connected quality houses. As part of future research, we also plan to implement sustainable development criteria that will ensure prediction not only of product quality but also of the environmental impact or price changes depending on alternative product solutions. This is a challenge, but the proposed method, as well as the House of Quality itself, can be modified and extended, including by combining it with other techniques. At the same time, this is its advantage and versatility, not only in practice but also as an inspiration for other researchers. Also, as part of future research, we plant to extend of proposed House of Quality, e.g., by including subsequent modifications of product attributes, by including a transformation of assessments in the Saaty scale to reduce uncertainty in customers’ assessments, or by implementing the method in software.
5. Conclusions
In a competitive environment, it is reasonable to look for various solutions to improving products. This mainly concerns shaping the current features of products as part of customising them to customers’ expectations. However, designing a satisfactory product ahead of the competition is still a problem. This refers to the prediction of the quality level of the expected product, which can be designed based on the current customer expectations. For this purpose, a method was proposed to predict the pro-quality modification of product attributes considering current customers’ expectations. The method was developed by transforming the House of Quality in the context of considering the values of the attributes of the current and expected product.
The proposed method was tested by using a domestic vacuum cleaner as an example. The purpose was to predict the quality of the modification of the attributes of the vacuum cleaner considering the expectations of current customers. By using a survey and the Likert scale, the requirements of 166 customers were obtained. In the research, 20 attributes of the vacuum cleaner were included, for which the customers assessed their satisfaction with the current and modified values of the features. In addition, customers determined the importance (weights) of the product attributes. According to the Pareto rule, the important attributes were selected. The important product attributes were the vacuum in the suction pipe, working range of the vacuum cleaner connected to the power cord, length of the power cord, and vacuum cleaner motor power. For these attributes, the current and favourable modification values were determined. As part of the calculation model, the quality of the product attributes was estimated. In addition, the importance and influence of the modification of the current product attribute values were estimated. As a result, the pro-quality product modifications were predicted. Therefore, a classification (order) of the changes of the product attributes in the context of achieving the expected level of product quality was predicted. It has been predicted that in the first order, the working range (above 19 m) and motor power (above 900 W) should be changed. The change in these attributes allows for an expected increase in the product quality level. The next anticipated changes were length of the power cord to above 15 m and then vacuum in the suction pipe to above 27,000 Pa. Herein, the manufacturer has the final decision as to which of the product attribute modifications will be implemented.
The test of the method allowed us to confirm that it is possible to design a new House of Quality to predict a ranking of the pro-quality modification of the current product attributes. Also, it is possible to predict which of the product attributes are most important and how to modify the design of the product to advance its satisfaction. Therefore, the proposed method can support manufacturers in designing competitive products that in the future will be satisfactory to customers.
Author Contributions
Conceptualization, D.S. and A.P.; methodology, A.P. and D.S.; software, D.S. and A.P.; validation, A.P. and D.S.; formal analysis, D.S. and A.P.; investigation, A.P. and D.S.; resources, D.S. and A.P.; data curation, A.P. and D.S.; writing—original draft preparation, D.S. and A.P.; writing—review and editing, D.S.; visualization, D.S. and A.P.; supervision, A.P. and D.S.; project administration, A.P. and D.S.; funding acquisition, A.P. All authors have read and agreed to the published version of the manuscript.
Funding
This research received no external funding.
Data Availability Statement
The data are included in the article or may be sent upon request to the corresponding author.
Conflicts of Interest
The authors declare no conflicts of interest.
References
- Pacana, A.; Gazda, A.; Dušan, M.; Štefko, R. Study on Improving the Quality of Stretch Film by Shainin Method. Przem. Chem. 2014, 93, 243–245. [Google Scholar]
- Pacana, A.; Siwiec, D. Method of Determining Sequence Actions of Products Improvement. Materials 2022, 15, 6321. [Google Scholar] [CrossRef]
- Gawlik, R. Preliminary Criteria Reduction for the Application of Analytic Hierarchy Process Method. In Evolution and Revolution in the Global Economy: Enhancing Innovation and Competitiveness Worldwide; Fuxman, L., Delener, N., Lu, V., Rivera-Solis, L., Eds.; Global Business and Technology Association: New York, NY, USA, 2008. [Google Scholar]
- Li, W.; Pomegbe, W.W.K.; Dogbe, C.S.K.; Novixoxo, J. Dela Employees’ Customer Orientation and Customer Satisfaction in the Public Utility Sector. Afr. J. Econ. Manag. Stud. 2019, 10, 408–423. [Google Scholar] [CrossRef]
- Siwiec, D.; Pacana, A. A New Model Supporting Stability Quality of Materials and Industrial Products. Materials 2022, 15, 4440. [Google Scholar] [CrossRef] [PubMed]
- Realyvásquez-Vargas, A.; Arredondo-Soto, K.; Carrillo-Gutiérrez, T.; Ravelo, G. Applying the Plan-Do-Check-Act (PDCA) Cycle to Reduce the Defects in the Manufacturing Industry. A Case Study. Appl. Sci. 2018, 8, 2181. [Google Scholar] [CrossRef]
- Ali, A.; Hafeez, Y.; Hussain, S.; Yang, S. Role of Requirement Prioritization Technique to Improve the Quality of Highly-Configurable Systems. IEEE Access 2020, 8, 27549–27573. [Google Scholar] [CrossRef]
- Kwong, C.K.; Bai, H. A Fuzzy AHP Approach to the Determination of Importance Weights of Customer Requirements in Quality Function Deployment. J. Intell. Manuf. 2002, 13, 367–377. [Google Scholar] [CrossRef]
- Kowalska, M.; Pazdzior, M.; Krzton-Maziopa, A. Implementation of QFD method in quality analysis of confectionery products. J. Intell. Manuf. 2018, 29, 439–447. [Google Scholar] [CrossRef]
- Gajdzik, B.; Wolniak, R. Smart Production Workers in Terms of Creativity and Innovation: The Implication for Open Innovation. J. Open Innov. Technol. Mark. Complex. 2022, 8, 68. [Google Scholar] [CrossRef]
- Ostasz, G.; Siwiec, D.; Pacana, A. Model to Determine the Best Modifications of Products with Consideration Customers’ Expectations. Energies 2022, 15, 8102. [Google Scholar] [CrossRef]
- Perezanovic, T.; Petrovic, M.; Bojkovic, N.; Pamucar, D. One approach to evaluate the influence of engineering characteristics in QFD method. Eur. J. Ind. Eng. 2019, 13, 299–331. [Google Scholar] [CrossRef]
- Wolniak, R. The Use of QFD Method Advantages and Limitation. Prod. Eng. Arch. 2018, 18, 14–17. [Google Scholar] [CrossRef]
- Ding, Y.; Niu, L.; Chen, Y.; Wang, M. Study on the Defect Structure of Carbon-Doped ZnO Materials. Cryst. Res. Technol. 2023, 58, 2300015. [Google Scholar] [CrossRef]
- Ellman, A.; Wendrich, R.; Tiainen, T. Innovative Tool for Specifying Customer Requirements. In Proceedings of the Volume 1B: 34th Computers and Information in Engineering Conference, Buffalo, NY, USA, 17–20 August 2014; American Society of Mechanical Engineers: New York, NY, USA, 2014. [Google Scholar]
- Geng, L.; Geng, L. Analyzing and Dealing with the Distortions in Customer Requirements Transmission Process of QFD. Math. Probl. Eng. 2018, 2018, 4615320. [Google Scholar] [CrossRef]
- Li, M. The Extension of Quality Function Deployment Based on 2-Tuple Linguistic Representation Model for Product Design under Multigranularity Linguistic Environment. Math. Probl. Eng. 2012, 2012, 989284. [Google Scholar] [CrossRef]
- Wang, H.; Wang, D.; Wang, P.; Fang, Z. A Novel Quality Risk Evaluation Framework for Complex Equipment Development Integrating PHFS-QFD and Grey Clustering. Grey Syst. Theory Appl. 2024, 14, 144–159. [Google Scholar] [CrossRef]
- Huang, Y.M. On the General Evaluation of Customer Requirements During Conceptual Design. J. Mech. Des. 1999, 121, 92–97. [Google Scholar] [CrossRef]
- El Badaoui, M.; Touzani, A. AHP QFD Methodology for a Recycled Solar Collector. Prod. Eng. Arch. 2022, 28, 30–39. [Google Scholar] [CrossRef]
- Li, Y.; Tang, J.; Luo, X.; Xu, J. An Integrated Method of Rough Set, Kano’s Model and AHP for Rating Customer Requirements’ Final Importance. Expert Syst. Appl. 2009, 36, 7045–7053. [Google Scholar] [CrossRef]
- Aoyama, K.; Matsuda, N.; Koga, T. A Design Method of Product Family for Unpredictable Customer Requirements Using Fuzzy Sets. In New World Situation: New Directions in Concurrent Engineering: Proceedings of the 17th ISPE International Conference on Concurrent Engineering, Taipei, Taiwan, 6–10 September 2010; Springer: London, UK, 2010; pp. 193–201. [Google Scholar]
- Liu, Y.; Zhou, J.; Chen, Y. Using Fuzzy Non-Linear Regression to Identify the Degree of Compensation among Customer Requirements in QFD. Neurocomputing 2014, 142, 115–124. [Google Scholar] [CrossRef]
- Sun, N.; Mei, X.; Zhang, Y. A Simplified Systematic Method of Acquiring Design Specifications From Customer Requirements. J. Comput. Inf. Sci. Eng. 2009, 9, 031004. [Google Scholar] [CrossRef]
- YAMAGISHI, K.; SEKI, K.; NISHIMURA, H. Requirement Analysis Considering Uncertain Customer Preference for Kansei Quality of Product. J. Adv. Mech. Des. Syst. Manuf. 2018, 12, JAMDSM0034. [Google Scholar] [CrossRef]
- Wang, Y.-M.; Chin, K.-S. A Linear Goal Programming Approach to Determining the Relative Importance Weights of Customer Requirements in Quality Function Deployment. Inf. Sci. 2011, 181, 5523–5533. [Google Scholar] [CrossRef]
- Franceschini, F.; Maisano, D.; Mastrogiacomo, L. Customer Requirement Prioritization on QFD: A New Proposal Based on the Generalized Yager’s Algorithm. Res. Eng. Des. 2015, 26, 171–187. [Google Scholar] [CrossRef]
- Hameed, A.Z.; Kandasamy, J.; Aravind Raj, S.; Baghdadi, M.A.; Shahzad, M.A. Sustainable Product Development Using FMEA ECQFD TRIZ and Fuzzy TOPSIS. Sustainability 2022, 14, 14345. [Google Scholar] [CrossRef]
- Melemez, K.; Di Gironimo, G.; Esposito, G.; Lanzotti, A. Concept Design in Virtual Reality of a Forestry Trailer Using a QFD-TRIZ Based Approach. Turk. J. Agric. For. 2013, 37, 789–801. [Google Scholar] [CrossRef]
- Wang, C.; Zhao, W.; Wang, Z.; Zhang, K.; Li, X.; Guo, X. Innovative Design Strategy Based on Customer Requirements. Open Mech. Eng. J. 2014, 8, 930–935. [Google Scholar] [CrossRef]
- Sun, S. The Availability Improvement of CNC Machine Tool Based on DEMATEL–ISM–QFD Integration Method. Int. J. Interact. Des. Manuf. (IJIDeM) 2023, 17, 69–77. [Google Scholar] [CrossRef]
- Ginting, R.; Ishak, A. An Integrated of AHP-QFD methodology for Product Design: A review. J. Ilm. Tek. Indsutri 2020, 8, 69–78. [Google Scholar] [CrossRef]
- Edwards, W.; Barron, F.H. SMARTS and SMARTER: Improved Simple Methods for Multiattribute Utility Measurement. Organ. Behav. Hum. Decis. Process. 1994, 60, 306–325. [Google Scholar] [CrossRef]
- Ostasz, G.; Siwiec, D.; Pacana, A. Universal Model to Predict Expected Direction of Products Quality Improvement. Energies 2022, 15, 1751. [Google Scholar] [CrossRef]
- Sakao, T. A QFD-centred design methodology for environmentally conscious product design. Int. J. Prod. Res. 2007, 45, 4143–4162. [Google Scholar] [CrossRef]
- Chen, C.-H.; Khoo, L.P.; Yan, W. Evaluation of Multicultural Factors from Elicited Customer Requirements for New Product Development. Res. Eng. Des. 2003, 14, 119–130. [Google Scholar] [CrossRef]
- Li, Z.; Tian, H. Research on Fuzzy Hierarchy Optimization Model of Product Family Parameters Based on Flexible Design of Clothing. IOP Conf. Ser. Mater. Sci. Eng. 2019, 573, 012002. [Google Scholar] [CrossRef]
- van de Poel, I. Methodological problems in QFD and directions for future development. Res. Eng. Des. 2007, 18, 21–36. [Google Scholar] [CrossRef]
- Hansen, E.; Bush, R.J. Understanding Customer Quality Requirements. Ind. Mark. Manag. 1999, 28, 119–130. [Google Scholar] [CrossRef]
- Siwiec, D.; Pacana, A. Model of Choice Photovoltaic Panels Considering Customers’ Expectations. Energies 2021, 14, 5977. [Google Scholar] [CrossRef]
- Hoła, A.; Sawicki, M.; Szóstak, M. Methodology of Classifying the Causes of Occupational Accidents Involving Construction Scaffolding Using Pareto-Lorenz Analysis. Appl. Sci. 2018, 8, 48. [Google Scholar] [CrossRef]
- Mishra, P.; Pandey, C.; Singh, U.; Keshri, A.; Sabaretnam, M. Selection of Appropriate Statistical Methods for Data Analysis. Ann. Card. Anaesth. 2019, 22, 297. [Google Scholar] [CrossRef]
- Yazdani, M.; Hashemkhani, S.; Zavadskas, E. New integration of MCDM methods and QFD in the selection of green suppliers. J. Bus. Econ. Manag. 2016, 17, 1097–1113. [Google Scholar] [CrossRef]
- Lestyánszka Škůrková, K.; Fidlerová, H.; Niciejewska, M.; Idzikowski, A. Quality Improvement of the Forging Process Using Pareto Analysis and 8D Methodology in Automotive Manufacturing: A Case Study. Standards 2023, 3, 84–94. [Google Scholar] [CrossRef]
Figure 1.
Algorithm to predict the pro-quality modification of product attributes considering the expectations of the current customers and the visualisation zones of the new House of Quality.
Figure 1.
Algorithm to predict the pro-quality modification of product attributes considering the expectations of the current customers and the visualisation zones of the new House of Quality.

Figure 2.
The new House of Quality to predict pro-quality modification of product attributes considering current customers’ expectations.
Figure 2.
The new House of Quality to predict pro-quality modification of product attributes considering current customers’ expectations.

Figure 3.
Difference between main values of the method.


Table 1.
Pareto–Lorenz analysis for product attribute weights.
| No. | Product Attribute (A) | Attribute Weight (Aw) | Cumulative Value (C) | Percentage Cumulative Value (C%) | Group of Product Attributes |
|---|---|---|---|---|---|
| 1 | Vacuum in the suction pipe | 3.66 | 0.06 | 6.04 | Group of important product attributes (GI) |
| 2 | Working range of the vacuum cleaner connected to the power cord | 3.65 | 0.12 | 12.07 | |
| 3 | Length of the power cord | 3.62 | 0.18 | 18.06 | |
| 4 | Vacuum cleaner motor power | 3.61 | 0.24 | 24.03 | |
| 5 | The noise level during operationof the vacuum cleaner | 3.36 | 0.30 | 29.58 | Group of unimportant attributes for customers (GN) |
| 6 | Power cord winding system | 3.33 | 0.35 | 35.09 | |
| 7 | Vacuum tank capacity | 3.16 | 24.40 | 40.31 | |
| 8 | Thermal protection (against overheating) | 3.13 | 27.53 | 45.49 | |
| 9 | Type of vacuum cleaner dust filter | 3.08 | 30.61 | 50.57 | |
| 10 | Rubber protectors to protect furniture against knocking | 3.04 | 33.65 | 55.60 | |
| 11 | Number of accessories included with the vacuum cleaner (suction tubes and nozzles) | 3.02 | 36.67 | 60.59 | |
| 12 | Length of the suction pipe | 2.84 | 39.51 | 65.28 | |
| 13 | Vacuum bag type | 2.84 | 42.35 | 69.97 | |
| 14 | Weight of the vacuum cleaner | 2.77 | 45.11 | 74.54 | |
| 15 | Dimensions of the vacuum cleaner | 2.73 | 47.85 | 79.06 | |
| 16 | Possibility to control the vacuum cleaner vacuum in the working handle | 2.69 | 50.54 | 83.51 | |
| 17 | The type of material of the vacuum cleaner road wheels | 2.66 | 53.20 | 87.90 | |
| 18 | Electric brush socket | 2.53 | 55.73 | 92.08 | |
| 19 | Type of vacuum cleaner on/off | 2.48 | 58.20 | 96.17 | |
| 20 | Suction pipe diameter | 2.32 | 60.52 | 100.00 |
Disclaimer/Publisher’s Note: The statements, opinions and data contained in all publications are solely those of the individual author(s) and contributor(s) and not of MDPI and/or the editor(s). MDPI and/or the editor(s) disclaim responsibility for any injury to people or property resulting from any ideas, methods, instructions or products referred to in the content. |
© 2024 by the authors. Licensee MDPI, Basel, Switzerland. This article is an open access article distributed under the terms and conditions of the Creative Commons Attribution (CC BY) license (https://creativecommons.org/licenses/by/4.0/).
Share and Cite
MDPI and ACS Style
Pacana, A.; Siwiec, D. Predicting Quality of Modified Product Attributes to Achieve Customer Satisfaction. Designs 2024, 8, 36. https://doi.org/10.3390/designs8020036
AMA Style
Pacana A, Siwiec D. Predicting Quality of Modified Product Attributes to Achieve Customer Satisfaction. Designs. 2024; 8(2):36. https://doi.org/10.3390/designs8020036
Chicago/Turabian StylePacana, Andrzej, and Dominika Siwiec. 2024. "Predicting Quality of Modified Product Attributes to Achieve Customer Satisfaction" Designs 8, no. 2: 36. https://doi.org/10.3390/designs8020036