
Effect of Quartz Nano-Particles on the Performance Characteristics of Asphalt Mixture


1
Department of Civil Engineering, University of Engineering and Technology Taxila, Taxila 47050, Pakistan
2
Department of Civil Engineering, H-10 Campus, International Islamic University, Islamabad 44000, Pakistan
3
Faculty of Science and Engineering, School of Civil and Mechanical Engineering, Curtin University, Bentley, WA 6102, Australia
*
Author to whom correspondence should be addressed.
Infrastructures 2022, 7(5), 60; https://doi.org/10.3390/infrastructures7050060
Submission received: 27 February 2022
/
Revised: 13 April 2022
/
Accepted: 13 April 2022
/
Published: 19 April 2022
Abstract
:Nano-technology has played a vital role in upgrading the durability and sustainability of asphalt pavements during the last decade. Conventional bitumen does not provide adequate performance against permanent deformation in severe weather conditions. Quartz nano-size particles (QNPs) (1, 3, and 5% by weight of the bitumen) were employed in this research to modify the conventional base bitumen PG 58–16. Conventional physical (penetration, softening, ductility, and flash and fire point), rheological, frequency sweep, high-performance grading, and moisture susceptibility tests were performed to investigate the enhancement of the base bitumen performance. Marshall mix design was conducted on each asphalt mixture to determine the optimum bitumen content (OBC) percentage for the preparation of wheel tracker samples to evaluate the effect of QNPs on asphalt mixtures. Laboratory test findings showed that the optimum concentration of QNPs is 5% by weight of base bitumen. The homogeneity and proper stable dispersion of QNPs in the bitumen were validated via scanning electron microscope (SEM), Fourier transform infrared spectroscopy (FTIR), and storage stability tests. At higher temperatures, the QNP-modified asphalt mixtures exhibited higher stiffness, stripping resistance, and rutting potential. It was concluded that QNPs effectively upgrade durability and permanent deformation resistance at high temperatures and, therefore, the sustainability of asphalt roads.
1. Introduction
Different modes of transportation are conventionally used to approach respective destinations, such as highways, railways, and airways, but most transportation is carried out using highways. The pavement construction industry is overgrowing around the globe due to the advancement in technology, modernization of life, and increase in traffic loads and volume. Traditional asphalt pavements cannot fulfill present demands and the requirements of future pavement constructions. Thus, sustainable materials are urgently required for higher safety, reliability, and quality and more environmentally friendly pavements. Due to constant use, pavements deteriorate with time. The critical issues of Pakistan’s pavement industry are “mix rutting” and “moisture damage,” which generally occur during the summer and monsoon seasons, respectively [1]. The primary asphalt pavement distress, mix rutting, is usually reported in the summer season in high-temperature regions of the country. This is due to compromises in the qualitative properties of the locally produced base bitumen during the hot period, i.e., its low softening point values. The other flexible pavement distress, moisture damage, is normally observed during the rainy seasons. These problems are caused by environmental conditions, the deterioration of pavement material with time, or poor construction or design. The ultraviolet (UV) aging effect on bituminous material may also reduce the durability resistance of local pavements [2]. Sometimes, the materials related to asphalt do not meet the standards of quality structures of the bitumen; therefore, some standard practices are performed to achieve the benchmark of materials used [3].
The focus of pavement engineers is to adjust modifiers to enhance bitumen’s rheological and adhesion characteristics. In the recent past, the properties of asphalt mixtures have been improved via nano-modifiers based on their intrinsic compatibility with asphalt [1]. Various researchers have used micro-and nano-material as modifiers to enhance asphalt pavements’ chemical, rheological, and mechanical performance. For instance, waste rubber tires (CR), styrene-butadiene, and ethylene glycidyl acrylate (EGA) terpolymer have been incorporated in asphaltic mixtures as modifiers to boost the structural and functional performance of pavements [4,5,6,7]. Consequently, it is a fact that these conventional modifiers can enhance the performance of bitumen as well as asphalt mixtures. This performance includes rutting resistance, fatigue life, moisture resistance, etc. However, due to rapid enhancement in nano-technology, researchers are now in a phase to introduce nano-additives in asphalt pavements and check the modification performance in asphalt pavements.
Different researchers have defined nano-technology in their own words, but overall, the main context of all these definitions is the same. It is hard to imagine how small nano-technology is; 1 nm is a billionth of a meter. The Institute of Nano Technology explains that nano-particles have dimensions less than 200 nm. Nano-technology is the continuation of existing sciences that deal with applying minute particles and their interaction with other particles to create new products on an industrial scale with better or different properties [8]. According to Kelsall et al. [9], nano-technology concerns the design, execution, and utilization of functional characteristics with at least one performance element quantified in nanometers. The Federal Highway Administration defines one nanometer as 100,000 times smaller than the thickness of human hair [10]. Zalnezhad et al. [11] define nano-technology as the formation of new materials, devices, and systems. Yang and Tighe determine “nano” as a material with at least one measurement within 1–100 nm. Nano-technology deals with exploring material particles at the smallest nano-level to develop the technology. A nano-particle has at least one dimension measuring less than 100 nanometers (nm) [12]. Nano-materials have morphological features on the nano-scale and have unique properties stemming from their nano-scale dimension. The main properties of nano-materials are more diminutive size, higher reactivity, and unique surface properties, due to which they are preferable in the preparation of industrial products. Nano-materials have become of considerable interest in academic and industrial sectors due to their distinct mechanical, thermal barrier, ophthalmic, electrical, and magnetic specifications [13]. Based on past experiences and results, it has become known that the properties of nano-syntheses in chemistry, physics, and biology are changed from their primary forms. Currently, nano-technology is used in every field of science. Many problems related to different aspects of life are solved by using nano-particles [12]. The prominent areas are medicine, cosmetics, military operations, concrete, steel, wood, glass, coatings, astronomy, fire detection, computing, sustainability, and the environment [8]. According to Styen, nano-materials have a remarkable effect in the concrete field. Various researchers have started developing self-healing concrete that will be more resistant to environmental and chemical attacks [14].
Before using nano-technology, microparticles such as micro-silica, micro-clay, TiO2, ZnO micro-particles, etc., were used to enhance the physical, rheological, morphological, and mechanical properties of base bitumen. However, research has been moving toward the nano-scale from the micro-scale to study the chemical effectiveness at the nano-scale [15]. The Federal Highway Administration (FHWA) in the United States of America (USA) spent 1.5 billion USD on nano-scale research in 2008. The FHWA has started numerous research efforts to promote the expansion of nano-technology in pavements. The main focus of the FHWA is to measure, model, and manipulate highway matter at the nano-level. According to an FHWA report, scientific research is now shifting to a smaller scale that demands fresh and innovative research ideas to solve complex engineering problems [10]. As in other sciences and engineering areas, highway engineering research also investigates phenomena at a smaller scale. Nano-technology lowers costs by creating an infrastructure that vehicle-based systems may use to maintain lane position and advise drivers of approaches at intersections and interchanges, reduce maintenance requirements, and, in the long-term application, nano-scale devices or sensors may record mobile source pollutants during construction and operations [10]. Nano-scale research promotes the use of recycled materials in the pavement. Nano-materials are utilized in transportation engineering to affect the qualities and performance of bitumen. Different percentages of nano-materials have been added and mixed using different mixing methods. Bitumen properties tests, asphalt mixture tests, and various other tests have been conducted to show that modification using nano-materials positively influences the characteristics of bitumen regarding high-temperature cracking, alligator cracking, stripping, and raveling. Most previous studies related to nano-modification have focused on nano-size inorganic additives [16]. Researchers have concluded that nano-materials have greater temperature sensitivity, large surface area, maximum deformation resistance, and small size [17,18,19,20,21]. Because of these unique characteristics, nano-materials are now used in different engineering fields. In the pavement industry, many nano-particles, such as nano-clay, nano-tubes, nano-carbon, nano-fibers, nano-silica (quartz), etc., can modify bitumen and are widely used to solve problems related to pavement [22]. In short, there are many benefits of applying nano-technology to bitumen-based materials [12].
According to Yao [23], bitumen has a chief role in maintaining the durability and serviceability of pavement. Poor quality bitumen produces severe adverse effects, while better bitumen enhances pavement service life and quality. To improve the properties of bitumen, it has been modified with different nano-materials; the results confirmed that the modification successfully enhanced the performance and properties of bitumen. The nano-material-modified bitumen increased the high temperature cracking resistance, alligator cracking resistance, and modified pavement’s service life. Zalnezhad et al. [11] clarify that quartz (silica) nano-particles are currently used in various industries such as medicine, drug delivery, and engineering due to their cheap manufacturing cost and remarkable performance features. Based on local availability and low cost, quartz nano-particles have become the focus of researchers to enhance the properties of local bitumen [3,24,25,26]. Hassan et al. [27] explored different methods for preparing quartz nano-particles, such as the vapor phase method, the sol-gel method, etc. The sol-gel process is commonly used based on purity and insignificant conditions. QNPs react very quickly compared to other common filler materials in bitumen [28]. It has been reported that high concentrations of quartz nano-particles (QNPs) can improve the rutting resistance of asphalt mixtures and make them less susceptible to low-temperature cracking [29,30,31]. Various percentages of the nano-material have been recommended, and other procedures for thoroughly mixing QNPs in bitumen have been implemented in asphalt [16].
Various pavement engineers and the research community have used quartz nano-particles to enhance the properties of base bitumen, but, as per published records, no comprehensive research gas has been presented on QNP–asphalt mixture performance. Developing countries have adopted performance grade (PG) to distinguish the performance of base bitumen for a particular territory and temperature as a replacement for conventional penetration grade [32,33,34]. The main aim of this study is to develop a high-performance grade PG-70 of bitumen, as suggested by Mirza et al., considering Pakistan’s environmental conditions [35]. The dispersion of QNPS into the bitumen was confirmed by scanning electron microscopy (SEM) and a storage stability test. The chemical effect on mixing was assessed by Fourier transform infrared spectroscopy (FTIR); then, conventional physical tests were performed on each test matrix. The rheology and high-performance grade (PG) of modified bitumen were evaluated by a dynamic shear rheometer (DSR). Each sample’s asphalt mixtures were prepared to determine stability, flow, volumetric properties, and the optimum bitumen content (OBC). The moisture susceptibility and types of failure in prepared asphalt mixtures were evaluated using the Bitumen bond strength test. The OBC value calculated from the mix design was used to prepare the Cooper wheel tracker test (CWTT) slab and then evaluate the permanent deformation resistance of modified asphalt mixtures.
2. Materials
2.1. Bitumen
Penetration grade 60/70 bitumen was procured from Attock Refinery Limited (ARL), Morgah Rawalpindi city, Punjab, Pakistan. This bitumen is characterized by a performance grade of PG 58-16, which is commonly used in the country’s road network and has four natural groups based on molecular size and chemical reactivity. The names of the four generic fractions are saturates, aromatics, resins, and asphaltenes based on SARA analysis. The first two groups, saturates and aromatics, promote the softening of bitumen, while the latter two promote the stiffening of the bitumen [36,37]. As per previously reported studies, the non-polar and acidic behavior of local base bitumen ARL is due to the high volume (40–65%) of aromatics available in the total bitumen volume [38,39]. The conventional properties of the base bitumen included a softening point of 49 °C, a mean penetration (1/10 mm) of 62, and a ductility (cm) of 109.
2.2. Aggregates
The aggregate quarry was considered based on the petrography of the rock source. The quantity of natural silica (SiO2) is the main parameter for aggregates’ acidic or basic nature. A high amount of SiO2 classifies acidic behavior, while a low amount represents the basic nature of aggregates. The aggregates, which are generic limestone in occurrence and basic in behavior, were collected from a locally available quarry situated in the northern part of the country, i.e., Margalla, Pakistan, [39]. Traditional qualitative tests were performed to check the physical and chemical properties of the aggregates in the laboratory using the developed specifications and standards [40]. The mechanical properties of the blended aggregates comprised a percentage loss of aggregates of 22%, a flakiness value of 4.9%, an elongation value of 2.4%, uncompacted voids value of 47.5%, a water absorption value of 1.04%, and a fractured particles value of 100%.
2.3. Quartz Nano-Particles
The modifier used in this study was quartz nano-particles (QNPs) available in powder form (SiO2NP). QNPs were procured from Chengdu Organic Chemicals Co. Ltd. China. These typical features of SiO2NP are presented in Table 1:
The methodology of the research is illustrated in Figure 1.
Researchers performed QNP modification of conventional bitumen by changing mixing protocols, i.e., dosages of QNPs, mixing temperature, and mixing rate. It has been reported in the literature that percentages of QNPs ranging from 0.5% to 11% by weight of the bitumen were considered in several studies, but the optimum dosage of QNPs is still not clear. Various researchers have reported different optimum percentages of QNPs, i.e., 3% and 5%, by weight of the bitumen. Similarly, the mixing temperatures ranging from 120 °C to 180 °C have also been reported, depending upon the angular speed ranging from 1800 to 4000 rpm to prepare QNP-modified bitumen, as presented in Table 2. However, most of the previous studies have highlighted an optimum mixing duration of sixty (60) minutes [3,26,33,41,42] and an optimum angular mixing speed of 3000 rpm [26,42,43,44,45]. Therefore, this study considered a mixing duration of 60 min, a mixing shear speed of 3000 rpm, and maximum dosage of 5% QNPs based on the above discussion. Furthermore, the criteria for selecting optimum QNPs dosage was achieving a performance grade (PG) of 70 based on the temperature zoning of Pakistan [35]; hence, a maximum dosage of 5% QNPs was selected in this research based on the PG results. Three dosages of QNPs were selected in this study, i.e., 1%, 3%, and 5%, by weight of the base bitumen. In the light of the literature review recommendations, three QNP-modified samples were prepared by varying the mixing duration and blending techniques, i.e., manual mixing and shear mixing at different rpm. A mixing duration of 60 minutes and a mixing speed of 3000 rpm were selected based on homogeneity, high-performance grade PG results, and repeatable results produced by the dynamic shear rheometer (DSR) machine. Therefore, ARL bitumen PG 58-16 was modified with QNPs (0%, 1%, 3%, and 5% by weight of bitumen) in mixing cans with a high shear homogenizer made by M/s Royal’s Corporation Pvt. Ltd. Rawalpindi, Punjab, Pakistan, at 160 ± 5 °C. The process of production of QNP-modified bitumen in the laboratory is illustrated in Figure 2
2.4. Sample Preparation
A summary of the mixing protocols reported by various researchers is shown in Table 2.

Table 2.
Recommendations for preparing quartz nano-particle (QNP)-modified bitumen.
| Sr. No | Author | Materials | Mixing Temperature | Mixing Speed |
|---|---|---|---|---|
| 1 | Metwally et al. [29] | QNPs (3, 5, 7, 9, and 11%) | 150 °C | Mixed until homogeneity achieved |
| 2 | Zalnezhad et al. [11] | Sasobit (2% wt.), QNPs (2–6% wt.) | 180 °C | Not specified |
| 3 | Tanzadeh and Shahrezagamasae [31] | QNPs, Polymer SBS (4.5%), Polypropylene Fiber (0.3%), Lime Powder (0.5 and 1%), Glass Fiber (0.1% and 0.2%) | 160 °C | 1800 rpm for 20 min |
| 4 | Galooyak et al. [44] | Sasobit (2% wt.), QNPs (2–6% wt.) | 180 °C | 3000 rpm for 30 min |
| 5 | (Ezzat et al., 2018) [41] | QNPs (3, 5, and 7% by weight) and nano-montmorillonite | 145 °C | 1500 rpm for 1 h |
| 6 | Enieb and Diab [3] | QNPs (2, 4 and 6 wt.%) | 160 °C | 2000 rpm for 1 h |
| 7 | (Crucho et al., 2018) [33] | QNPs, nano-iron, nano-clay bentonite | 160 °C | 2000 rpm for 1 h |
| 8 | Taherkhani and Afroozi [43] | QNPs (1, 3, and 5% by wt. of bitumen) | 160 °C | 3000 rpm for 1 h |
| 9 | Hassan Taherkhani and Siamark Afroozi [26] | QNPs (1, 3, and 5% wt.) | 160 °C | 3000 rpm for 1 h |
| 10 | (Taherkhani and Afroozi, 2017) [42] | QNPs (1, 3, and 5% wt.) | 160 °C | 3000 rpm for 1 h |
| 11 | Alhamali et al. [45] | QNPs (0, 2, 4, and 6% wt.) | 163 °C | 3000 rpm for 1 h |
| 12 | Ganjei and Aflaki [46] | Bitumen, QNPs (0, 0.5, 1, and 2%) and SBS Polymers (0, 1, 3, and 5%) | 170 °C | Ultrasonic high shear mixer for one hour |
| 13 | Amin and Esmail [47] | QNPs (0.5, 1, 1.5, and 2% by wt. of bitumen) | 120 °C | 3600 rpm for 1 h |
| 14 | Bala et al. [48] | Linear Low-Density Polyethylene (LLDPE 6%), QNPs (1, 2, and 3%) | 150 °C | 4000 rpm for 2 h |
2.5. Preparation of Asphalt Mixtures
According to the National Highway Authority (NHA) Pakistan general specifications, two types of gradation are recommended for the overlay of the top layer (wearing course) of flexible pavements. Class A signifies coarser gradation, whereas Class B specifies finer gradation [49]. The local pavement industry generally adopts the finer aggregate gradation for wearing course execution. Therefore, the Class B (finer 19.5 mm nominal maximum aggregate size) aggregate gradation was selected to prepare hot mix asphalt mixes in this research. The NHA Class B adopted gradation curve is given in Figure 3. The Marshall mix design was utilized on three QNP-modified mixtures to obtain the optimum bitumen content (OPC) as per AIM MS-2 [50]. In this test, 75 blows of a standard hammer of 4.5 lbs were dropped from 18 inches to compact the modified samples based on heavy traffic criteria. The OBC was determined based on stability, unit weight, and a targeted midpoint air voids value of 5.5% (3–8% range as per MS-2). The measured OBC values are recorded in Table 3 and were utilized to prepare performance testing of QNP-modified samples.
Typically, a high dosage of filler material in an asphalt mixture reduces OBC for that mix and requires a large amount of bitumen to fulfill the volumetric criteria [51]. However, both high and low values of OBC have been reported in studies employing nano-materials. The past studies demonstrate that filler behavior is a complicated phenomenon, and each filler behaves uniquely in asphalt mixtures. A gradual increase in the OBC trends has been recorded by incorporating greater amounts of QNPs.
3. Tests Performed
3.1. Scanning Electron Microscopy
A scanning electron microscope (SEM) is a microscope that magnifies images using electrons instead of light waves. It allows a large amount of the sample to be in focus at one time and generates scan illustrations at high resolution, with a resolving power of approximately 3 nm. The main advantage of this machine is the ease of sample observation. Different modes are also available for imaging purposes, such as X-ray, secondary electron, and backscatter. To make the samples conductive, they must be coated with a layer of gold ranging from 5 nm to 50 nm. Next is to place this sample in a microscope vacuum column while maintaining an airtight door. High energy electrons are emitted by an electron gun. Secondary electrons are set free after being struck with the emitted electrons, and the image is recorded via the transmitted electrons.
3.2. Storage Stability
The storage stability test confirmed the homogenous dispersion and separation index of QNP-modified bitumen [52]. This test was classified into two stages, i.e., the representative bitumen sample was heated in an oven for two days in the first stage. The heated sample was conditioned in a refrigerator for four hours in the next stage. Firstly, an aluminum test tube 140 mm in height and 28 mm in diameter was filled with fifty (50) grams of bitumen sample. This aluminum tube was stored in an oven vertically for 48 h at a temperature of 163 °C. Then, after two days, the aluminum tube was removed from the oven and placed in the refrigerator for four hours at a specific temperature of −7 °C. After four hours, the sample was taken out of the refrigerator and cut into three portions. The typical sample was taken from the upper and lower portion of the aluminum tube; then, a softening point test was conducted on all samples. Acceptable limits for the storage stability test, performed according to ASTM D 5892 directions, are changes in the softening point (SP) values of the sample taken from the upper and lower portion of the tube of less than 2.2 °C.
3.3. Fourier Transform Infrared Spectroscopy
The FTIR test was performed to inspect the macromolecular materials for the base and QNP-modified bitumen [53]. KBR pellets were prepared with about 5 g of powder to examine the samples. The KBR was placed in a special die, and a pressure of 15,000 psi was applied to form a pellet 1 to 2 mm thick and transparent to IR radiations, which can be placed in the holder for the IR spectrometer. Samples were heated, and KBR pellets were coated with the bitumen. A blank KBR pellet was loaded in the IR. Samples were loaded one by one, and absorbance was noted from frequency 500 cm−1 to 4000 cm−1.
3.4. Traditional Bitumen Tests
3.5. Frequency Sweep Test
Hafeez et al. [58], asphalt behavior depends on loading time and temperature factors. A dynamic shear rheometer (DSR) was used to determine bitumen’s elastic, viscous, and viscoelastic behavior and was performed as per AASHTO T 315 [59]. The DSR determined the complex modulus (G*) and phase angles (δ) by using the relation between the storage and loss modulus. Empirical equations were developed to evaluate the complex modulus and phase angle values, further used to determine the bitumen and modified asphalt’s rut resistance (G*/sin δ).
3.6. Bitumen Bond Strength
The durability of the base and modified asphalt was predicted in terms of moisture sensitivity, which was determined after 24 h of wet conditions based on BBS results [60,61]. Bitumen bond strength (BBS) was measured by using the pneumatic adhesion tensile testing instrument (PATTI) as per ASTM D 4541 [62]. Three (3) sample plates were tested for each modification, and the prepared plates (15” × 6” × 1.5”) were conditioned in an oven for 60 min at 160 °C to exclude all the absorbed moisture. Pullout stubs were also conditioned at 65 °C for 30 min. Tests were conducted the next day after achieving dry and wet conditioning. A pull-out force was applied to the asphalt sample by a metal stub, and burst pressure was recorded to calculate the POTS based on Equation (1).
where POTS = pull-off tensile strength (psi), BP = burst pressure (psi), Ag = contact area between gasket and reaction plate (4.06 in2), C = piston constant (0.286 lbs.), Aps = area of pull-stub (0.1963 in2)
3.7. Cooper Wheel Tracker Test (CWTT)
The laboratory’s rutting depth of asphalt mixtures was determined using the Cooper wheel tracker test (CWTT). The asphalt slabs (300 × 300 × 50 mm3) were paved by preparing the asphalt mixtures at specified mixing temperatures of 158 ± 5 °C, as per the optimum bitumen content (OBC) percentage calculated from the Marshall mix design. Then, loose mixture slabs were compacted at 145 ± 5 °C by a Cooper roller compactor. The rutting depth test was performed on compacted samples as per BS EN 12697-22, with specific repeated loading cycles up to 10,000 passes or 12.5 mm rutting depth, whichever was achieved earlier. The compaction was accomplished at 5.5 ± 0.5% air voids in four phases, with 10, 10, 5, and 5 passing at 2.5, 3.0, 4.0, and 4.5 bar pressures. The temperature was maintained at 55 ± 1 °C inside the chamber for the loading time. This test temperature was selected to simulate the actual weather conditions of Pakistan [63]. An exerted wheel load of 700 ± 20 N at a rate of 52 passes per minute was applied on each asphalt slab lengthwise at a frequency of 26.5 rpm. The exerted wheel load was maintained constantly to measure the rutting depth against the fixed failure criteria of 12.5 mm [64]. The LWT (loaded wheel test) data was used to classify the performance of a variety of mixtures by plotting a graph of rut depth (limiting criteria 12.5 mm) against the number of passes.
4. Results and Discussion
4.1. Dispersion of QNPs into the Base Bitumen
A scanning electron microscope (SEM) was utilized to check the homogeneity and effectiveness of mixing in dispersing the QNPs in the bitumen [1]. Scanning electron microscopy of base and modified bitumen (1%, 3%, and 5% QNPs by weight of bitumen) is illustrated in Figure 4. The results depict that the adopted mixing protocol of 3000 rpm for 60 min to disperse QNPs (up to 5%) in the bitumen is acceptable. QNPs have a large specific area that increases their tendency to aggregate, which produces a strong bond in contact with the aggregates. Thus, this generates a network of adhesion bonds between the bitumen and aggregates.
4.2. Effect of QNPs on Storage Stability of Base Bitumen
The successful homogeneous dispersion and stability of QNPs in the bitumen were further validated through the storage stability test and repeatable outcomes of high PG during trial blending methods. The softening point (SP) test was performed on QNP-modified samples taken from the starting and ending portion of the aluminum tube; a difference in SP of less than 2.2 °C was recorded. The results are presented in Table 4. The test results showed that the 5% QNP sample was storage stable. The temperature difference was 1.4 °C, which is acceptable because this difference is less than 2.2 °C [65]. The dispersion of QNPs into the base bitumen was stable, as the difference between the readings before placing the sample in the oven and refrigerator was within the criteria range. These results confirmed the stable and homogenous dispersion of QNPs into the base bitumen. They showed that a high dosage of 5% QNPs also satisfied the storage stability criteria against high temperature and can be recommended for paving asphalt roads.
4.3. Fourier Transform Infrared Spectroscopy
SEM results showed that dispersion of QNPs 1%, 3%, and 5% was accomplished. The chemical changes in the QNP-modified bitumen and the macromolecules were investigated with the Fourier transform infrared spectroscopy (FTIR) test [66,67]. The spectrum drawn from the analysis detected the functional groups such as single, double, and triple bonds between the carbon and other groups mixed with bitumen during mixing [53]. FTIR displayed the output results in graphs between the wavenumbers and infrared absorbance peaks, the values of which were used to detect the functional groups available in the bitumen specimen [67]. For this purpose, Figure 5 illustrates the FTIR spectrum of five (5) samples, i.e., base bitumen, QNPs, and three QNP-modified bitumens with 1%, 3%, and 5% QNPs by weight, which was plotted with the wave number on the x-axis and absorbance on the y axis. Different types of peaks showing functional groups were prominent in the spectrum, i.e., hydrocarbons, aromatic hydrocarbons, aromatics, carbonyl, and saturated hydrocarbons. Figure 6 illustrates the functional composition changes associated with QNP modification of the bitumen. Starting from the maximum wavenumber values, there was no detection of O-H peaks after the 3500 cm−1 wavenumber, which verifies that there was no water retention in the samples [68]. However, the broad weak peaks of modified samples between the wavenumbers 3500 cm−1 and 3200 cm−1 were due to the stretching vibrations of O-H groups (-Si-OH) [69]. For the base bitumen, two broad peaks detected between 2840–2930 cm−1 were attributed to aliphatic chains or saturated hydrocarbons due to the expanding oscillations of alkyl stretching and alkane aromatics (C-H), respectively [68]. The smaller peak around 2300–2400 cm−1 in the base bitumen was characteristic of C ≡ C bonding, and less intense peaks were detected in each modified sample. The peak detected around 1747 cm−1 was due to simple carbonyl molecules such as ester (R-C = OO-R) stretching, and the peak around 1605 cm−1 was characteristic of C = C alkene stretching vibrations, which are related to aromatic compounds [53]. Additionally, two small peaks were detected at 1448 and 1373 cm−1; the first peak corresponds to C-H asymmetric bending in CH3 and CH2, while the later peak is linked to symmetric bending of alkyl (CH3) [67]. Sulfoxide bonds as S-O stretching vibrations were detected at 1110 cm−1 [69]. Three characteristic bands define the nano-QNPs, the first with high-intensity absorbance at 1110 cm−1, the second with low-intensity absorbance at 802 cm−1, and the last with high-intensity absorbance at 471 cm−1. Incorporating QNPs increased the intensity of these functional groups, as these high intensities were not found in base bitumen. It is expected that the intensities of these functional groups increased with the increasing dosages of QNPs without exceeding the intensity of the QNPs themselves. Thus, this provides evidence for the proper incorporation and dispersion of the QNPs into the base bitumen [70]. The infrared (IR) spectrum reveals that all the modified samples (1–5%) were close to the peak of base bitumen, and neither new peaks nor the disappearance of existing peaks was detected. The intensities of the QNP-modified bitumen samples increased compared to the base bitumen, which reflects that functionalization with the bitumen molecules was efficacious [53]. Therefore, it is clear that the dispersion of QNPs into the base bitumen was purely a physical process. The above findings agree with the previous research findings [70,71].
The structural index was developed to compare the intensities of various types of bonding in the base bitumen and QNP-modified bitumen samples. The influence of the dosages on the intensities of the absorption bands of each sample was evaluated. For this purpose, the structural index was derived by considering the band maxima value. A single absorbance value of a certain group was considered, and then the tangential approach or relative baseline was considered for a certain band. The maximum band method avoids errors that normally occur in integration methods at the tangential endpoints [72]. From the FTIR spectrum, high absorbance intensities of the sulfoxides, alkenes, carbonyl, and aliphatic peaks excluding fingerprint regions were recorded with the increase in the concentration of QNPs. The relative comparison was then plotted between the functional groups in bar charts, as illustrated in Figure 7, to characterize the chemical functional groups based on absorbance peak data. As per IR bands’ classification, three bands are based on their relative intensities: strong, medium, and weak bands. Strong bands cover greater than half of the absorbance y-axis area, medium bands cover about half of the absorbance area, and weak bands cover about one-third or less [73,74]. The structural index graph showed noticeable relative increments of 81%, 45%, 26%, and 24% in saturated hydrocarbons, alkenes, sulfoxides, and carbonyl groups, respectively, compared to base bitumen. It indicates that modification with QNPs enhanced the bonding of base bitumen. These are more prominent in strong aliphatic bonds, with a medium increment observed in alkenes and a low increment recorded in the sulfoxide and carbonyl groups. The analysis confirms that the high peaks of the QNP-modified bitumen produce a strong chemical functional group compared to base bitumen. In simple words, an increase in QNP dosages reinforces the chemical bond states, i.e., the strong bond, of the modified bitumen. Thus, the severe effect on bonding may improve the performance of QNP-modified bitumen. These peak findings of FTIR show successful dispersion of modifiers in bitumen and agree with previous findings [70].
4.4. Conventional Bitumen Test Results
The penetration, softening, ductility, and flash and fire tests were performed in the light of ASTM directions to determine the conventional properties of base and QNP-modified bitumen samples; the measured values are recorded in Table 5:
Penetration values of base and QNP-modified bitumen were determined using a penetrometer apparatus as per ASTM standard D-5 [54]. It can be seen from Figure 8 that when increasing the dosage of QNPs, lower penetration values were recorded, which indirectly indicates an increase in the stiffness of base bitumen at intermediate temperatures. The QNP dosages of 1%, 3%, and 5% by weight of bitumen reduced the penetration values of base bitumen by 26%, 39%, and 48%, respectively, compared to base bitumen. These penetration values are in agreement with [29,43,75]. The softening point values of base and QNP-modified bitumen were determined using a ring and ball test apparatus as per D 36 [55]. Test results demonstrated that high doses of QNPs raised the softening values of modified bitumen, which indicates less sensitivity to high and low temperatures. It is predicted that the QNP-modified bitumen could better resist cracking and permanent deformation at low and high temperatures, respectively.
Similarly, Figure 8 illustrated that QNP percentages of 1%, 3%, and 5% by weight of bitumen enhanced the softening temperature of bitumen by 6%, 10%, and 18%, respectively, compared to base bitumen. These softening values findings are in agreement with [43,75]. The flash and fire point test values of base and QNP-modified bitumen were determined using a Cleveland open cup tester apparatus as per ASTM D 92 [56]. Cleveland open cup test results showed that 5% QNPs dosage in bitumen increased the flash and fire point of base bitumen by 11% due to the high degree of dispersion of the QNPs into the base bitumen. However, ductility test results showed that the addition of 5% QNPs reduced tensile values of bitumen by 63% due to the high surface area of QNPs. These softening point findings are in agreement with [43]. Hence, based on penetration, softening, flash and fire point, and ductility test results, a dosage of 5% QNPs by weight of bitumen is preferred.
The effect of incorporating QNPs into the base bitumen on temperature susceptibility was evaluated by penetration index (PI). The PI values calculated from the penetration and softening values of the bitumen and their relationship is presented in Equation (2) [76]:
Here, T describes the temperature at which the penetration test was performed, i.e., 25 °C; SP represents the softening point of bitumen, which is measured in °C; and the constant value 800 (0.1 mm) represents the assumed penetration value at the softening point [52].
Normally, PI values have an inverse relationship with temperature susceptibility, and these values lie in the ranges from −2 to +2. Bitumen shows more temperature susceptibility when PI values drop to -2, reflecting more brittle behavior and transverse cracking in the winter season [77]. The PI values of the QNPs are presented in Table 5 and illustrated in Figure 9, which reveals that modifications of all samples satisfied the PI criteria. It is clear from the PI curve line that the incorporation of QNPs improved the PI values, which reflects the lowering of temperature susceptibility.
4.5. Frequency Sweep Test
A frequency sweep test was performed as per AASHTO T 315 at frequency levels ranging from 0.1 Hz to 10 Hz, and test temperature ranges from 10 °C to 70 °C, with two plates of 8 mm and 25 mm geometries with a 1 mm and 2 mm gap between the plates, respectively. The input test matrix is reported in Table 6. The 8 mm plate is generally used to determine rheological properties at low temperatures (−5 to 20 °C), while the 25 mm plate is mostly used at intermediate and high temperatures (20 to 80 °C) [78,79]. The rheological characteristics of the base and QNP-modified bitumen samples were studied in terms of complex modulus (G*) and phase angle (δ). Experimental results against the test parameters were illustrated with the help of graphs. Four bitumens, including base and modified samples, were tested in unaged conditions, and rheological parameters were determined to characterize the asphalt.
Master curves of all four samples were constructed using the time-temperature superposition principle. The first step was to extract the data from the 8 mm and 25 mm plates in the “Rheoplus” files obtained from the frequency sweep test via the DSR machine. The plates’ data for test temperatures 10 to 70 °C was assembled in one file in the same software. Arrhenius shift factors were calculated by selecting the master curve method at a reference temperature of 30 °C by importing all the test temperature files. Figure 10 illustrates the master curves of complex modulus (G*) and its relationship with reduced frequencies. The addition of QNPs into the bitumen showed satisfactory results at the selected maximum temperature (70 °C) compared to the base bitumen. Master curves of complex modulus (G*) values showed that adding 1% QNPs into the base bitumen increased the G* values at low frequencies, and this pattern continued up to the dosage of 5% QNPs. It predicts that the addition of QNPs increases the stiffness of bitumen and results in more resistance to permanent deformation at high temperatures. It is due to the larger surface area of QNPs and their successful dispersion into the base bitumen. The findings are in agreement with Galooyak et al. [44]. Figure 11 illustrates the master curves of phase angle (δ); it can be seen that high values of “δ” were recorded at low-frequency levels. It shows that by incorporating dosages of QNPs into the base bitumen, a reduction in the phase angle “δ” values was reported at low frequencies. The 1% QNPs mixture showed a reduction in phase angle value compared to base bitumen, and this pattern continues up to the dosage of 5% QNPs. The low phase angle values at all frequency levels show that QNPs improved the elastic behavior of bitumen. Based on the lower values of phase angle, 5% QNPs by wt. of bitumen was determined as the optimum modification percentage. In past studies, it has also been reported that QNP-modified bitumen shows more elastic behavior than base bitumen [44].
Master curves of rut resistance G*/sinδ were plotted at 30 °C between reduced angular frequencies on the horizontal “x-axis” and rut resistance G*/sinδ on the vertical “y-axis.” The main purpose of master curves is to check the behavior of QNP-modified bitumen at high temperatures as per SHRP rutting resistance criteria, i.e., G*/sin(δ) > 1 kPa. The maximum failure criteria for modified bitumen samples were recorded based on these results. The master curves were constructed using the software “Rheoplus.” Master curves of rut resistance G*/sinδ were similar to the complex modulus G* trend. Figure 12 illustrates that all the samples passed the criterion G*/sinδ > 1 kPa, including 1% QNPs at the selected maximum temperature (70 °C) compared to virgin bitumen, and this trend continues up to 5% QNPs. Thus, 5% QNP modification showed better rut resistance performance than all samples at lower percentages. Overall, it can be concluded that the 5% QNP mixture had shown the best rut resistance among all the samples, and it is suitable to use in higher temperature zones.
The G* and G*/sinδ values were compared at a fixed angular frequency of 10 s-1 and a temperature range of 10 to 70 °C and are presented in Table 7. Figure 13 illustrates that adding 1%, 3%, and 5% QNPs increased the complex modulus values to 159%, 166%, and 196%, respectively, compared to base bitumen. The base and modified samples’ rut resistance G*/sin (δ) values were noted at an angular frequency of 10 s−1 for all temperatures. The purpose of noting the values was to compare all the samples to evaluate rut resistance performance at high temperatures. Similarly, Figure 14 illustrates that adding 1%, 3%, and 5% QNPs increased the rut resistance values to 148%, 157%, and 181%, respectively, compared to base bitumen. A graphical illustration of the influence of temperature on rut resistance at an angular frequency of 10 (s−1) showed that the 5% QNP mixture had the highest values compared to all samples. Similarly, the 3% QNP mixture showed the second-best performance and the 1% QNP mixture showed the third-best performance to pass the super-pave rut resistance criteria, i.e., greater than 1 kilo Pascal. Therefore, it was concluded that based on G*/sin(δ) at high temperature, the 5% QNPs dosage is preferable.
4.6. Influence of QNPs on Performance Grading (PG)
The influence of QNPs on base bitumen’s performance grading (PG) is studied in this section. The high PG value of locally used base bitumen (ARL 60/70) is 58; hence, this test aimed to confirm the development of PG 70 bitumen after incorporating QNPs into the bitumen. The high PG values were verified based on the super-pave rut resistance criteria, i.e., G*/sinδ >1 kPa. The bar chart in Figure 14 confirms that all the QNP-modified samples passed the super-pave criteria. Therefore, for accurate high PG values, the failure temperature was directly measured from the dynamic shear rheometer (DSR), and the results are presented in Figure 15. It is clear from the results that incorporating QNPs into the base bitumen improved the failure temperature from 63 to 71 °C and improved the base bitumen PG from 58 to PG 70. An almost 8 °C increase in the failure temperature was recorded in the 1% dosage of QNPS compared with base bitumen. This improvement indirectly reflects strong resistance against permanent deformation at high temperatures. Similarly, the 3% dosage of QNPs showed a 1 °C increase in failure temperature compared with the 1% dosage of QNPs, and this trend is more prominent at the 5% dosage of QNPs, where the recorded failure value was 1.5 °C higher compared to the 3% dosage of QNPs. Thus, based on failure temperature, the 5% QNP mixture showed a 10.5 °C higher temperature than base bitumen and improved the PG 58 to PG 70. Overall, the three modifications demonstrated the PG 70 grade, but based on the higher temperature failure values, an optimum dosage of 5% QNPs should be selected for asphalt work.
4.7. Bitumen Bond Strength Test
The influence of QNPs on bitumen aggregate bond strength in dry and wet conditions was studied using a PATTI, and the recorded values are displayed in Table 8. Figure 16 illustrates the BBS sample of base bitumen before applying the burst pressure and after applying the pressure at a specified rate. Failure propagates in the sample at the time when the applied strength exceeds the cohesive strength of the bitumen or adhesion strength, i.e., the bond strength between the bitumen and the aggregates [80]. Figure 17 shows the comparison of POTS after 24 h of dry and wet conditioning in the form of a bar chart. The bar chart indicates that the QNs dosage of 5% has a higher POTS value after 24 h of dry and wet conditioning compared to all other QNP-modified samples and the base bitumen. The cohesive and adhesive failure modes were observed for QNP-modified samples after 24 h of dry and wet conditioning. An increase in POTS values from 1274 psi to 1994 psi was recorded for the 5% QNP particle after 24 h of dry conditioning, and cohesion failure of base bitumen and minor failure between bitumen and aggregate interface were observed in each sample. The adhesive failure between 5% QNP-modified bitumen and aggregate was not strong enough, and, overall, the aggregate loss was less than 50%; thus, stripping distress may resist the asphalt mix. BBS results of dry conditions showed that the addition of QNPs (1%, 3%, and 5% wt of bitumen.) improved the adhesive force by 27%, 46%, and 56%, respectively, as compared to base bitumen.
Additionally, there was a bridging effect between the bitumen and QNPs, inhibiting micro-crack generation and advancement. Physical visual inspection of the 5% QNP mixture showed that some parts of the aggregate base were also lost along with the bitumen, but overall, it was a cohesive failure. The low POTS values recorded for 24 h of wet conditioning compared to dry samples were due to the presence of aggregates (porous material) through which water penetrates, resulting in the weakening of the bitumen–aggregate interface [81]. Likewise, the 5% QNP dosage for 24 h of wet conditioning had the highest POTS values compared to base bitumen and all QNP-modified samples. It could be due to QNPs improving the wetting potential of modified bitumen, supporting strong adhesion with the aggregate interface, and high bitumen aggregate bond strength. The improvement in bond strength could be credited to the increase in stiffness values due to the incorporation of QNPs [80].
Further, this increase could also be due to the interaction of hydrogen bonds and van der Waals interactions due to nano-hybrid material [82]. BBS results for wet conditions highlighted that the addition of QNPs (1%, 3%, and 5% wt. of bitumen) improved the adhesive force by 32%, 43%, and 50%, respectively, as compared to base bitumen. As per recorded results, it can be summarized that QNPs have the potential to enhance the cohesive/adhesive bond strength of modified asphalt. Thus, an optimum value of 5% QNPs were selected based on visual inspection, and POTS values increased by 56%, which creates more resistance to adhesive failure.
4.8. Effect of QNPs on Rut Depth
Permanent deformation or rutting resistance represents a crucial constraint for designing and predicting asphalt mixture behavior [83]. The Cooper wheel tracker test was performed to check the influence of QNPs on the base asphalt’s rutting performance at high temperatures; the results are illustrated in Figure 18. The graph plotted between the number of passes and rut depth clearly shows that incorporating QNPs into the asphalt improved rutting resistance at elevated temperatures due to higher stiffness values. The rut depths of the modified asphalt (1%, 3%, and 5% QNPs) were significantly reduced by 27%, 35%, and 40%, respectively, at 55 °C compared to base asphalt. This strong resistance against rutting is due to the incorporation of QNPs into the base asphalt, which improves the elastic behavior and enhances the high-temperature performance of modified asphalt. The high specific surface area of QNPs reinforces the bitumen particles, enhancing the reactivity, bond, strength, viscosity, and adhesion of the modified bitumen and making it less susceptible to permanent deformation at high temperatures [84].
5. Conclusions
The following conclusions have been drawn from this experimental study and careful analysis of the results:
- SEM images confirm that the adopted laboratory mixing methodology via homogenizer is an effective method for the successful dispersion of QNPs into bitumen. Further, recorded storage stability test values of QNP-modified bitumen were less than 2.2 °C, i.e., which also ensures the permanence of the dispersion of QNPs in the bitumen. This confirms that QNP-modified bitumen is a stable product and can be adopted by the local pavement construction industry;
- The FTIR results confirmed that the dispersion of QNPs into the base bitumen was purely a physical mixing process. The peaks of each modified sample were similar to the base bitumen, which indicates that the adopted mixing protocol was acceptable for the preparation of a stable product;
- The introduction of QNPs into the bitumen enhanced the conventional physical characteristics of the asphalt bitumen due to its large surface area and high dispersion. The 5% QNP-modified bitumen reduced penetration and ductility values by 48% and 63%, respectively, representing an improvement in the stiffness values. Further, the 18% increase in the softening point value of 5% QNP-modified bitumen indicates lower temperature sensitivity and thermal susceptibility. Lowering the temperature sensitivity of bitumen results in the enhancement of its resistance against permanent deformation and low-temperature cracking;
- DSR results concluded that the addition of quartz nano-particles enhanced asphalt’s viscoelastic properties and rut resistance at high temperatures. DSR rut resistance criteria showed that 5% QNP bitumen was optimally modified, just as the BBS result favored the 5% QNP-modified bitumen. Hence, SEM and FTIR results suggested that 5% QNPs could be selected as the optimum modification percentage for economic modification. Moreover, 5% QNPs-modified bitumen satisfied the rutting resistance super-pave design criteria (G*sinδ > 1 kPa) for higher temperatures, i.e., 70 °C;
- BBS results showed that the introduction of QNPs into the base bitumen significantly improved the cohesive and adhesive bond strength in both 24 h dry and 24 h wet conditions and reduced the moisture susceptibility of the base bitumen. Incorporating 5% QNPs into the base bitumen enhanced the BBS value by 56% and 50% in dry and wet conditions. Thus, based on wet condition results, it was confirmed that 5% QNPs prominently improved the moisture sensitivity and durability of asphalt;
- The CWTT performed on QNP-modified (1%, 3% and 5%) asphalt provided evidence of lower rut depth, i.e., 27%, 35%, and 40%, respectively, at 55 °C. This shows the consistent results attained from the DSR that the 5% QNP dosage has the highest resistance to permanent deformation at high temperatures among all the samples.
Overall, the outcomes of the above conclusions are that the 5% QNP dosage satisfies PG 70 criteria, with high rut resistance and less moisture susceptibility. Further, the low rut depth values also validate QNP-modified asphalt, which can be used for paving roads in hot regions. It is recommended that future research perform advanced chemical tests, aging analysis, and low-temperature tests on QNP-modified bitumen and asphalt for cold regions of the country.
Author Contributions
The concept was advised by N.A., W.H. performed the design and performance of experimental activities operated, and implementation of practical activities was analyzed, and N.M. inscribed a paper draft by W.H. The N.A evaluated the article. All authors have read and agreed to the published version of the manuscript.
Funding
This experimental study received no type of funding from any external or internal sources.
Institutional Review Board Statement
This experimental study doesn’t require any Institutional Review Board Statement.
Informed Consent Statement
This experimental study does not require any Informed Consent statement.
Data Availability Statement
This experimental study does not require any data availability statement.
Acknowledgments
The author thanks Rana Muhammad Shahid, Lab Technician, International Islamic University, Islamabad, for his assistance and directions.
Conflicts of Interest
The author declares no conflict of interest.
References
- Rafi, J.; Kamal, M.; Ahmad, N.; Hafeez, M.; Faizan ul Haq, M.; Aamara Asif, S.; Shabbir, F.; Bilal Ahmed Zaidi, S. Performance Evaluation of Carbon Black Nano-Particle Reinforced Asphalt Mixture. Appl. Sci. 2018, 8, 1114. [Google Scholar] [CrossRef] [Green Version]
- Cheraghian, G.; Wang, D.; Kim, Y.S.; Wistuba, M.P. Experimental Investigation on Ultraviolet Aging Properties of Silica Nanoparticles-Modified Bitumen. In Proceedings of the RILEM International Symposium on Bituminous Materials, Lyon, France, 14–16 December 2020; pp. 879–885. [Google Scholar]
- Enieb, M.; Diab, A. Characteristics of asphalt binder and mixture containing nanosilica. Int. J. Pavement Res. Technol. 2017, 10, 148–157. [Google Scholar] [CrossRef]
- Putman, B.J.; Amirkhanian, S.N. Utilization of waste fibers in stone matrix asphalt mixtures. Resour. Conserv. Recycl. 2004, 42, 265–274. [Google Scholar] [CrossRef]
- Anurag, K.; Xiao, F.; Amirkhanian, S.N. Laboratory investigation of indirect tensile strength using roofing polyester waste fibers in hot mix asphalt. Constr. Build. Mater. 2009, 23, 2035–2040. [Google Scholar] [CrossRef]
- Xiao, F.; Amirkhanian, S.N.; Shen, J.; Putman, B. Influences of crumb rubber size and type on reclaimed asphalt pavement (RAP) mixtures. Constr. Build. Mater. 2009, 23, 1028–1034. [Google Scholar] [CrossRef]
- Shen, J.; Amirkhanian, S.; Xiao, F.; Tang, B. Influence of surface area and size of crumb rubber on high temperature properties of crumb rubber modified binders. Constr. Build. Mater. 2009, 23, 304–310. [Google Scholar] [CrossRef]
- Mann, S. Nanoforum Report: Nanotechnology and Construction; Institute of Nanotechnology: Karlsruhe, Germany, 2006. [Google Scholar]
- Kelsall, R.W.; Hamley, I.W.; Geoghegan, M. Nanoscale Science and Technology; John Wiley & Sons: Chichester, UK, 2005; ISBN 9780470850862. [Google Scholar]
- Federal Highway Administration. Nano-scale Approaches for Highway Research; Exploratory Advanced Research Program; Federal Highway Administration: Washington, DC, USA, 2010; 8p. [Google Scholar]
- Zalnezhad, H.; Galooyak, S.S.; Farahani, H.; Goli, A.; Technology, R.; Division, D. Investigating the Effect of Nano-silica on the Specification of the Sasobit Warm Mix Asphalt. Pet. Coal 2015, 57, 509–515. [Google Scholar]
- Yang, J.; Tighe, S. A Review of Advances of Nanotechnology in Asphalt Mixtures. Proc. Soc. Behav. Sci. 2013, 96, 1269–1276. [Google Scholar] [CrossRef] [Green Version]
- Bhargava, S.; Raghuwanshi, A.K.; Gupta, P. Nanomaterial Compatibility and Effect on Properties of Base Bitumen Binder and Polymer Modified Bitumen Nanomaterial Compatibility and Effect on Properties of Base Bitumen Binder and Polymer Modified Bitumen. Int. J. Innov. Sci. Eng. Technol. 2016, 3, 276–282. [Google Scholar]
- Steyn, W.J. Applications of Nanotechnology in Road Pavement Engineering. In Nanotechnology in Civil Infrastructure; Springer: Berlin, Germany, 2011; pp. 49–83. [Google Scholar]
- Yao, H.; You, Z. Effectiveness of Micro-and Nanomaterials in Asphalt Mixtures through Dynamic Modulus and Rutting Tests. J. Nanomater. 2016, 2016, 10. [Google Scholar] [CrossRef] [Green Version]
- Yusak, M.I.M.; Abdullah, M.E.; Jaya, R.P.; Hainin, M.R.; Ibrahim, M.H.W. Effect of Nano Silica on the Physical Property of Porous Concrete Pavement. IOP Conf. Ser. Mater. Sci. Eng. 2017, 226, 012043. [Google Scholar] [CrossRef] [Green Version]
- Zheng, X.; Wilkie, C.A. Flame retardancy of polystyrene nanocomposites based on an oligomeric organically-modified clay containing phosphate. Polym. Degrad. Stab. 2003, 81, 539–550. [Google Scholar] [CrossRef] [Green Version]
- Simon, M.W.; Stafford, K.T.; Ou, D.L. Nanoclay reinforcement of liquid silicone rubber. J. Inorg. Organomet. Polym. Mater. 2008, 18, 364–373. [Google Scholar] [CrossRef]
- Yang, Z.; Hollar, J.; Shi, X. Surface-sulfonated polystyrene microspheres improve crack resistance of carbon microfiber-reinforced Portland cement mortar. J. Mater. Sci. 2010, 45, 3497–3505. [Google Scholar] [CrossRef]
- Zhou, X.X.; Zhang, G.F.; Liu, R.M.; Zheng, L. Molecular Simulations of Anti-Aging Mechanisms on Nano-LDHs Modified Asphalt. Key Eng. Mater. 2014, 599, 198–202. [Google Scholar]
- Veytskin, Y.; Bobko, C.; Castorena, C. Nanoindentation investigation of asphalt binder and mastic viscoelasticity. Int. J. Pavement Eng. 2016, 17, 363–376. [Google Scholar] [CrossRef]
- Yusoff, N.I.M.; Breem, A.A.S.; Alattug, H.N.M.; Hamim, A.; Ahmad, J. The effects of moisture susceptibility and ageing conditions on nano-silica/polymer-modified asphalt mixtures. Constr. Build. Mater. 2014, 72, 139–147. [Google Scholar] [CrossRef]
- Yao, H.; You, Z.; Li, L.; Goh, S.W.; Dedene, C. Evaluation of the Master Curves for Complex Shear Modulus for Nano-Modified Asphalt Binders. CICTP 2012, 2012, 3399–3414. [Google Scholar]
- Kong, D.; Du, X.; Wei, S.; Zhang, H.; Yang, Y.; Shah, S.P. Influence of nano-silica agglomeration on microstructure and properties of the hardened cement-based materials. Constr. Build. Mater. 2012, 37, 707–715. [Google Scholar] [CrossRef]
- Lazzara, G.; Milioto, S. Dispersions of nanosilica in biocompatible copolymers. Polym. Degrad. Stab. 2010, 95, 610–617. [Google Scholar] [CrossRef]
- Taherkhani, H.; Afroozi, S. Investigating the creep properties of asphaltic concrete containing nano-silica. Sadhana Acad. Proc. Eng. Sci. 2018, 43, 24. [Google Scholar] [CrossRef] [Green Version]
- Hassan, A.F.; Abdelghny, A.M.; Elhadidy, H.; Youssef, A.M. Synthesis and characterization of high surface area nanosilica from rice husk ash by surfactant-free sol-gel method. J. Sol. Gel Sci. Technol. 2014, 69, 465–472. [Google Scholar] [CrossRef]
- Okamoto, M. Polymer/layered silicate nano-composites structure development and processing operations. Int. Polym. Processing 2006, 21, 487–496. [Google Scholar] [CrossRef]
- Metwally, G.A.-T.; Hassanin, H.D.; Elgendy, M.F.; Sawan, A.M. Improving the Performance of Asphalt Mixtures Using Nano Silica. World Appl. Sci. J. 2017, 35, 2614–2621. [Google Scholar]
- Bhat, F.S.; Mir, M.S. Performance evaluation of nanosilica-modified asphalt binder. Innov. Infrastruct. Solut. 2019, 4, 1–10. [Google Scholar] [CrossRef]
- Tanzadeh, J.; Shahrezagamasaei, R. Laboratory Assessment of Hybrid Fiber and Nano-silica on Reinforced Porous Asphalt Mixtures. Constr. Build. Mater. 2017, 144, 260–270. [Google Scholar] [CrossRef]
- Ghasemi, M.; Morteza Marandi, S.; Tahmooresi, M.; Jalal kamali, R.; Taherzade, R. Modification of Stone Matrix Asphalt with Nano-SiO2. J. Basic Appl. Sci. Res. 2012, 2, 1338–1344. [Google Scholar]
- Crucho, J.M.L.; das Neves, J.M.C.; Capitão, S.D.; Picado-Santos, L.G. de Mechanical performance of asphalt concrete modified with nanoparticles: Nanosilica, zero-valent iron and nanoclay. Constr. Build. Mater. 2018, 181, 309–318. [Google Scholar] [CrossRef]
- Caputo, P.; Porto, M.; Angelico, R.; Loise, V.; Calandra, P.; Oliviero Rossi, C. Bitumen and asphalt concrete modified by nanometer-sized particles: Basic concepts, the state of the art and future perspectives of the nano-scale approach. Adv. Colloid Interface Sci. 2020, 285, 102283. [Google Scholar] [CrossRef]
- Mirza, M.W.; Abbas, Z.; Rizvi, M.A. Temperature Zoning of Pakistan for Asphalt Mix Design. Pak. J. Eng. Appl. Sci. 2011, 8, 49–60. [Google Scholar]
- Aman, A.; Hafeez, I.; Zubair, M.; Zaidi, S.B.A. Influence of phosphorous methyl compound on asphalt binder. Int. J. Pavement Eng. 2020, 22, 1–15. [Google Scholar] [CrossRef]
- Read, J.; Whiteoak, D. The Shell Bitumen Handbook, 5th ed.; Thomas Telford Publishing: London, UK, 2003; ISBN 072773220X. [Google Scholar]
- Haider, S.; Hafeez, I.; Bilal Ahmed Zaidi, S.; Ali Nasir, M.; Rizwan, M. A pure case study on moisture sensitivity assessment using tests on both loose and compacted asphalt mixture. Constr. Build. Mater. 2020, 239, 117817. [Google Scholar] [CrossRef]
- Haider, S.; Hafeez, I.; Jamal; Ullah, R. Sustainable use of waste plastic modifiers to strengthen the adhesion properties of asphalt mixtures. Constr. Build. Mater. 2020, 235, 117496. [Google Scholar] [CrossRef]
- Hussan, S.; Kamal, M.A.; Hafeez, I.; Ahmad, N.; Khanzada, S.; Ahmed, S. Modelling asphalt pavement analyzer rut depth using different statistical techniques. Road Mater. Pavement Des. 2018, 21, 1–26. [Google Scholar] [CrossRef]
- Ezzat, H.; El-Badawy, S.; Gabr, A.; Zaki, S.; Breakah, T. Predicted performance of hot mix asphalt modified with nano-montmorillonite and nano-silicon dioxide based on Egyptian conditions. Int. J. Pavement Eng. 2018, 21, 117–142. [Google Scholar] [CrossRef]
- Taherkhani, H.; Afroozi, S. Investigating the Performance Characteristics of Asphaltic Concrete Containing Nano-Silica. Civ. Eng. Infrastruct. J. 2017, 50, 75–93. [Google Scholar]
- Taherkhani, H.; Afroozi, S. The properties of nanosilica-modified asphalt cement. Pet. Sci. Technol. 2016, 34, 1381–1386. [Google Scholar] [CrossRef]
- Galooyak, S.S.; Palassi, M.; Goli, A.; Farahani, H.Z. Performance Evaluation of Nano-silica Modified Bitumen. Int. J. Transp. Eng. 2015, 3, 55–66. [Google Scholar]
- Alhamali, D.I.; Wu, J.; Liu, Q.; Hassan, N.A.; Yusoff, N.I.M.; Ali, S.I.A. Physical and Rheological Characteristics of Polymer Modified Bitumen with Nanosilica Particles. Arab. J. Sci. Eng. 2015, 41, 1521–1530. [Google Scholar] [CrossRef]
- Ganjei, M.A.; Aflaki, E. Application of nano-silica and styrene-butadiene-styrene to improve asphalt mixture self healing. Int. J. Pavement Eng. 2016, 8436, 1–11. [Google Scholar] [CrossRef]
- Amin, G.M.; Esmail, A. Application of nano silica to improve self-healing of asphalt mixes. J. Cent. South Univ. 2017, 24, 1019–1026. [Google Scholar] [CrossRef]
- Bala, N.; Kamaruddin, I.; Napiah, M.; Danlami, N. Rheological and rutting evaluation of composite nanosilica/polyethylene modified bitumen. In Proceedings of the 7th International Conference on Key Engineering Materials (ICKEM 2017), IOP, Penang, Malaysia, 11–13 March 2017; pp. 2–6. [Google Scholar]
- National Highway Authority. Government of Pakistan, Ministry of Communications, General Specifications; Sampak International Pvt Ltd, Engineering Design Supervision and Management Consultants: Lahore, Pakistan, 1998. [Google Scholar]
- The Asphalt Institute. Mix Design Methods for Asphalt Concrete and Other Hot Mix Types, MS—2; The Asphalt Institute: Lexington, KY, USA, 1984. [Google Scholar]
- Huang, B.; Shu, X.; Chen, X. Effects of mineral fillers on hot-mix asphalt laboratory-measured properties. Int. J. Pavement Eng. 2007, 8, 1–9. [Google Scholar] [CrossRef]
- Faizan, M.; Ahmad, N.; Nasir, M.A.; Jamal; Hafeez, M.; Rafi, J.; Bilal Ahmed Zaidi, S.; Haroon, W. Carbon Nanotubes (CNTs) in Asphalt Binder: Homogeneous Dispersion and Performance Enhancement. Appl. Sci. 2018, 8, 1–19. [Google Scholar]
- Ali, S.I.A.; Ismail, A.; Karim, M.R.; Yusoff, N.I.M.; Al-Mansob, R.A.; Aburkaba, E. Performance evaluation of Al2O3 nanoparticle-modified asphalt binder. Road Mater. Pavement Des. 2017, 18, 1251–1268. [Google Scholar] [CrossRef]
- ASTM. D 5 Standard Test Method for Penetration of Bituminous Materials; Annual Book of ASTM Standards; ASTM: West Conshohocken, PA, USA, 1997; pp. 1–3. [Google Scholar]
- ASTM. D 36 Standard Test Method for Softening Point of Bitumen (Ring and Ball Apparatus); Annual Book of ASTM Standards; ASTM: West Conshohocken, PA, USA, 2000; pp. 8–11. [Google Scholar]
- ASTM. D 92 Standard Test Method for Flash and Fire Points by Cleveland Open Cup Tester; Annual Book of ASTM Standards; ASTM: West Conshohocken, PA, USA, 2007; pp. 1–10. [Google Scholar]
- ASTM. D 113 Standard Test Method for Ductility of Bituminous Materials; Annual Book of ASTM Standards; ASTM: West Conshohocken, PA, USA, 1999; pp. 25–27. [Google Scholar]
- Hafeez, I.; Hussain, J.; Riaz, K.; Khitab, A.; Hussain, S.; Zaidi, B.; Farooqi, U.; Hayat, A.; Ahmed, I.; Asif, A. Influence of time and temperature on asphalt binders rheological properties. Life Sci. J. 2013, 10, 894–898. [Google Scholar]
- AASHTO. T 315-10 Determining the Rheological Properties of Asphalt Binder Using a Dynamic Shear Rheometer (DSR); AASHTO: Washington, DC, USA, 2010. [Google Scholar]
- Canestrari, F.; Cardone, F.; Graziani, A.; Santagata, F.A.; Bahia, H.U. Adhesive and cohesive properties of asphalt-aggregate systems subjected to moisture damage. Road Mater. Pavement Des. 2010, 11, 11–32. [Google Scholar] [CrossRef]
- Behiry, A.E.A.E.M. Laboratory evaluation of resistance to moisture damage in asphalt mixtures. Ain Shams Eng. J. 2013, 4, 351–363. [Google Scholar] [CrossRef] [Green Version]
- ASTM International. D 4541-17, A. D4541-17: Standard Test Method for Pull-Off Strength of Coatings Using Portable Adhesion; ASTM International: West Conshohocken, PA, USA, 2014; pp. 1–16. [Google Scholar]
- Ali, A.; Ahmad, N.; Adeel, M.; Bilal Ahmed Zaidi, S.; Jameel, M.S.; Qureshi, F.A.; Haroon, W.; Asif, S.A. Performance Evaluation of Bone Glue Modified Asphalt. Adv. Mater. Sci. Eng. 2019, 2019, 13. [Google Scholar] [CrossRef] [Green Version]
- Jamal; Hafeez, I.; Yaseen, G.; Aziz, A. Influence of Cereclor on the performance of aged asphalt binder. Int. J. Pavement Eng. 2020, 21, 1309–1320. [Google Scholar] [CrossRef]
- Abdullah, M.E.; Zamhari, K.A.; Nayan, N.; Hainin, M.R.; Hermadi, M. Storage Stability and Physical Properties of Asphalt Modified with Nanoclay and Warm Mix Asphalt Additives. World J. Eng. 2011, 2, 3–4. [Google Scholar]
- Hussein, A.A.; Jaya, R.P.; Abdul Hassan, N.; Yaacob, H.; Huseien, G.F.; Ibrahim, M.H.W. Performance of nanoceramic powder on the chemical and physical properties of bitumen. Constr. Build. Mater. 2017, 156, 496–505. [Google Scholar] [CrossRef]
- Loise, V.; Calandra, P.; Abe, A.A.; Porto, M.; Oliviero Rossi, C.; Davoli, M.; Caputo, P. Additives on aged bitumens: What probe to distinguish between rejuvenating and fluxing effects? J. Mol. Liq. 2021, 339, 116742. [Google Scholar] [CrossRef]
- Ba-Abbad, M.M.; Chai, P.V.; Takriff, M.S.; Benamor, A.; Mohammad, A.W. Optimization of nickel oxide nanoparticle synthesis through the sol-gel method using Box-Behnken design. Mater. Des. 2015, 86, 948–956. [Google Scholar] [CrossRef]
- Karnati, S.R.; Oldham, D.; Fini, E.H.; Zhang, L. Surface functionalization of silica nanoparticles to enhance aging resistance of asphalt binder. Constr. Build. Mater. 2019, 211, 1065–1072. [Google Scholar] [CrossRef]
- Leiva-Villacorta, F.; Vargas-Nordcbeck, A. Optimum content of nano-silica to ensure proper performance of an asphalt binder. Road Mater. Pavement Des. 2019, 20, 414–425. [Google Scholar] [CrossRef]
- Yao, H.; You, Z.; Li, L.; Lee, C.H.; Wingard, D.; Yap, Y.K.; Shi, X.; Goh, S.W. Rheological Properties and Chemical Bonding of Asphalt Modified with Nanosilica. J. Mater. Civ. Eng. 2013, 25, 1619–1630. [Google Scholar] [CrossRef] [Green Version]
- Hofko, B.; Alavi, M.Z.; Grothe, H.; Jones, D.; Harvey, J. Repeatability and sensitivity of FTIR ATR spectral analysis methods for bituminous binders. Mater. Struct. Mater. Constr. 2017, 50, 1–15. [Google Scholar] [CrossRef] [Green Version]
- IR Spectra. Available online: https://chem.libretexts.org/@go/page/213355 (accessed on 23 April 2020).
- Liu, X. IR Spectrum and Characteristic Absorption Bands. In Organic Chemistry I; Kwantlen Polytechnic University: Surrey, BC, Canada, 2021; ISBN 978-1-989864-52-4. [Google Scholar]
- Mostafa, A.E.A. Examining the Performance of Hot Mix Asphalt Using Nano- Materials. IOSR J. Eng. (IOSRJEN) 2016, 6, 25–34. [Google Scholar]
- Felode, O.; Jonathan, G.; Ohinola, O. Softening point and Penetration Index of bitumen from parts of Southwestern Nigeria. Nafta 2012, 63, 319–323. [Google Scholar]
- Al-Omari, A.A.; Khedaywi, T.S.; Khasawneh, M.A. Laboratory characterization of asphalt binders modified with waste vegetable oil using SuperPave specifications. Int. J. Pavement Res. Technol. 2018, 11, 68–76. [Google Scholar] [CrossRef]
- Airey, G.D. Use of Black Diagrams to Identify Inconsistencies in Rheological Data. Road Mater. Pavement Des. 2002, 3, 403–424. [Google Scholar] [CrossRef]
- Airey, G.D.; Rahimzadeh, B.; Collop, A.C. Linear Viscoelastic Limits of Bituminous Binders. In Proceedings of the Asphalt Paving Technology 2002, Colorado Springs, CO, USA, 18–20 March 2002; Volume 71. [Google Scholar]
- Bahia, H.; Moraes, R.; Velasquez, R. the Effect of Bitumen Stiffness on the Adhesive Strength Measured By the Bitumen Bond Strength Test. In Proceedings of the 5th Eurasphalt and Eurobitume Congress, Istanbul, Turkey, 13–15 June 2012. [Google Scholar]
- Moraes, R.; Velasquez, R.; Bahia, H.U. Measuring the Effect of Moisture on Asphalt–Aggregate Bond with the Bitumen Bond Strength Test. Transp. Res. Rec. J. Transp. Res. Board 2011, 2209, 70–81. [Google Scholar] [CrossRef] [Green Version]
- Valadares, L.F.; Linares, E.M.; Bragança, F.C.; Galembeck, F. Electrostatic adhesion of nanosized particles: The cohesive role of water. J. Phys. Chem. C 2008, 112, 8534–8544. [Google Scholar] [CrossRef]
- Mirković, K.; Tošić, N.; Mladenović, G. Effect of Different Types of Fly Ash on Properties of Asphalt Mixtures. Adv. Civ. Eng. 2019, 2019, 8107264. [Google Scholar] [CrossRef]
- Chelovian, A.; Shafabakhsh, G. Laboratory evaluation of Nano Al2O3 effect on dynamic performance of stone mastic asphalt. Int. J. Pavement Res. Technol. 2017, 10, 131–138. [Google Scholar] [CrossRef] [Green Version]
Figure 1.
Road map of study.
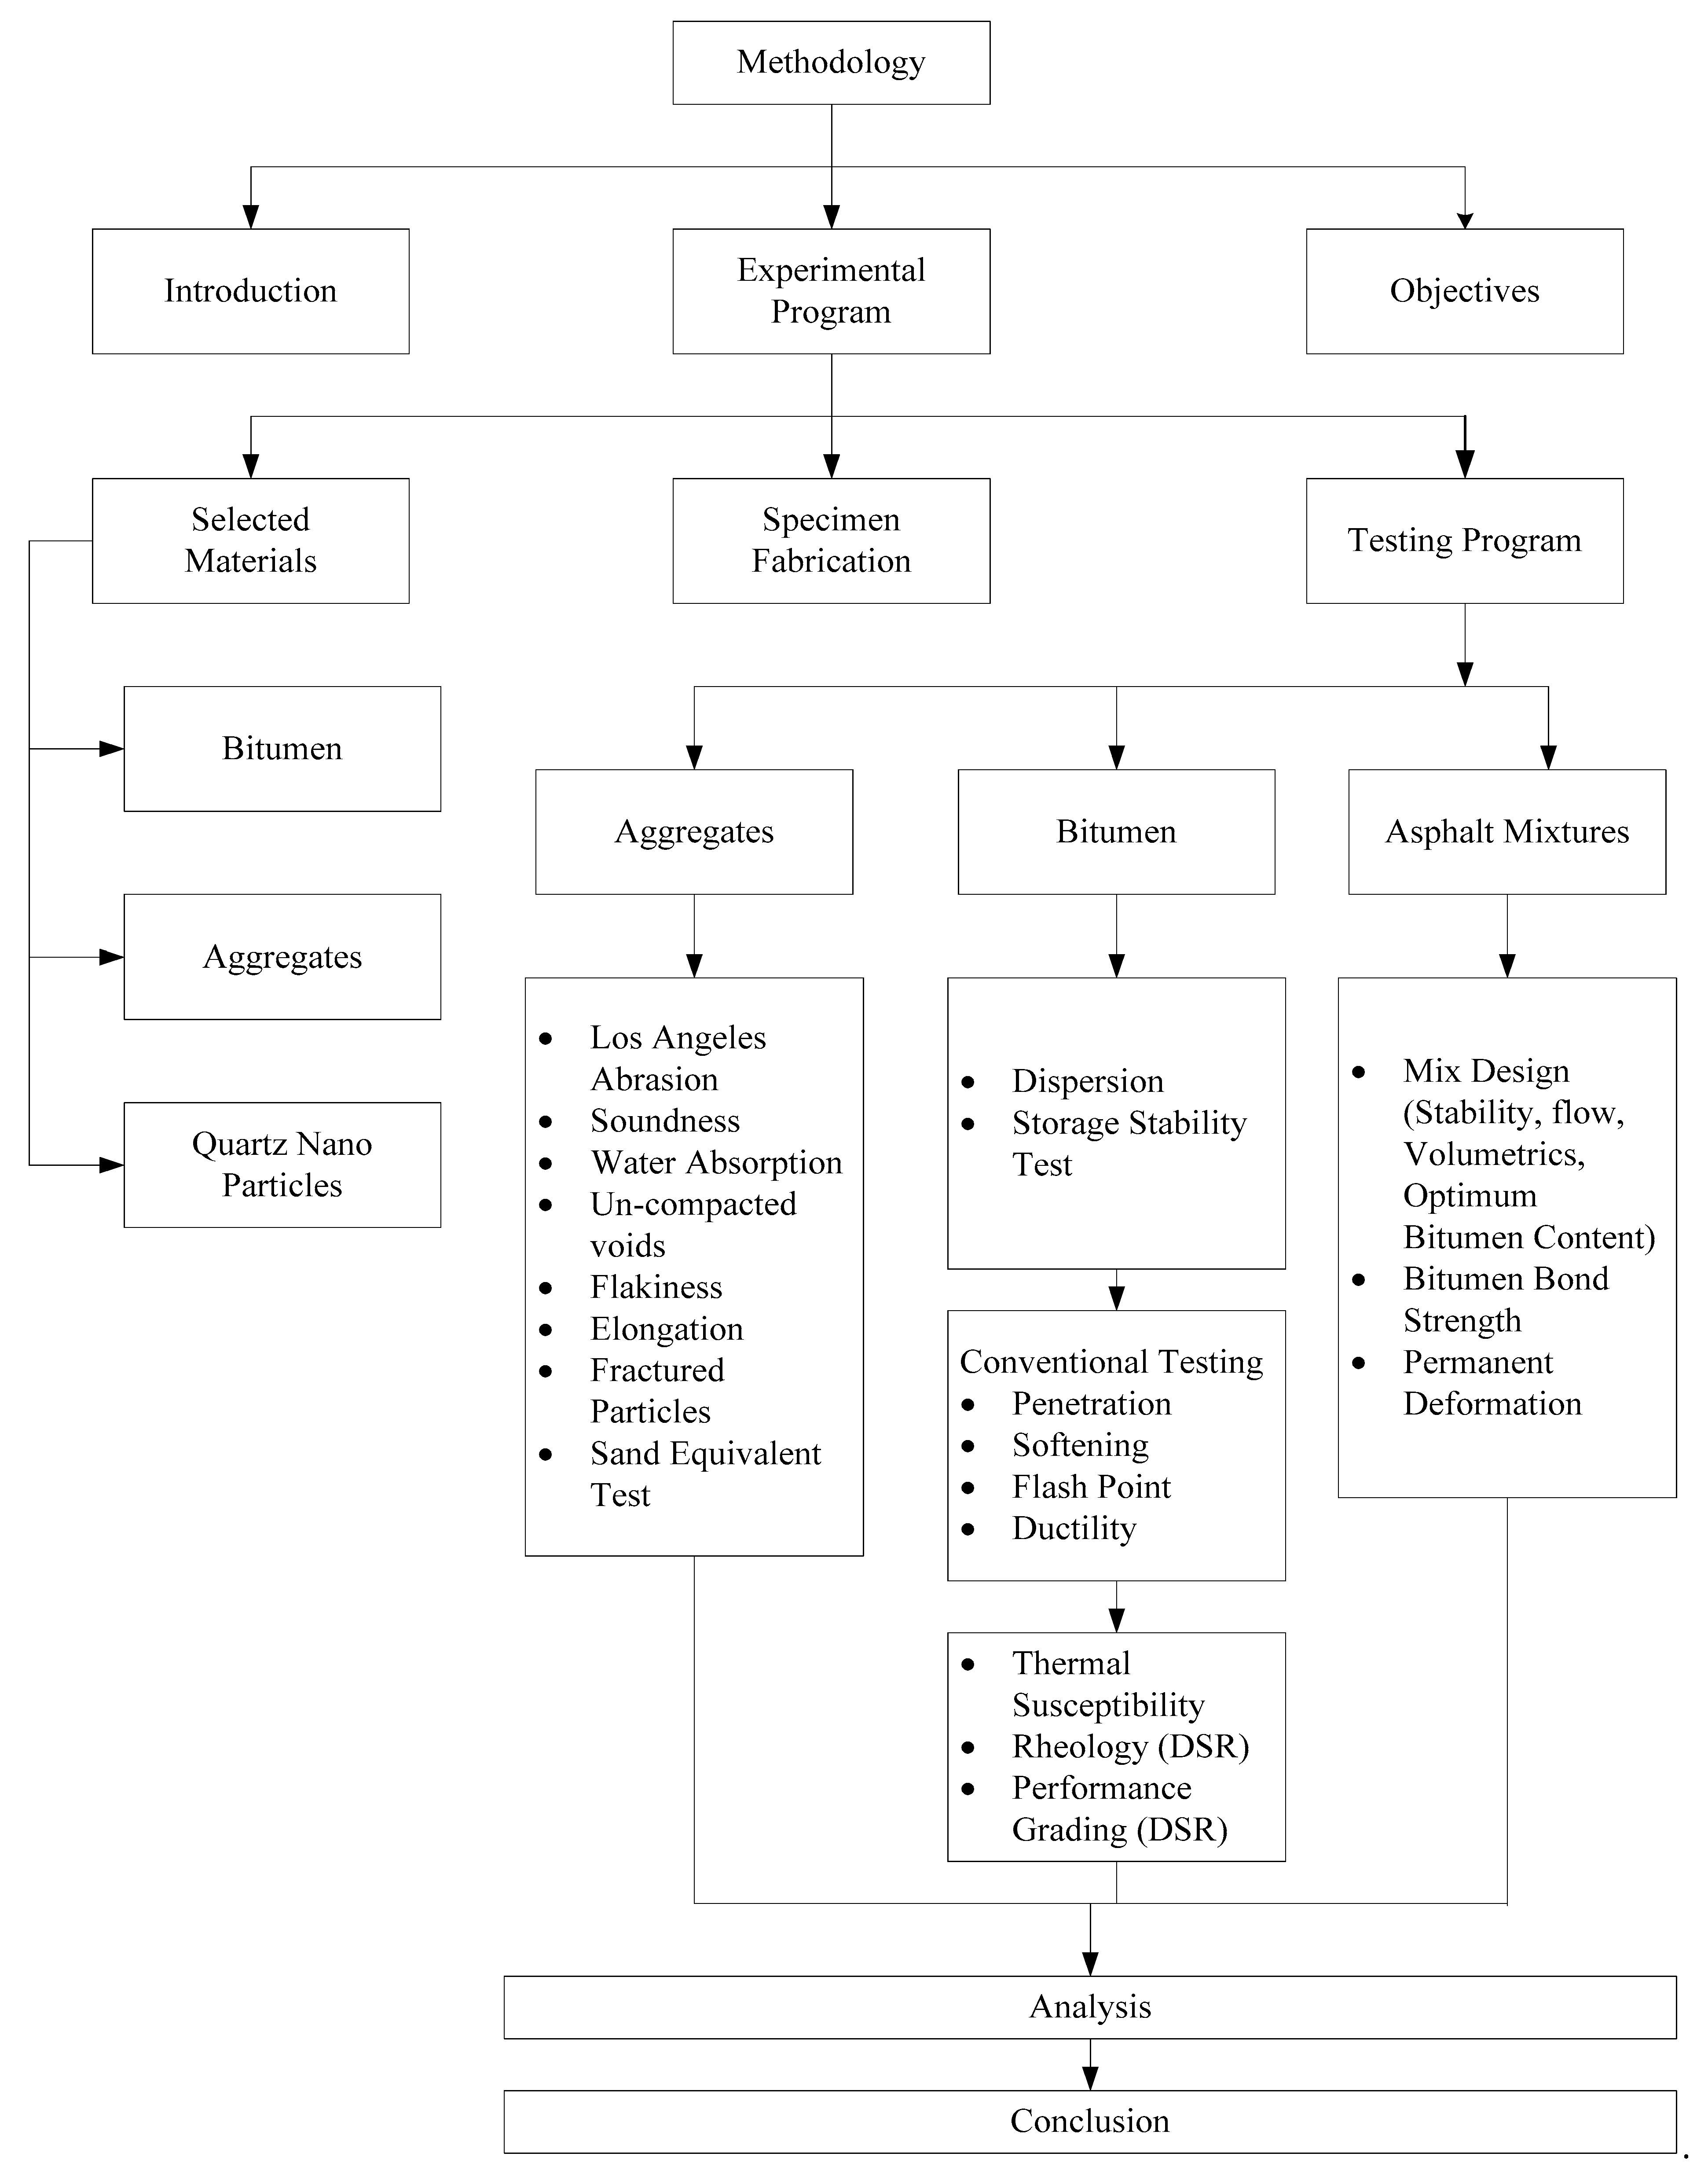
Figure 2.
Mixing of (a) 0%, (b) 1% QNPs, (c) 3% QNPs, and (d) 5% QNPs bitumen.
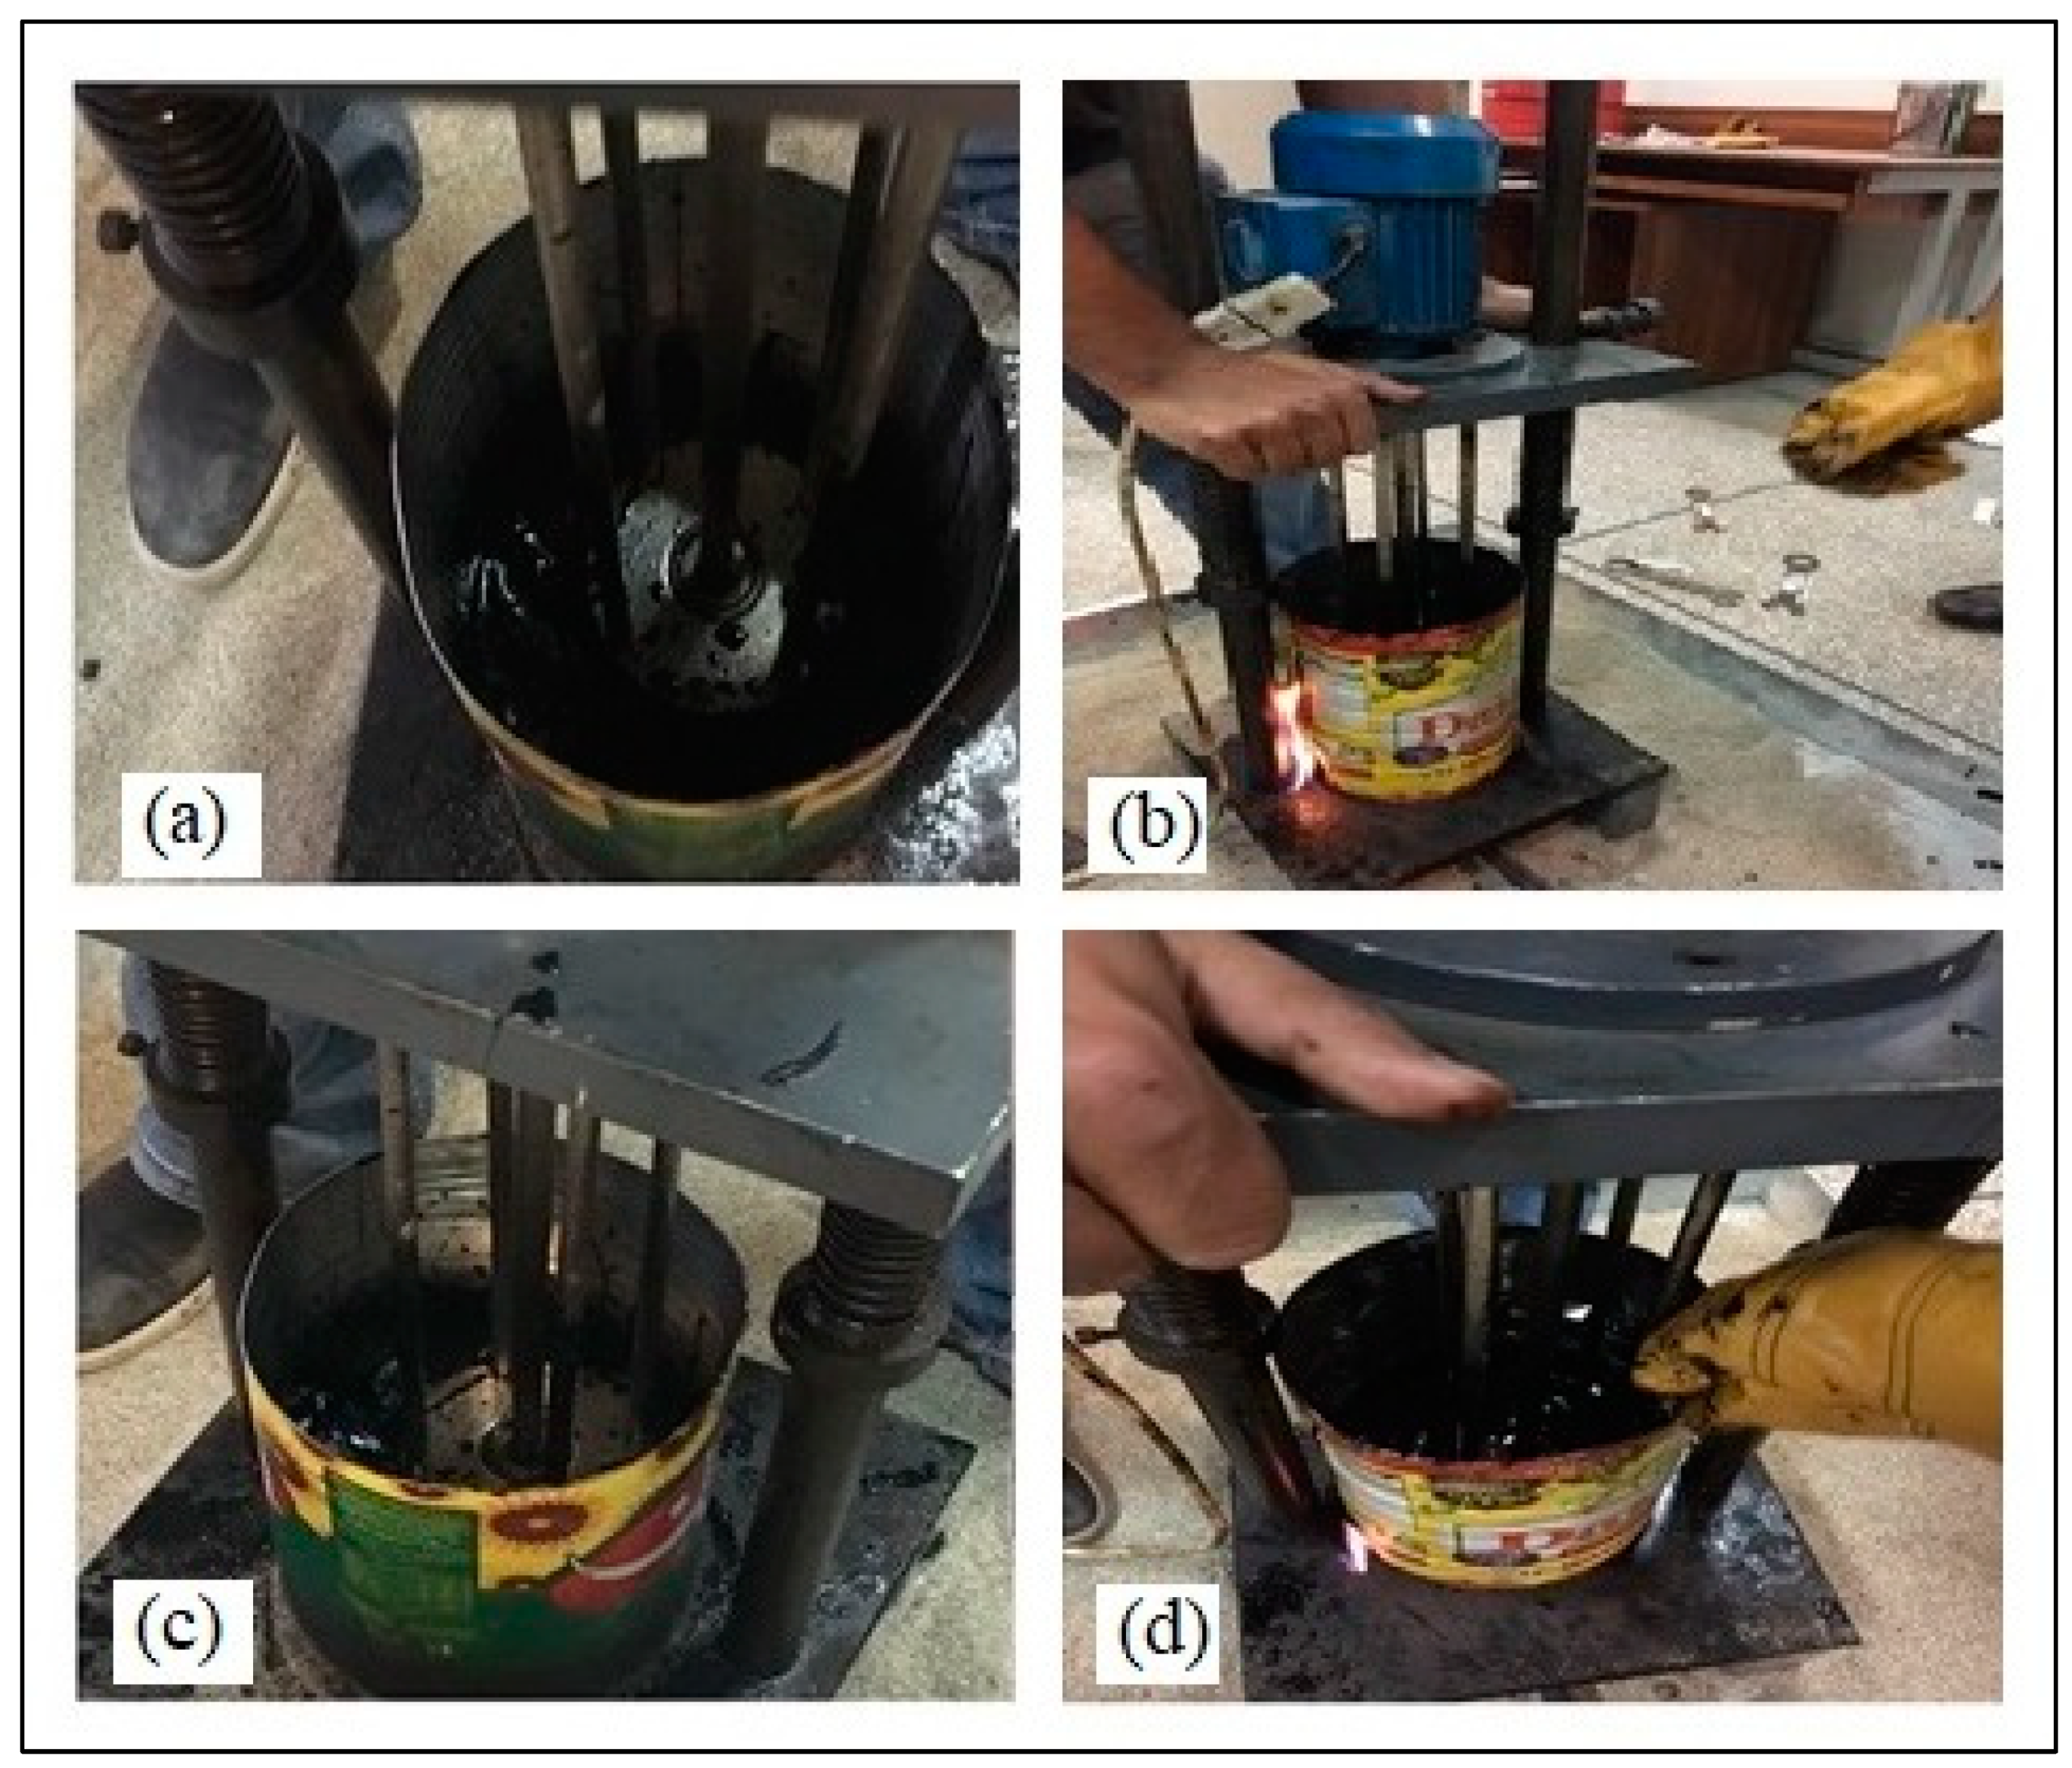
Figure 3.
NHA Class B Wearing Course.

Figure 4.
SEM images of (a) 0%, (b) 1%, (c) 3%, and (d) 5% QNP bitumen.
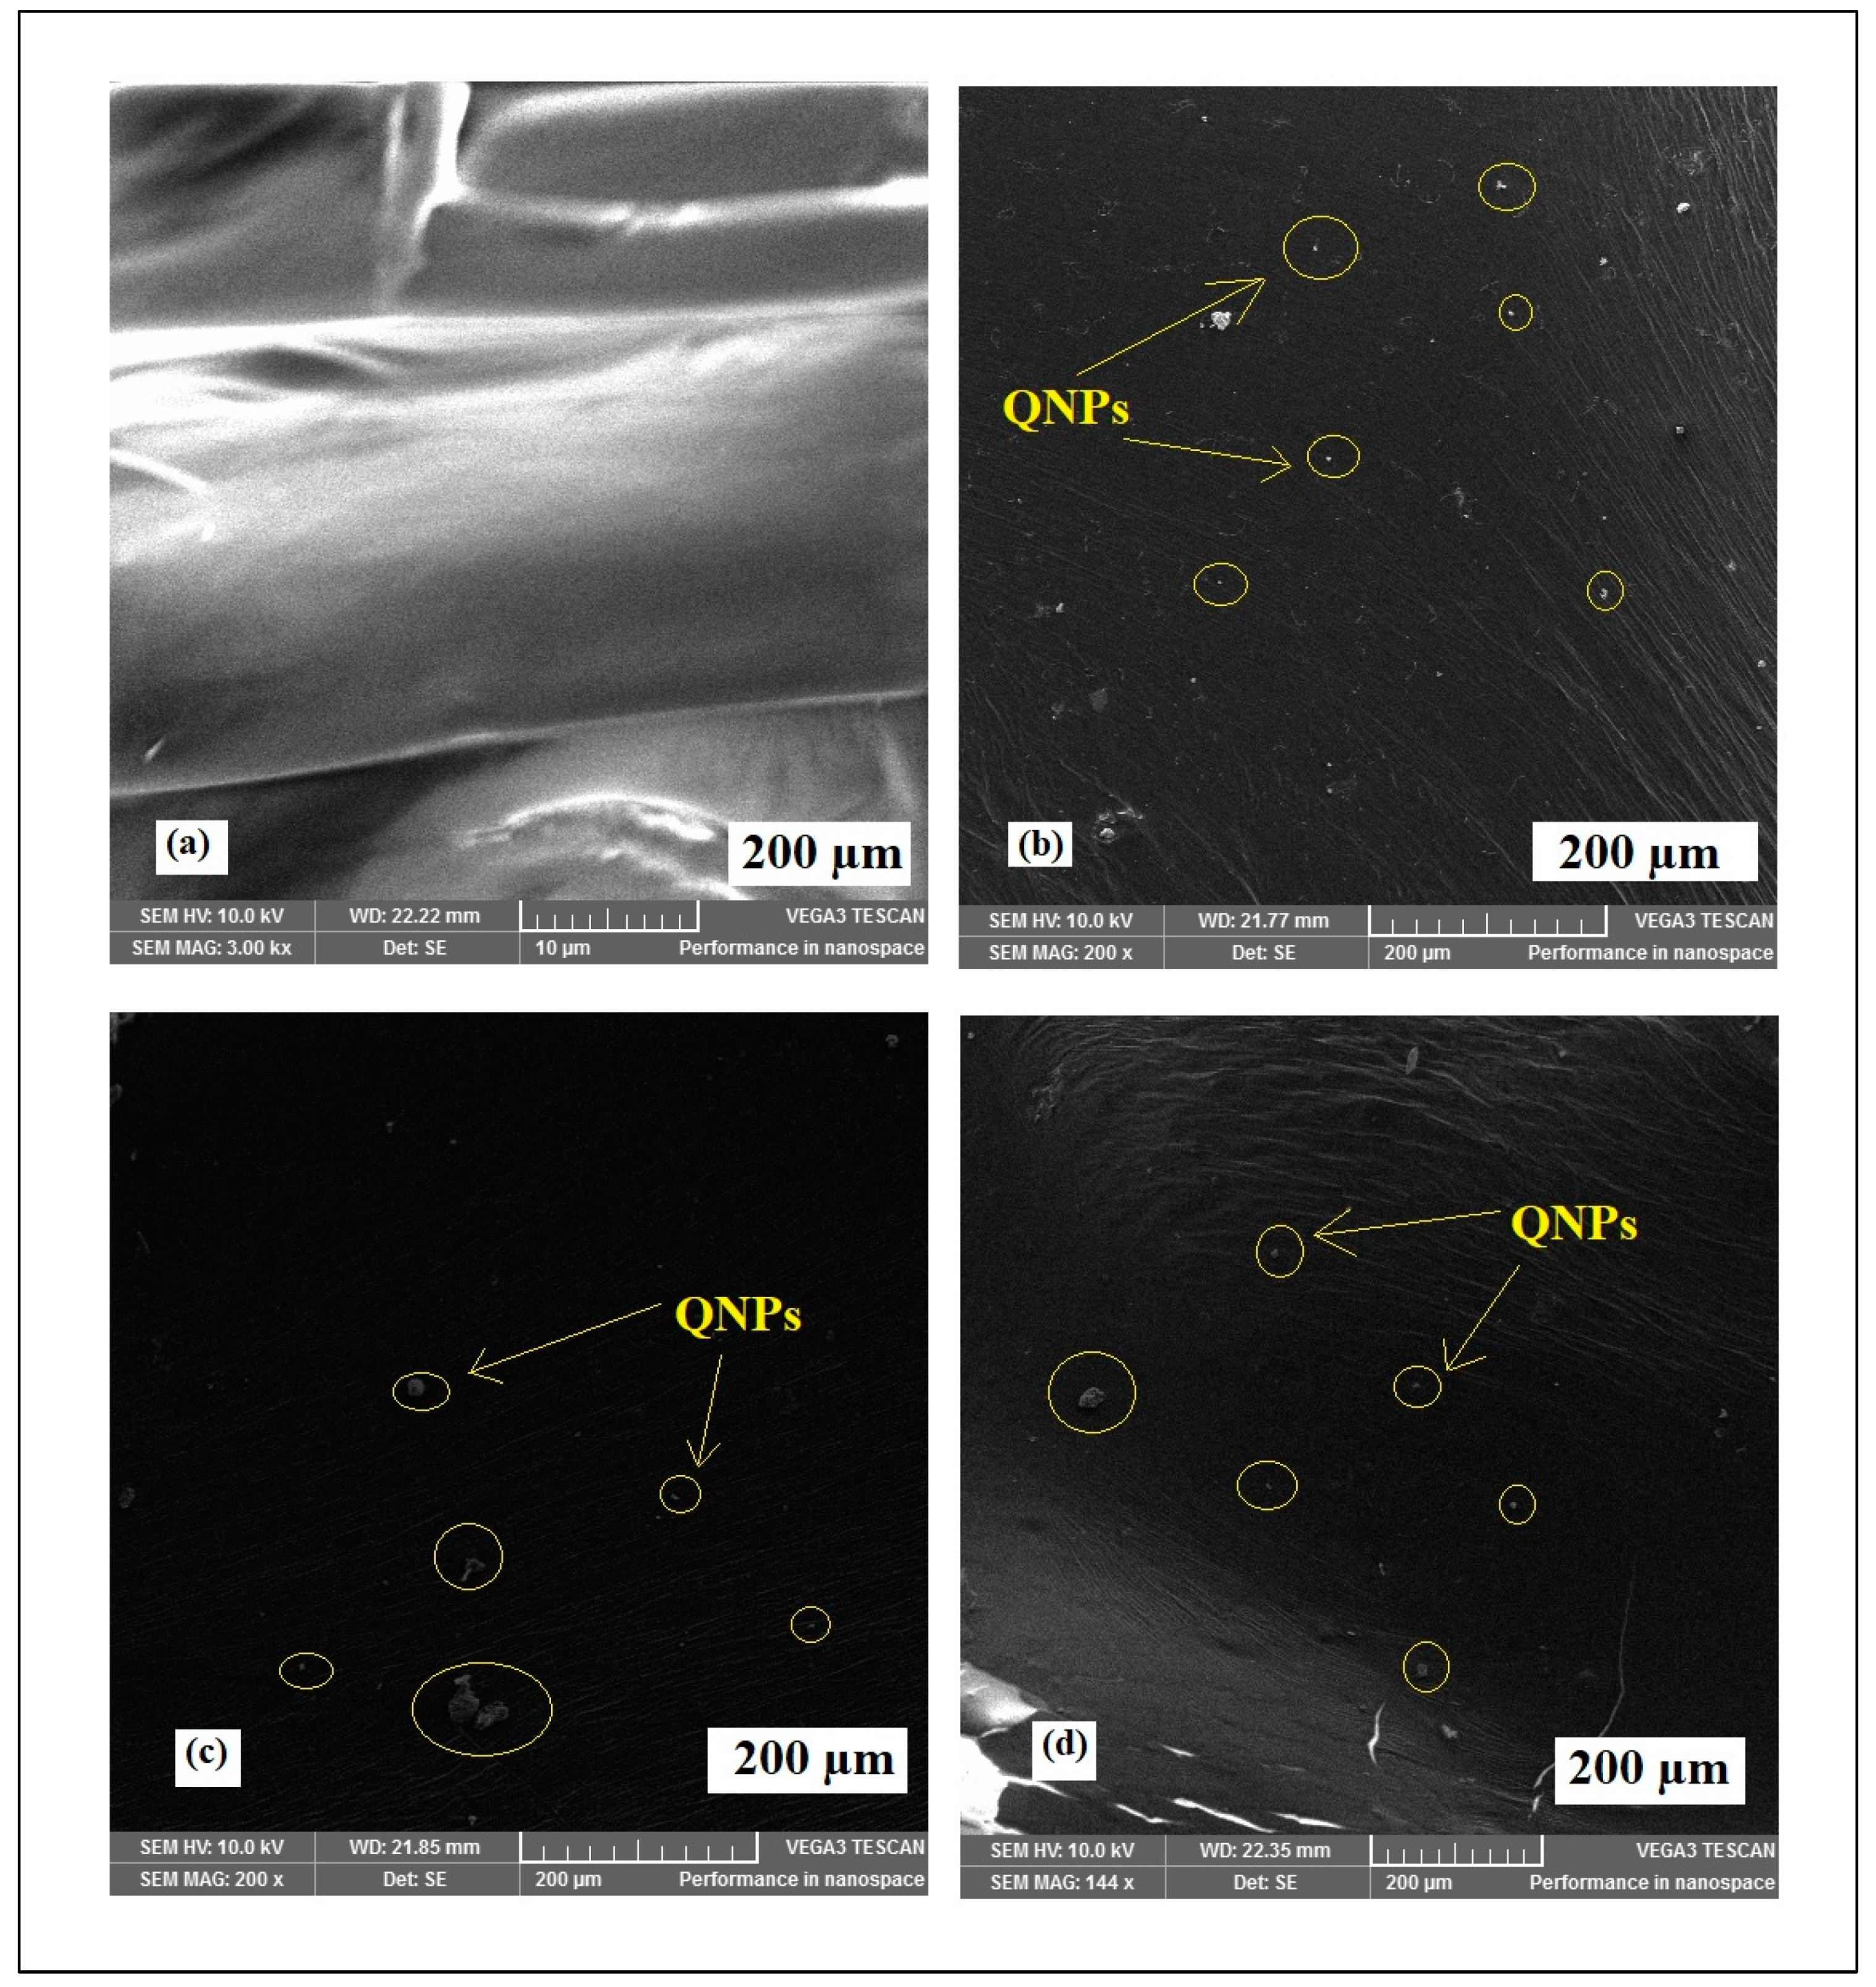
Figure 5.
FTIR spectrum.
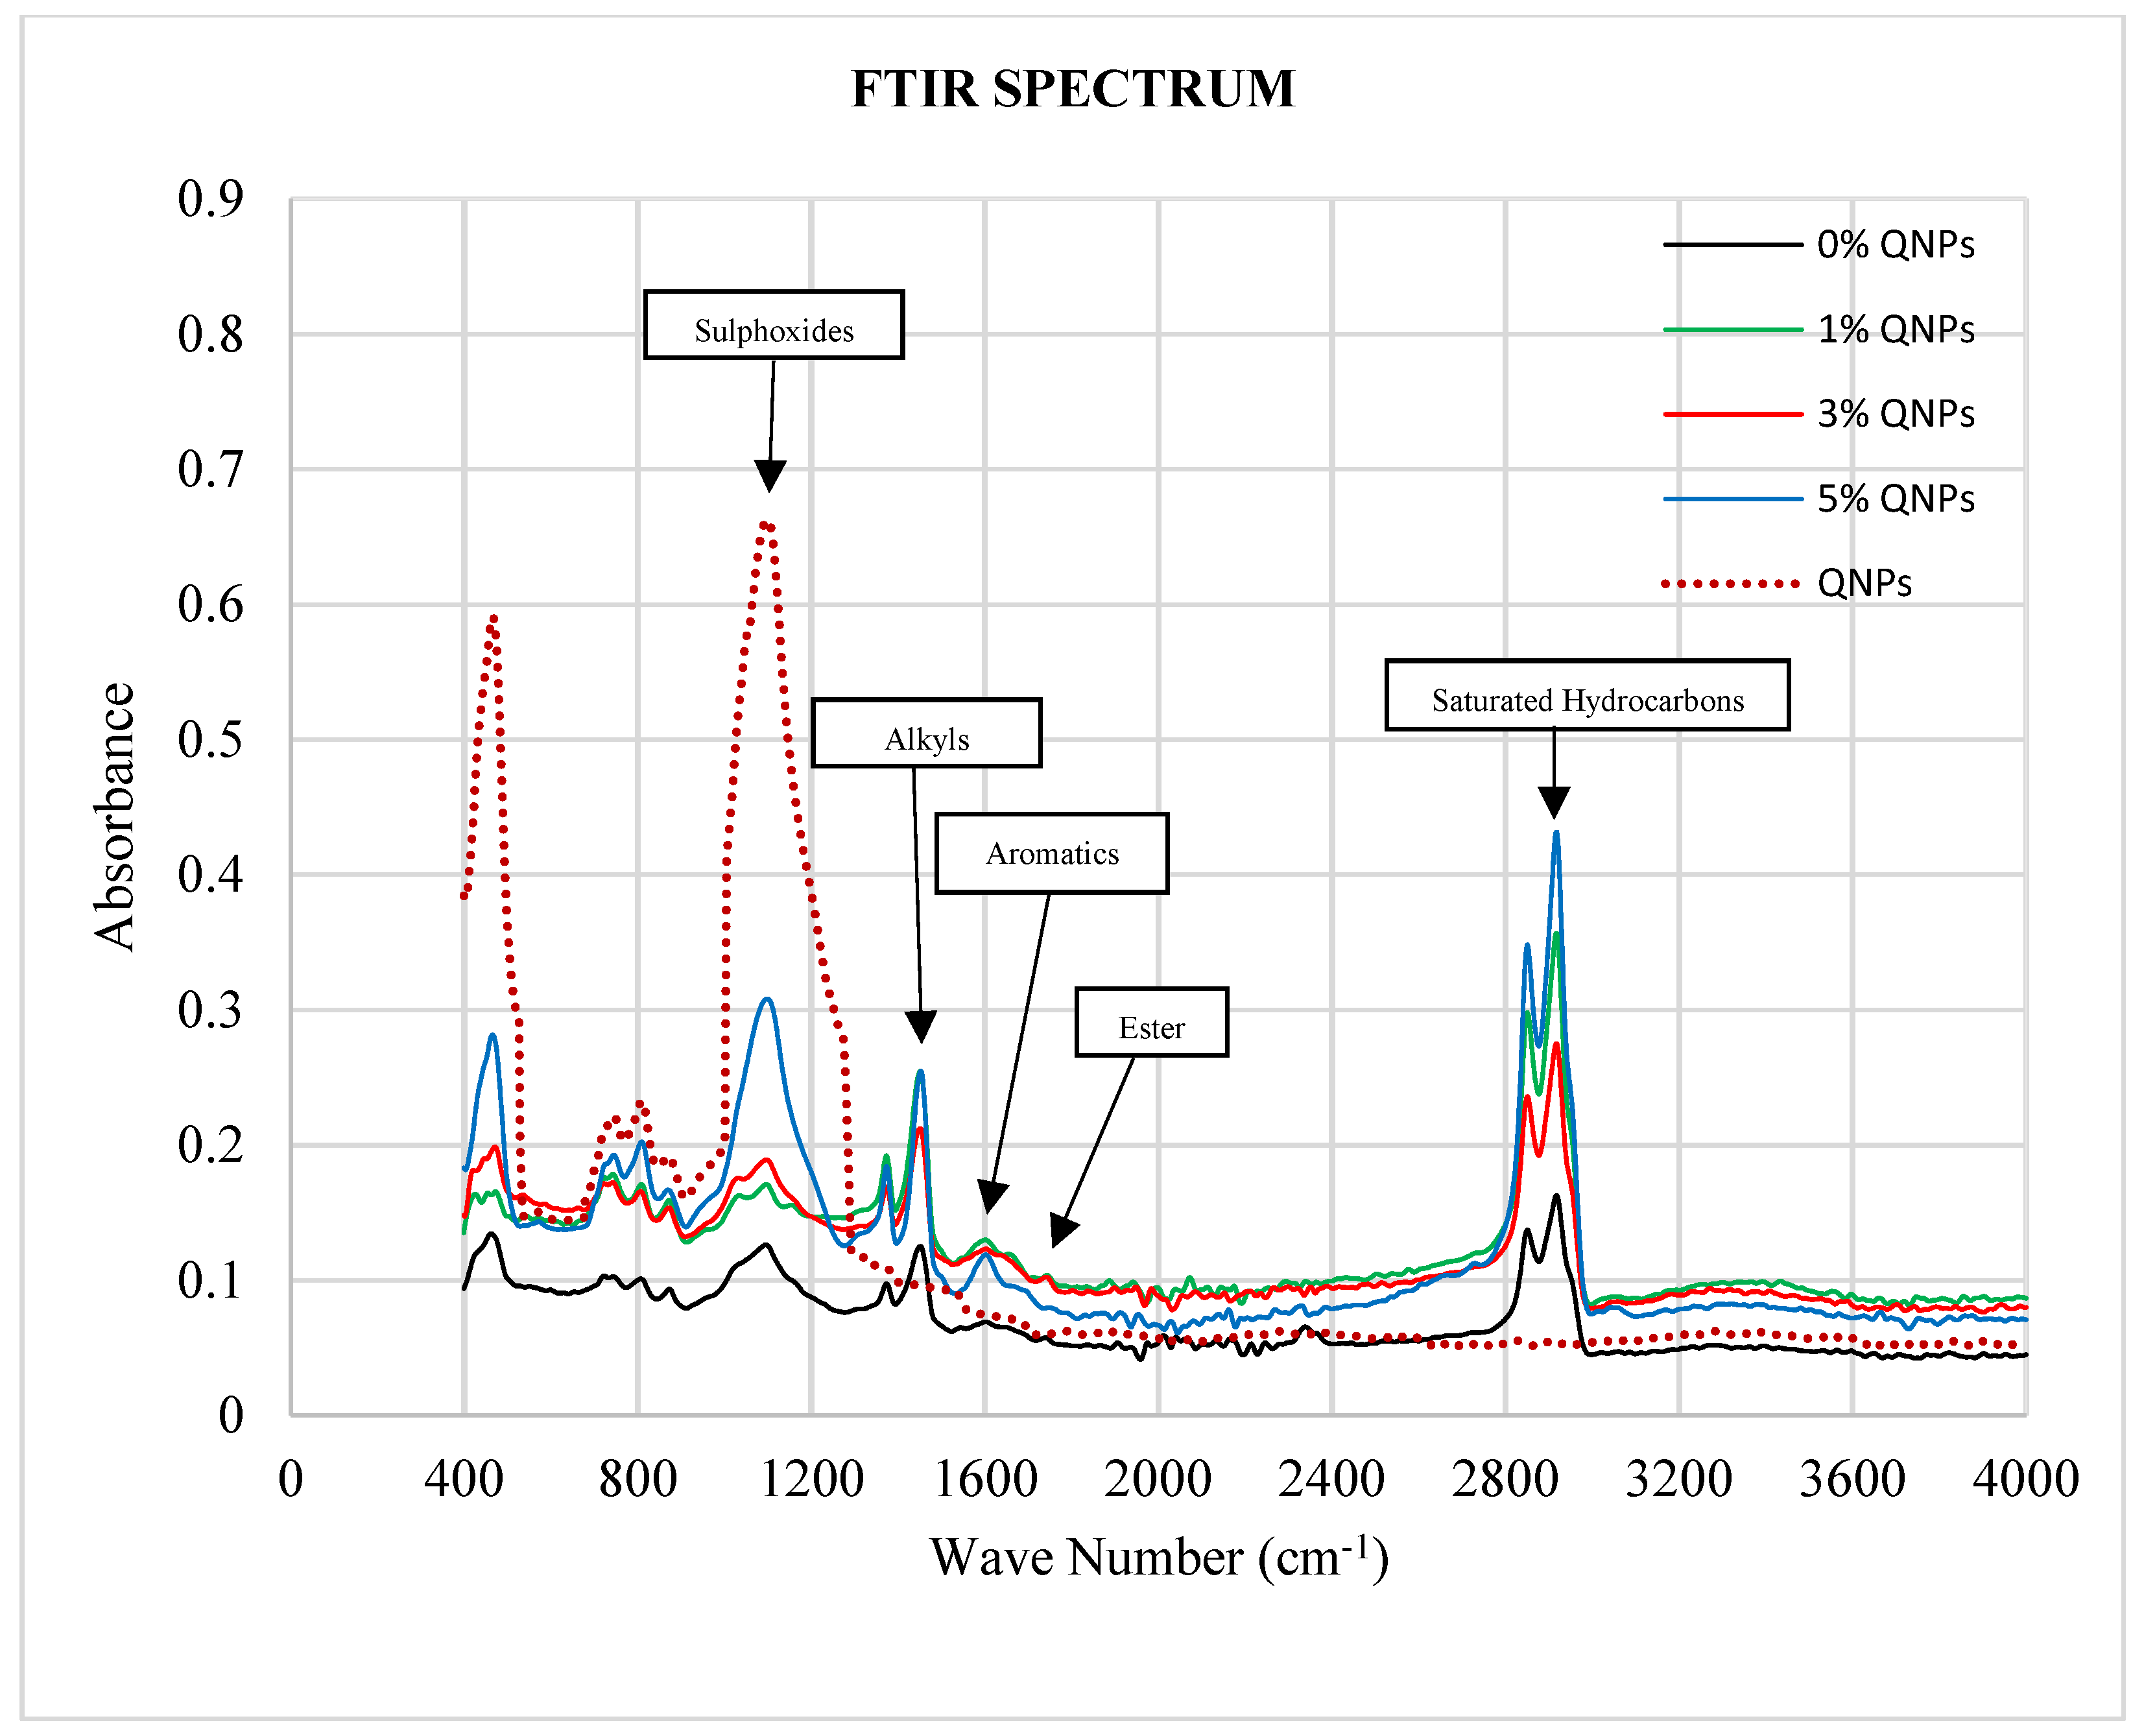
Figure 6.
IR spectrum.
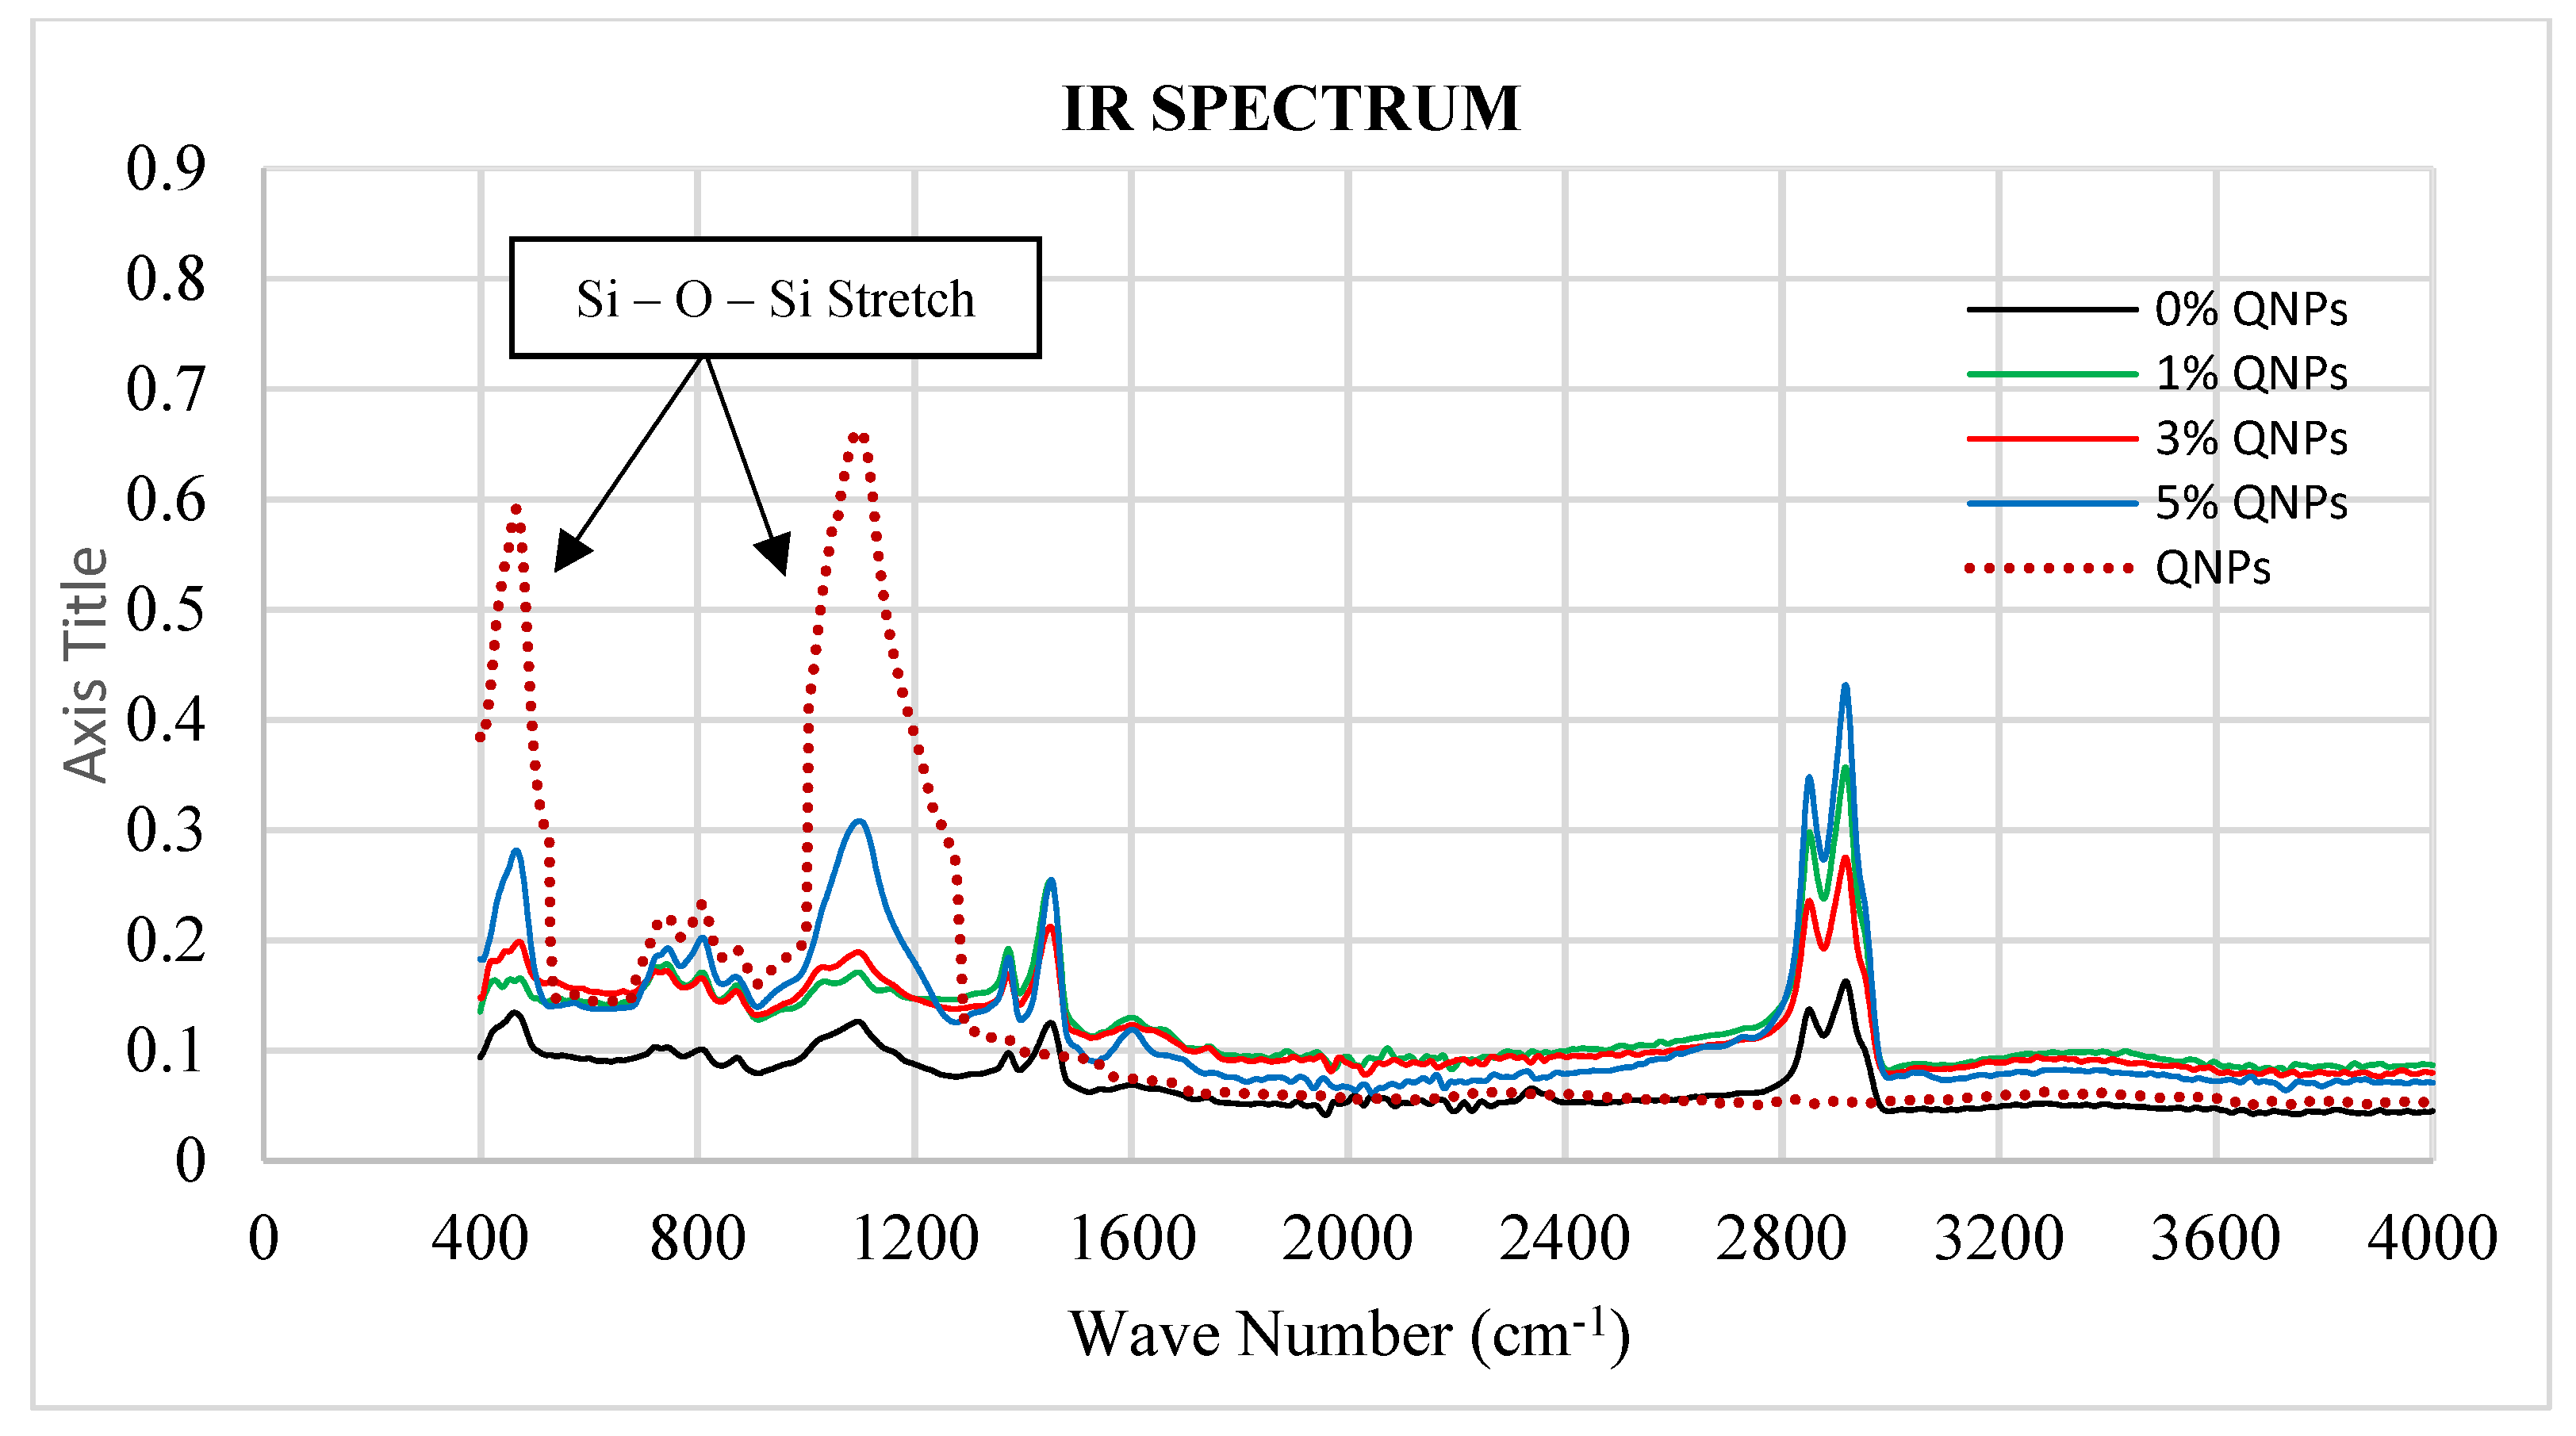
Figure 7.
Structural index.

Figure 8.
Influence of QNPs on penetration and softening values.
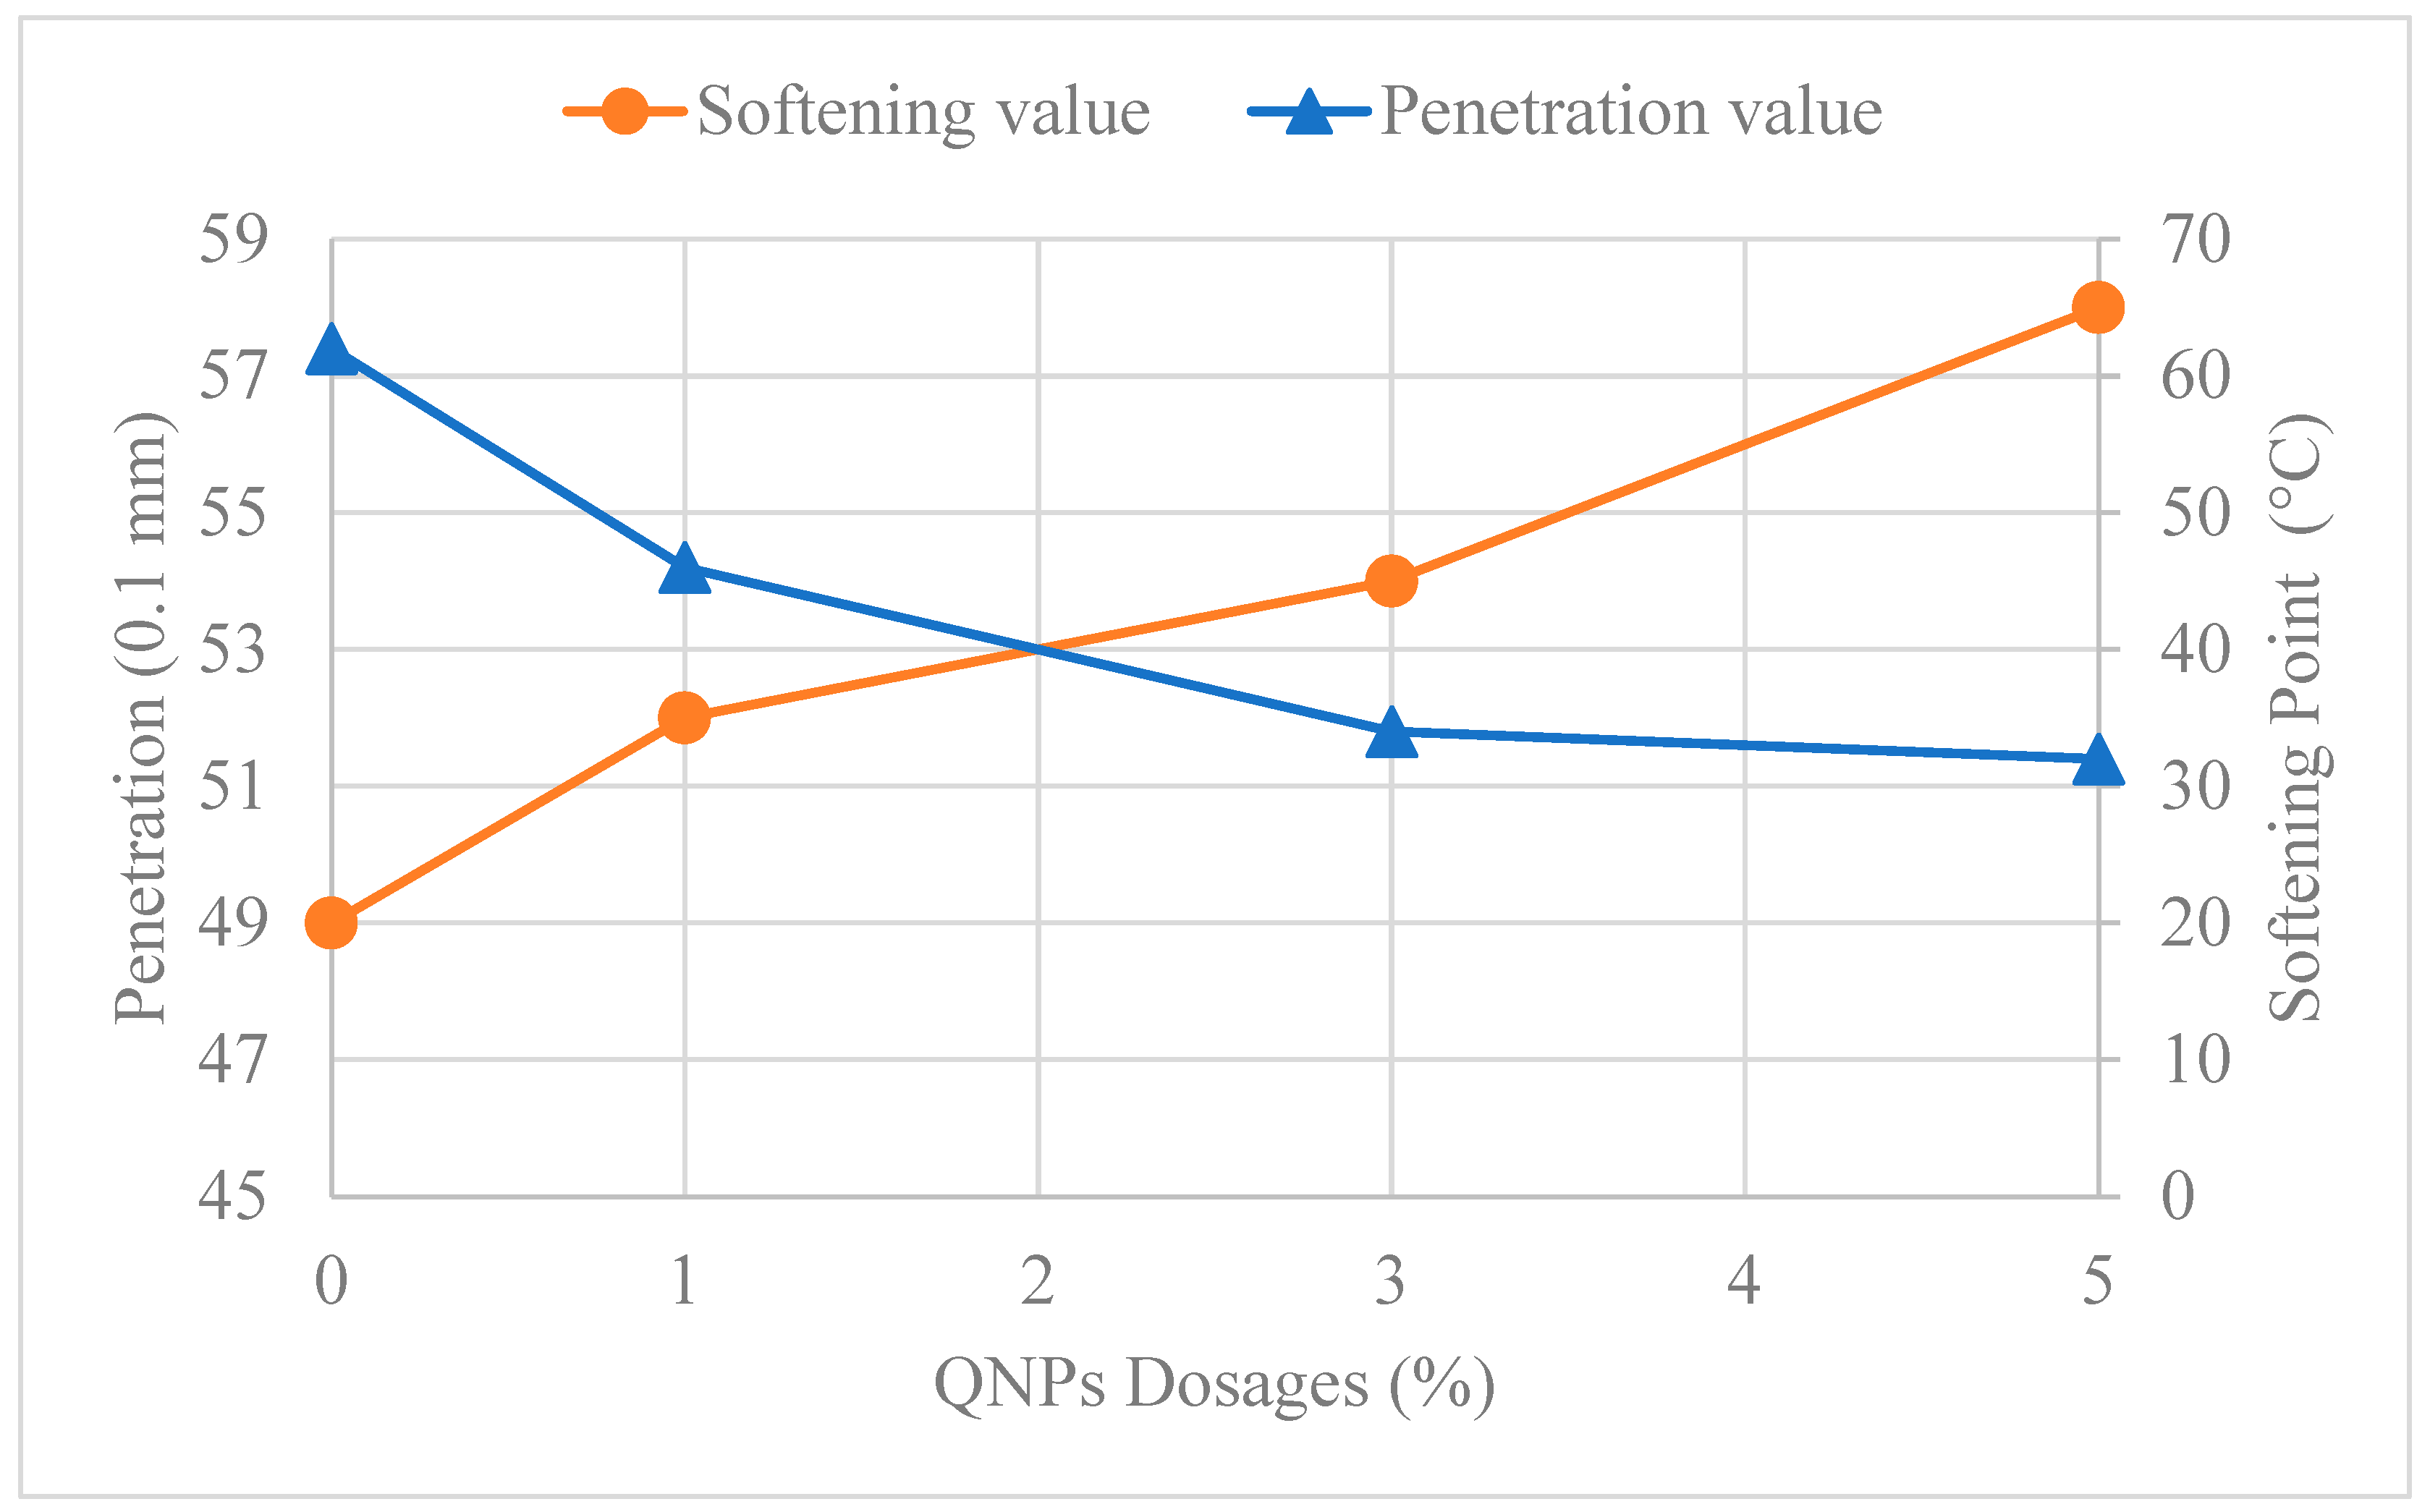
Figure 9.
Influence of QNPs on penetration index and thermal susceptibility.

Figure 10.
Master curves G* of all samples.

Figure 11.
Master curves of the phase angle of all samples.

Figure 12.
Master curves of G*/sin (δ) of all samples.
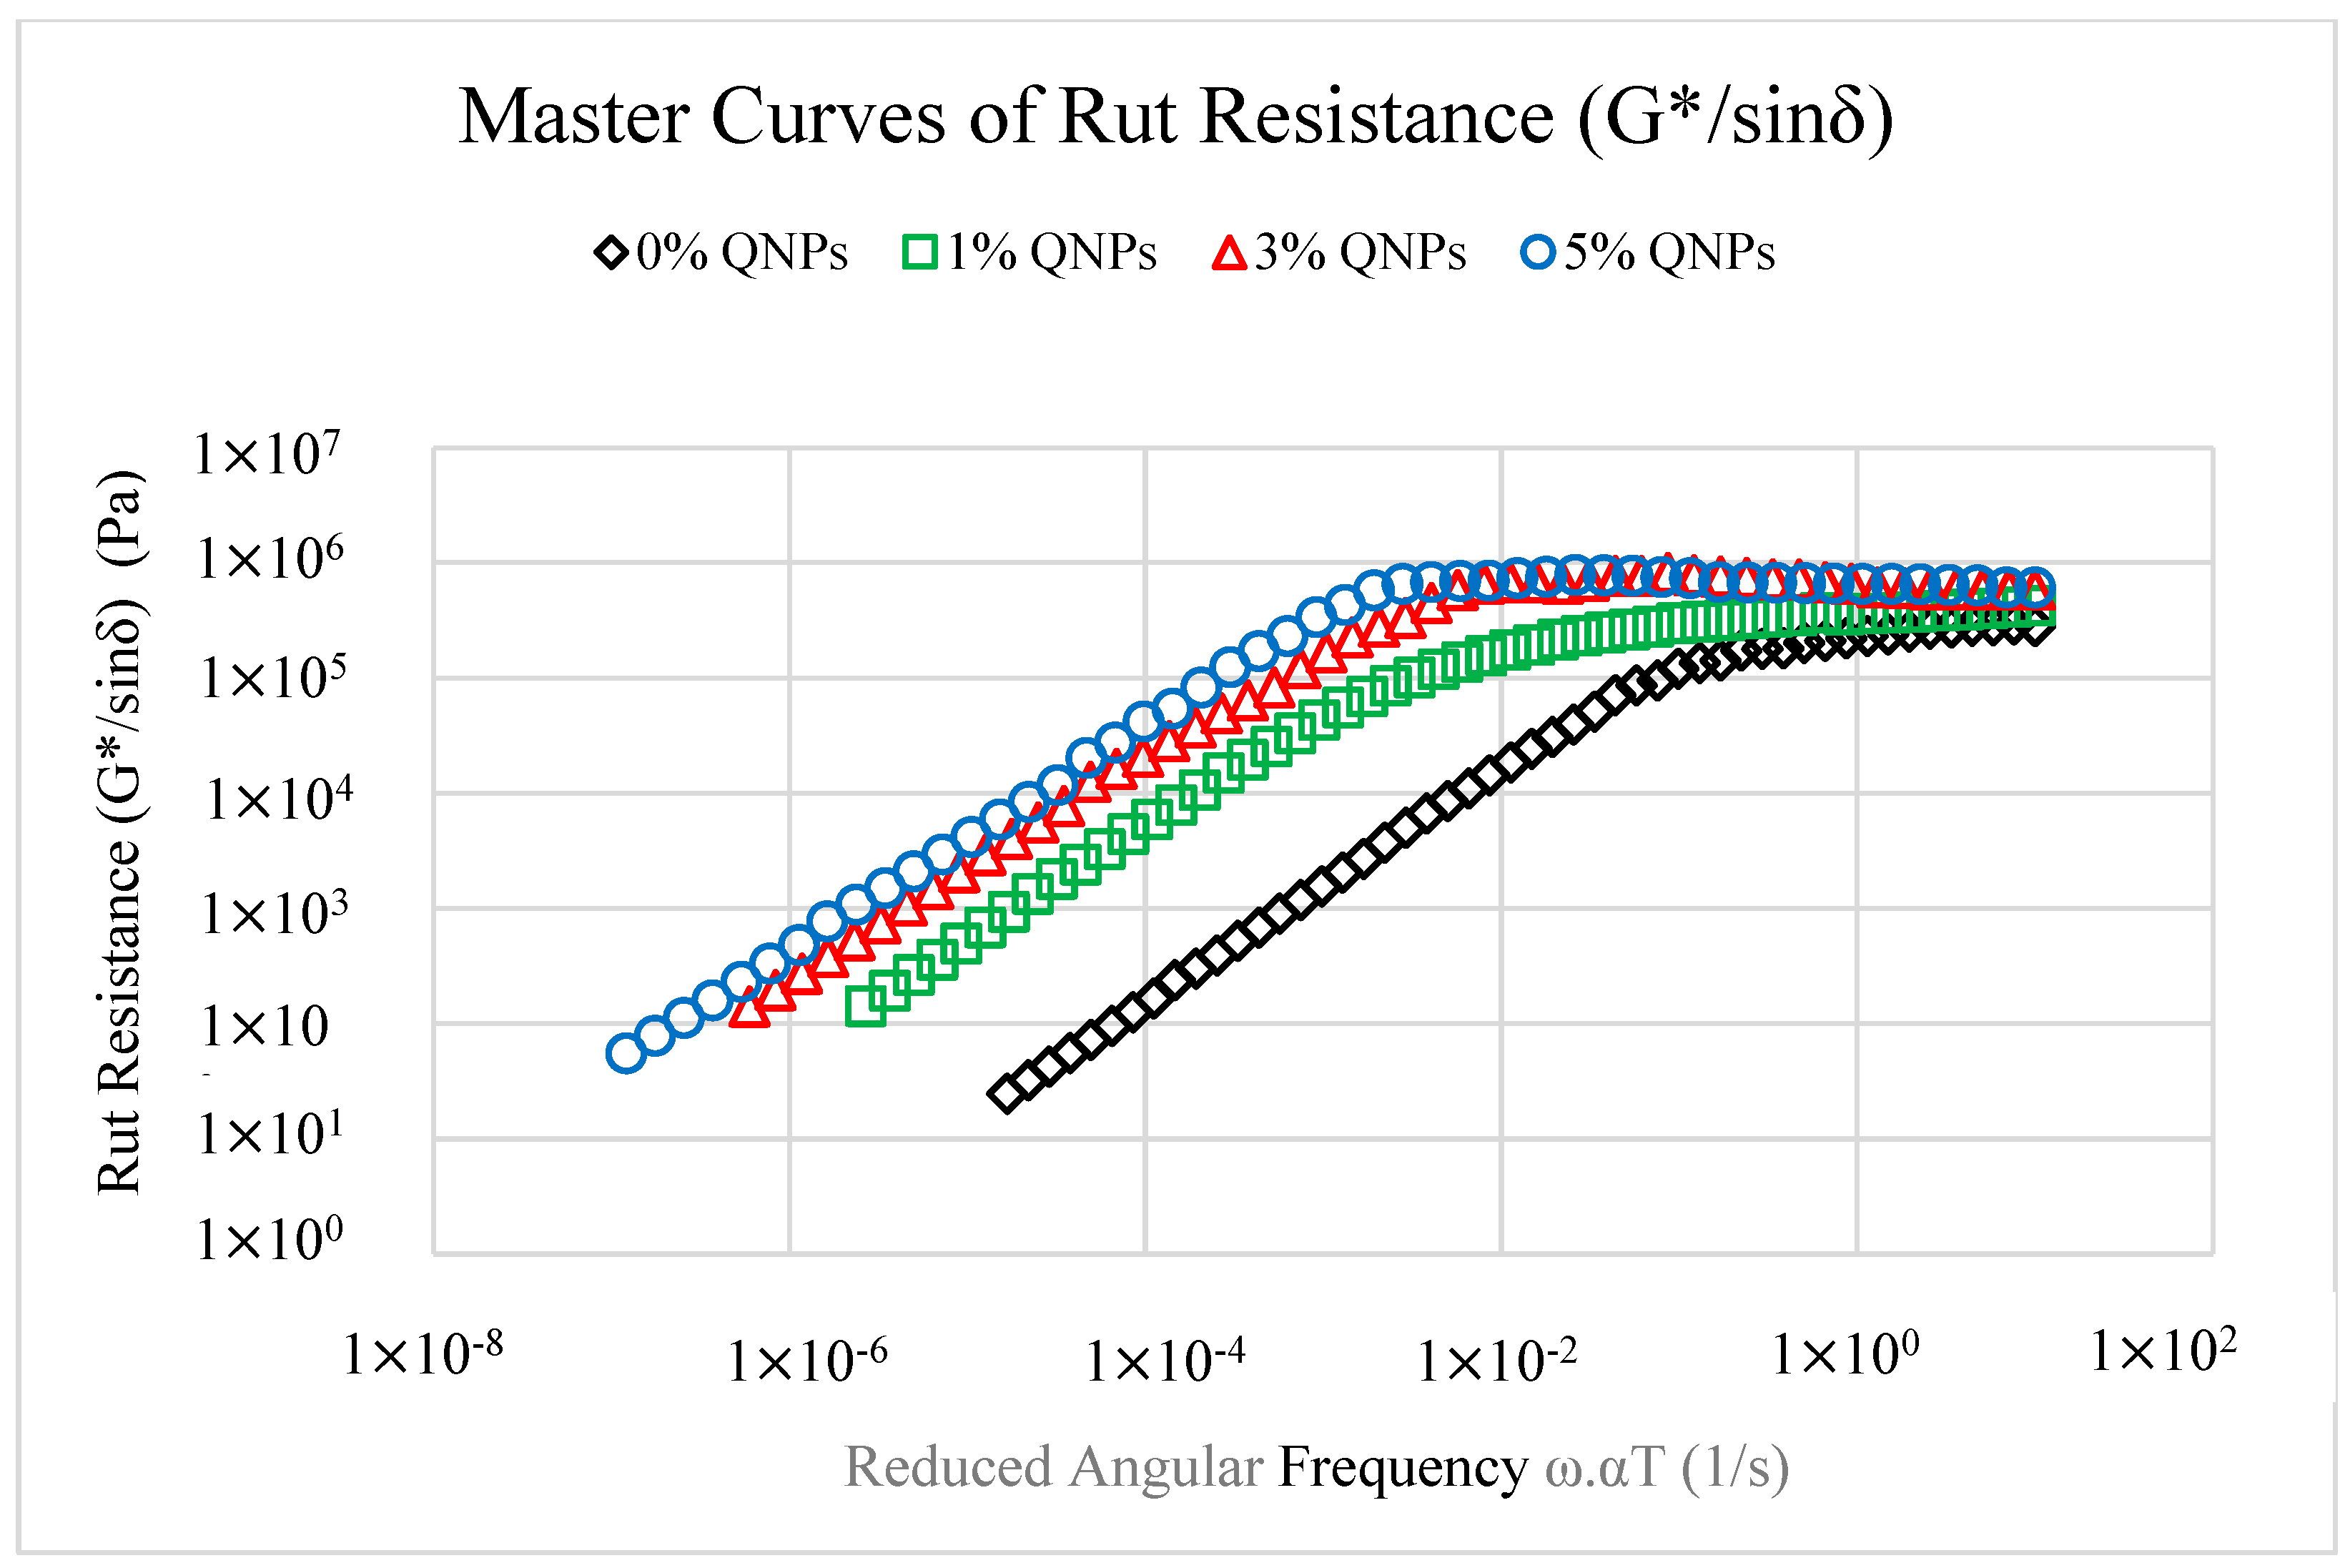
Figure 13.
Graphical representation of the influence of temperature on G*.
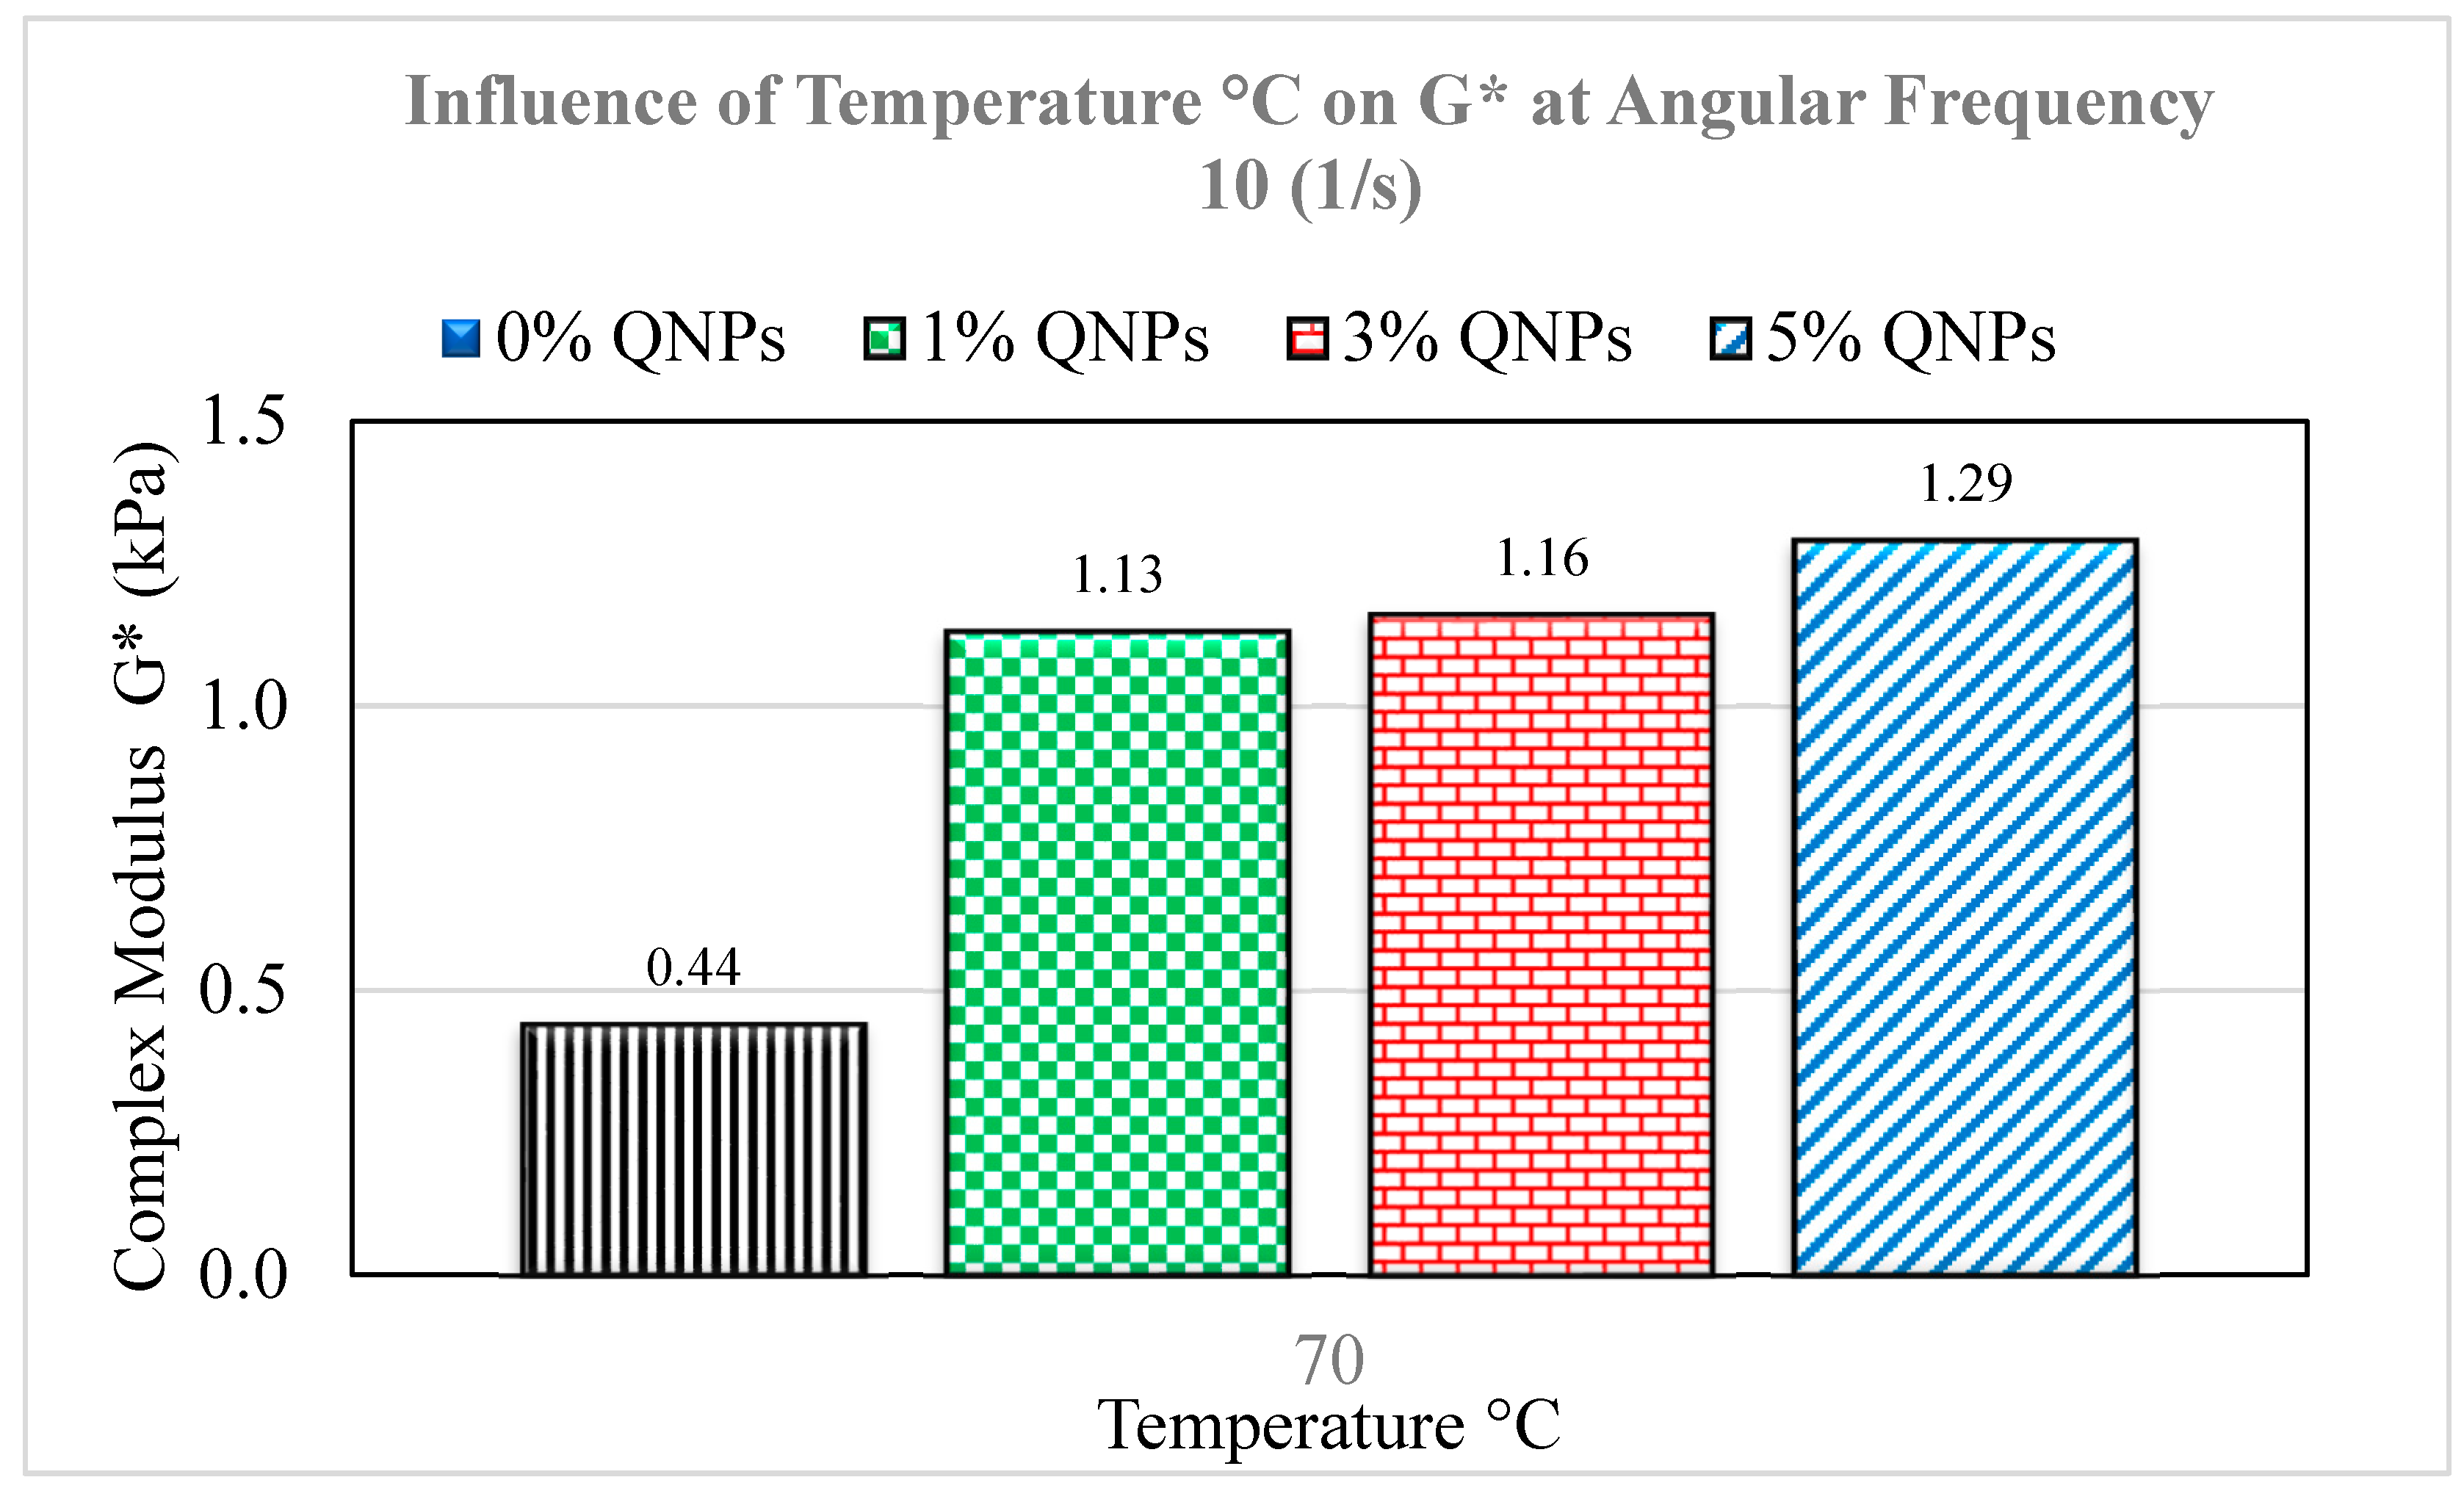
Figure 14.
Influence of temperature on G*/Sin (δ).
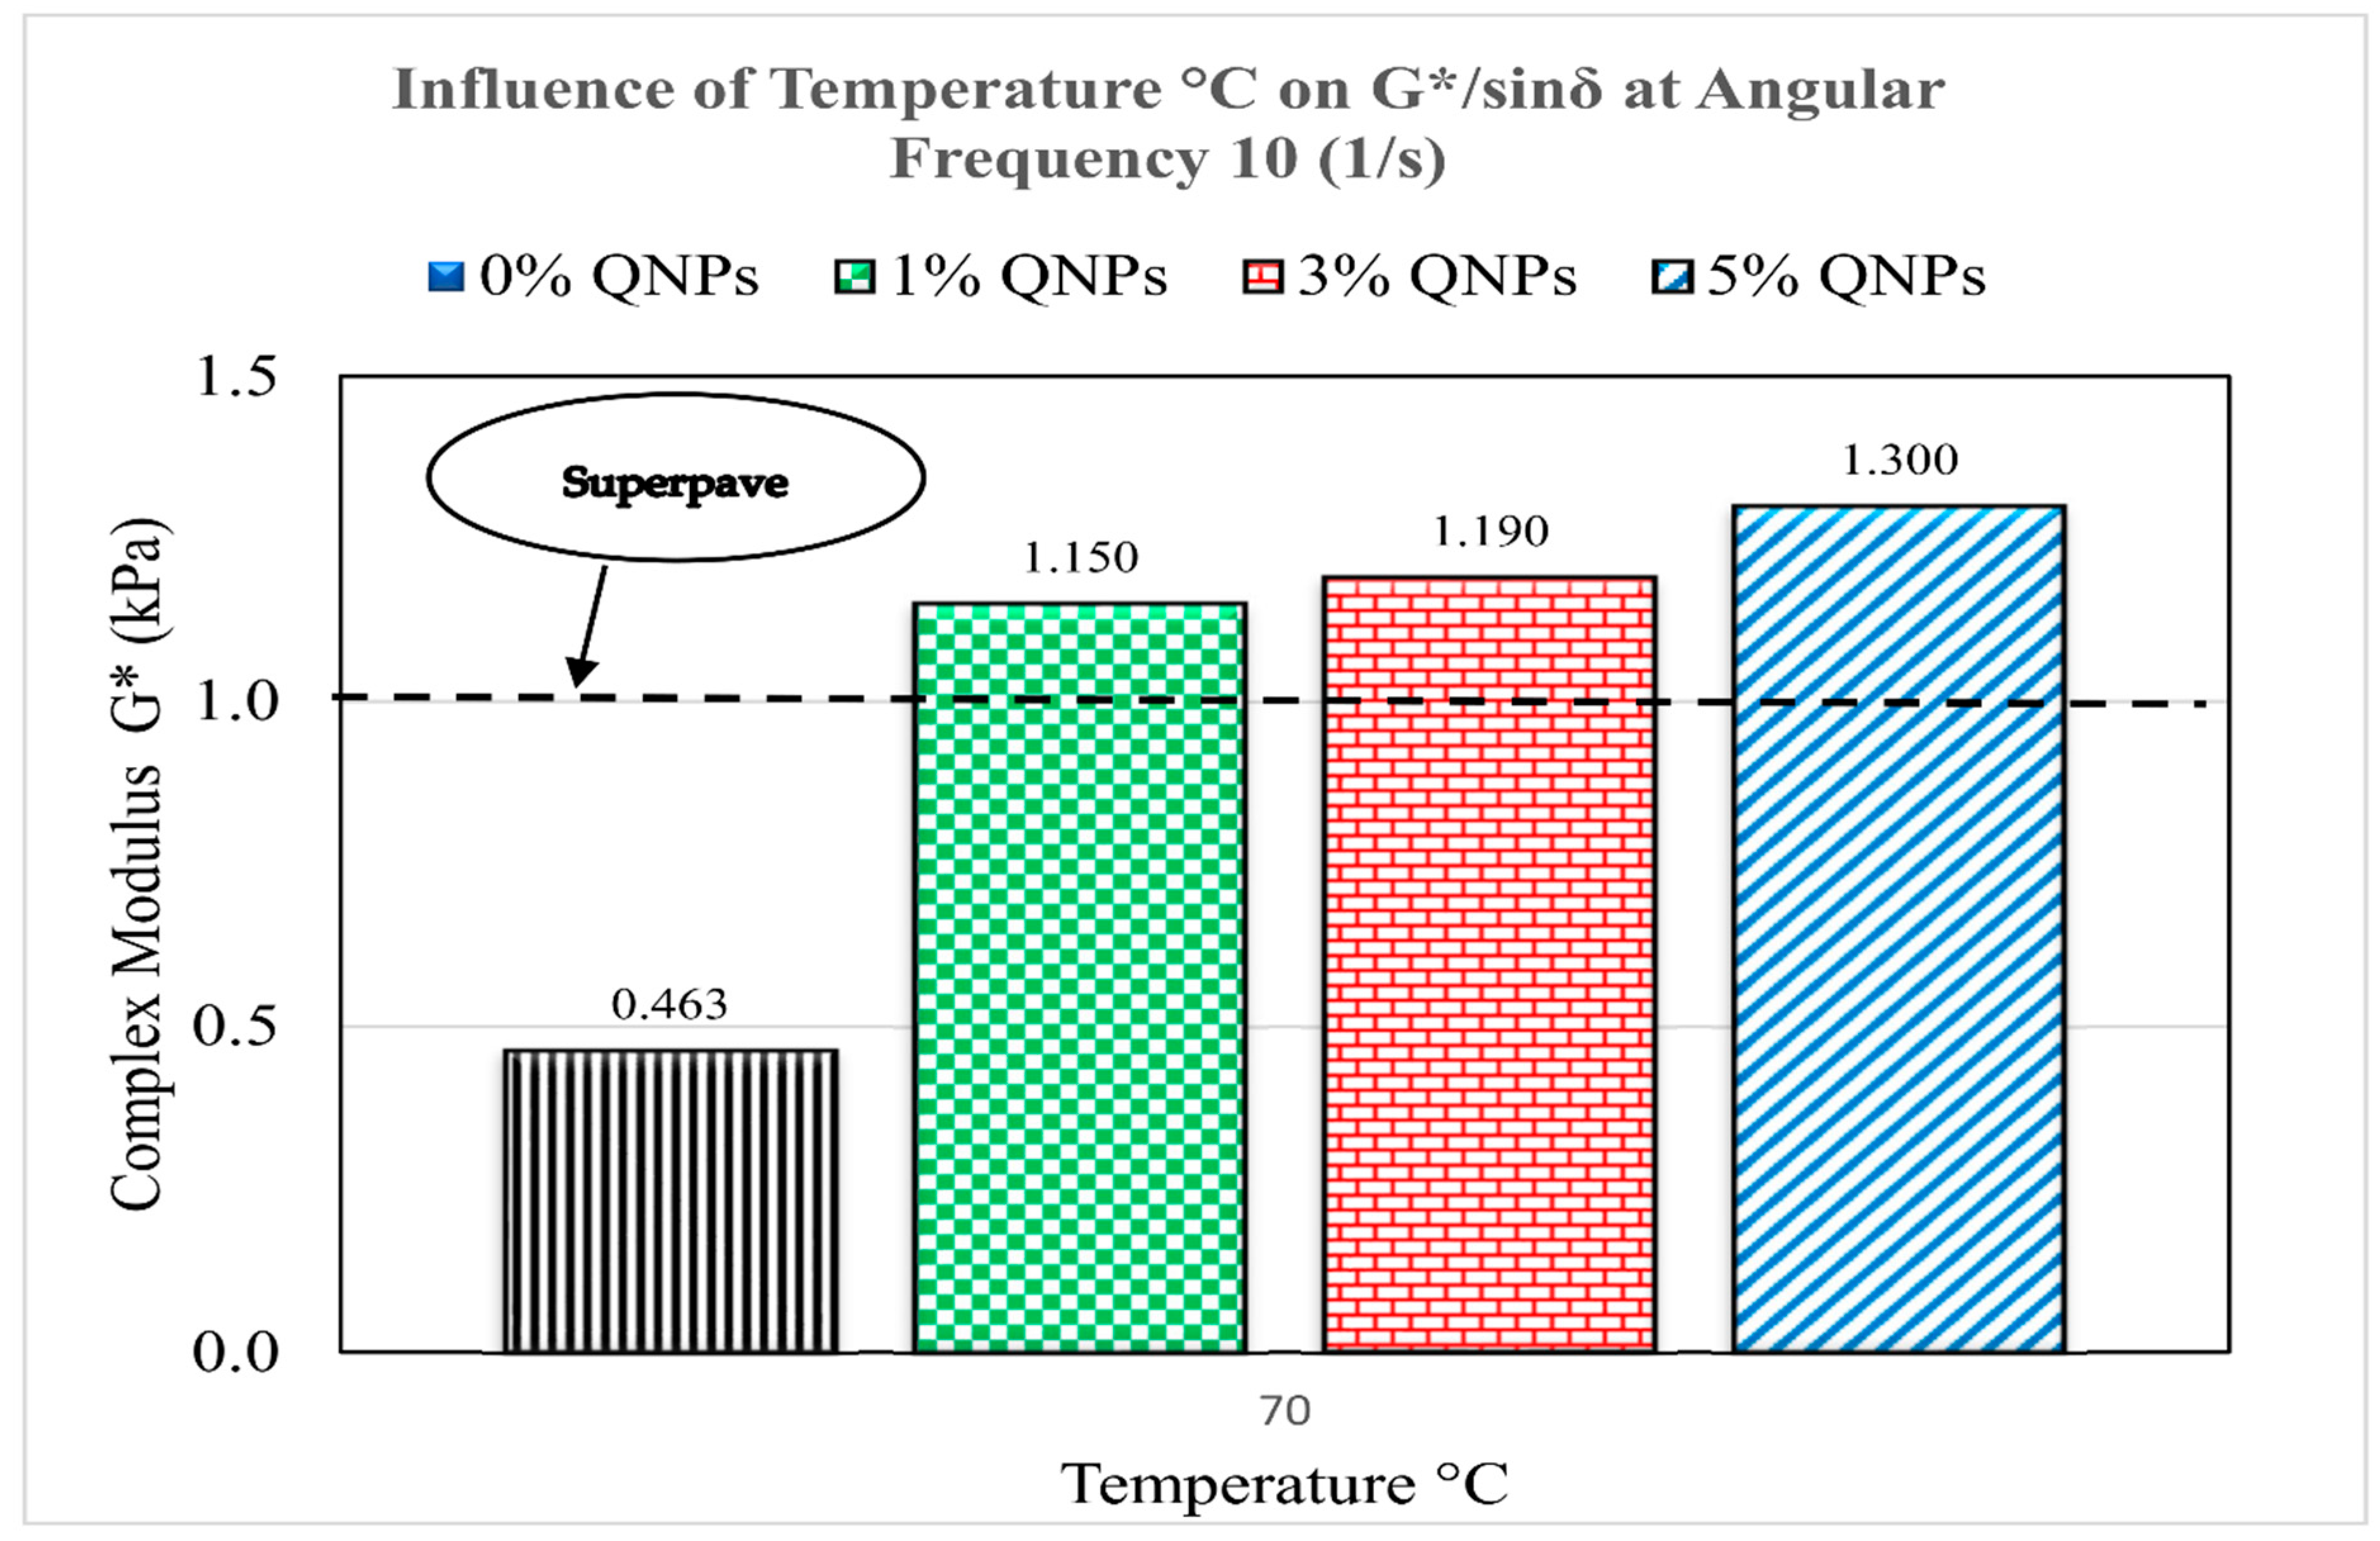
Figure 15.
Influence of QNP dosages on performance grade (PG).
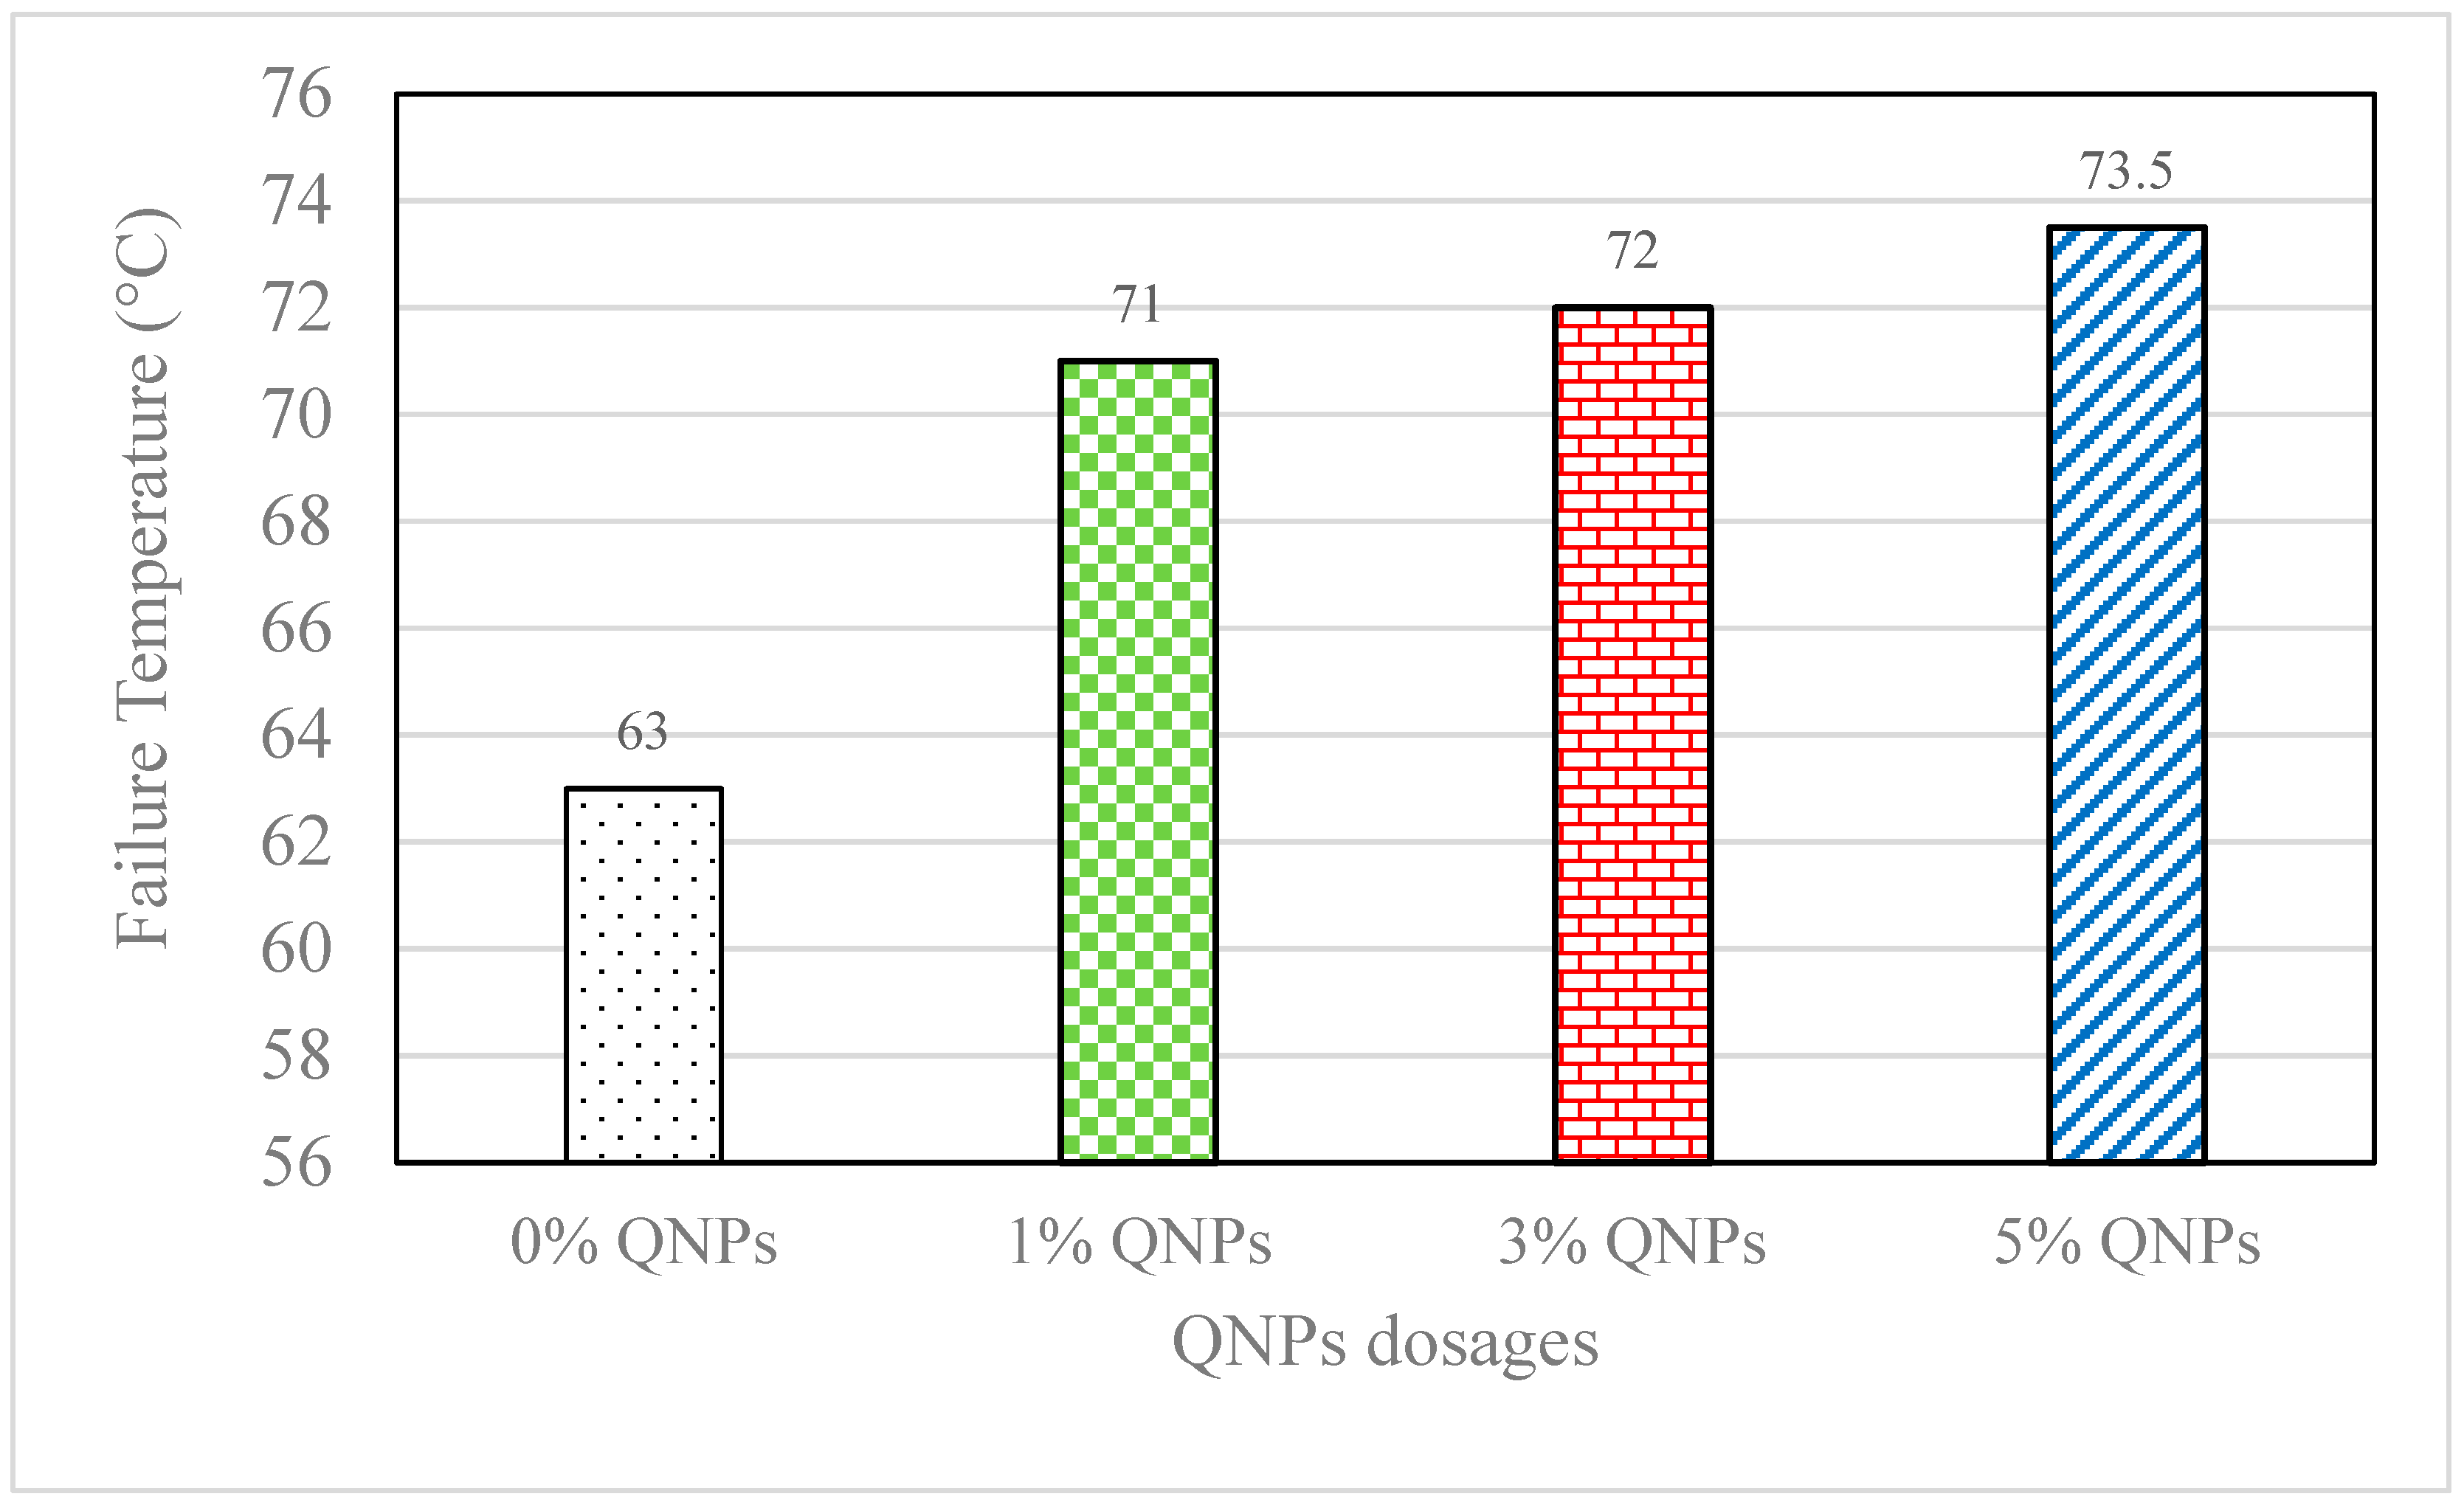
Figure 16.
(a,c,e,g) 0%, 1%, 3%, and 5% QNPs, respectively, before burst; (b,d,f,h) 0%, 1%, 3%, and 5% QNPs, respectively, after burst.
Figure 16.
(a,c,e,g) 0%, 1%, 3%, and 5% QNPs, respectively, before burst; (b,d,f,h) 0%, 1%, 3%, and 5% QNPs, respectively, after burst.
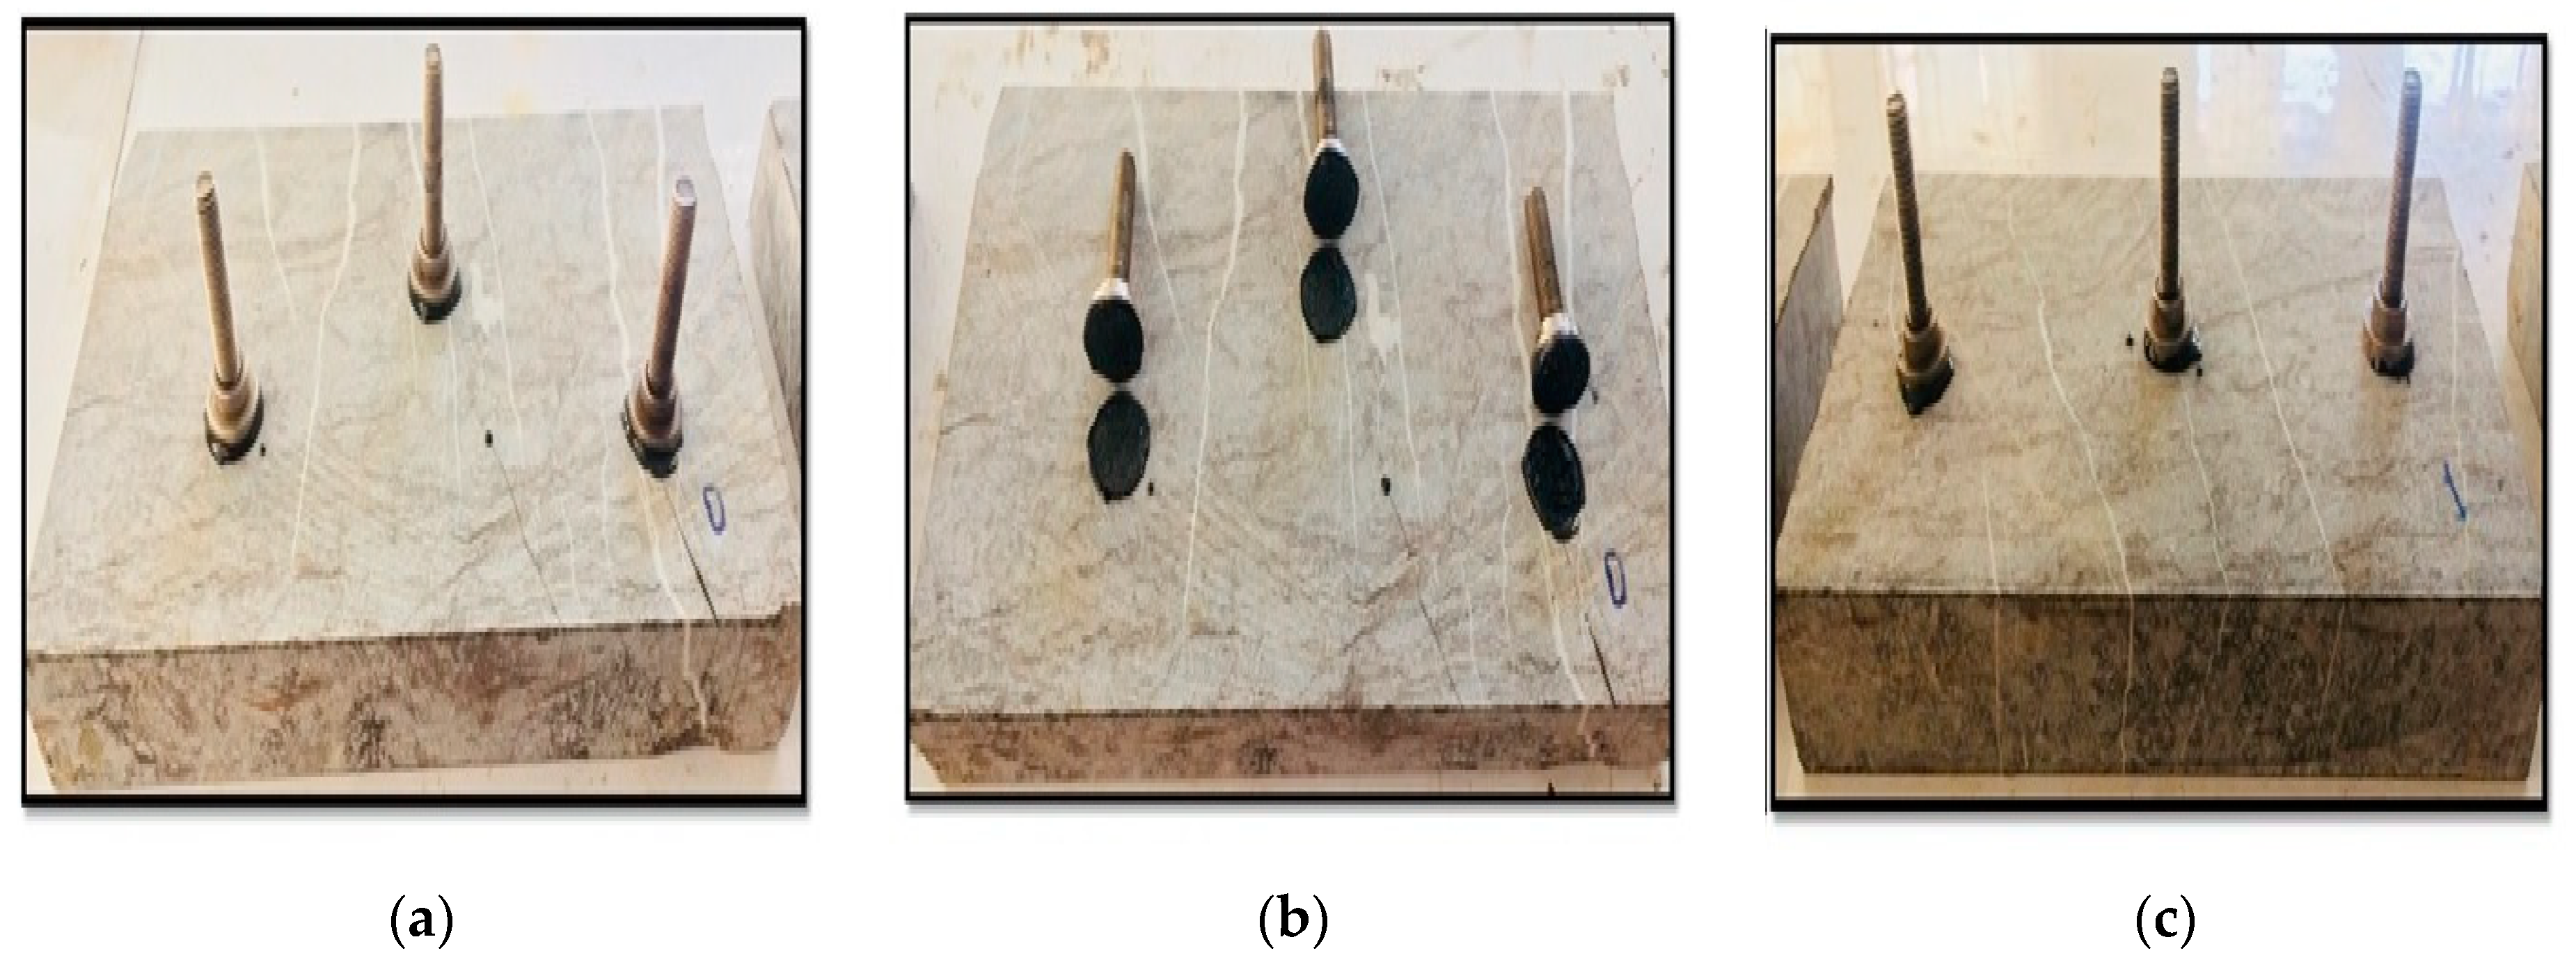
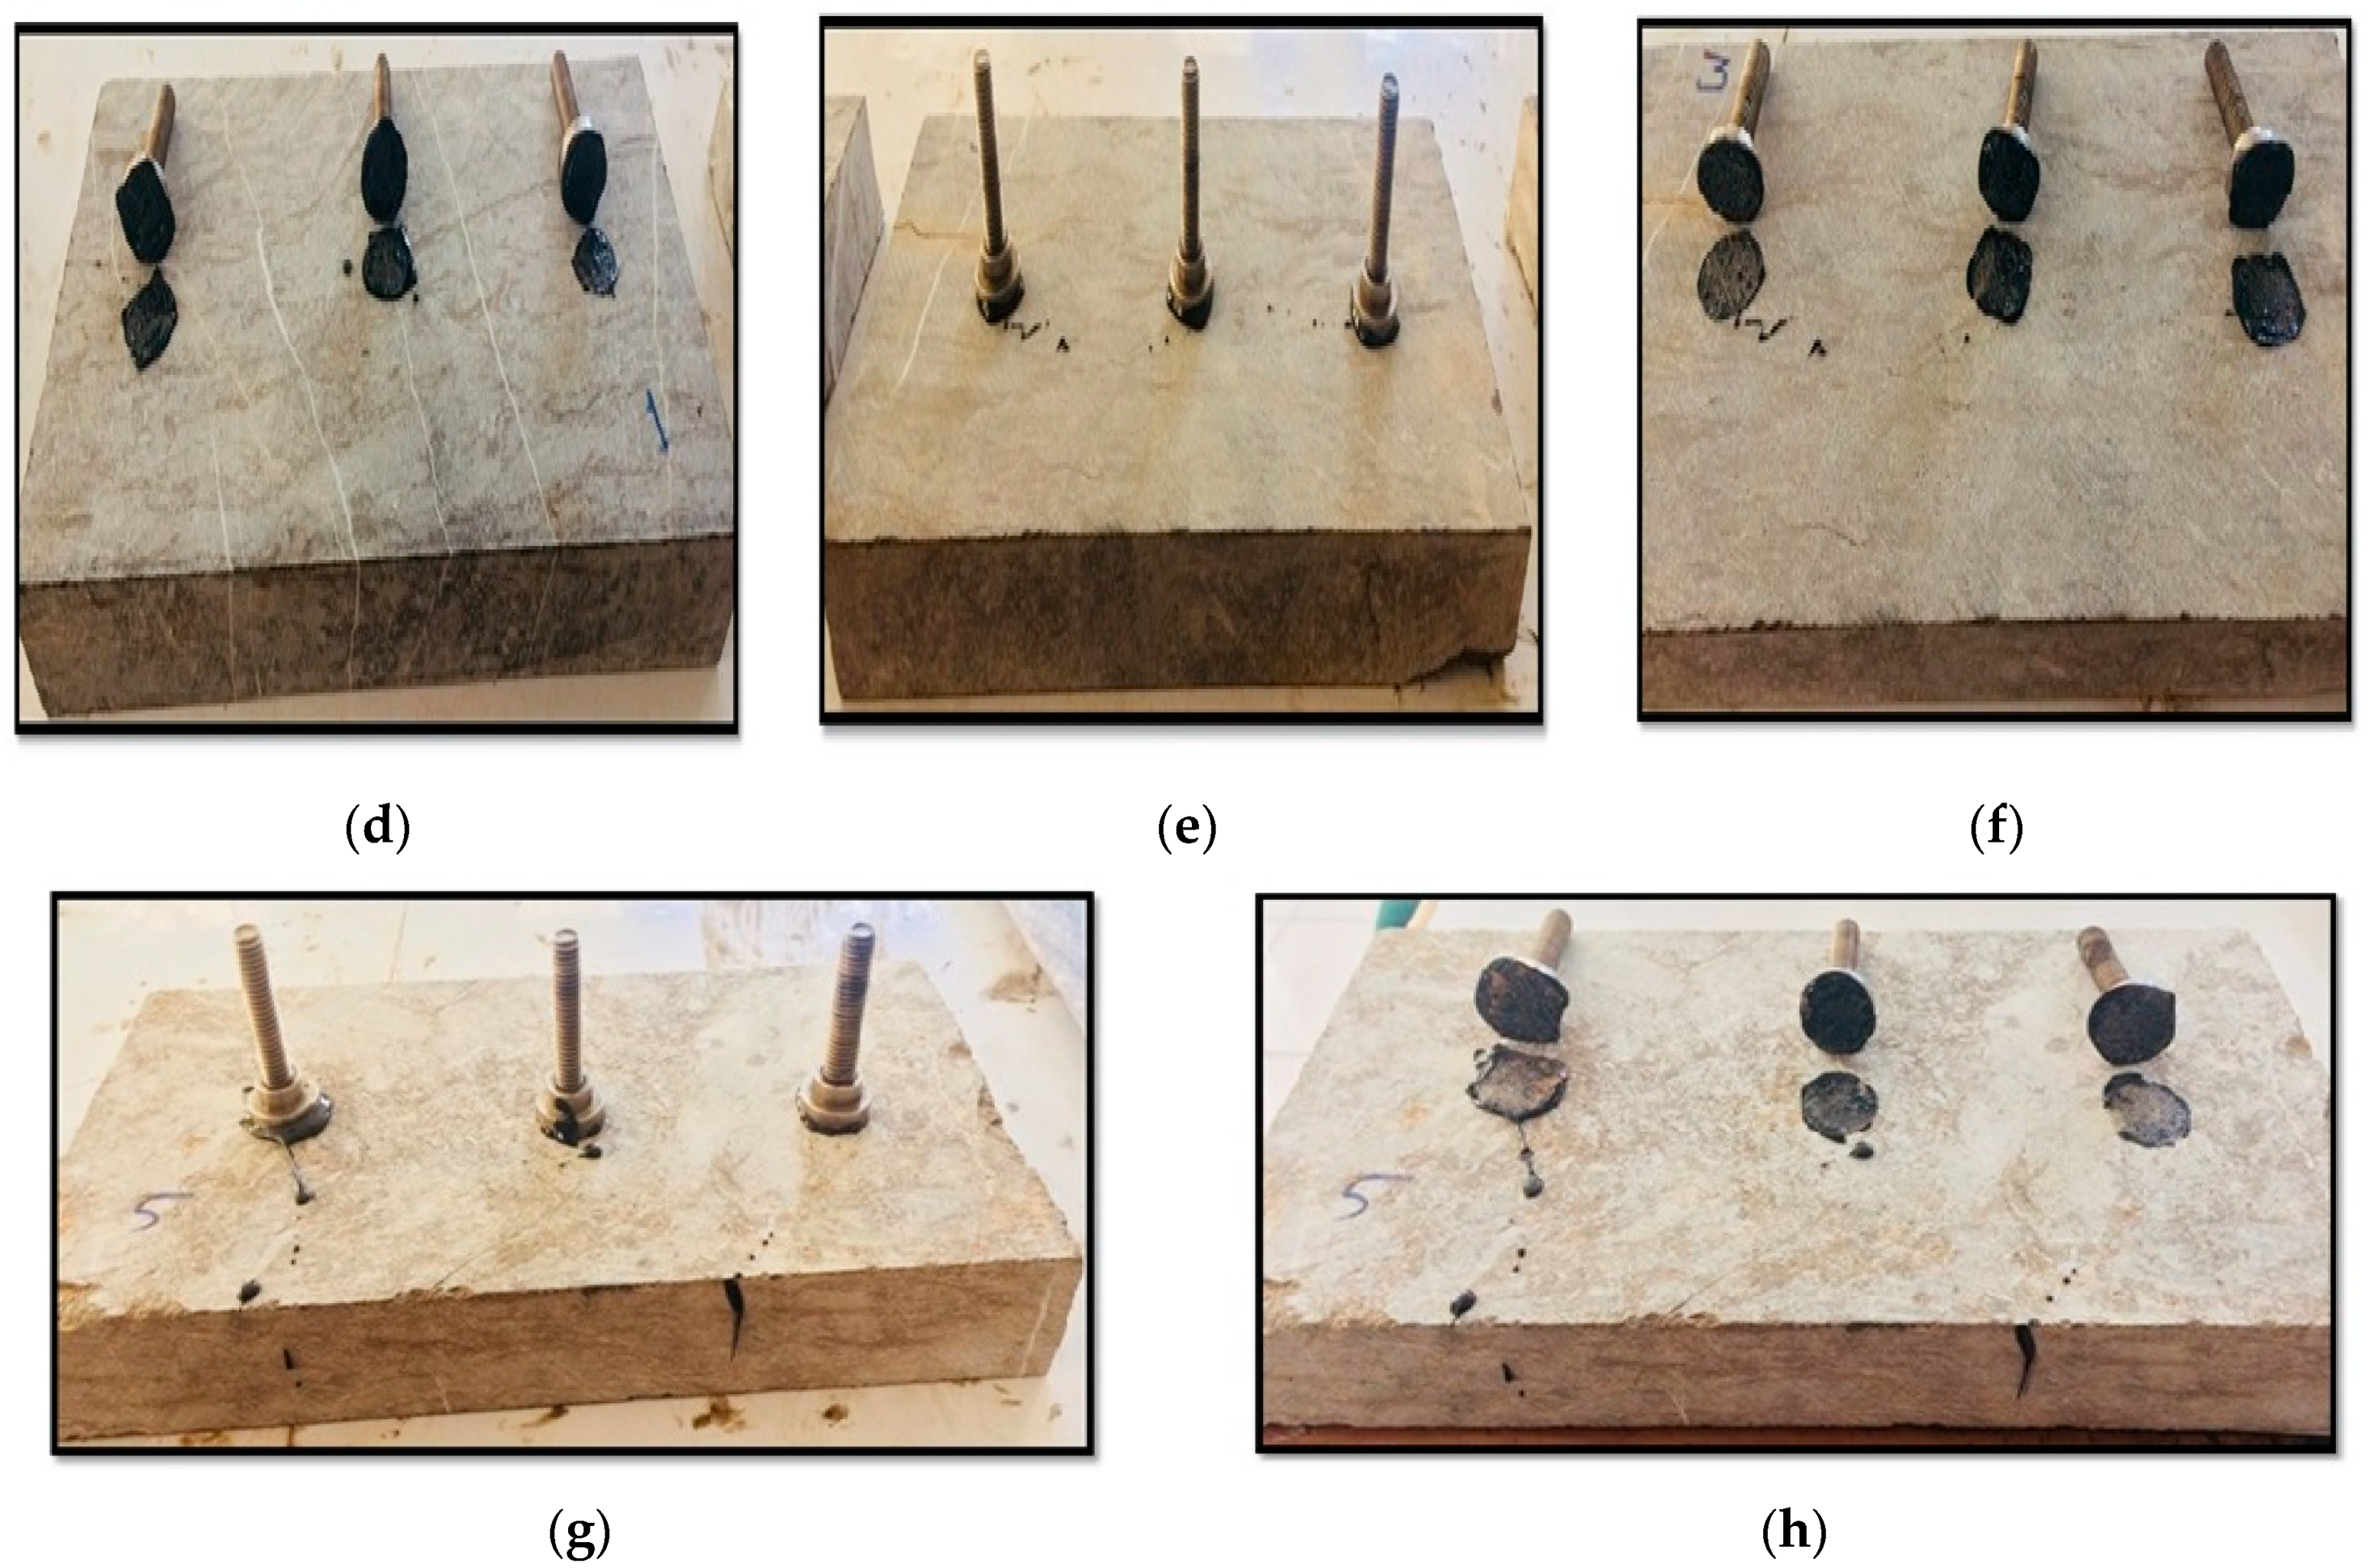
Figure 17.
Graphical representation of POTS (psi).

Figure 18.
Permanent deformation at 55 °C for base and QNP-modified (1%, 3% and 5%) bitumen.
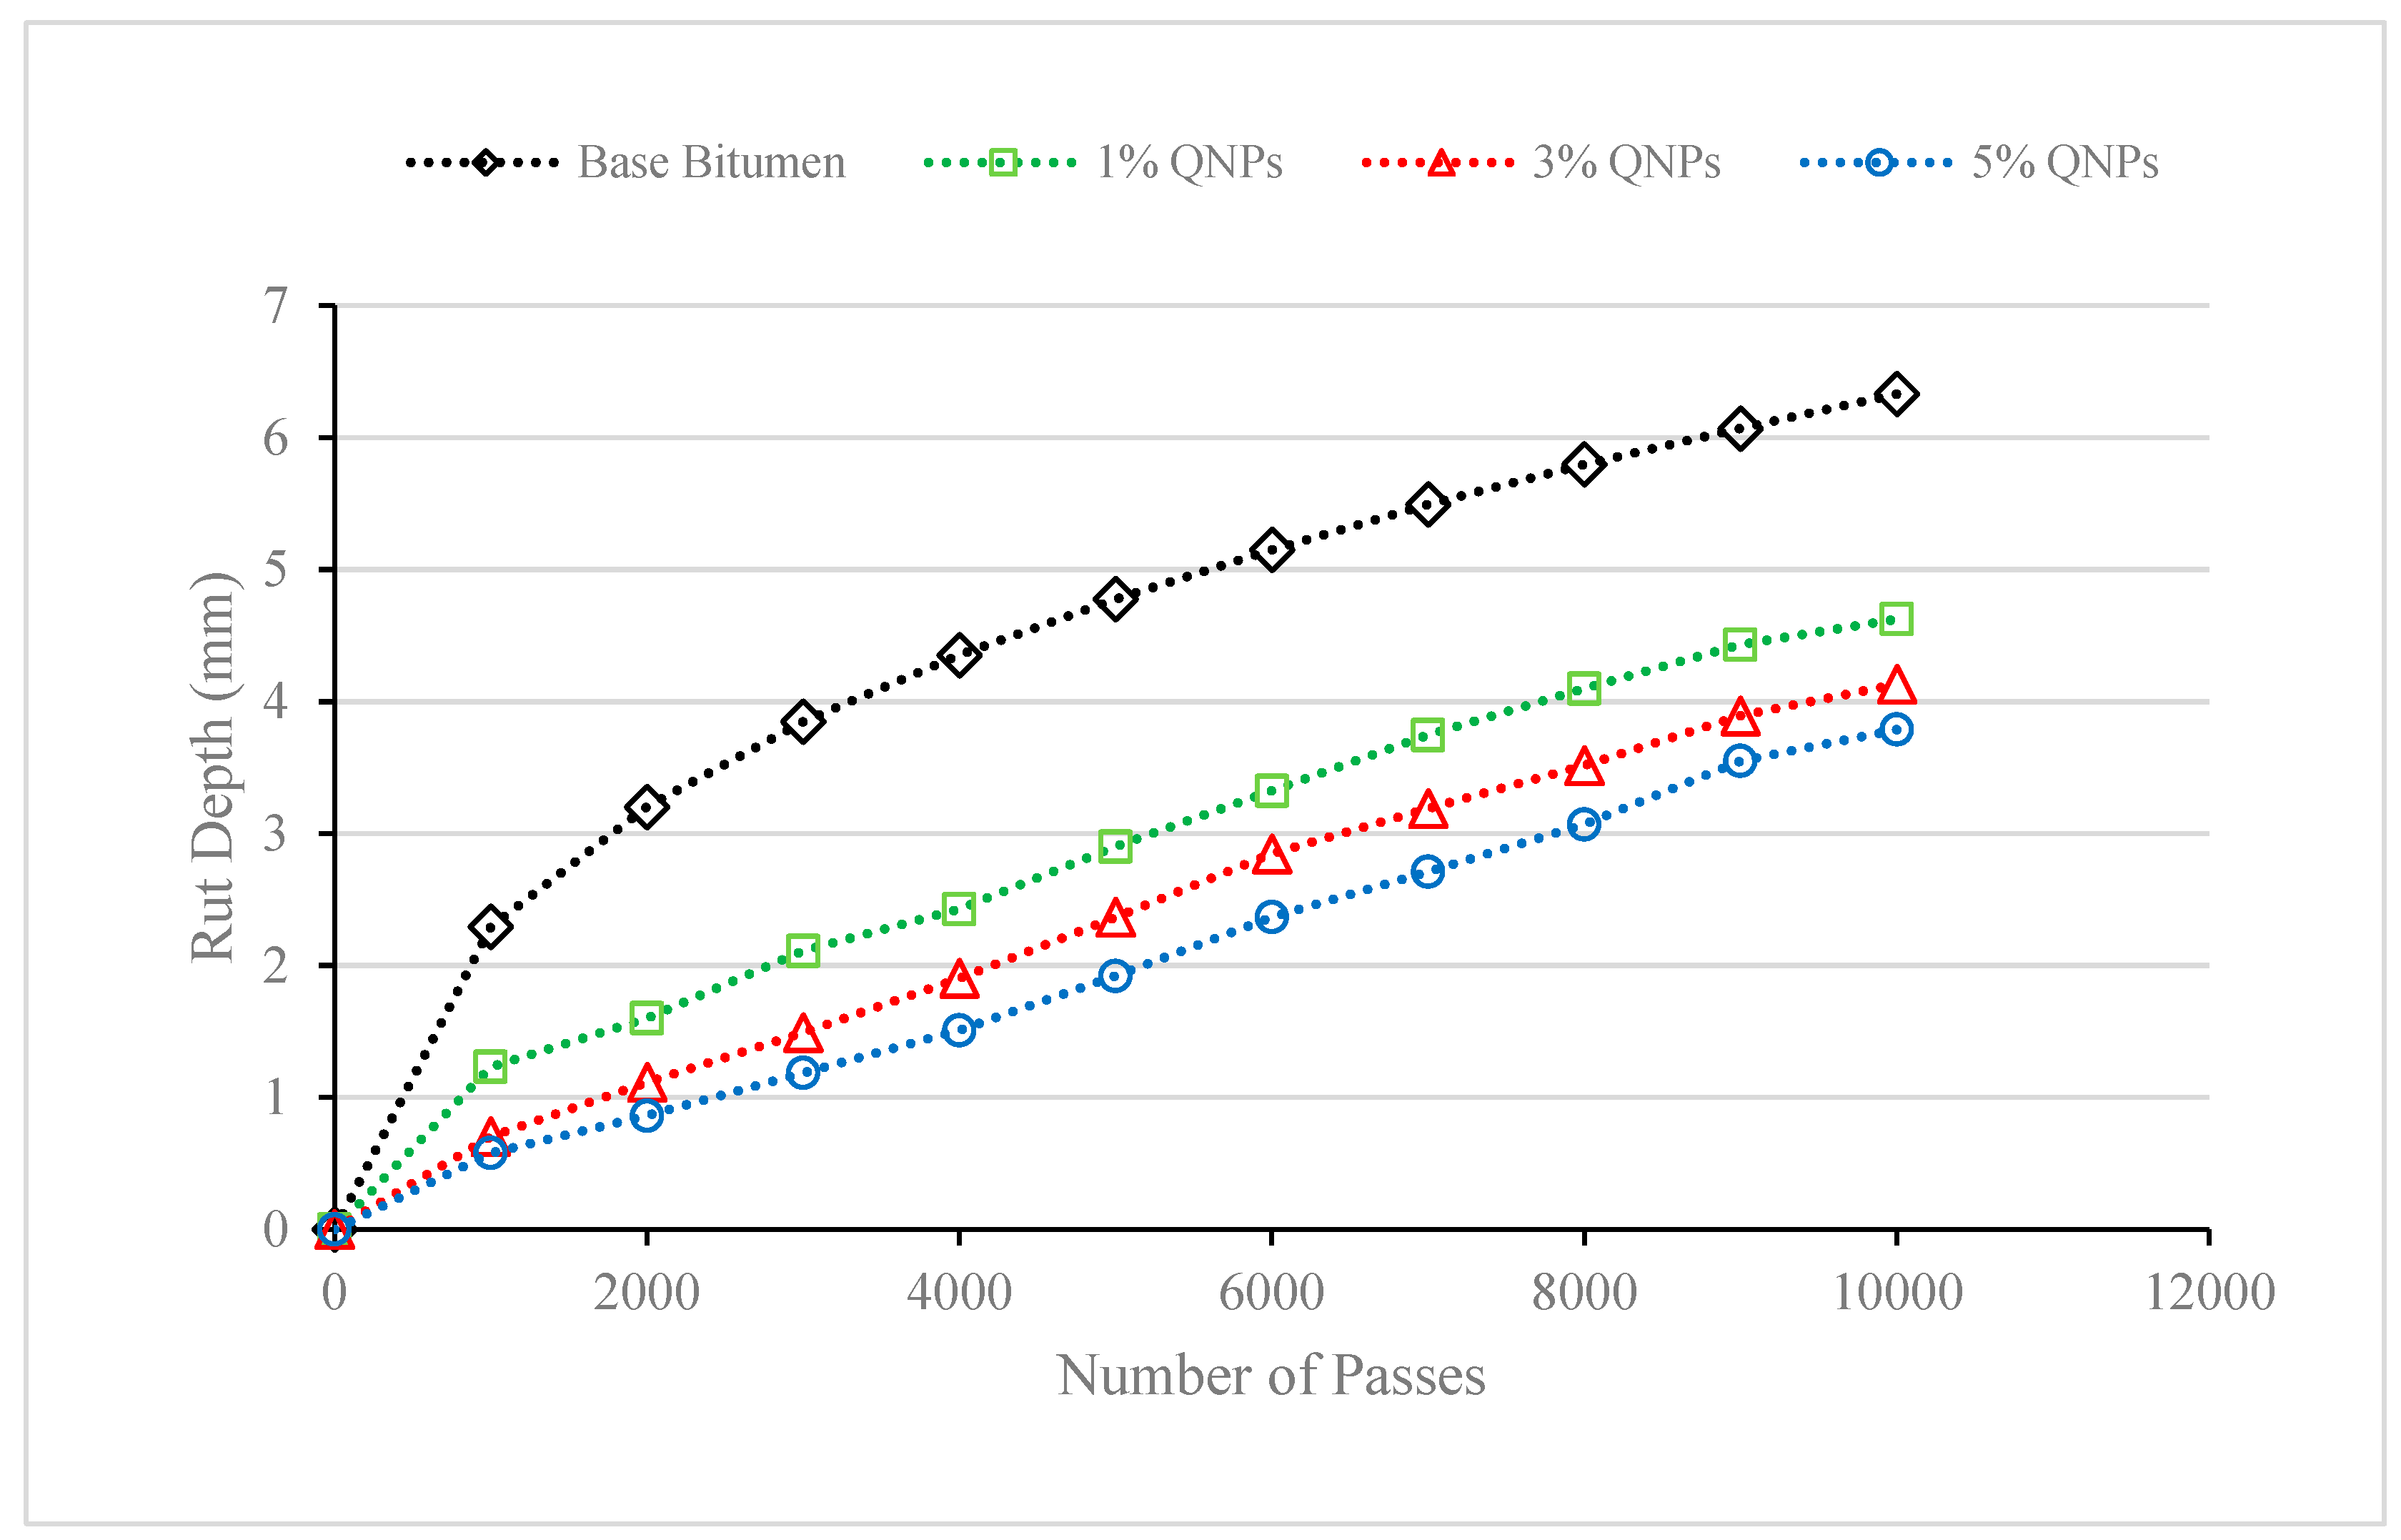
Table 1.
Physical properties of quartz nano-particles (QNPs).
| Physical Properties | |
|---|---|
| Chemical formula | SiO2 |
| Molar mass | 60.08 gmol−1 |
| Melting point | >1600 °C |
| Boiling point | 2230 °C |
| Form | Nano-powder (Amorphous) |
| Surface Area | Spec. surface area 175–225 m2/g |
| Diameter | 12 nm |
Table 3.
Optimum bitumen content (OBC).
| Bitumen | OBC % |
|---|---|
| PG 58-16 | 4.30 |
| 1% QNPs | 4.48 |
| 3% QNPs | 4.55 |
| 5% QNPs | 4.64 |
Table 4.
Storage stability test results.
| Softening Point (°C) | Base Bitumen | QNP Content (%) | ||
|---|---|---|---|---|
| 1% | 3% | 5% | ||
| Top portion | 49.6 | 52 | 54 | 58 |
| Bottom portion | 50.0 | 52.9 | 55.1 | 59.4 |
| Difference | 0.4 | 0.9 | 1.1 | 1.4 |
Table 5.
Conventional test results of base bitumen and QNP modification.
| Tests | Base Bitumen | QNPs Modification (%) | ||
|---|---|---|---|---|
| 1 | 3 | 5 | ||
| Penetration (1/10 of mm) | 62 | 46 | 38 | 32 |
| Softening Point (°C) | 49 | 52 | 54 | 58 |
| Ductility (cm) | 109 | 76 | 58 | 40 |
| Flash Point (°C) | 242 | 249 | 261 | 269 |
| Fire Point (°C) | 247 | 253 | 265 | 273 |
| Penetration Index (PI) | −0.9474 | −0.9006 | −0.8580 | −0.3787 |
| Thermal Susceptibility (A) | 0.0463 | 0.0459 | 0.0456 | 0.0424 |
Table 6.
Test matrix.
| Bitumen Grade | ARL Pen 60/70 |
|---|---|
| Bitumen Type | Base, 1% QNPS, 3% QNPS, and 5% QNPS |
| Test Temperature °C | 10 to 70 °C |
| Frequency Levels | 0.1 to 10 Hz |
| Strain Level | 12% (Base) |
| Output Parameters | G*, δ, G*/sin(δ) |
| No. of Samples | 4 (each 8 mm and 25 mm Diameter) |
Table 7.
Influence of temperature on G* and G*/sinδ at an angular frequency of 10 (1/s).
| Mean Pts | Angular Frequency | Temperature | Complex Modulus G* | |||
| [kPa] | ||||||
| [1/s] | [°C] | 0% QNPS | 1% QNPS | 3% QNPS | 5% QNPS | |
| 1 | 10 | 10 | 1.80 × 1002 | 2.17 × 1002 | 3.51 × 1002 | 1.87 × 1002 |
| 2 | 10 | 20 | 1.94 × 1002 | 2.08 × 1002 | 1.54 × 1002 | 8.07 × 1002 |
| 3 | 10 | 30 | 1.45 × 1002 | 1.66 × 1002 | 5.10 × 1002 | 1.86 × 1002 |
| 4 | 10 | 40 | 4.14 × 1001 | 9.63 × 1001 | 1.01 × 1002 | 1.62 × 1002 |
| 5 | 10 | 50 | 3.51 × 1001 | 1.90 × 1001 | 2.32 × 1001 | 2.52 × 1001 |
| 6 | 10 | 60 | 2.07 × 1000 | 1.43 × 1000 | 4.88 × 1000 | 5.43 × 1000 |
| 7 | 10 | 70 | 4.36 × 10−01 | 1.13 × 1000 | 1.16 × 1000 | 1.29 × 1000 |
| Mean Pts | Angular Frequency | Temperature | G*/sin(delta) | |||
| [kPa] | ||||||
| [1/s] | [°C] | 0% QNPS | 1% QNPS | 3% QNPS | 5% QNPS | |
| 1 | 10 | 10 | 2.32 × 1002 | 3.31 × 1002 | 4.68 × 1002 | 2.07 × 1003 |
| 2 | 10 | 20 | 2.55 × 1002 | 3.20 × 1002 | 1.55 × 1002 | 9.07 × 1002 |
| 3 | 10 | 30 | 1.77 × 1002 | 2.34 × 1002 | 5.43 × 1002 | 2.03 × 1002 |
| 4 | 10 | 40 | 4.23 × 1001 | 1.05 × 1002 | 1.12 × 1002 | 1.70 × 1002 |
| 5 | 10 | 50 | 3.56 × 1001 | 1.95 × 1001 | 2.36 × 1001 | 2.58 × 1001 |
| 6 | 10 | 60 | 2.08 × 1000 | 1.46 × 1001 | 4.91 × 1000 | 5.47 × 1000 |
| 7 | 10 | 70 | 4.63 × 10-01 | 1.15 × 1000 | 1.19 × 1000 | 1.30 × 1000 |
Table 8.
Average POTS (psi) values of base and QNP-modified bitumen and failure patterns.
| S. No | 24 h Dry Conditions (psi) | 24 h Wet Conditions (psi) | ||||||
|---|---|---|---|---|---|---|---|---|
| 0% | 1.0% | 3.0% | 5.0% | 0% | 1.0% | 3.0% | 5.0% | |
| 1 | 1279.1 | 1618.7 | 1924.3 | 2074.3 | 1130.8 | 1388.8 | 1560.1 | 1618.2 |
| (C) | (C) | (C/A) | (C/A) | (A) | (A) | (A) | (A) | |
| 2 | 1218.5 | 1601.9 | 1873.2 | 1983.9 | 1070.2 | 1469.0 | 1540.9 | 1611.8 |
| (C) | (C) | (C) | (C) | (A) | (A) | (C/A) | (C/A) | |
| 3 | 1283.2 | 1591.3 | 1773.1 | 1869.9 | 1086.9 | 1355.0 | 1662.3 | 1495.6 |
| (C) | (C) | (C) | (C) | (A) | (A) | (C/A) | (C/A) | |
| 4 | 1318.8 | 1612.4 | 1692.1 | 2001.1 | 1091.1 | 1557.6 | 1451.4 | 1695.7 |
| (C) | (C) | (C/A) | (C/A) | (A) | (A) | (A) | (C/A) | |
| 5 | 1270.7 | 1639.8 | 2052.2 | 2039.8 | 1078.5 | 1412.0 | 1564.3 | 1745.1 |
| (C) | (C) | (C) | (C) | (A) | (A) | (A) | (A) | |
| Average | 1274.1 | 1612.8 | 1863.0 | 1993.8 | 1091.5 | 1436.5 | 1555.8 | 1633.3 |
C, cohesive failure; A, adhesive failure; C/A, 50% cohesive failure, 50% adhesive failure.
Publisher’s Note: MDPI stays neutral with regard to jurisdictional claims in published maps and institutional affiliations. |
© 2022 by the authors. Licensee MDPI, Basel, Switzerland. This article is an open access article distributed under the terms and conditions of the Creative Commons Attribution (CC BY) license (https://creativecommons.org/licenses/by/4.0/).
Share and Cite
MDPI and ACS Style
Haroon, W.; Ahmad, N.; Mashaan, N. Effect of Quartz Nano-Particles on the Performance Characteristics of Asphalt Mixture. Infrastructures 2022, 7, 60. https://doi.org/10.3390/infrastructures7050060
AMA Style
Haroon W, Ahmad N, Mashaan N. Effect of Quartz Nano-Particles on the Performance Characteristics of Asphalt Mixture. Infrastructures. 2022; 7(5):60. https://doi.org/10.3390/infrastructures7050060
Chicago/Turabian StyleHaroon, Waqas, Naveed Ahmad, and Nuha Mashaan. 2022. "Effect of Quartz Nano-Particles on the Performance Characteristics of Asphalt Mixture" Infrastructures 7, no. 5: 60. https://doi.org/10.3390/infrastructures7050060