
Mechanistic Analysis of Asphalt Pavements in Support of Pavement Preservation Decision-Making


Laboratory of Pavement Engineering, School of Civil Engineering, National Technical University of Athens (NTUA), GR-15773 Athens, Greece
*
Author to whom correspondence should be addressed.
Infrastructures 2022, 7(5), 61; https://doi.org/10.3390/infrastructures7050061
Submission received: 30 March 2022
/
Revised: 18 April 2022
/
Accepted: 19 April 2022
/
Published: 20 April 2022
(This article belongs to the Special Issue Pavement Preservation Strategies)
Abstract
:Modern roadways provide road users with a comfortable and safe ride to their destinations. Due to increasing traffic demands and maximum allowable loads, road authorities should also pay attention to the structural soundness of road pavements while seeking cost-effective and timely maintenance or minor rehabilitation activities. This means that a sustainable pavement preservation strategy is needed that includes an optimal pavement condition assessment to support the appropriate decision-making processes. To address this need, this research study proposes an approach to integrate Non-Destructive Testing (NDT) data and ground truth data to predict the long-term performance of flexible pavements. Appropriate mechanistic models that take into account the nature of Asphalt Concrete (AC) materials are used for the analysis to increase the accuracy of the results when it comes to protecting and extending pavement life. The results indicated that examining viscoelastic behavior for AC appears to be a more conservative approach for the response analysis, as well as the fatigue performance analysis, compared to the most conventional assumptions for linear elastic materials. In accordance with common sense, AC temperature was considered as a critical factor for the related investigation. Overall, it may not be a good and reliable practice to continue the process of pavement management and maintenance decisions based on the approach of only one analysis type.
1. Introduction
In recent decades, the focus of road engineers has gradually shifted to the preservation of existing road structures rather than the construction of new ones [1]. The latter is related to the completeness of the main road network worldwide, while the former occurs due to limited financial resources at both national and international levels. In this context, effective pavement maintenance policies can be considered to be equally important as good construction practices [2,3]. Therefore, Pavement Condition Assessment (PCA) has become an essential requirement for any pavement monitoring and management system. Pavement monitoring usually focuses on surface performance assessment because the main cause of maintenance is deteriorated pavement serviceability [4]. However, neglecting the structural performance of a pavement could be considered as a maintenance failure that could negatively affect the long-term sustainability of roads due to the inevitable and additional deterioration of the pavement. For example, the resurfacing of Asphalt Concrete (AC) pavements immediately restores the ride quality without significantly improving the structural capacity of the pavement [5], leading to further deterioration in due course.
Nevertheless, due to increasing traffic demands and maximum allowable loads, road authorities should pay attention to the structural soundness of road pavements while looking for cost-effective and timely maintenance or minor rehabilitation activities. This implies the need for a sustainable pavement preservation strategy that includes a holistic PCA to support the appropriate decision-making processes [6,7]. Therefore, in addition to the traditional assessment of pavement surface condition, the concept of PCA has been extended to the pavement structural integrity assessment. The latter refers to the mechanical characterization of each material and the estimation of the bearing capacity of a pavement. These factors determine the pavement performance and the damage development, which in the case of typical flexible pavements occurs mainly because of AC fatigue cracking and subgrade permanent deformations [8]. In addition, structural performance issues must always be at the forefront, since the actual service life of a pavement extends beyond its design life, remaining as an important component of a road network.
In terms of the evaluation process, the use of advanced systems for Non-Destructive Testing (NDT) that allow non-invasive pavement evaluation has become widespread in recent decades [1,3,4,9]. In particular, pavement response data collected with the Falling Weight Deflectometer (FWD) system and pavement stratigraphy data estimated through geophysical inspection surveys with the Ground Penetrating Radar (GPR) are the two main data pillars required for pavement analysis [3,10,11,12]. The process of analyzing FWD and GPR data is equivalent to a project-level analysis, which is mainly required in the context of assessing pavement redesign potential and rehabilitation needs. In the meantime, road authorities are working to drastically limit potential large-scale interventions. So, if they are aware of pavement conditions, they can plan more rationally for pavement preservation and act in a timely manner for routine maintenance or even minor rehabilitation.
To address this issue, pavement engineers face the challenge of accurately assessing pavement performance in the field, a process that is highly dependent on the assumptions made about the mechanical characterization of pavements. Typically, the Multi-Layered Elastic Theory (MLET) is used for pavement analysis, where all pavement materials are considered to be linearly elastic [3,12]. However, the viscous nature of asphalt binders implies that AC behaves in a temperature- and loading rate-dependent mode [13,14], which means that the dynamic modulus (E*) is a better key-parameter for pavement structural analysis. AC viscoelasticity becomes more pronounced for higher temperatures and lower loading frequencies [15,16]. This poses a major problem for evaluating pavement performance in practice, because if one approach is more conservative than another, pavement redesign needs may become critical sooner than expected.
A review of the relevant literature led to the conclusion that advances in laboratory-scale research addressing the viscoelastic behavior of AC (advanced testing and rheological modeling) are not compatible with the prospect of using such mechanistic principles for analysis in practice [17,18]. In particular, most analyses of previous research focusing on the viscoelastic behavior of AC were related to specific aspects of material behavior (e.g., aging of the binder) or to modeling theoretical cross sections to optimize pavement design processes (e.g., establishing suitable values for material stiffness) [13,16,19,20]. Therefore, research focusing on in-situ performance assessment of existing pavements based on purely mechanistic perspectives appears to be limited. The general trend is that a progressive increase in AC temperature leads to deviations between elastic and viscoelastic calculations, with the latter appearing to be more conservative at percentages greater than 20% [16,21]. In addition, viscoelastic calculations have been reported to agree with strain records from instrumented pavements [22,23].
However, as soon as the analysis of pavement response (i.e., calculations of strains) is influenced by the assumptions made for AC materials, the same is true for the prediction of pavement performance (i.e., development of pavement damage) [24]. Fatigue is known to be the main mode of failure in pavement engineering [25]. Alligator cracking and longitudinal cracking are two common phenomena for in-service pavements and often trigger reactive and, thus, costly maintenance actions. In terms of the analysis, there is evidence that considering the viscoelastic behavior of AC and dynamic loading conditions leads to a reduction in fatigue life [14,21]. A question therefore arises as to how pavement analysis could alert us to proactive preservation actions.
In a recent research study, the authors highlighted the influence of AC behavior on the pavement response analysis of a newly constructed pavement [26]. Based on the identified response variations, it was shown that the assumptions considered even a short time after pavement construction can dictate the way decisions are made with respect to consistent interpretation of the analysis results. Stimulated by this study, we decided to expand the scope of the research to gain a deeper understanding of pavement response variations for a wide spectrum of climate variability and also to evaluate the impact of AC behavior on predicting long-term pavement performance. NDT and ground truth data (i.e., AC cores) from two asphalt pavements were integrated: (i) an in-service pavement (time of testing: one year after the release to public traffic) and (ii) an under-construction pavement (time of testing: just prior to the release to public traffic). Both were evaluated following the same experimental campaign in the field. Appropriate mechanistic analysis and AC fatigue models, taken from the Mechanistic-Empirical Pavement Design Guide (MEPDG) [27], were activated to define how the analysis results of the early-life pavement data could affect pavement preservation strategies in order to protect and extend pavement life.
2. Materials and Methods
2.1. Test Sites and Materials
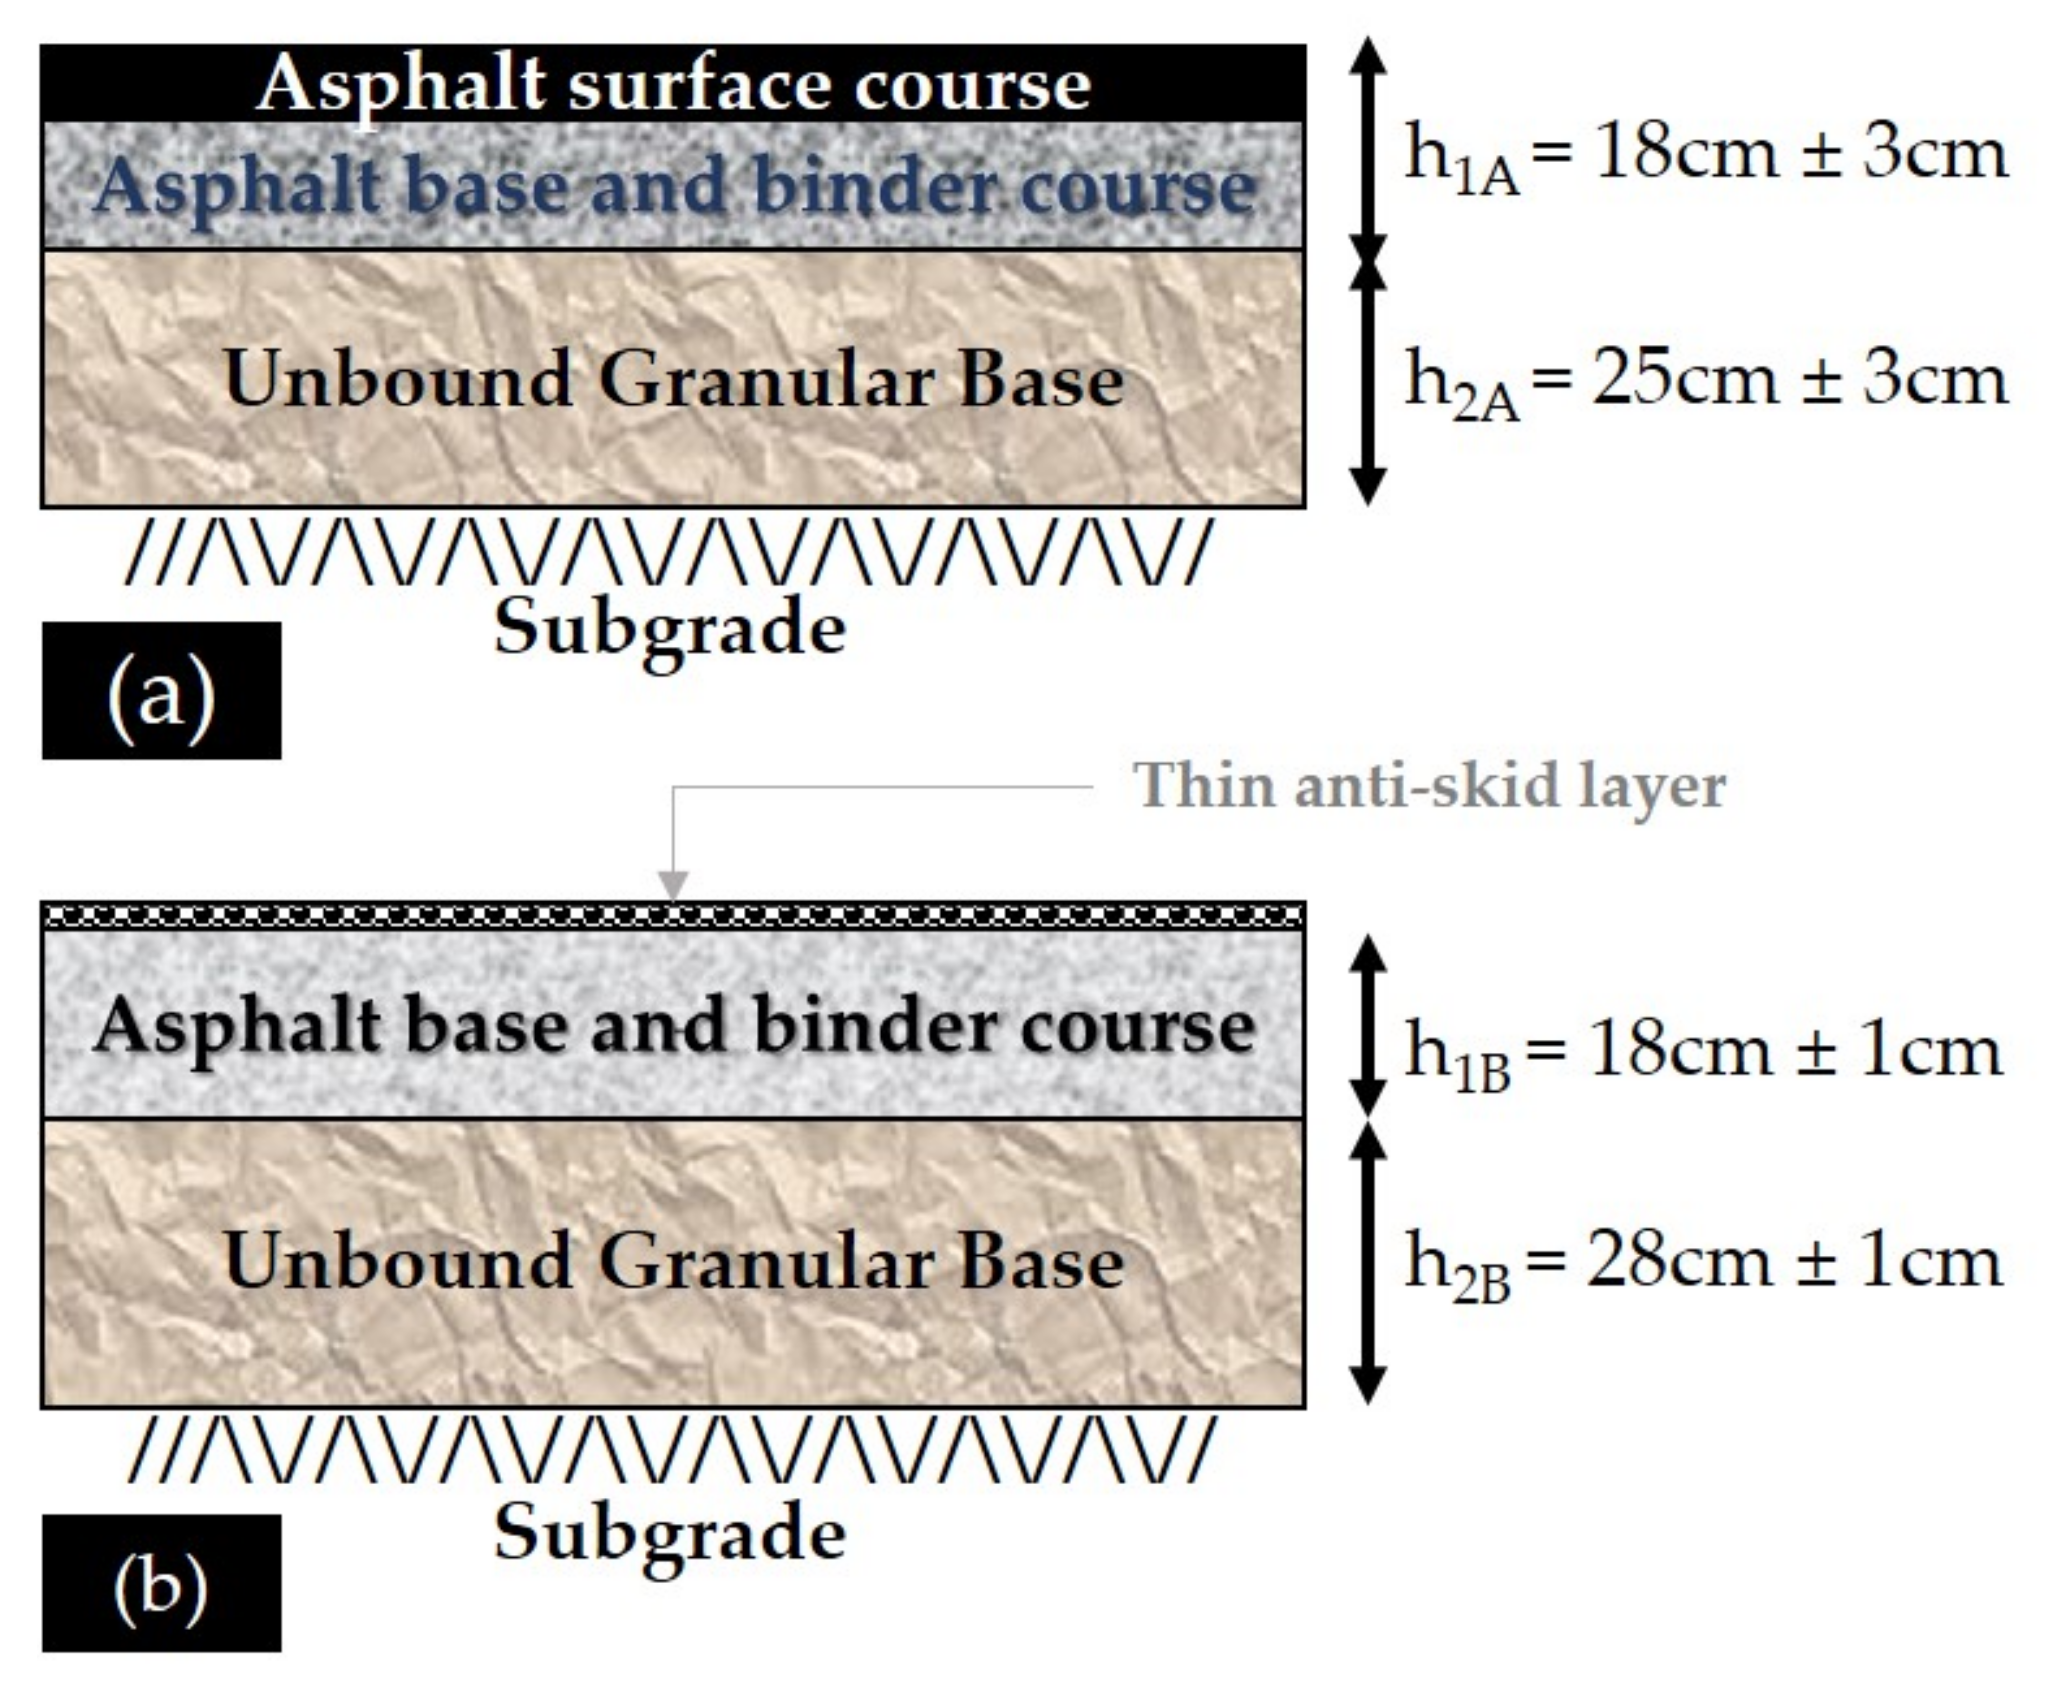
The experiment took place at an under-construction heavy-duty motorway comprised of asphalt-pavement structures with two lanes per direction. The investigated parts of the motorway included two distinct sections with substantial temperature variations in order to capture the effect of AC viscoelasticity. The first one (pavement A) was a section, 20 km in length, belonging to the in-service part of the motorway, while the second one (pavement B) was part of an under-construction section, 5 km in length. Typical cross-sections are given in Figure 1. The illustrated thicknesses for the AC layers and the unbound granular base refer to the as-built pavement status and have been found based on ground truth data and geophysical inspection surveys with the GPR.
As mentioned earlier, the experiment at pavement A took place approximately one year after the pavement construction, whereas in pavement B, it took place shortly after construction. Therefore, collected data from both pavements were used to assess the impact of AC viscoelasticity on pavement response and performance during the early-life stage. The anti-skid layer in pavement B was very small in terms of thickness (i.e., less than 1.5–2 cm) and was necessitated based on road geometry features. This layer was ignored during the pavement analysis, since its structural contribution is negligible.
In regards to pavement materials, the subgrade consisted of natural gravel and the base layer consisted of a compacted crushed-stone granular material for both pavements. As far as the AC materials were concerned, aggregates were of limestone origin. A modified steel slag aggregate mixture and a 4% Styrene-Butadiene-Styrene (SBS) modified binder with soft base bitumen (80/100 Pen) were used in the surface course in pavement A (penetration grade: 52 Pen, softening point: 73 °C). Non-modified bitumen with a 50/70 penetration grade and a softening point of 49.5 °C was incorporated into the asphalt base and binder courses of pavement A, whereas in pavement B, non-modified bitumen with a 30/45 penetration grade and a softening point of 56 °C was used because of the different climatic conditions in the area for pavement B.
2.2. Experimental Framework
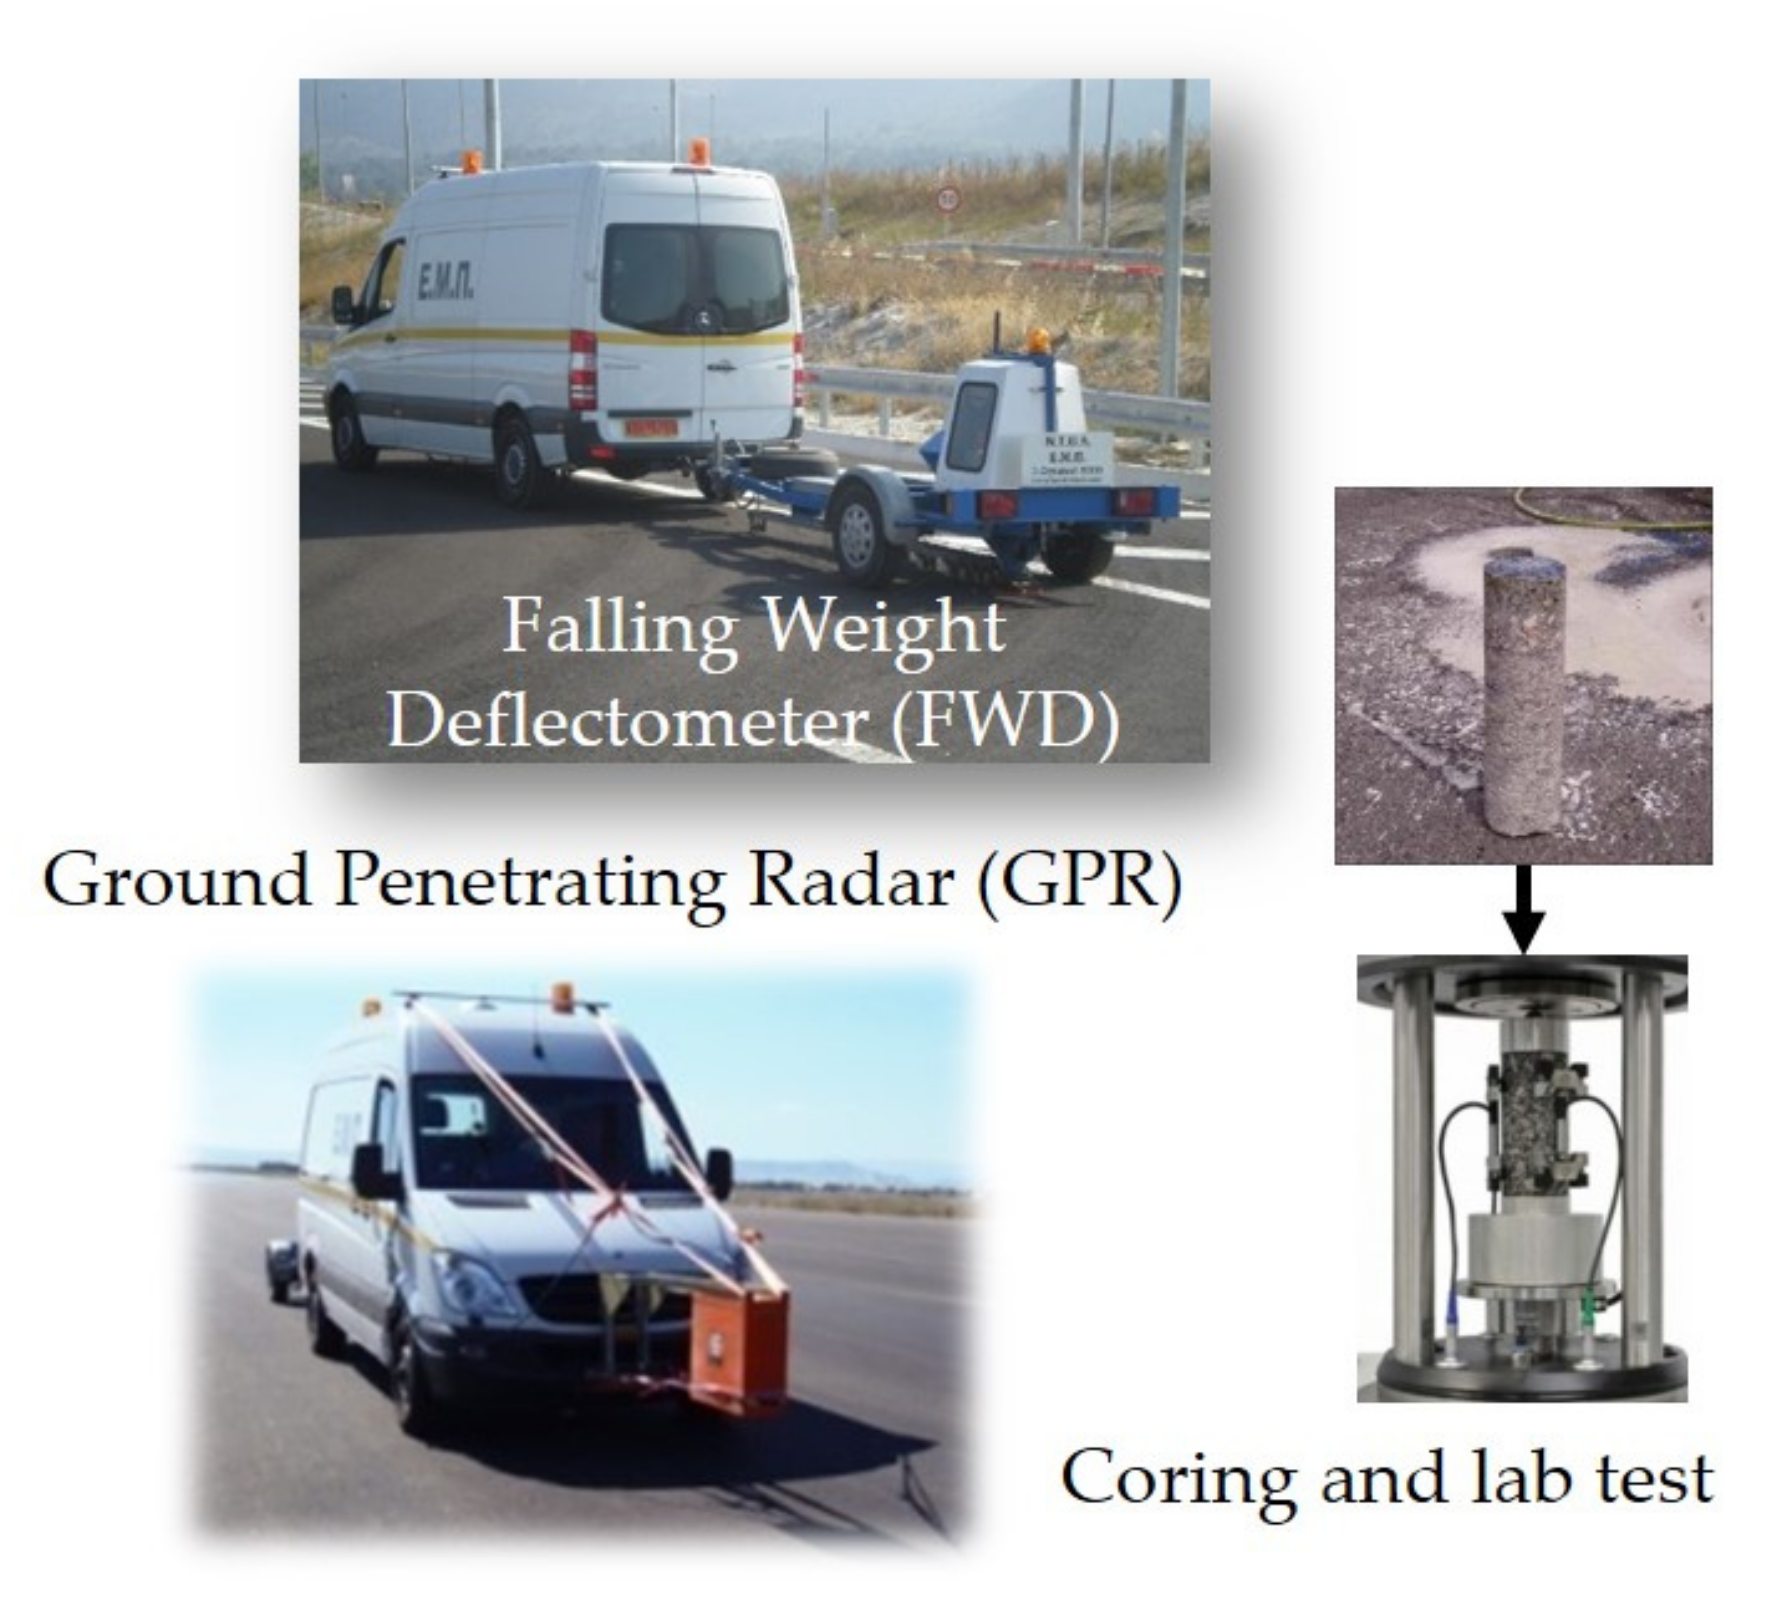
A thorough experiment was organized at both pavements, including extensive NDT measurements with the FWD and GRP systems and sample coring (Figure 2).
In regards to FWD testing, a load impulse of 50 kN was transmitted to the pavements’ surfaces via a loading plate of 30 cm diameter, with the latter being in direct contact with the pavements’ surfaces. Load induced vertical deflections were recorded by a series of nine sensors/geophones spaced at predefined intervals along a radial axis from the loading plate (Table 1). All measurements took place at the right wheel path of the heavy-duty lane at intervals of 50 m.
During the FWD tests, temperature was systematically measured in the middle of the AC base layer through properly drilled holes. Measured temperatures at pavement A ranged from 8–20 °C (taken in late autumn), whereas in pavement B, measured temperatures were higher and ranged from 25–40 °C, something that became feasible by repeating FWD testing at the same test locations multiple times daily, during a dry period in summer. The overall temperature spectrum is given in Figure 3 in the form of a box plot. It can be seen that temperature records correspond to a wide climatic range, which is indicative enough for southern European countries and can provide a good understanding of how the impact of the considered assumption for AC behavior varies against temperature.
In total, 20 test locations from pavement A and 10 test locations from pavement B were considered for the analysis. However, based on the multiple FWD test at the individual locations in pavement B, a total set of 42 deflection bowls was available for the comparative analysis covering the whole AC temperature spectrum given in Figure 3.
Among its several practical applications for roadway engineering, GPR has been proven a powerful tool for estimating pavement layer thicknesses enabling mechanistic analysis of the pavement to take place [3,11]. Detailed information about its measuring principles can be found in [4]. During the experiment, 10 scans/m were recorded continuously along the right wheel path (same path as the FWD testing) along the length of the investigated sections (i.e., in the longitudinal direction). Post-analysis of the GPR data included AC and base layer thicknesses at 10 m intervals. Thicknesses were estimated with low prediction errors ranging from 1–8% (compared with ground truth data, i.e., cores). The error fell within an acceptable range in accordance with other relevant studies [28].
Finally, thirty cores were extracted in total at the identical locations of FWD testing (20 cores in pavement A and 10 cores in pavement B). Cores were used to accurately measure the thickness of AC layers and were thereafter transferred to the laboratory to determine the E* according to the uniaxial compression test mode [29]. According to the test, a controlled sinusoidal (haversine) compressive load was imposed at each core at thirty combinations of five temperatures (4, 15, 20, 25, and 37 °C) and six frequencies (25, 10, 5, 1, 0.5, and 0.1 Hz). Difficulties in performing the dynamic modulus test at −10 and 54 °C led to the selection of the previous temperatures. Similar problems have been also mentioned elsewhere [30].
Based on the collected data in the field as well as the laboratory derived data, the undertaken analyses included the following steps that are also described in Section 2.3:
- Response calculations considering elastic and viscoelastic behavior for the AC materials and elastic behavior for the other pavement layers, i.e., base and subgrade.
- Performance prediction for alligator and longitudinal cracking potential (fatigue analysis for bottom-up and top-down cracking, respectively) considering different inputs from the response calculations.
2.3. Analysis Overview
2.3.1. Response Calculations
The mechanistic framework followed for pavement analysis is illustrated in Figure 4. Based on the NDT data, elastic calculations took place. For the back-analysis of the mechanical characteristics of pavement materials, three robust analysis tools were used: EVERCALC software [31]; BAKFAA software [32], primarily used for airfield pavement engineering; and BackGenetic3D software (version 1.0) [33], which was based on the principles of genetic algorithms. EVERCALC and BAKFAA apply an iterative process for the back-calculation of the mechanical characteristics, whereas the latter applies a “database search” technique. All of them apply MLET for forward calculations. The pavement model used during the analysis included a typical 3-layered structure assuming a unified layer for all AC individual courses.
In order to keep one set of layer moduli per tested location, the statistical significance of the produced strains at the pavement’s critical locations was assessed together with the value of the Root-Mean-Square-Percentage-Error (RMSPE) that accounted for the estimation accuracy of the measured deflections. The considered critical locations where pavement failure was typically expected includes the bottom of the AC (fatigue failure because of horizontal tensile strain) and the top of the subgrade (rutting failure because of vertical compressive strain). For strain calculations, the Equivalent Standard Axle Load (ESAL) of 8 tons with dual tires (contact pressure: 577 kPa) was used (static loading). At each location, strain calculations were performed using the AC moduli corresponding to the temperatures measured in-situ.
Once concluding at a single set of moduli per section, response calculations were repeated with ViscoRoute software [15] to ensure comparability between elastic and viscoelastic calculations that took place with the same tool too. Results from this software were validated based on analytical solutions, finite element simulations, and experimental results from accelerated pavement test facilities in France. In addition, a tolerable difference of 6% was reported by Ulloa et al. [34] for computed responses when using ViscoRoute software and the also widely known 3D-Move software [35], considering both thin and thick highway pavements. Strains were also calculated at zero depth (i.e., at the pavement’s surface) in order to estimate the top-down cracking potential needed for the performance analysis.
In respect to the viscoelastic calculations, response analysis requires knowledge about the E* of the AC materials, which needs to be expressed in the form of the Huet–Sayegh rheological model [36]. This model describes the AC behavior in the Linear Visco-Elastic (LVE) region in a complex format. Its constitutive form includes two branches (Figure 5) with a spring and two parabolic dampers in the first branch that give the instantaneous and the retarded elasticity and a spring in the second branch that gives the static or long-term elasticity. The mathematical formulation of the Huet–Sayegh model is:
where E∞ is the instantaneous elastic modulus (MPa), E0 is the static elastic modulus (MPa), k and h are dimensionless exponents of the parabolic dampers, and δ is a positive dimensionless coefficient. Also, ω = 2 πf (f = loading frequency) and θ = temperature. It is noted that a uniform temperature distribution within all AC layers was assumed for this study according to field temperature records. The temperature function τ(θ) is defined as per Equation (2) (A0, A1, A2 = thermal coefficients):
The development of the E* master curves for all cores required knowledge of the five viscoelastic coefficients (E0, E∞, k, h, δ) and the three thermal coefficients (A0, A1, A2). Model calibration was done based on the measured values of the E* from the laboratory testing and those predicted from Equation (1). The minimization of the Sum of Squared Errors (SSE) between the experimental (EEXP) and predicted (EPRED) dynamic moduli was set as the calibration criterion, defined as:
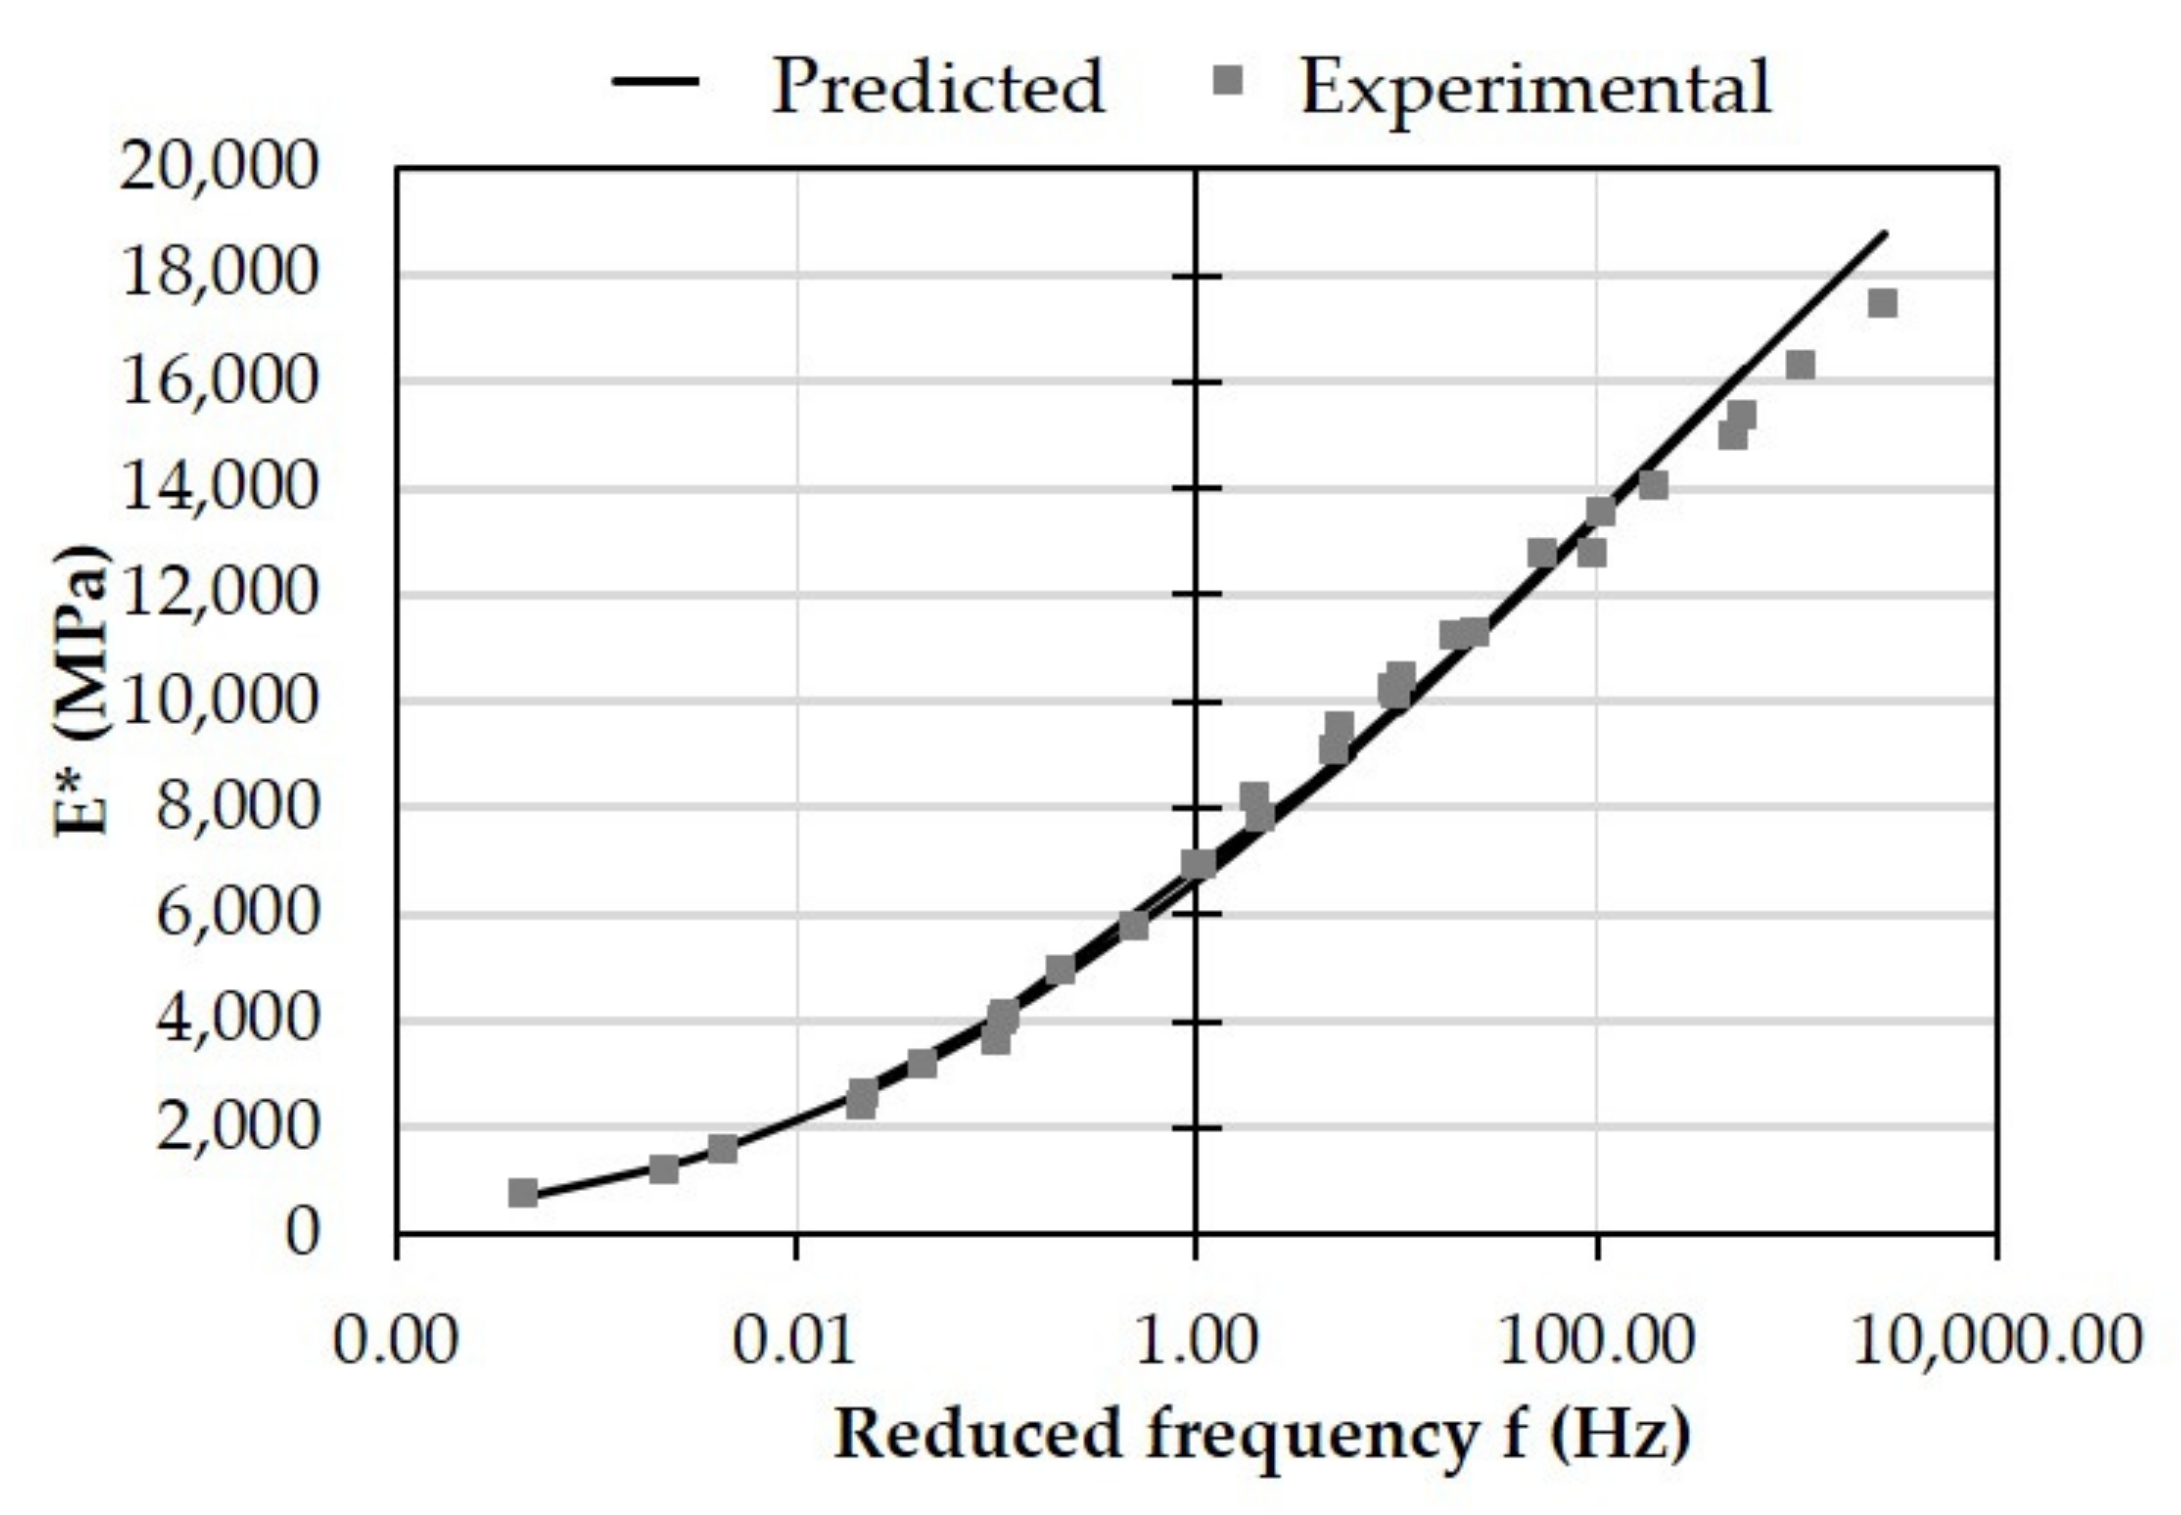
In general, a satisfactory calibration of the Huet–Sayegh rheological model was observed for field cores. SSE taken from Equation (3) ranged from 0.005–0.03 and dynamic modulus was predicted with an average RMSPE of 4.2%. For comparison purposes, SSE for the calibration of the sigmoidal function of the NCHRP 1-37A project [27] was found to range from 0.004–0.024. An indicative example of a typical master curve for one core is given in Figure 6.
Once model parameters were estimated, AC viscoelasticity was incorporated into ViscoRoute software for the calculation of pavement responses. Base and subgrade layers were assumed as linear elastic as per the back-calculated moduli. To account for the effect of moving loads, a speed of 60 km/h was considered for the same loading configuration as done previously. The produced strains were comparatively assessed with those calculated through the standard practice of MLET in order to pinpoint the potential effects of utilizing more advanced mechanistic principles for material characterization on the outcome of pavement evaluation.
2.3.2. Performance Prediction
Response analysis itself does not provide the related authorities with the information needed to proceed with maintenance or rehabilitation planning. The stress–strain state of a pavement affects its performance, which for the case of the asphalt layers is perceived in terms of fatigue cracking. Cracking initiation and most importantly, cracking propagation and expansion rates are critical for planning pavement rehabilitation actions.
Cracking potential can be predicted based on properly calibrated damage models. However, it is rather laborious to collect materials in-situ and perform fatigue tests in the laboratory. Besides, this study does not aim to define the exact maintenance or rehabilitation measure. It rather aims to highlight potential variations in the performance prediction based on different AC behaviors that can be assumed during the analysis of periodical monitoring data. Thus, the generalized fatigue models proposed in the MEPDG [27] are utilized to demonstrate the impact of the assumed AC behavior on the pavement performance analysis.
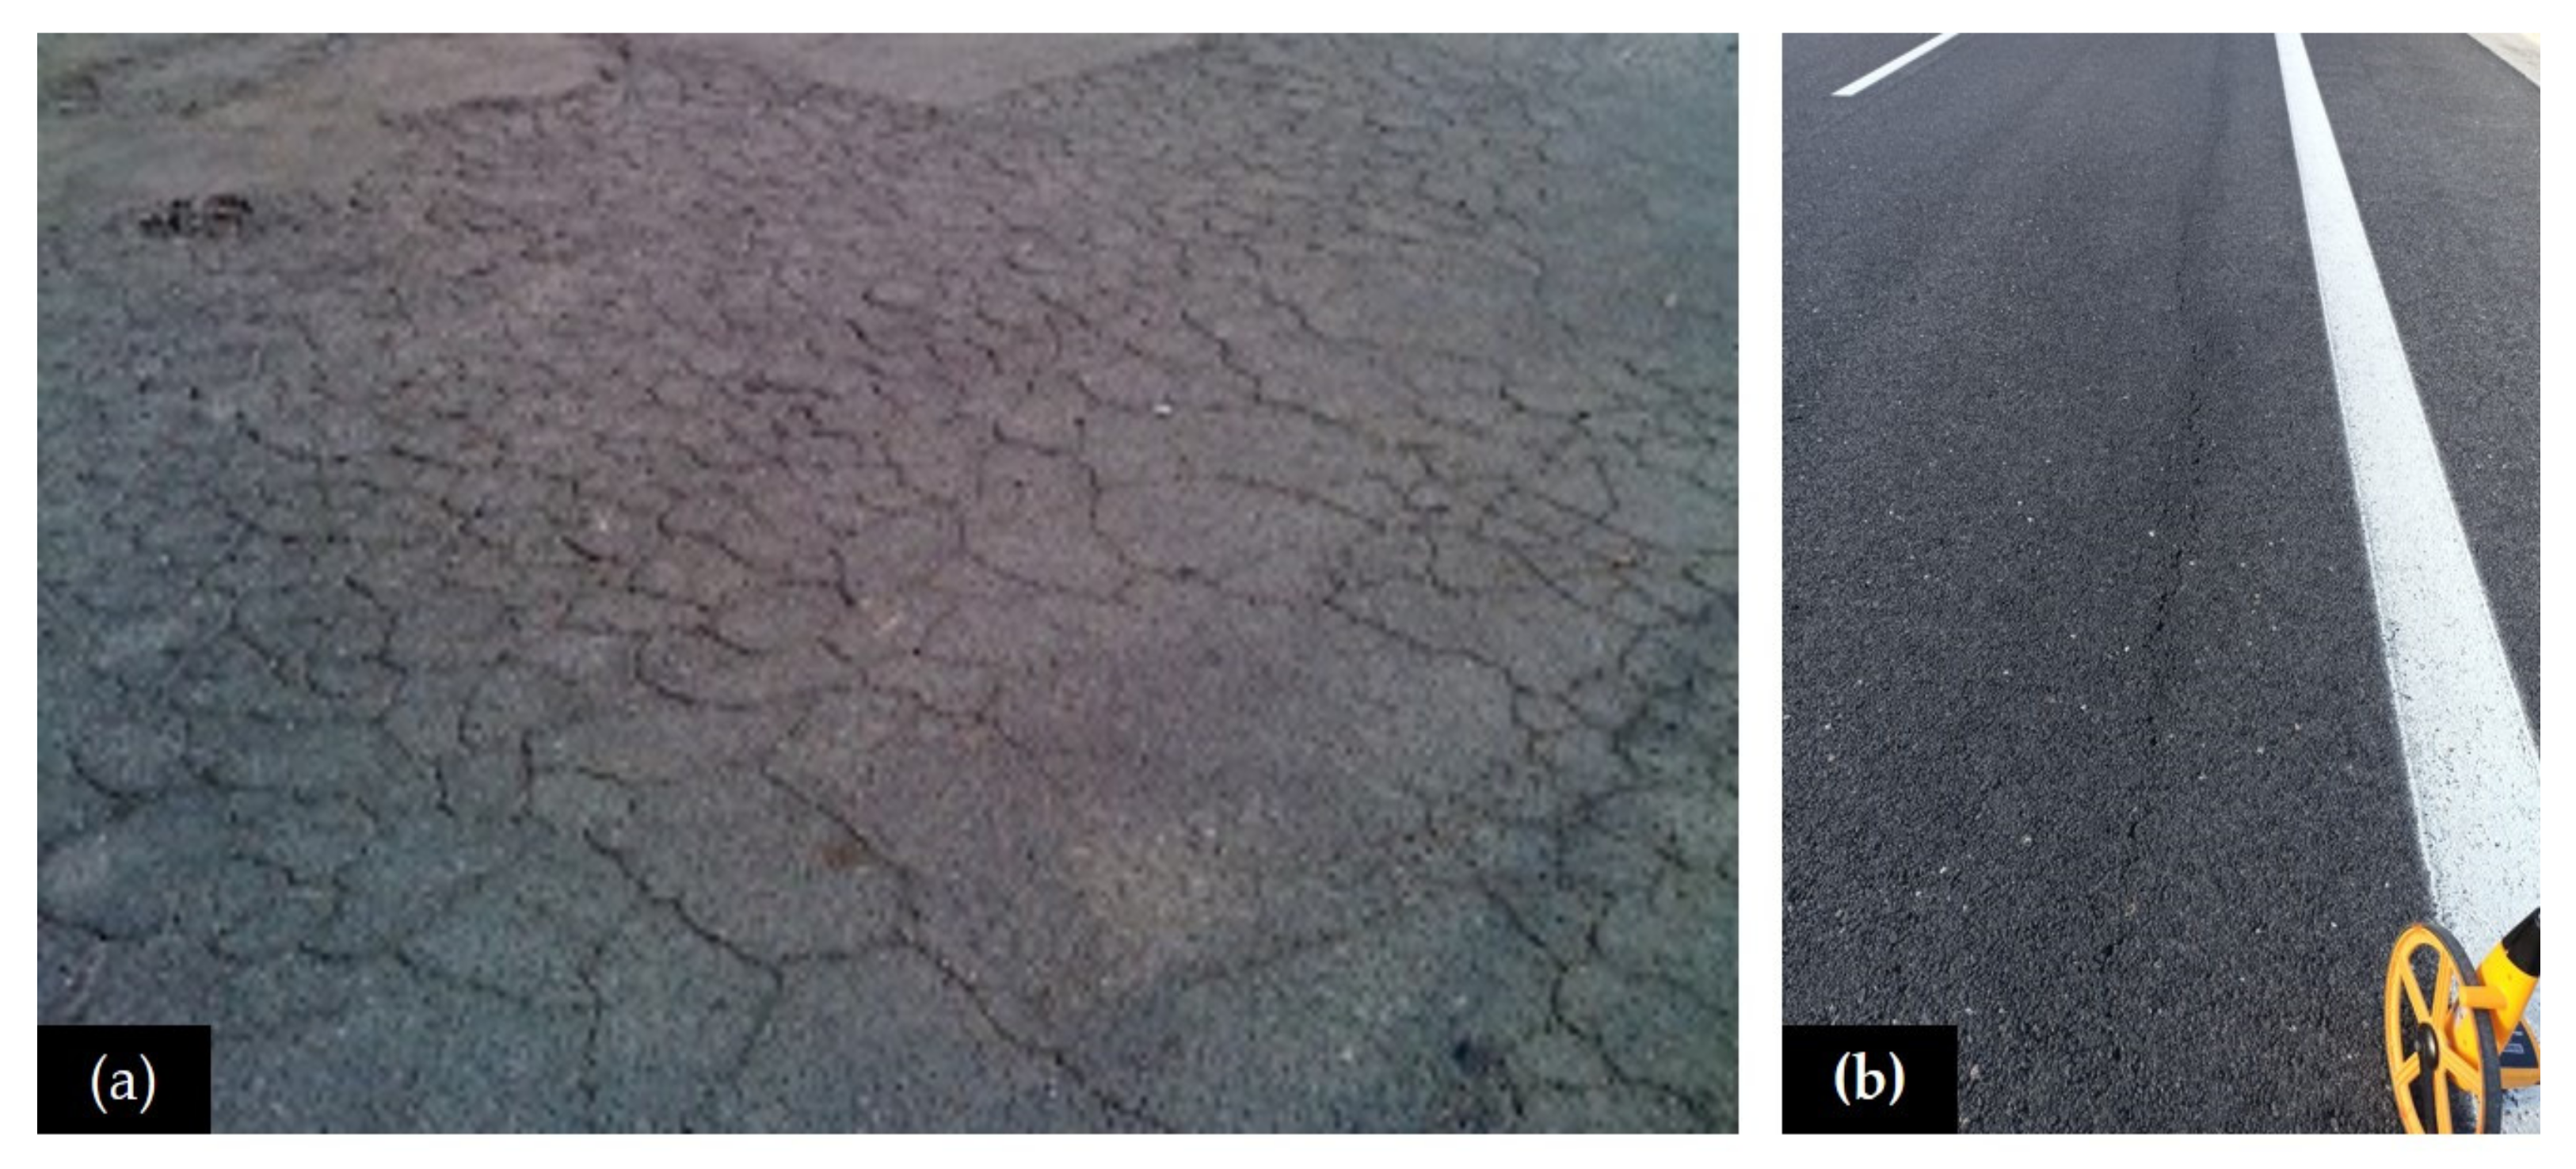
It is well known that fatigue damage comprises two cracking modes. The first and classical failure mode corresponds to cracking that initiates at the bottom of the AC layers because of tension and propagates upwards (bottom-up cracking) [25]. Upon load repetitions, these cracks grow up and as long as they propagate, they tend to become interconnected, appearing at the pavement’s surface as alligator (or crocodile) cracking (Figure 7a) [27]. Since tension also occurs at zero depth near to the exact loading paths [37,38,39,40], cracking can also initiate at the pavement surface and propagate downwards (top-down cracking). These cracks are usually recognized on a pavement’s surface as longitudinal cracking (Figure 7b).
In the framework of the research activities of the NCHRP 1-37A project, MEPDG provides a generalized model in order to estimate the allowable traffic repetitions (). These are calculated as follows:
where:
- , and , Vb and Va: binder and air-void contents (by mixture volume),
- Ch is a factor dependent on the AC thickness (hAC in inches) and its use is expected to increase the predicted pavement fatigue life (transfer function). Ch is defined in Equation (5) (a, b, c, and d are parameters that vary depending on the failure mode—see Table 2):
- : local or mixture-specific field calibration constants; for the global calibration effort, these constants were set to 1.0.
- : global field calibration constants. NCHRP 1-37A proposes the values of 1, 3.9492, and 1.281 for bottom-up cracking prediction and the values of 1, 3.291, and 0.854 for top-down cracking prediction [27].
- , : tensile strain (m/m) and AC dynamic modulus (expressed in psi) at depths for bottom-up cracking prediction and for top-down cracking prediction.
Based on the elastic response calculations with static loading, a uniform AC modulus distribution was assumed, whereas for the viscoelastic response calculations, AC modulus was considered to vary with depth depending on the loading frequency encountered at each depth. There is enough documentation and related research on how to estimate realistic loading frequencies considering as main inputs the vehicle speed, the effective length of loading at the desired depth, and the loading pulse duration [41,42]. In a piece of extensive research, Ulloa et al. [34] retrieved simple linear relationships for the estimation of the predominant loading frequencies in order to estimate realistic values for the E*. Their simulation experiment included a rich database with both thick and thin AC structures at two temperatures (20 and 40 °C) and three vehicle speeds (from 20 to 100 km/h). Their produced equations ( for the loading frequency at depth and for the loading frequency at depth ) were used to estimate different values of the E* during the prediction of bottom-up and top-down cracking potentials. In addition, the temperature measured in the field was considered at each test location in order to properly estimate dynamic modulus corresponding to the in-situ conditions [43].
Once the allowable load repetitions ( expressed in ESALs) were calculated, pavement damage was estimated based on Miner’s law. A typical calculation period of 20 years was considered for the bottom-up cracking analysis, whereas a shorter period of 10 years was considered for the top-down cracking analysis, implying that minor rehabilitation actions at the upper pavement part (surface course or top of binder course) should definitely take place in the context of pavement preservation at shorter time intervals. The expected traffic receptions () were set equal to 25 and 10 million ESALs, respectively. Thereafter, damage was calculated as . To further illustrate the impact of AC behavior on pavement performance, the damage potential was converted into Fatigue Cracking (FC) potential as per the NCHRP 1-37A recommendations [27]. For the case of bottom-up cracking (BC), FC is calculated as follows:
where:
- , with in inches.
- . This conforms to the failure criterion according to which, a totally damaged pavement () is perceived by alligator cracking at a percentage of considering a reference lane area with dimensions 3.6 × 150 m [27].
For the case of top-down cracking (TDC), FC is calculated as follows:
Again, with a damage level of 100%, longitudinal cracking appears at a percentage of 50% (failure criterion). One kilometer includes two linear paths that can crack near to wheel traces, so 50% of TDC corresponds to two cracking paths of 500 m length (1000 m/km in total).
The following section is devoted to presenting the results of the AC behavior’s impact on both pavement response and performance analysis using field and laboratory data from the investigated pavements.
3. Results
3.1. Overview of Elastic Calculations
Initially, elastic strains were calculated with the BISAR tool [44]. Three different sets of strains were calculated based on the three stiffness profiles. The most indicative one was defined after assessing the statistical differences between the produced strains at both critical locations (Table 3) as well as the RMSPE during the back-calculation of the stiffness profiles. A paired t-test was performed at a 95% confidence level and according to the null hypothesis, there was no statistical difference between the strains calculated from different pavement stiffness profiles. The rationale for assessing strain differences was based on the lower dispersion of strains as opposed to the dispersion of moduli [45].
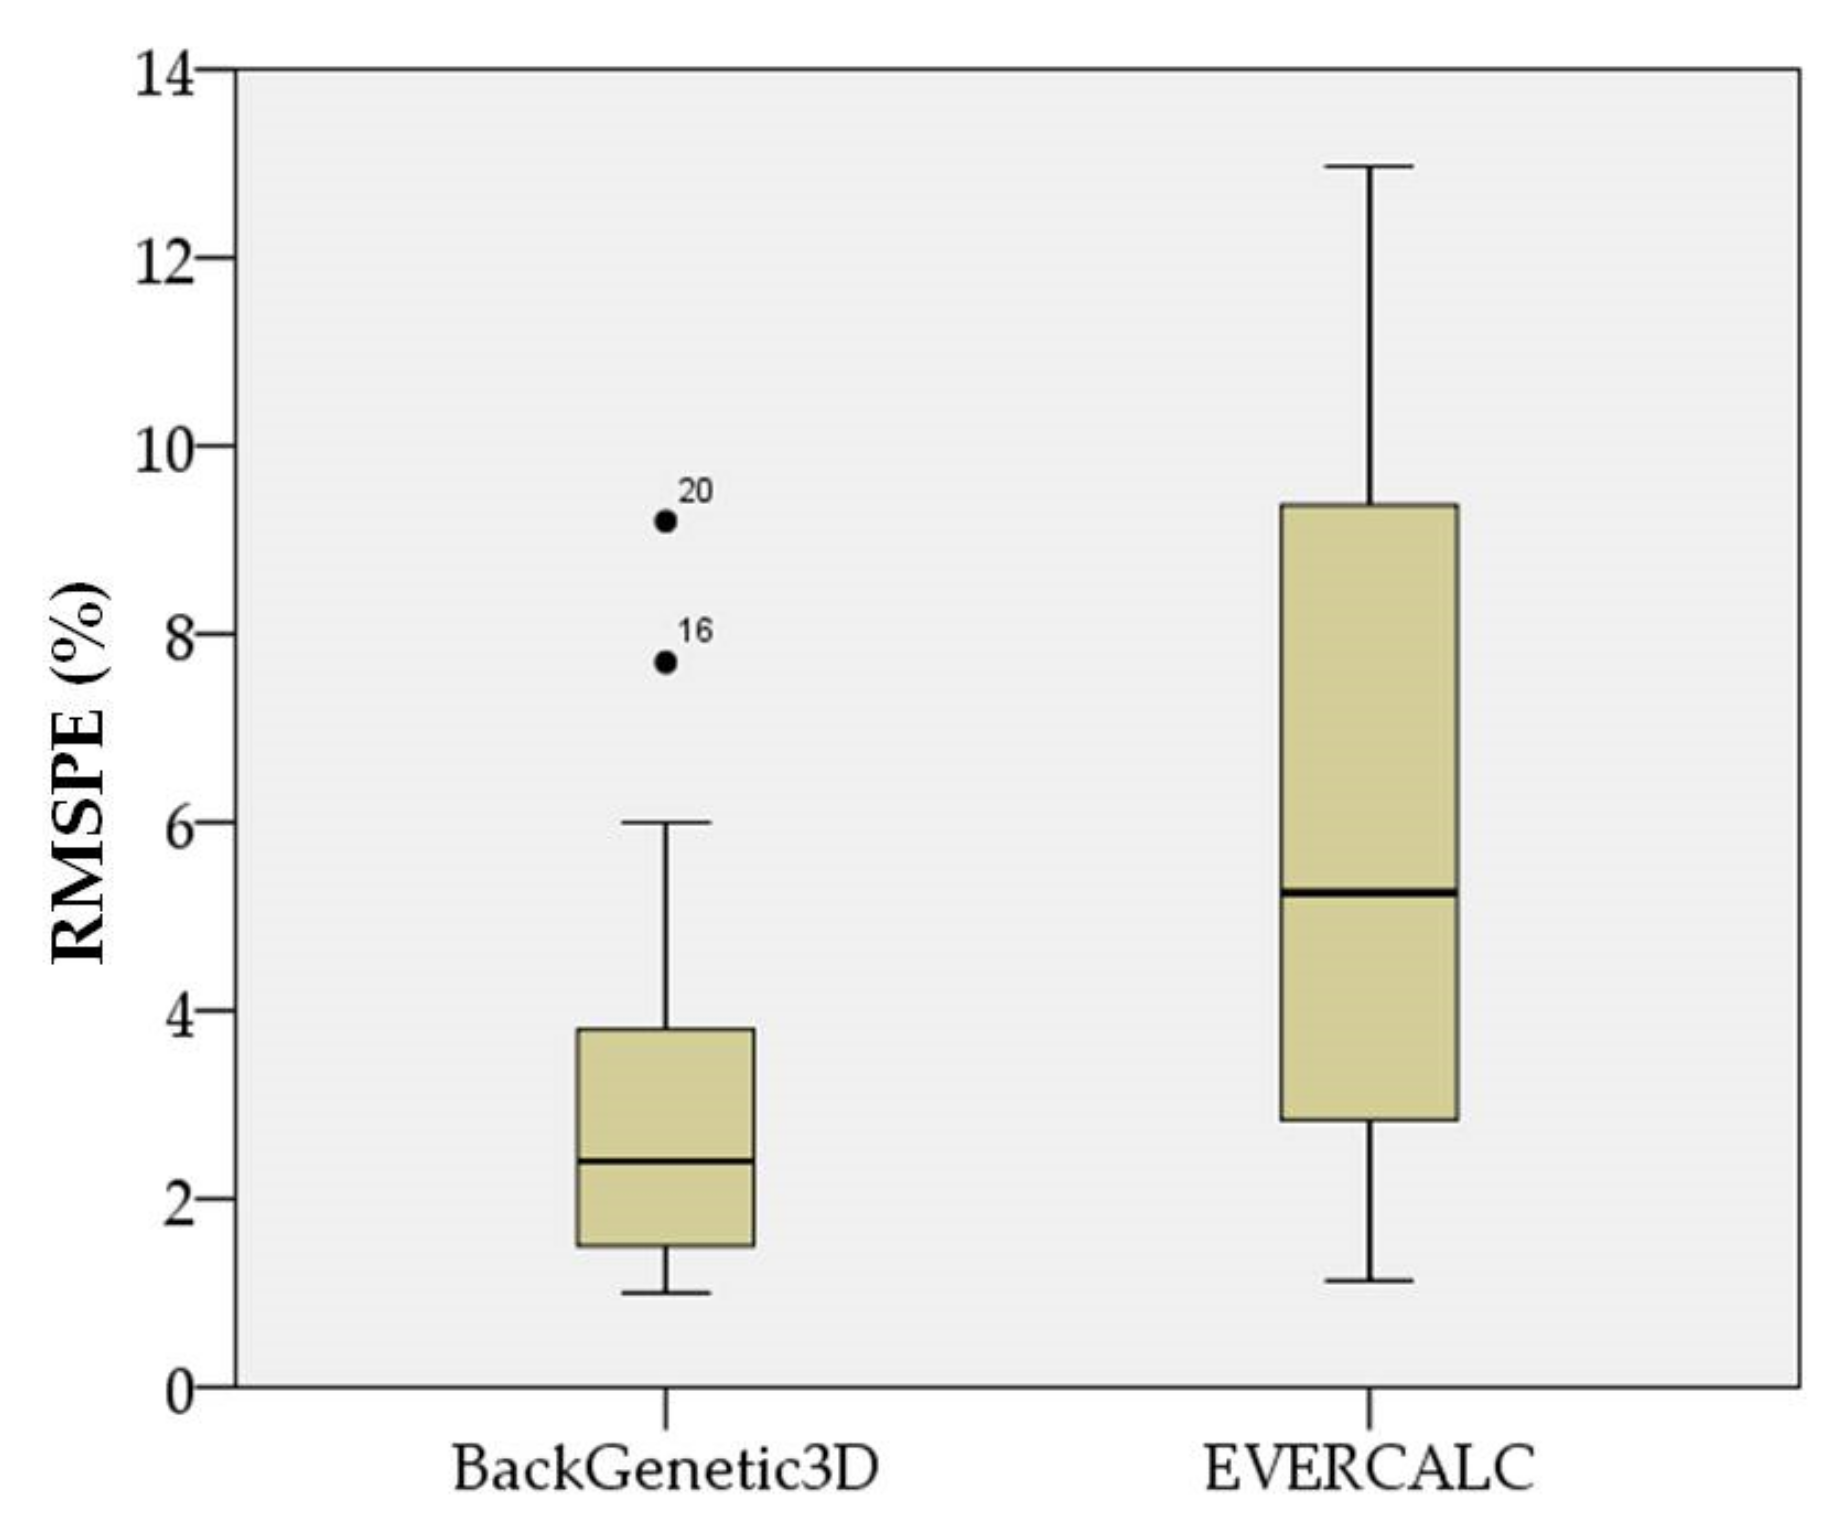
Among the utilized tools, pavement stiffness profiles taken from BAKFAA led to substantial differentiation in the produced AC strains; thus, BAKFAA was excluded from further consideration. Perhaps, its use might better suit airfield pavement structures that are usually of different cross-sections compared to highways [32]. Moving forward with the RMSPE overview of the other two tools (Figure 8), the tool of genetic algorithms appeared as the most indicative one for this study. In particular, the inter-quartile range of RMSPE was 1.8–4%, which is in general in good agreement with other research as well [4,11]. Moreover, the theory of genetic algorithms has been commented as a promising technique in terms of reliably estimating pavement structural capacity.
Thereafter, using layer moduli from Backgenetic3D, elastic calculations were repeated with the ViscoRoute tool that was used as a reference tool for the research’s comparative assessment.
3.2. Impact of AC Behavior on Pavement Response
Pavement response is related to the mechanical properties of the pavement materials and the generated strains. Therefore, a comparison of the considered AC moduli for the analysis was made followed by a thorough assessment of the strain differences. A preliminary modulus comparison is given in Figure 9 considering the back-calculated moduli for the elastic analysis and those predicted through the Huet–Sayegh model for the viscoelastic analysis. For the latter case, the AC modulus was adjusted at field conditions (AC temperature and loading frequency corresponding to the bottom of the AC).
Figure 9 illustrates that the AC modulus shows a downward trend with the increase in AC temperature, which is consistent with common sense for AC behavior, regardless of the type of analysis. In particular, AC modulus appears to correlate exponentially with AC temperature with satisfactory R2 values. In addition, based on the available data, the viscoelastic analysis tends to present a stiffer material at lower temperature and a softer material at higher temperatures compared to the elastic analysis, which was expected given the viscous nature of the binder. From a statistical point of view, moduli differences were found to be significant considering the entire temperature spectrum ( and for 41 degrees of freedom).
In regards to strain calculations, Figure 10 illustrates the typical distribution of horizontal strains at the bottom of the AC for the considered axle load configuration. Both longitudinal and transverse profiles are given. In accordance with previous knowledge, both tension and compression appeared longitudinally, whereas only tension existed transversely [46]. The negative longitudinal strains reflect the compression state that exists along the approach and leave area on either side of the exact loading point. In addition, for a single axle with dual wheels, longitudinal peak strains are known to be higher than transverse strains [15] and this was confirmed in this study too. Hence, longitudinal strains were hereinafter considered for the rest of investigation for the sake of being conservative.
The peak longitudinal strains calculated from elastic and viscoelastic analysis are shown in Figure 11. No consistent trend can be seen as to which analysis type is more critical. This was also confirmed by the difference between the calculated strains, which does not appear to be statistically significant. However, this could be due to the fact that the entire temperature spectrum in Figure 11 was considered in conjunction with the variable trend observed in the AC modulus variation in Figure 9. Nevertheless, taking the elastic calculations as reference based on the standard analysis approach, the viscoelastic strains were calculated with a RMSPE of 11%. Therefore, the authors decided to further investigate this type of deviation. The statistical tests were repeated by dividing the available data into three groups in terms of AC temperature, taking into account the wide variety of available climatic conditions encountered in the field.
The first group included strains calculated at low to moderate temperatures (i.e., 8–15 °C), the second one included strains calculated at moderate to high temperatures (i.e., 19–27 °C), and the last one included strains calculated at very high temperatures (i.e., 30–40 °C). Temperature ranking was based on typical climatic conditions that can be encountered in southern European areas. Based on this discrimination, strain differences were found to be statistically insignificant for low to moderate and moderate to high temperatures, whereas strain differences were found to be statistically significant for very high temperatures with the viscoelastic case appearing as more conservative (i.e., leading to higher strains). Strain sensitivity on high temperatures has been demonstrated in other studies too [16,26].
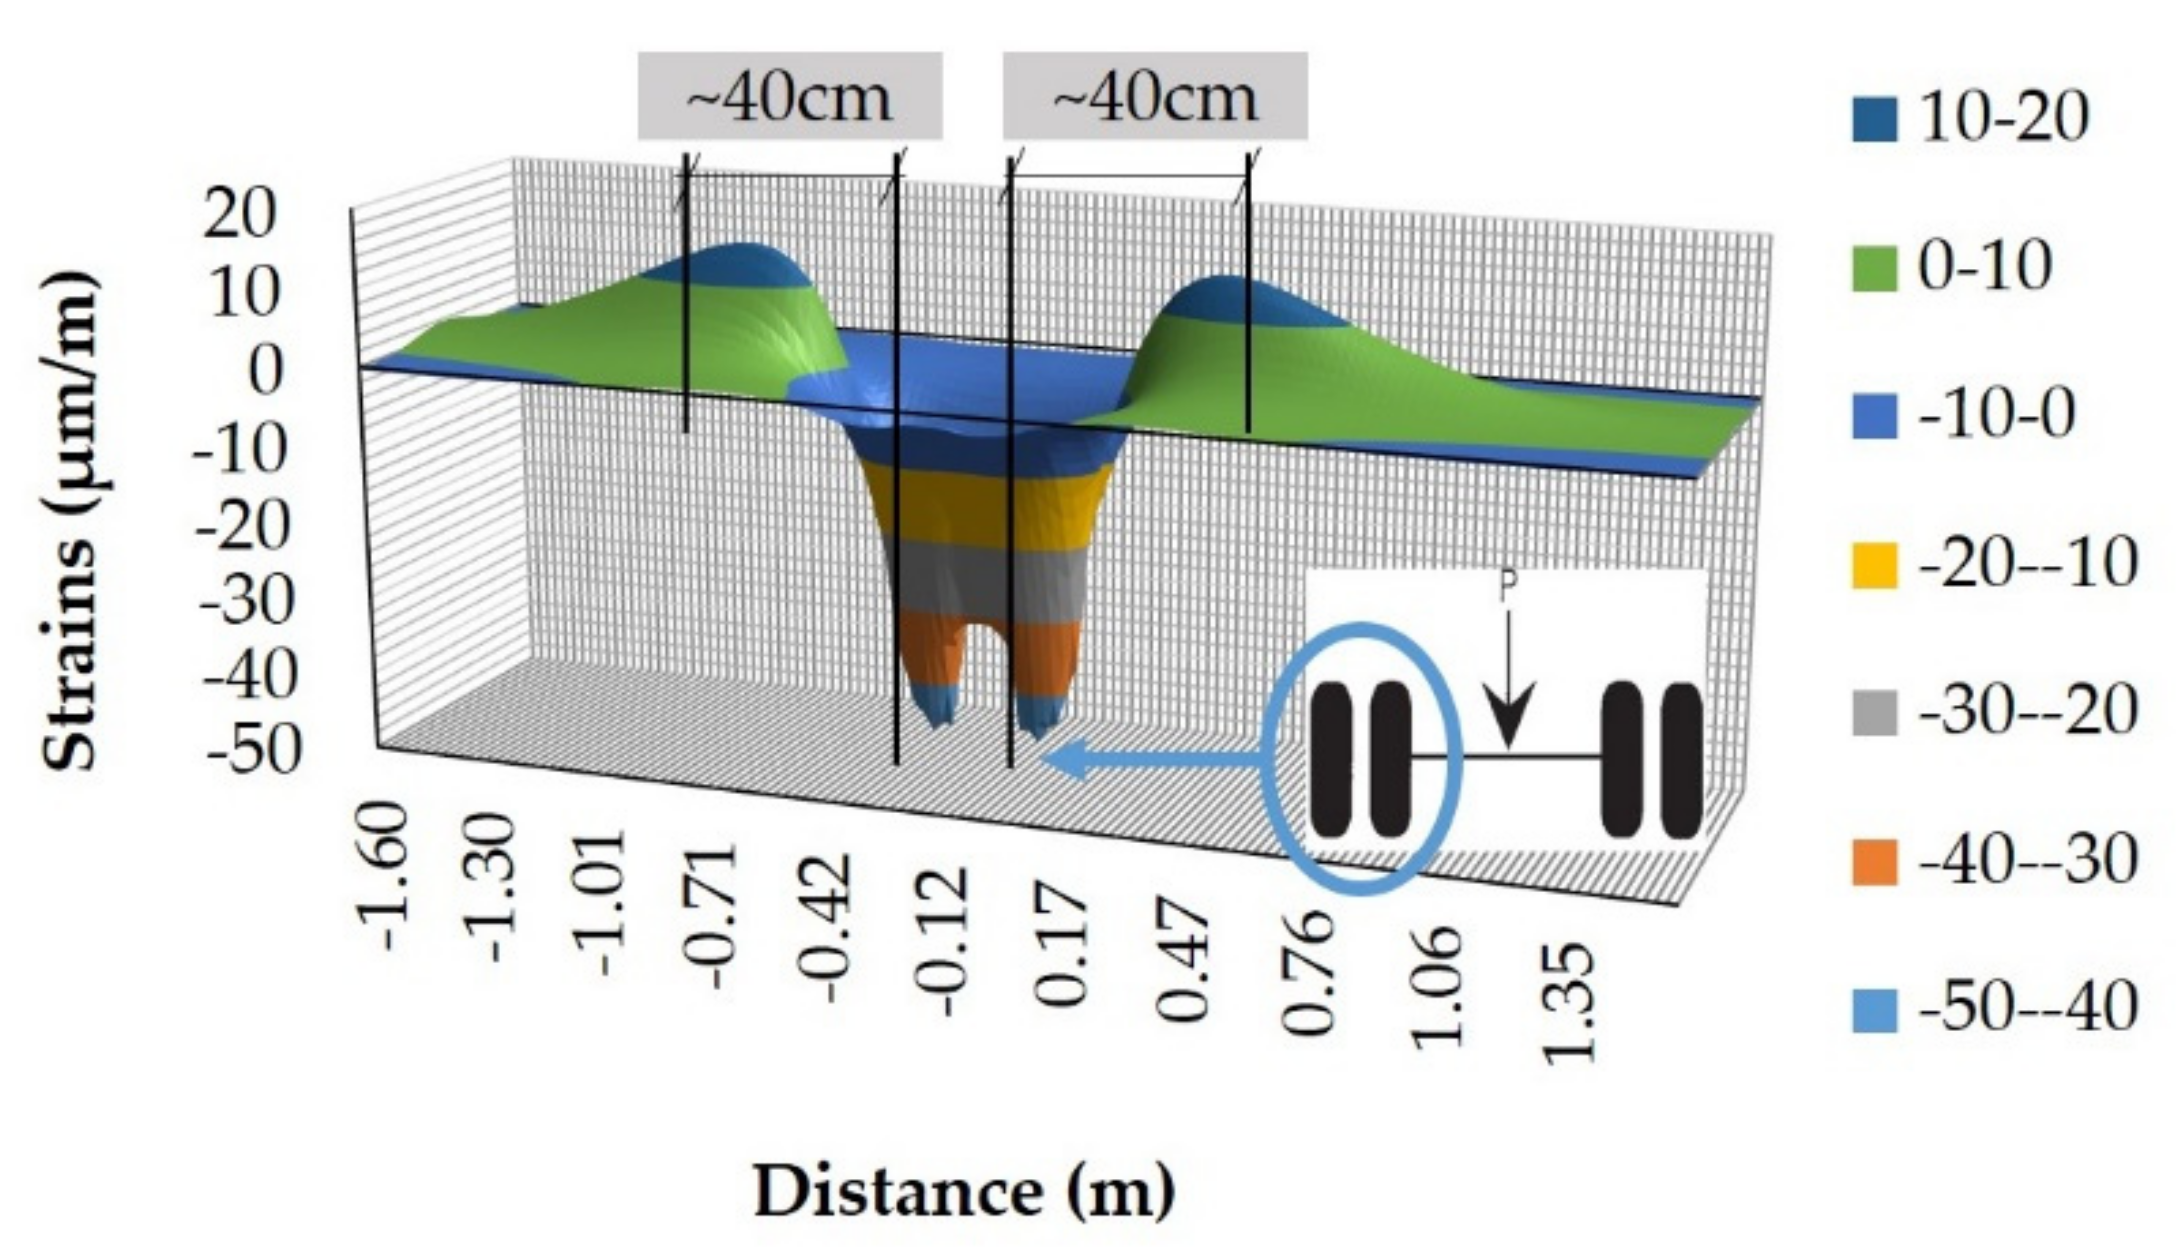
In regards to the horizontal strains at the pavement’s surface (zero depth), a typical distribution is given in Figure 12 for an indicative test location. Herein, transverse strains appeared to be higher than longitudinal ones at a percentage of 6–10%.
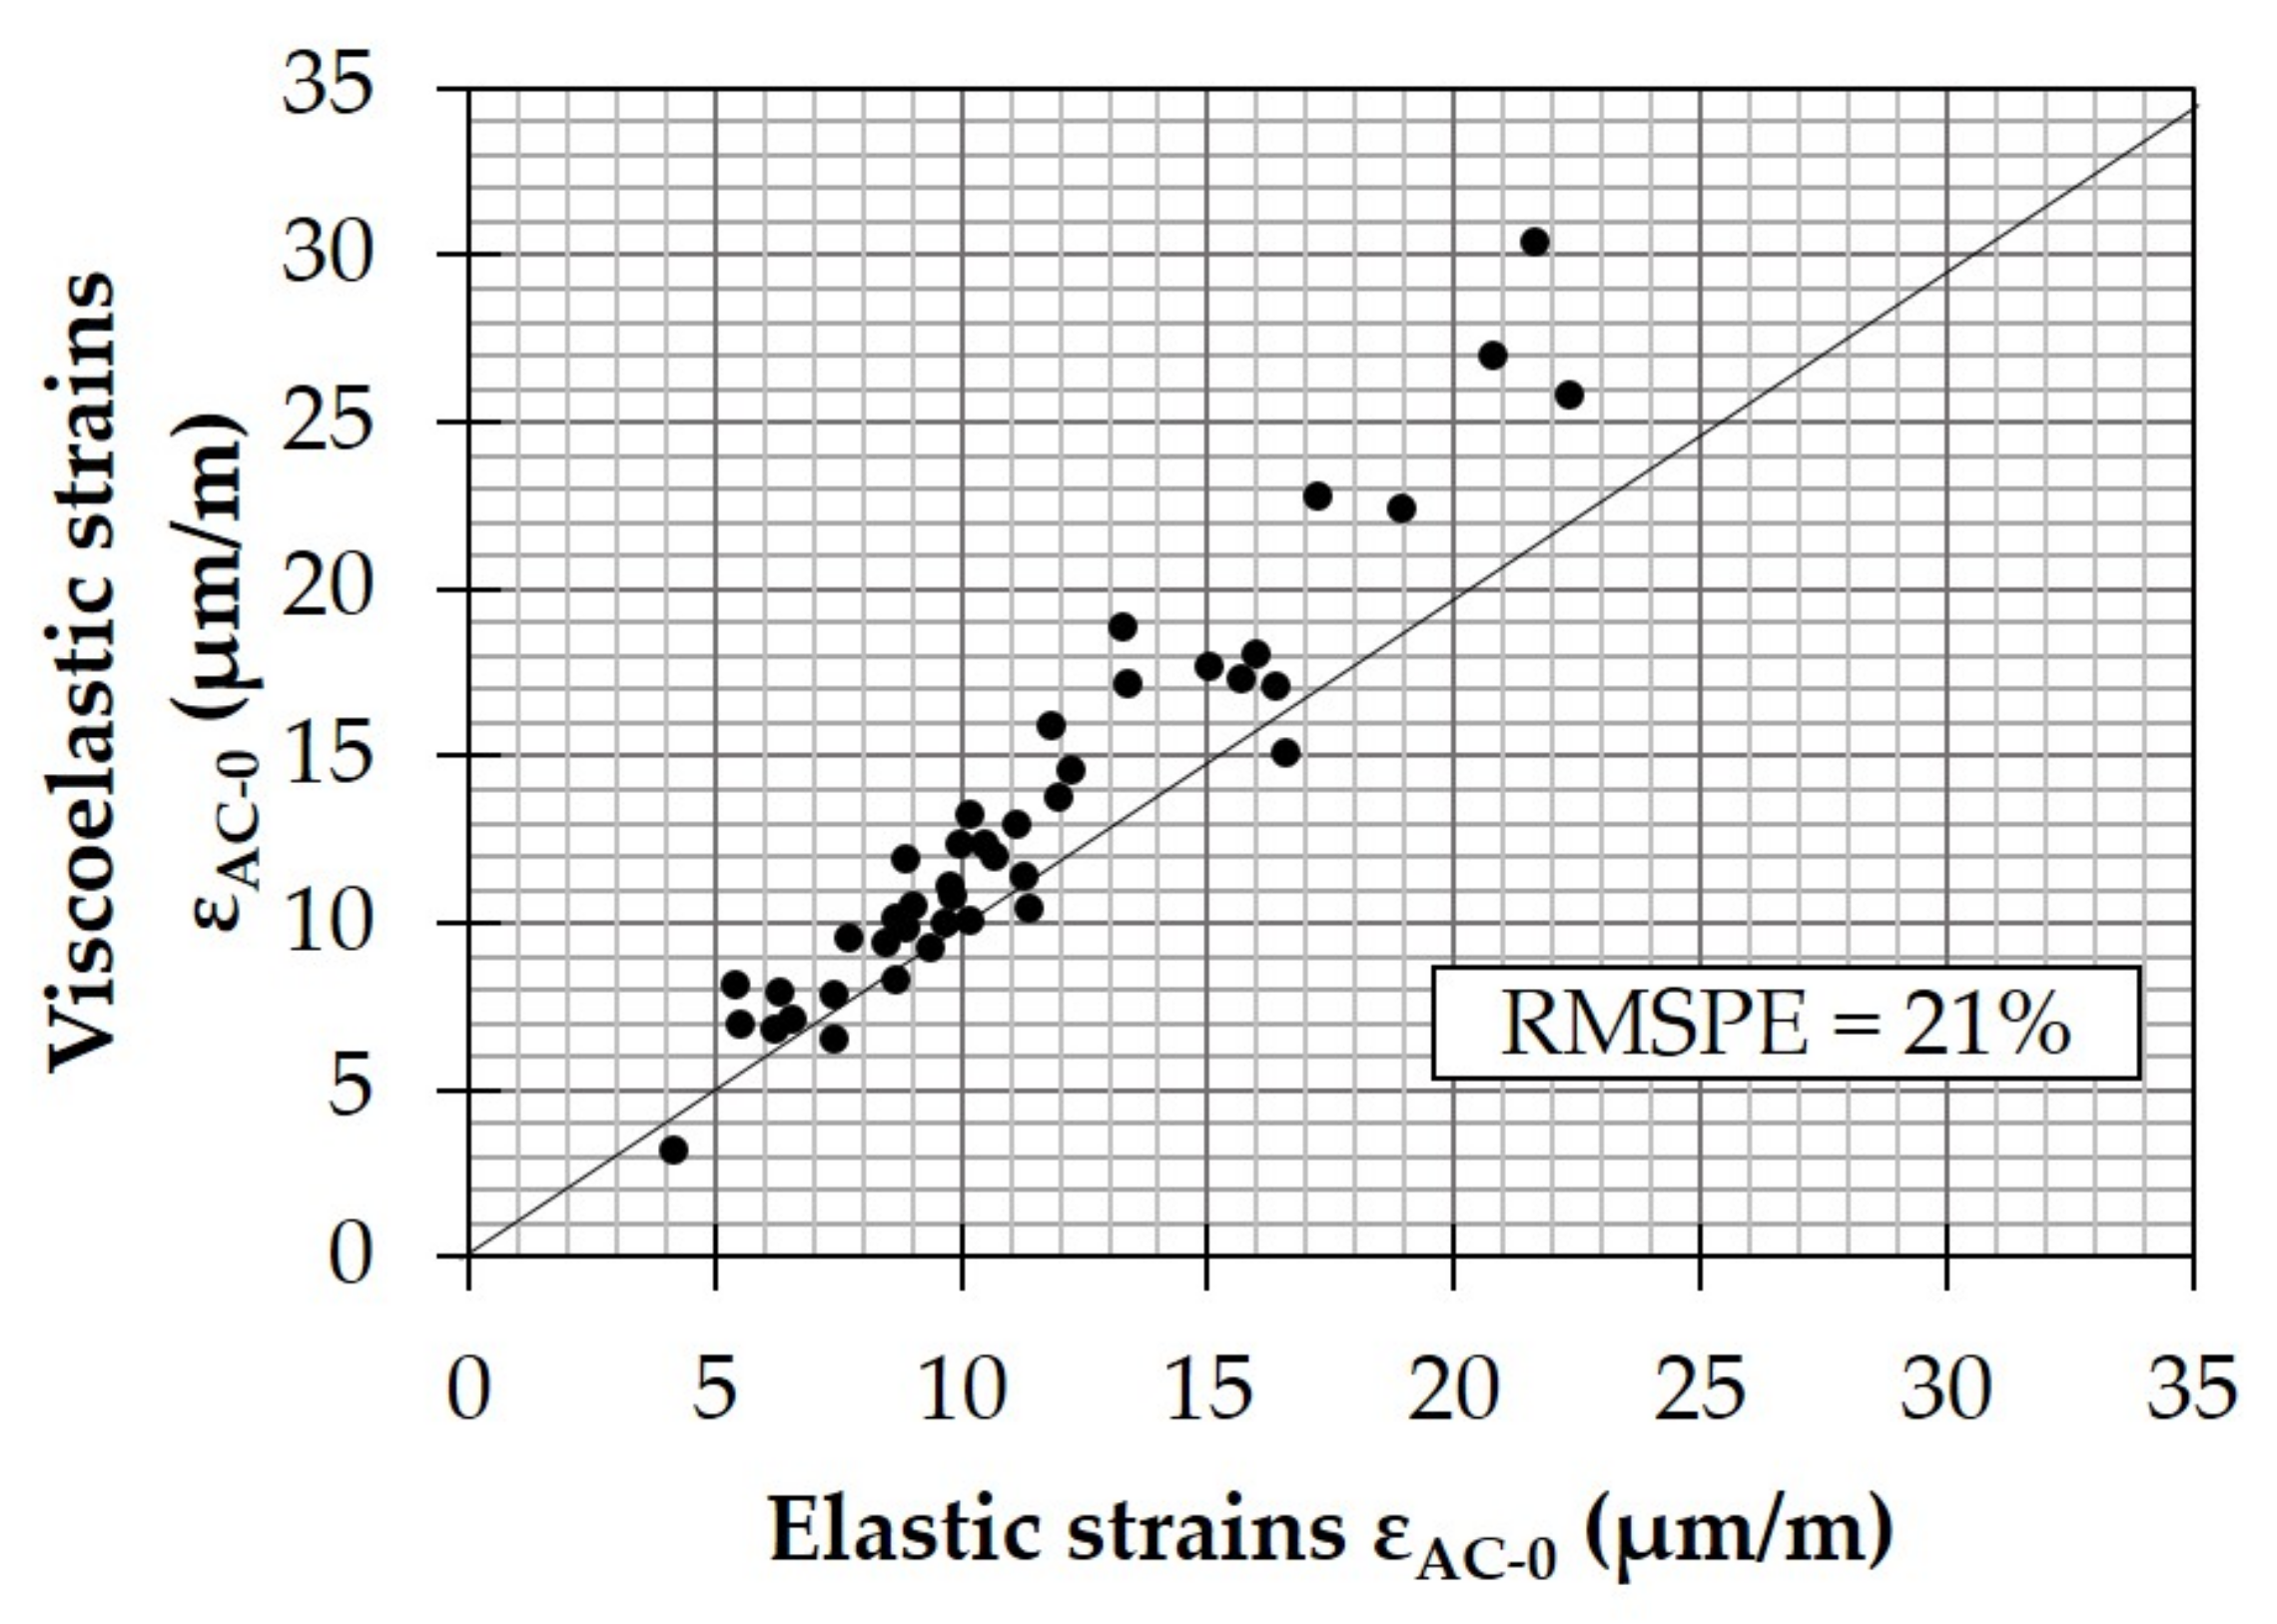
It is worth noting that tensile strains reach their maximum value (of around 15–20 μm/m) at a distance of 40 cm away from the loading path in accordance with previous studies [38,39]. The exact distance depends of course on several factors including, among others, load magnitude and lateral distribution of heavy-duty vehicles [37]. Furthermore, comparison of the peak strains calculated with both types of analysis (Figure 13) resulted in statistically significant strain differences, with the viscoelastic case appearing again to be more conservative for the full range of temperatures measured in the pavement body. Another important observation is that the RMSPE at the calculated strains at zero depth was greater than previously (i.e., 21 versus 11%), an aspect that proved the greater analysis sensitivity of the pavement surface strain state to the considered assumptions for AC material characterization.
So far, the related investigation highlighted a noticeable impact of the considered AC behavior on pavement response analysis for both AC critical locations (top of surface course and bottom of asphalt base). The stress–strain state at these locations acted in favor of crack development that usually triggers the related authorities for maintenance or minor rehabilitation activities in the framework of pavement preservation. Even in the case of minor treatments, reliable warning remarks should be available from pavement analysis. Therefore, it is of practical interest to further investigate the effect of the AC behavior on pavement performance prediction in terms of assessing alligator and longitudinal cracking potentials.
3.3. Impact of AC Behavior on Pavement Performance Prediction
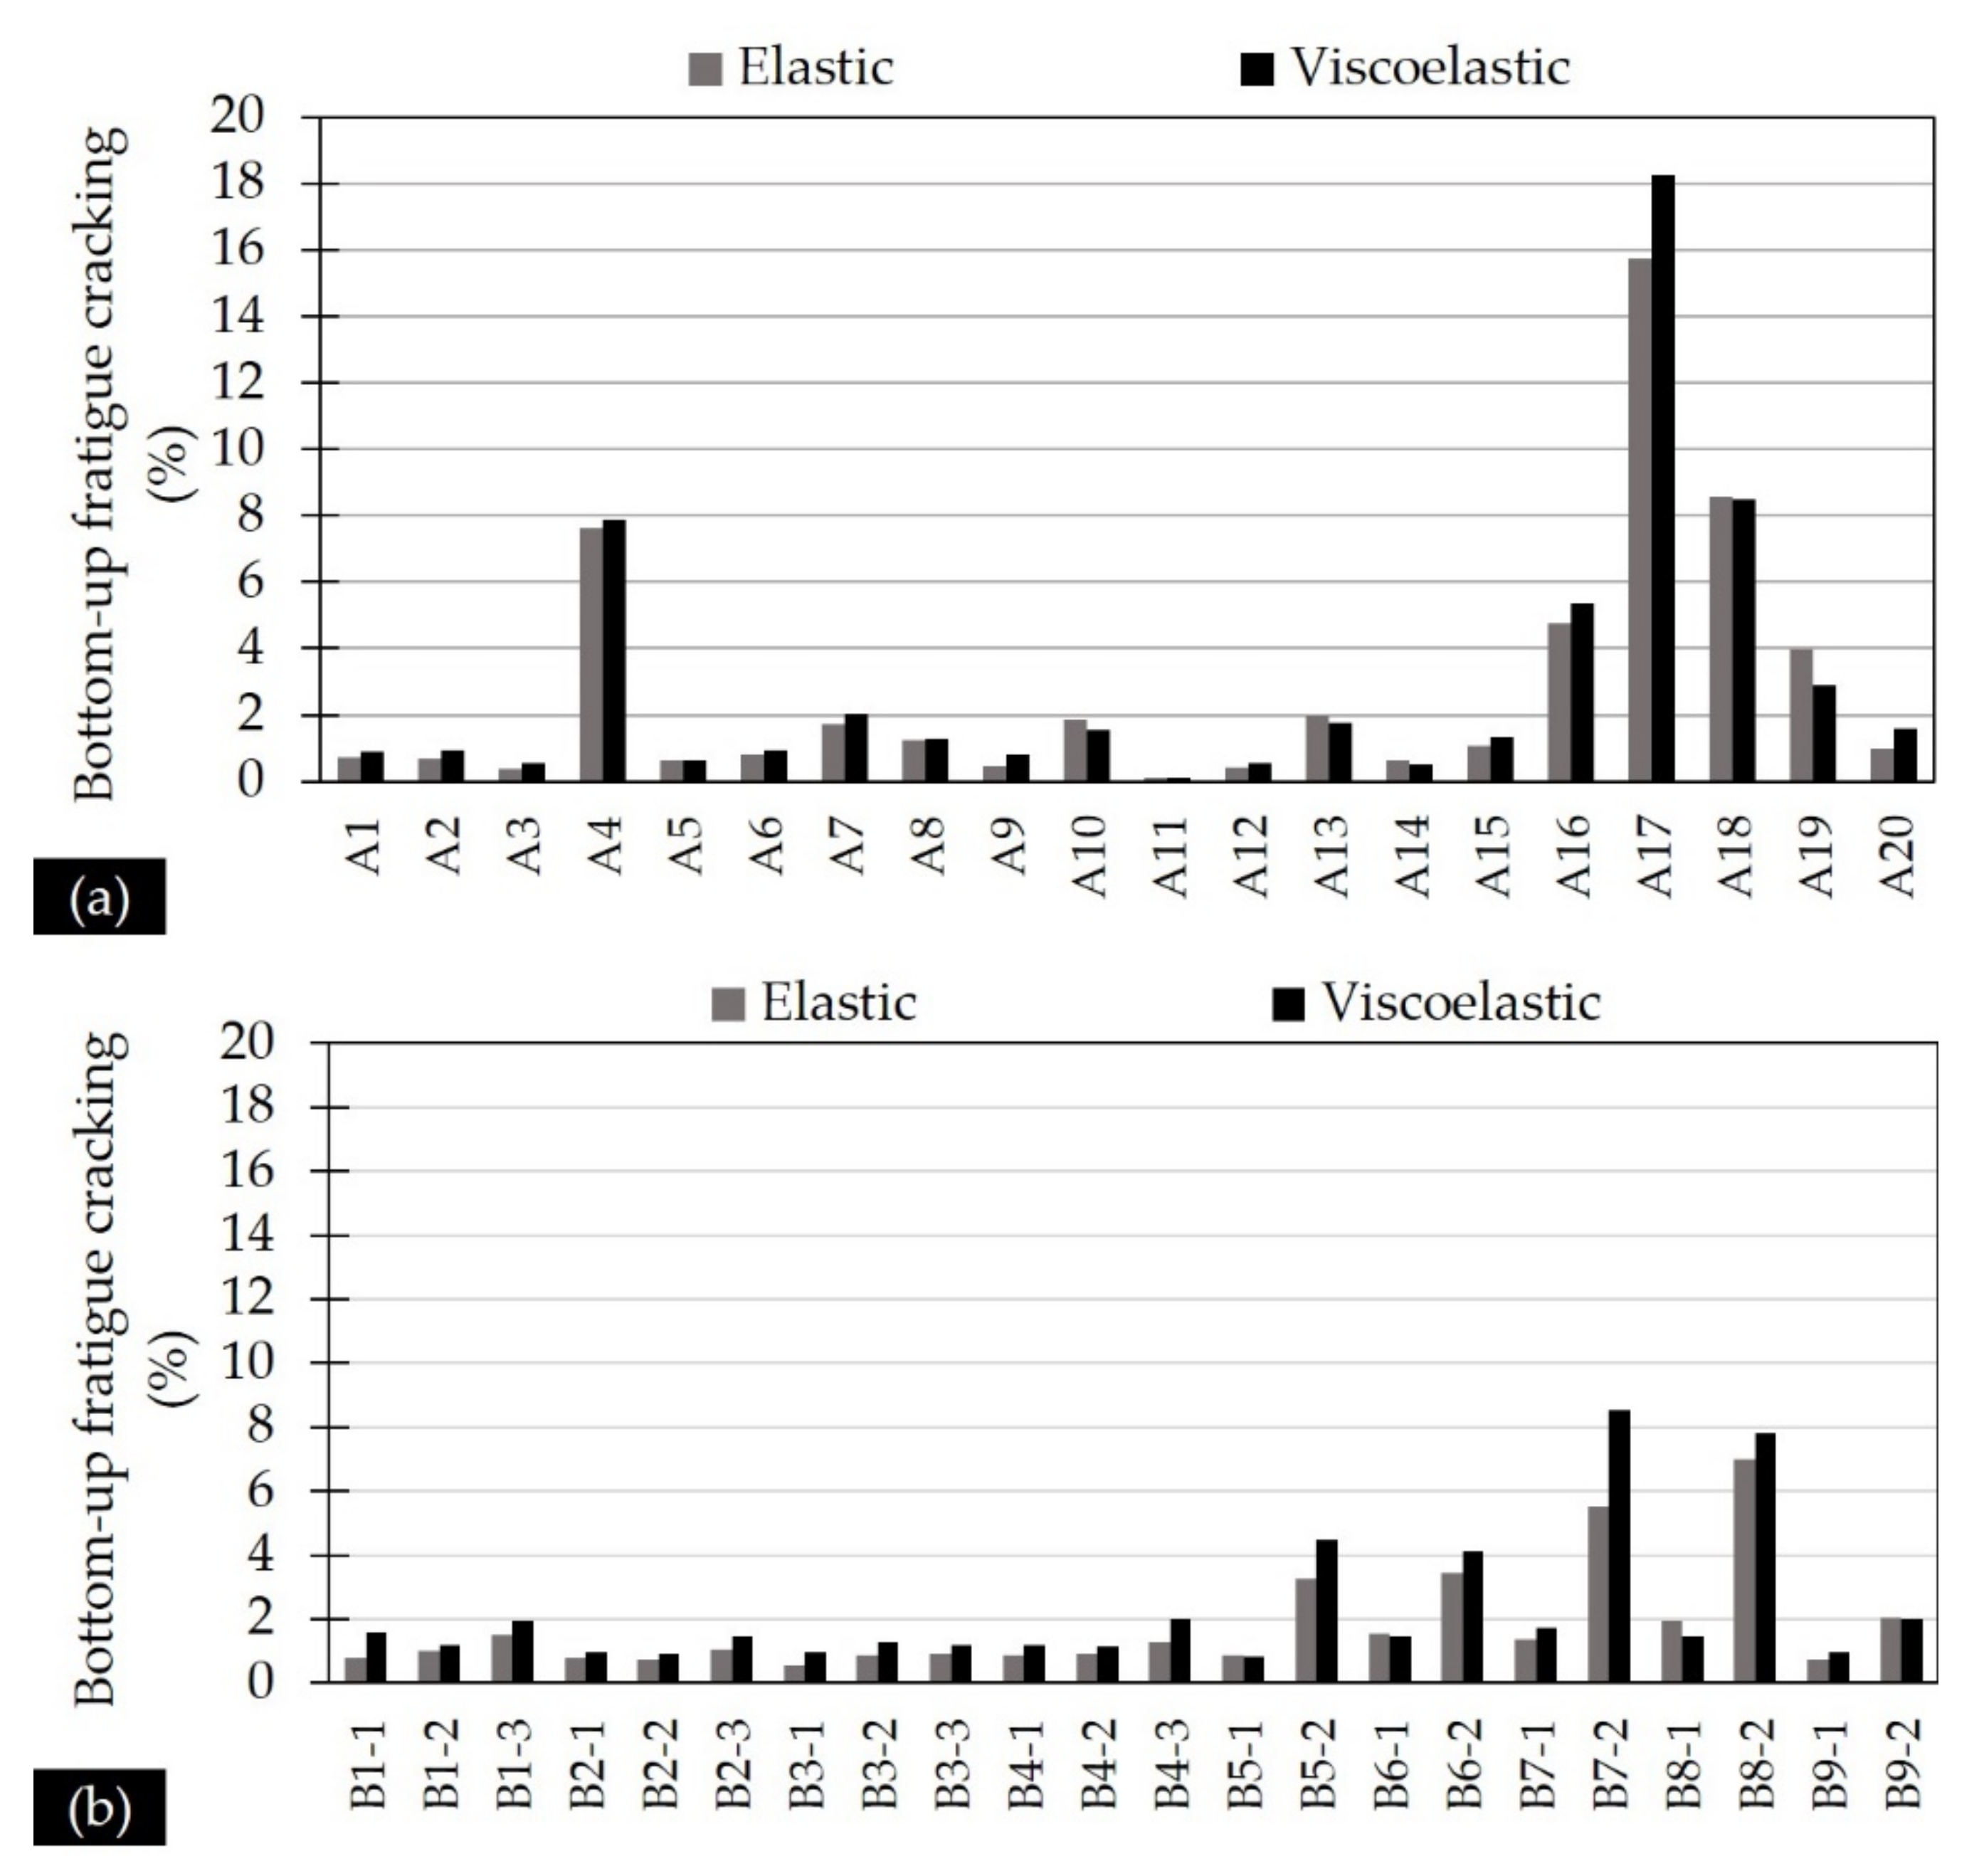
Based on Equations (4), (6) and (7), BC and TDC potentials were estimated under the assumptions made in Section 2.3 for the expected traffic and calculation periods. For the BC potential, the allowable traffic repetitions were found to be statistically significant for the whole temperature spectrum observed in the field ( and for 41 degrees of freedom). However, the order of magnitude was a bit high; something that can be attributed to the time the experiment took place, i.e., at the early-life stage of the investigated pavements. Structural deterioration might occur after five to six years or so on [26], when rehabilitation actions normally become an issue for the related authorities. Indeed, from the estimation of the pavements’ damage potential, it was observed that BC failure is kept at limited levels. The predicted alligator cracking percentages are given in Figure 14 for both AC behaviors.
A rough trend of higher percentages predicted through the viscoelastic behavior of AC can be observed. BC data was supplementary subjected to paired t-tests for the three AC temperature groups as described earlier. Again, the differences in the predicted cracking percentages appeared to be statistically significant for very high temperatures (more than 30 °C). At temperatures less than 27 °C, viscoelastic theory is again critical (i.e., higher fatigue cracking percentages), but with negligible differences compared to MLET. Therefore, it seems that the consideration of AC viscoelastic behavior appears to be a more conservative approach in terms of pavement evaluation.
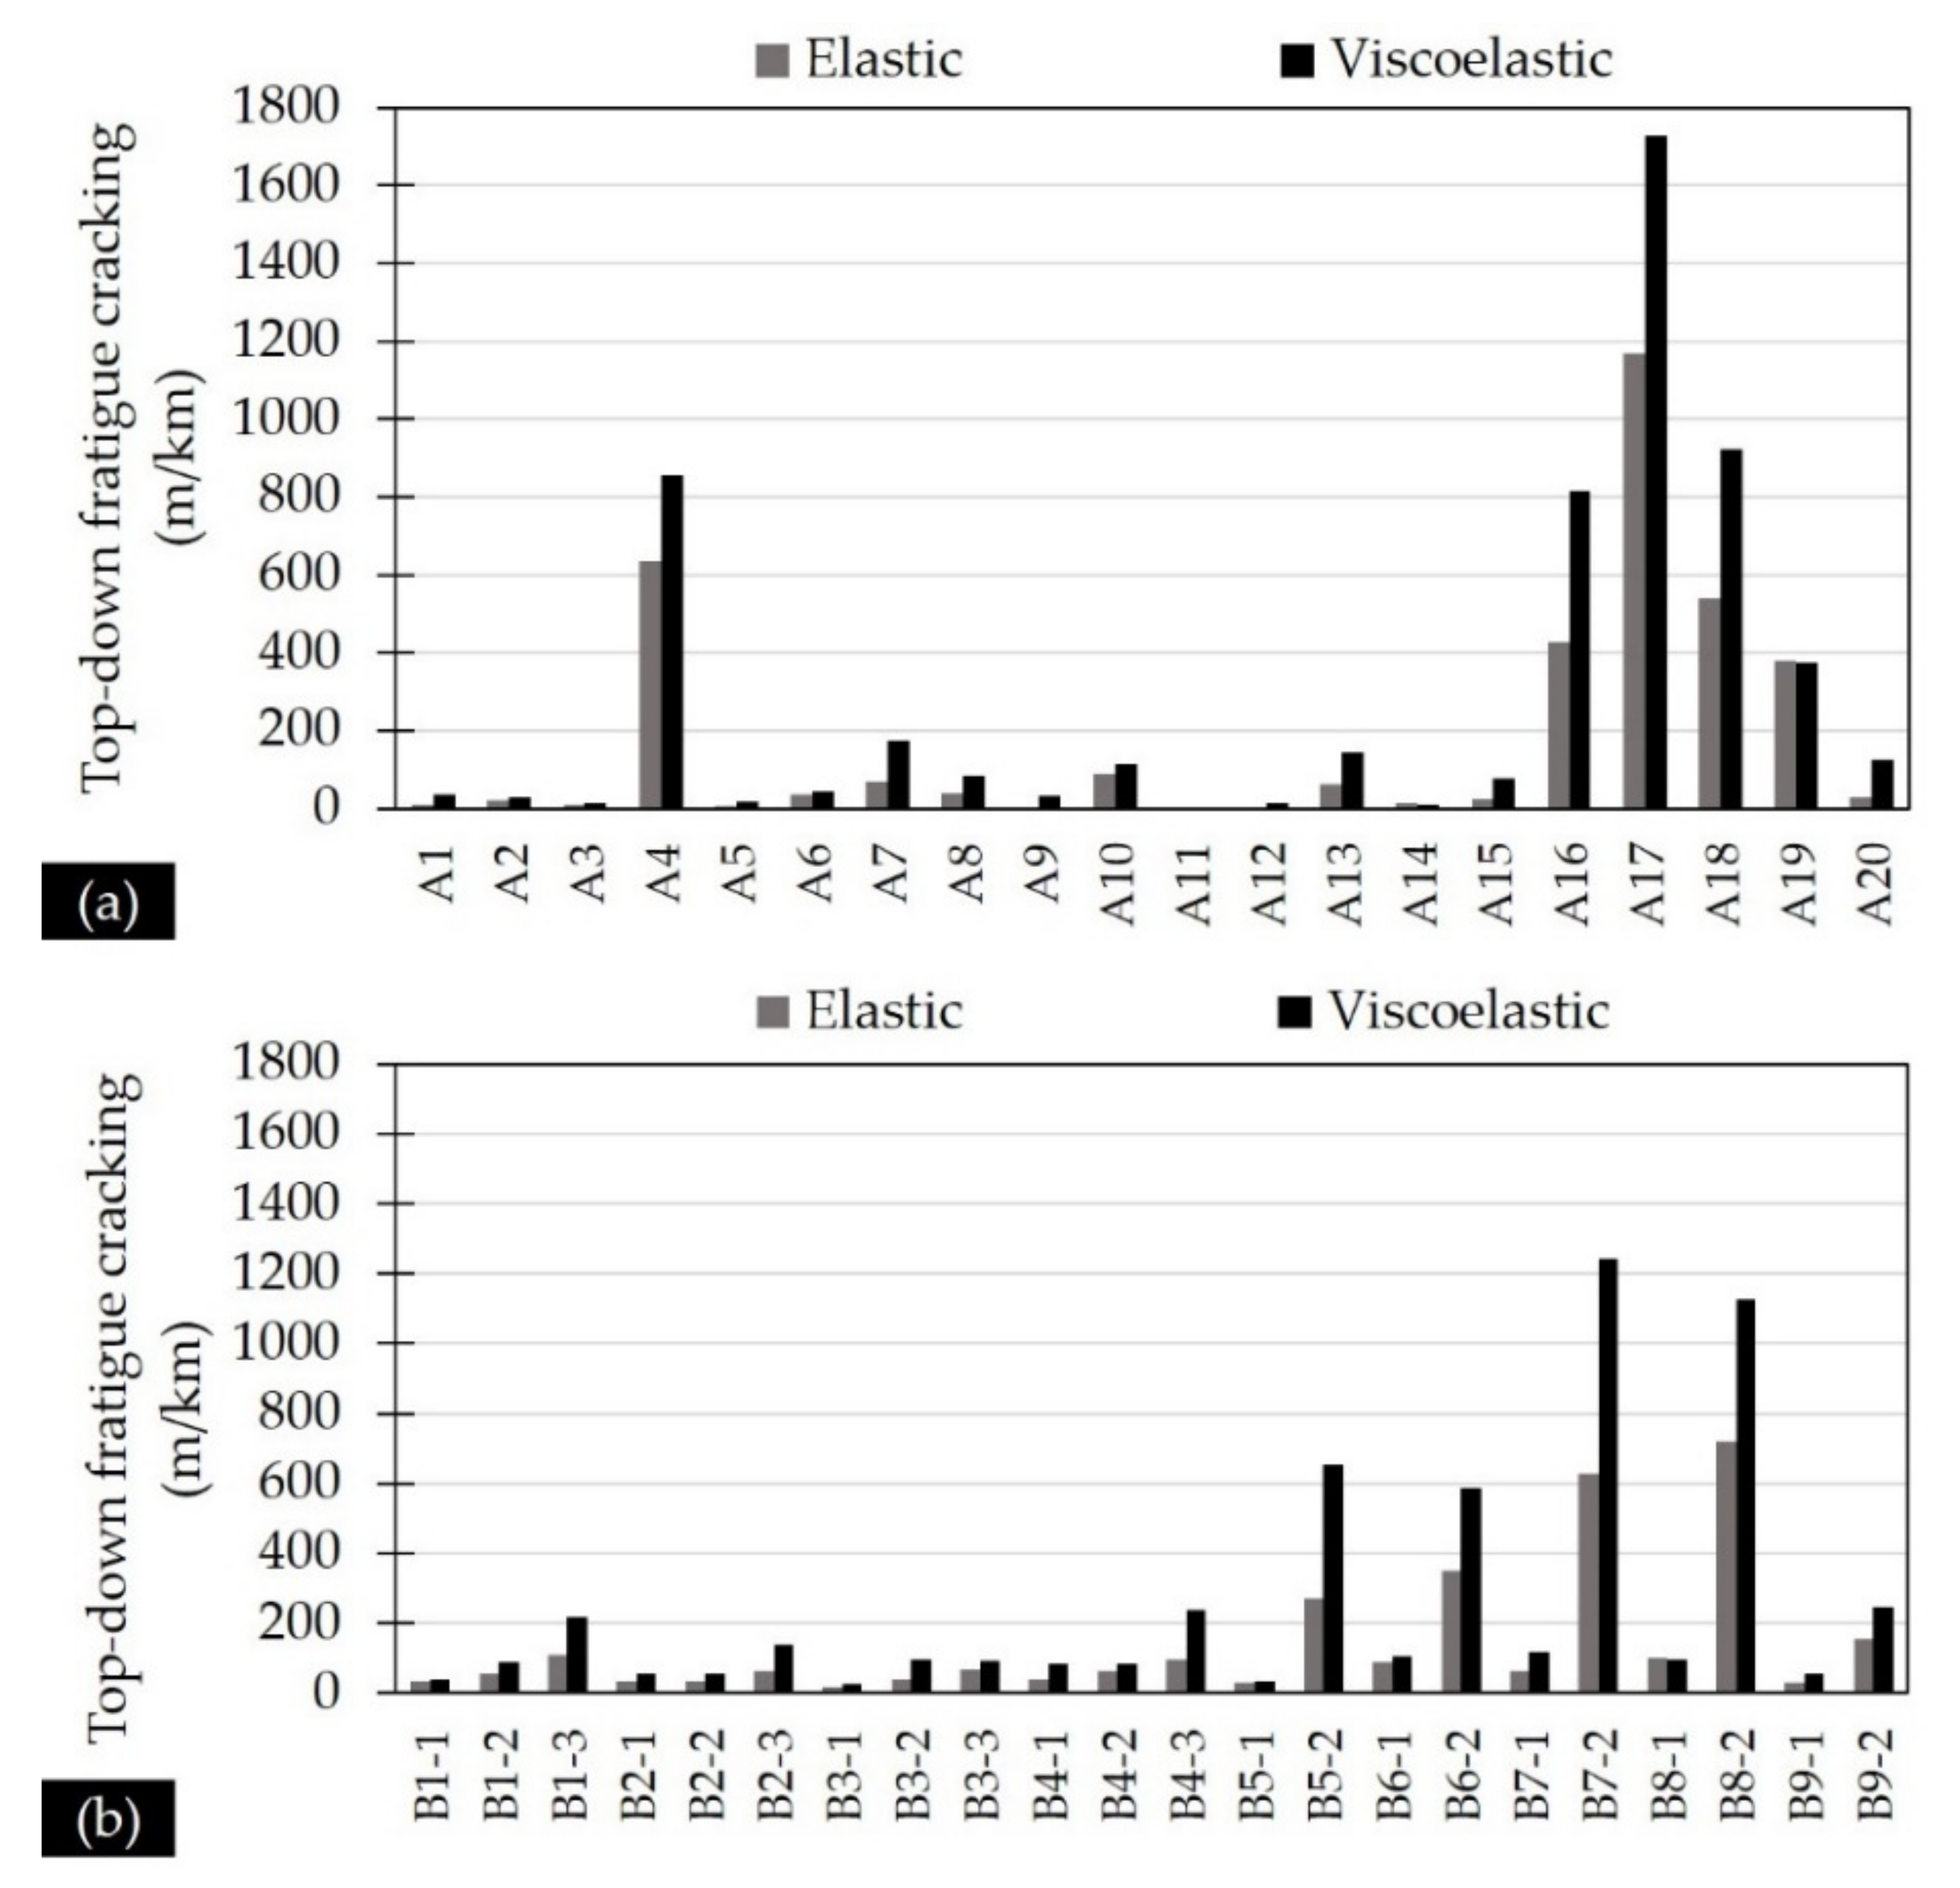
Regarding the TDC potential, Figure 15 shows the predicted percentages of longitudinal cracking for the considered traffic scenario and calculation period. For this failure mode, statistical testing indicated significant differences between the predicted cracking potentials, regardless of the AC temperature classification. AC viscoelastic behavior was again found to be conservative. This is consistent with the higher RMSPE of the strain calculations at zero depth previously noted.
Location A17 rests on poor foundation support and it thus exhibited a substantially different order of magnitude for both failure potentials when compared to the other ones (Figure 15a). In addition, in one of the locations where a considerable TDC potential was predicted (location A4), a longitudinal crack was indeed initiated three years after the experiment took place (Figure 16).
In other words, location A4 provides an indicative example where different assumptions for material characterization can lead to variable predictions for pavement performance evolution that might affect the decision-making process and maintenance planning of highway pavements. From the related findings, it can be stated that viscoelastic analysis appears as a more critical approach in terms of PCA, which supplements the benefits that it can provide during the pavement design process as well.
4. Discussion
In this section, the results of analysis are interpreted from a pavement management and preservation perspective, and potential limitations are also discussed. Pavement analysis encompasses the use of different assumptions for material characterization and several tools that can in turn induce variations in the predicted pavement response and performance. Undoubtedly, novel instrumentation processes in combination with NDT data can give more accurate information about the pavement’s ability to sustain traffic loading [47]. However, although uncertainties in the analysis could be solved through pavement instrumentation, the latter might provide location-specific information and most importantly, it is a laborious process with many challenges related to both equipment installation and data acquisition or interpretation. Nevertheless, the related authorities and pavement engineers should optimally combine existing systems and analysis procedures in order to yield reliable conclusions about pavement condition in the framework of asset preservation.
In this research, the impact of considering different principles for AC characterization on pavement response and performance was revealed as rather important. Increased RMSPE during strain calculations (Figure 11 and Figure 13) proved that pavement engineers face the challenge of non-uniqueness within the calculated pavement responses. The increased RMSPE for strain calculations at the pavement’s surface (i.e., 21 versus 11% for strain calculations at the bottom of AC) highlighted a greater sensitivity of the response analysis at zero depth on the considered assumptions for material characterization. Therefore, the strain differences were further assessed from a statistical perspective to investigate the nature of discrepancies. Indeed, indications for the conservativeness of AC viscoelasticity were in accordance with previous research [15,16,21,48]. Furthermore, both AC fatigue failure modes were assessed based on the generalized NCHRP 1-37A model. However, allowable repetitions were calculated as rather high, especially for the BC mode, which was preliminarily explained because of the pavements’ early age during the experiment. As a result, fatigue cracking percentages were estimated as low. Moreover, at the investigated pavements, the thickness of the AC layers was 18 cm on average (as per Figure 1). This value might provide indications of thick pavement structures that are known to be more vulnerable to TDC rather than BC [37,49]. Indeed, the impact of the utilized assumption for AC materials was found to be more pronounced in the case of TDC analysis because of both the increased RMSPE for strains at the pavement’s surface (Figure 13), as well as the statistically significant differences that were found between the predicted cracking levels for the whole AC temperature spectrum.
From a pavement preservation perspective, crack sealing for longitudinal cracks is the most common measure during surface treatment and proper budget allocation should be planned to timely proceed with that to prevent water infiltration into the pavement body. If roadway authorities become knowledgeable of future pavement performance in due course, they can effectively plan their strategies towards protecting and extending pavement life. This is equally important with bottom-up cracks that are commonly hidden at their early stages, unless it is too late, i.e., alligator cracks are present in the pavement’s surface. Besides, if at one location, top-down cracks interact with bottom-up cracks, then full-depth propagation might occur, which might require severe and costly rehabilitation. In this context, the idea of accurately predicting pavement performance or even obtaining reliable indications that could support pavement preservation strategies becomes predominant within a Pavement Management System (PMS).
From the available data, the authors made a preliminary investigation into the correlation between directly measured quantities in the field (i.e., FWD deflections and deflection indexes) and the predicted fatigue cracking percentages. Deflection indicators are widely popular during pavement monitoring processes and they are normally used for pavement condition benchmarking [50]. Based on Table 4, it seems that TDC potential correlates better to the Surface Curvature Index (SCI), whereas BC potential correlates better to the Base Damage Index (BDI). These findings appear promising for long-term pavement performance, which is normally assessed through analysis of collected data with deflectometric devices such as an FWD.
The demonstrated correlations could contribute to optimal planning of maintenance or minor rehabilitation activities, provided that consistent pavement monitoring with NDT data collection and sample destructive testing (i.e., ground truth data) is performed to activate mechanistic models. Therefore, the presented approach can be further extended by repeating the process for the same pavements at later stages of their service life. Consistent pavement monitoring could allow for better performance modeling to identify black spots that need to undergo additional testing to properly determine the exact intervention time and type.
It should be noted that the need for coring (ground truth data) to support mechanistic analysis appears as a limitation because it is a destructive process and requires road closures and traffic disruptions. These factors might render the related authorities from a systematic execution of viscoelastic analysis. To this end, preliminarily promising results have been reported for calculating the viscoelastic response state based primarily on NDT data and sample coring in an effort to limit coring to the minimum [26]. However, this issue needs further investigation to define optimal space and time intervals for coring during the pavement evaluation process.
5. Conclusions
This research focused on aspects of pavement evaluation in practice, and it strengthened the assumptions that asphalt mixtures strongly influence the outcome of pavement evaluation. Therefore, it may not be a good and reliable practice to continue pavement management and maintenance decision processes based on only one analysis approach. A more holistic view with mechanistic principles is required, considering that the performed analysis usually exhibits financial implications in terms of sustainable maintenance planning.
Although the pavements studied were evaluated in their early-life phase, the importance of selecting appropriate analysis tools and assumptions already at this stage has been shown. In particular, RMSPE values ranging from 11–21% were found for tensile strains at the bottom of the AC and the pavement’s surface. These strains are known to be responsible for alligator and longitudinal cracking, respectively. In turn, statistical assessment of differences in calculated strains and predicted cracking potentials for a wide AC temperature range (i.e., 8–40 °C) further supported the dependency of pavement decision-making on the assumptions made during the analysis. As such, the development of a database and appropriate mechanistic analysis are both essential to consistently interpret pavement condition in the future and evaluate maintenance and rehabilitation needs following a rational decision-making process.
Furthermore, the research has highlighted useful aspects of AC viscoelasticity that might help towards a better management of pavements on secondary or low volume roads. In these cases, the thickness of AC layers is usually low, which means that these roads are more susceptible to classical bottom-up cracking. In addition, secondary or mountain roadways are usually subject to extreme overloaded vehicles in favor of emergent needs (e.g., transport of wind turbine blades), which can accelerate the deterioration of the roadway structure. In this context, pavement preservation appears as a critical engineering aspect for the entire road network that continuously poses new open challenges for pavement engineers.
Author Contributions
Conceptualization, K.G., C.P. and A.L.; Methodology, K.G., C.P. and A.L.; Analysis, K.G.; Writing—original draft preparation, K.G.; Writing—review and editing, K.G., C.P. and A.L. All authors have read and agreed to the published version of the manuscript.
Funding
This research received no external funding.
Data Availability Statement
Not applicable.
Conflicts of Interest
The authors declare no conflict of interest.
References
- Plati, C.; Loizos, A.; Gkyrtis, K. Assessment of modern roadways using non-destructive geophysical surveying techniques. Surv. Geophys. 2020, 41, 395–430. [Google Scholar] [CrossRef]
- Zhao, S.; Al-Qadi, I.L.; Wang, S. Prediction of thin asphalt concrete overlay thickness and density using nonlinear optimization of GPR data. NDT E Int. 2018, 100, 20–30. [Google Scholar] [CrossRef]
- Marecos, V.; Fontul, S.; Antunes, M.L.; Solla, M. Evaluation of a highway pavement using non-destructive tests: Falling Weight Deflectometer and Ground Penetrating Radar. Constr. Build. Mater. 2017, 154, 1164–1172. [Google Scholar] [CrossRef]
- Gkyrtis, K.; Loizos, A.; Plati, C. Integrating pavement sensing data for pavement condition evaluation. Sensors 2021, 21, 3104. [Google Scholar] [CrossRef] [PubMed]
- Rada, G.R.; Perera, R.; Prabhakar, V. Relating Ride Quality and Structural Adequacy for Pavement Rehabilitation/Design Decisions; Report No. FHWAHRT-12-035; Federal Highway Administration: Washington, DC, USA, 2012. [Google Scholar]
- Ruiz, A.; Guevara, J. Sustainable Decision-Making in Road Development: Analysis of Road Preservation Policies. Sustainability 2020, 12, 872. [Google Scholar] [CrossRef] [Green Version]
- De Bortoli, A.; Féraille, A.; Leurent, F. Towards Road Sustainability—Part I: Principles and Holistic Assessment Method for Pavement Maintenance Policies. Sustainability 2022, 14, 1513. [Google Scholar] [CrossRef]
- Pereira, P.; Pais, J. Main flexible pavement and mix design methods in Europe and challenges for the development of an European method. J. Traffic Transp. Eng. 2017, 4, 316–346. [Google Scholar] [CrossRef] [Green Version]
- Tosti, F.; Bianchini Ciampoli, L.; D’Amico, F.; Alani, A.M.; Benedetto, A. An experimental-based model for the assessment of the mechanical properties of road pavements using ground-penetrating radar. Constr. Build. Mater. 2018, 165, 966–974. [Google Scholar] [CrossRef]
- Kavussi, A.; Abbasghorbani, M.; Moghadas-Nejad, F.; Bamdad Ziksari, A. A new method to determine maintenance and repair activities at network level pavement management using falling weight deflectometer. J. Civ. Eng. Manag. 2017, 23, 338–346. [Google Scholar] [CrossRef]
- Plati, C.; Gkyrtis, K.; Loizos, A. Integrating non-destructive testing data to produce asphalt pavement critical strains. Nondestruct. Test. Eval. 2021, 36, 546–570. [Google Scholar] [CrossRef]
- Crook, A.L.; Montgomery, S.R.; Guthrie, W.S. Use of falling weight deflectometer data for network-level flexible pavement management. Transp. Res. Rec. 2012, 2304, 75–85. [Google Scholar] [CrossRef]
- Ahmed, A.; Erlingsson, S. Viscoelastic response modeling of a pavement under moving load. Transp. Res. Procedia 2016, 14, 748–757. [Google Scholar] [CrossRef] [Green Version]
- Shakiba, M.; Gamez, A.; Al-Qadi, I.L.; Little, D.N. Introducing realistic tire-pavement contact stresses into Pavement Analysis using Nonlinear Damage Approach (PANDA). Int. J. Pavement Eng. 2017, 18, 1027–1038. [Google Scholar] [CrossRef]
- Chabot, A.; Chupin, O.; Deloffre, L.; Duhamel, D. ViscoRoute 2.0: A tool for the simulation of moving load effects on asphalt pavement. Road Mater. Pavement Des. 2010, 11, 227–250. [Google Scholar] [CrossRef] [Green Version]
- Mejlun, L.; Judycki, J.; Dolzycki, B. Comparison of elastic and viscoelastic analysis of asphalt pavement at high temperature. Procedia Eng. 2017, 172, 746–753. [Google Scholar] [CrossRef]
- Ban, H.; Im, S.; Kim, Y.-R. Nonlinear viscoelastic approach to model damage-associated performance behavior of asphaltic mixture and pavement structure. Can. J. Civ. Eng. 2013, 40, 313–323. [Google Scholar] [CrossRef]
- Olard, F.; di Benedetto, H. General “2S2P1D” model and relation between the linear viscoelastic behaviors of bituminous binders and mixes. Road Mater. Pavement Des. 2003, 4, 185–224. [Google Scholar]
- Huang, Y.; Liu, Z.; Wang, X.; Li, S. Comparative study on dynamic modulus of asphalt mix with two-point bend and uniaxial compression. In Proceedings of the 4th Chinese-European Workshop on Functional Pavement Design, Delft, The Netherlands, 29 June–1 July 2016; pp. 51–58. [Google Scholar]
- Sirin, O.; Paul, D.K.; Kassem, E. State of the Art Study on Aging of Asphalt Mixtures and Use of Antioxidant Additives. Adv. Civ. Eng. 2018, 2018, 3428961. [Google Scholar] [CrossRef] [Green Version]
- You, T.; Kim, Y.-R.; Rami, K.Z.; Little, D.N. Multiscale Modeling of Asphaltic Pavements: Comparison with Field Performance and Parametric Analysis of Design Variables. J. Transp. Eng. Part B Pavements 2018, 144, 04018012. [Google Scholar] [CrossRef]
- Losa, M.; di Natale, A. Accuracy in predicting viscoelastic response of instrumented asphalt pavements. In Proceedings of the Sustainability, Eco-efficiency and Conservation in Transportation Infrastructure Asset Management, ICTI 2014, Pisa, Italy, 22–25 April 2014; pp. 339–346. [Google Scholar]
- Grellet, D.; Dore, G.; Kerzreho, J.P.; Piau, J.M.; Chabot, A.; Hornych, P. Experimental and theoretical investigation of three dimensional strain occurring near the surface in asphalt concrete layers. In 7th Rilem International Conference on Cracking in Pavements; Springer: New York, NY, USA, 2012; pp. 1017–1027. [Google Scholar]
- Kassem, H.A.; Chehab, G.R.; Najjar, S.S. Quantification of the inherent uncertainty in the relaxation modulus and creep compliance of asphalt mixes. Mech. Time-Depend. Mater. 2018, 22, 331–350. [Google Scholar] [CrossRef]
- Maggiore, C.; Airey, G.; Marsac, P. A dissipated energy comparison to evaluate fatigue resistance using 2-point bending. J. Traffic Transp. Eng. 2014, 1, 49–54. [Google Scholar] [CrossRef] [Green Version]
- Gkyrtis, K.; Loizos, A.; Plati, C. A mechanistic framework for field response assessment of asphalt pavements. Int. J. Pavement Res. Technol. 2021, 14, 174–185. [Google Scholar] [CrossRef]
- NCHRP. Final Report: Guide for Mechanistic-Empirical Design of New and Rehabilitated Pavement Structures; NCHRP 1-37A Project; Transportation Research Board National Council: Washington, DC, USA, 2004. [Google Scholar]
- Maser, K.R. Condition assessment of transportation infrastructure using ground penetrating radar. J. Infrastruct. Syst. 1996, 2, 94–101. [Google Scholar] [CrossRef]
- AASHTO T342-11; Standard Method of Test for Determining Dynamic Modulus of Hot-Mix Asphalt Concrete Mixtures. American Association of State and Highway Transportation Officials: Washington, DC, USA, 2011.
- Bennert, T.; Williams, S.G. Precision of AASHTO TP62-07 for use in mechanistic-empirical pavement design guide for flexible pavements. Transp. Res. Rec. 2009, 2127, 115–126. [Google Scholar] [CrossRef]
- WSDOT. Everseries User’s Guide—Pavement Analysis Computer Software and Case Studies; Washington State Department of Transportation: Washington, DC, USA, 2005. [Google Scholar]
- Tarefder, R.A.; Ahmed, M.U. Consistency and accuracy of selected FWD backcalculation software for computing layer modulus of airport pavements. Int. J. Geotech. Eng. 2013, 7, 21–35. [Google Scholar] [CrossRef]
- Pan, E.; Chen, E.; Alkasawneh, W. Layered flexible pavement studies: Challenges in forward and inverse problems. Int. J. Pavement Res. Technol. 2008, 1, 12–16. [Google Scholar]
- Ulloa, A.; Hajj, E.Y.; Siddhartan, R.; Sebaaly, P.E. Equivalent Loading Frequencies for Dynamic Analysis of Asphalt Pavements. J. Mater. Civ. Eng. 2013, 25, 1162–1170. [Google Scholar] [CrossRef]
- Siddhartan, R.; Krishnamenon, N.; Sebaaly, P. Pavement Response Evaluation Using Finite-Layer Approach. Transp. Res. Rec. 2000, 1709, 43–49. [Google Scholar] [CrossRef]
- Pronk, A.C. Theory of the Four Point Dynamic Bending Test; Research Report; DWW: Wagengouw, The Netherlands, 1996. [Google Scholar]
- Canestrari, F.; Paolo Ingrassia, L. A review of top-down cracking in asphalt pavements: Causes, models, experimental tools and future challenges. J. Traffic Transp. Eng. 2020, 7, 541–572. [Google Scholar] [CrossRef]
- Roque, R.; Zou, J.; Kim, Y.R.; Baek, C.; Thirunavukkarasu, S.; Underwood, B.S.; Guddati, M.N. Top-Down Cracking of Hot-Mix Asphalt Layers: Models for Initiation and Propagation; NCHRP Project 1e42A; NCHRP: Washington, DC, USA, 2010. [Google Scholar]
- Zou, J.; Roque, R. Top-down cracking: Enhanced performance model and improved understanding of mechanisms. J. Assoc. Asph. Paving Technol. 2011, 80, 255–288. [Google Scholar]
- Sun, L.; Wang, G.; Zhang, H.; Liu, L. Initiation and propagation of top-down cracking in asphalt pavement. Appl. Sci. 2018, 8, 774. [Google Scholar] [CrossRef] [Green Version]
- Al-Qadi, I.L.; Elseifi, M.A.; Yoo, P.J.; Dessouky, S.H.; Gibson, N.; Harman, T.; D’Angelo, J.; Petros, K. Accuracy of current complex modulus selection procedure from vehicular load pulse: NCHRP project 1–37a mechanistic-empirical pavement design guide. Transp. Res. Rec. 2008, 2087, 81–90. [Google Scholar] [CrossRef]
- Cheng, H.; Liu, L.; Sun, L.; Li, Y.; Hu, Y. Comparative analysis of strain-pulse-based loading frequencies for three types of asphalt pavements via field tests with moving truck axle loading. Constr. Build. Mater. 2020, 247, 118519. [Google Scholar] [CrossRef]
- Seo, J.; Kim, Y.; Cho, J.; Jeong, S. Estimation of in situ dynamic modulus by using MEPDG dynamic modulus and FWD data at different temperatures. Int. J. Pavement Eng. 2013, 14, 343–353. [Google Scholar] [CrossRef]
- Shell Pavement Design Method, BISAR PC User Manual, Shell International Petroleum; BISAR Co., Ltd.: London, UK, 1998.
- Losa, M.; Bacci, R.; Leandri, P. A statistical model for prediction of critical strains in pavements from deflection measurements. Road Mater. Pavement Des. 2008, 9, 373–396. [Google Scholar] [CrossRef]
- Garcia, G.; Thompson, M.R. Strain and pulse design considerations for extended-life hot-mix asphalt pavement design. Transp. Res. Rec. 2008, 2087, 3–11. [Google Scholar] [CrossRef]
- Braunfelds, J.; Senkans, U.; Skels, P.; Janeliukstis , R.; Salgals, T.; Redka, D.; Lyashuk, I.; Porins, J.; Spolitis, S.; Haritonovs, V.; et al. FBG-Based Sensing for Structural Health Monitoring of Road Infrastructure. J. Sens. 2021, 2021, 8850368. [Google Scholar] [CrossRef]
- Gkyrtis, K.; Armeni, A.; Loizos, A. A mechanistic perspective for airfield pavements evaluation focusing on the asphalt layers’ behaviour. Int. J. Pavement Eng. 2021. [Google Scholar] [CrossRef]
- Uhlmeyer, J.S.; Willoughby, K.; Pierce, L.M.; Mahoney, J.P. Top-down cracking in Washington State asphalt concrete wearing courses. Transp. Res. Rec. 2000, 1730, 110–116. [Google Scholar] [CrossRef]
- Horak, E. Benchmarking the structural condition of flexible pavements with deflection bowl parameters. J. S. Afr. Inst. Civ. Eng. 2008, 50, 2–9. [Google Scholar]
Figure 1.
Typical cross-sections: (a) Pavement A and (b) Pavement B.

Figure 2.
Experimental testing components.

Figure 3.
Range of AC temperature records during FWD measurements at both pavements.

Figure 4.
Research methodology.
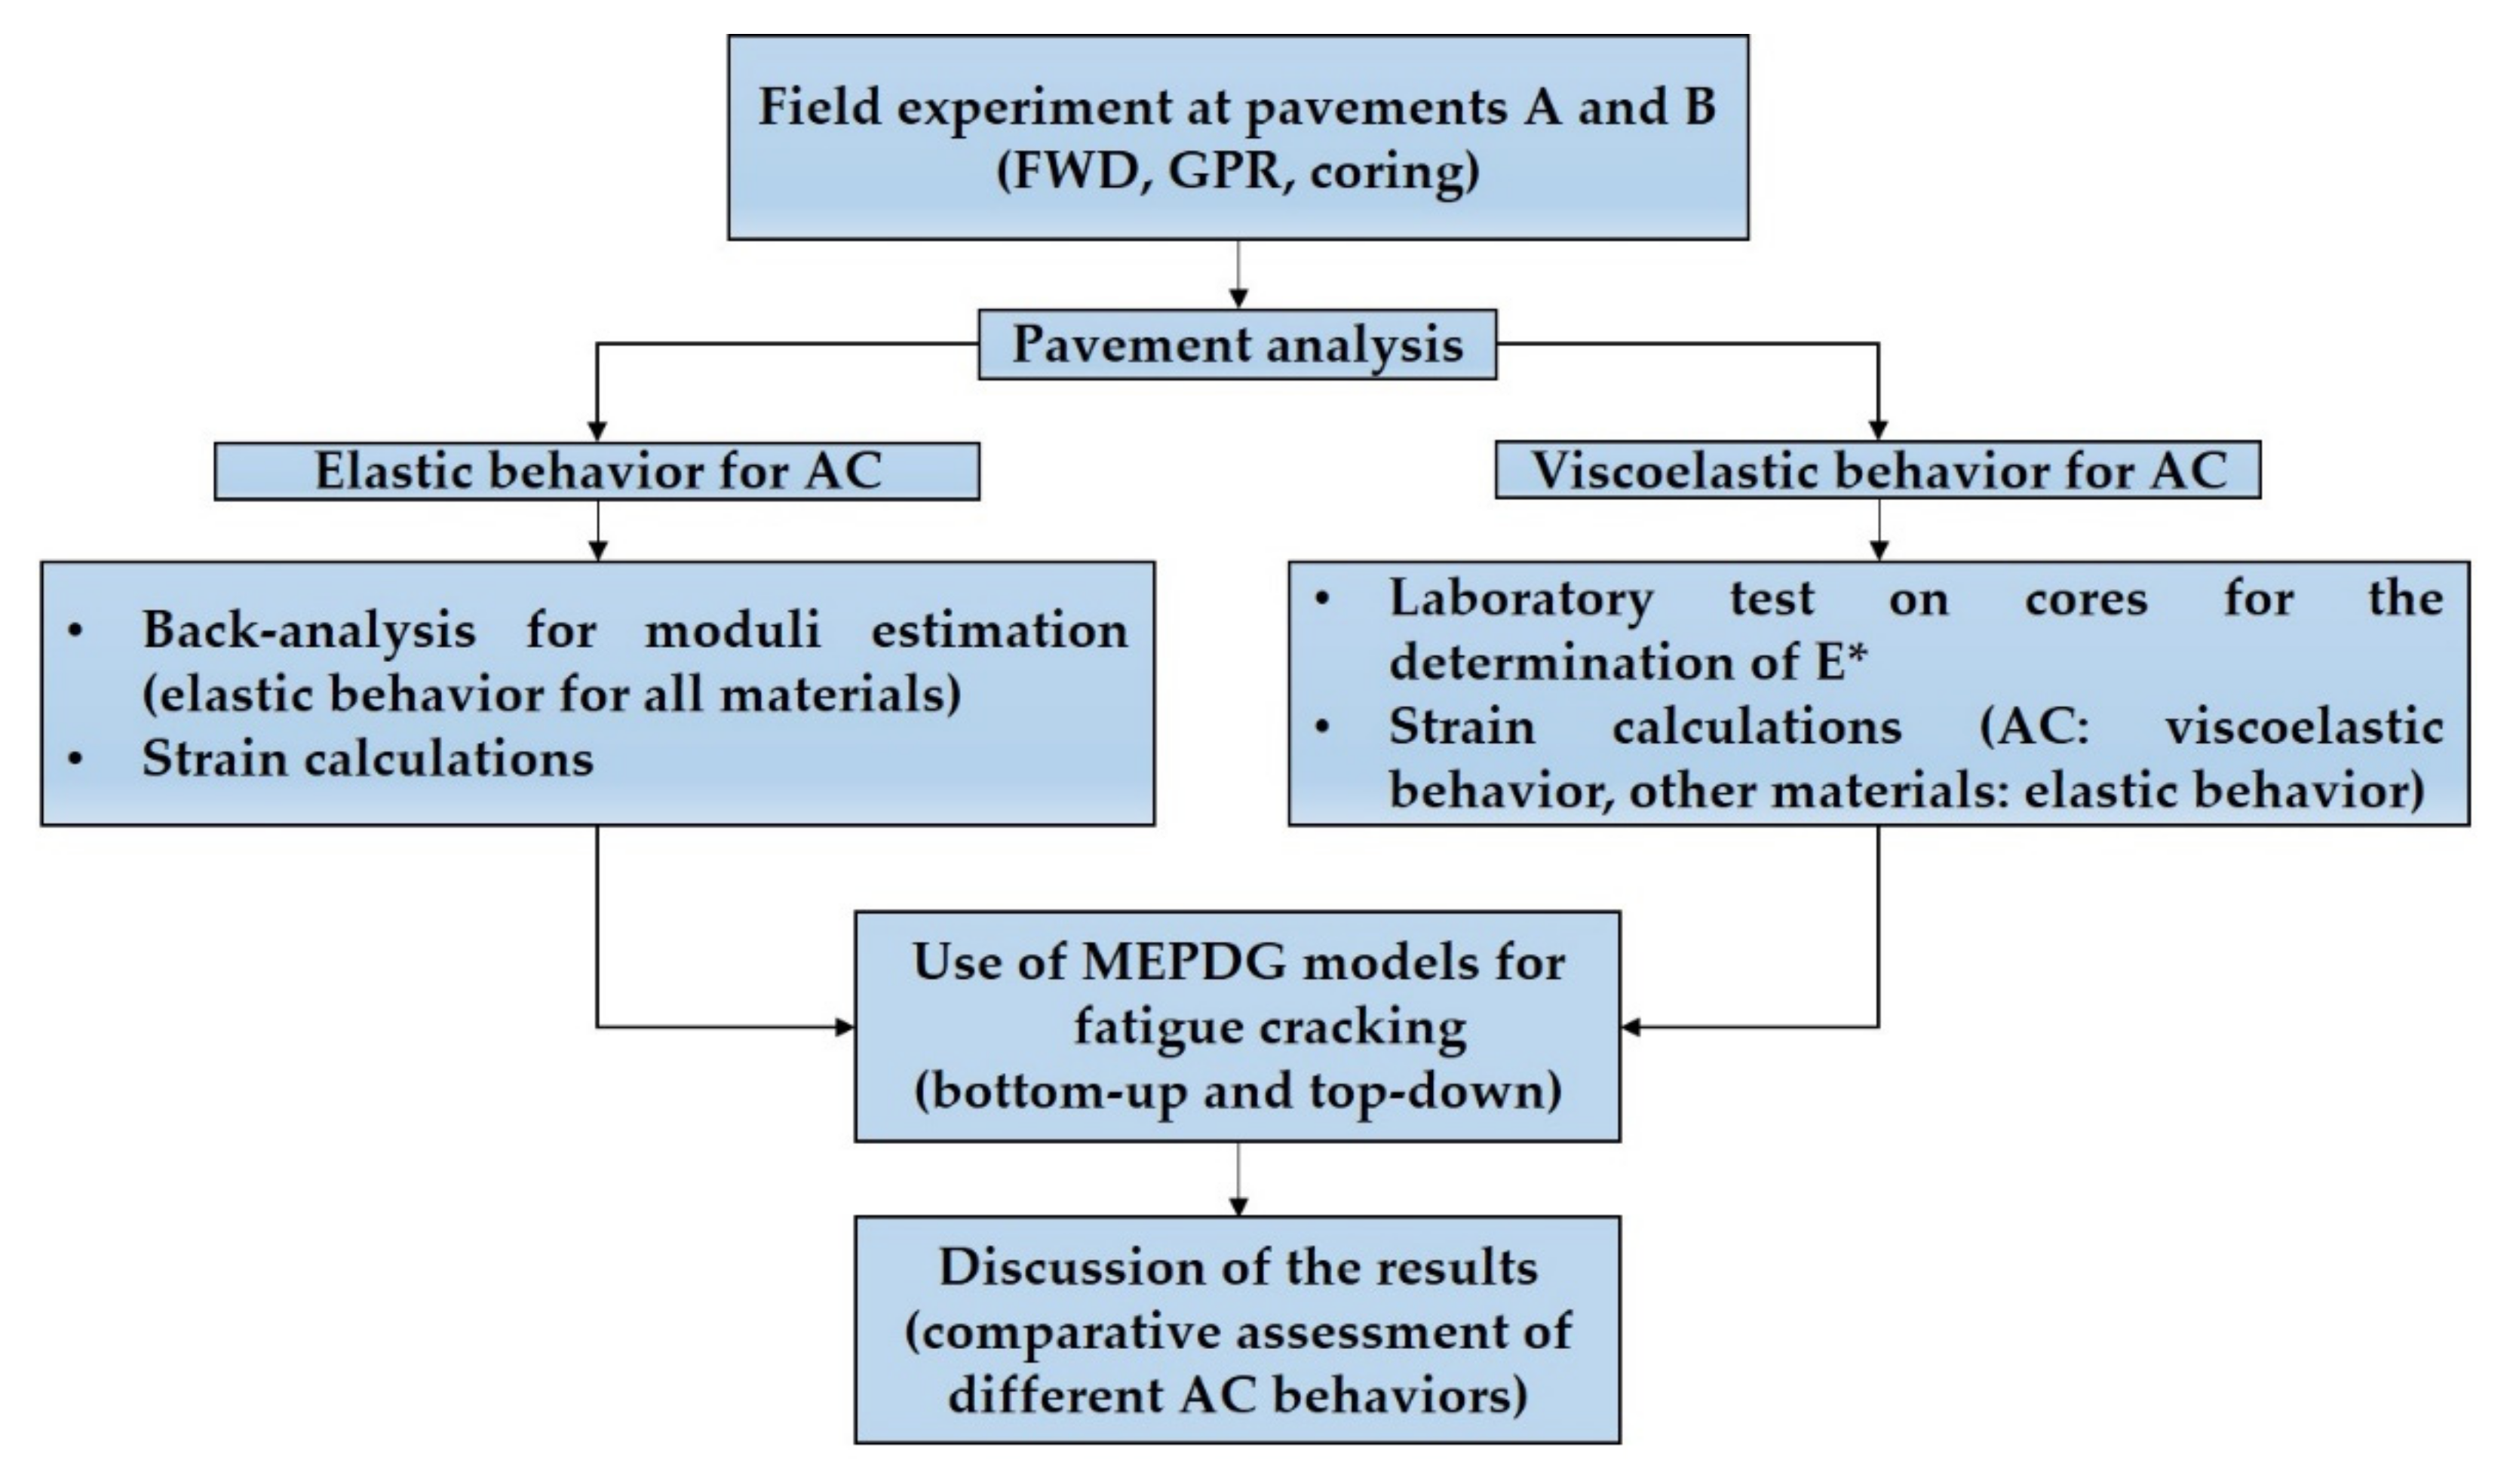
Figure 5.
Huet–Sayegh model representation.

Figure 6.
Example of Huet–Sayegh master curve fit.

Figure 7.
Examples of (a) alligator cracking and (b) longitudinal cracking.

Figure 8.
RMSPE for the back-analysis of layer moduli.

Figure 9.
AC modulus variation against AC temperature for both analysis cases.
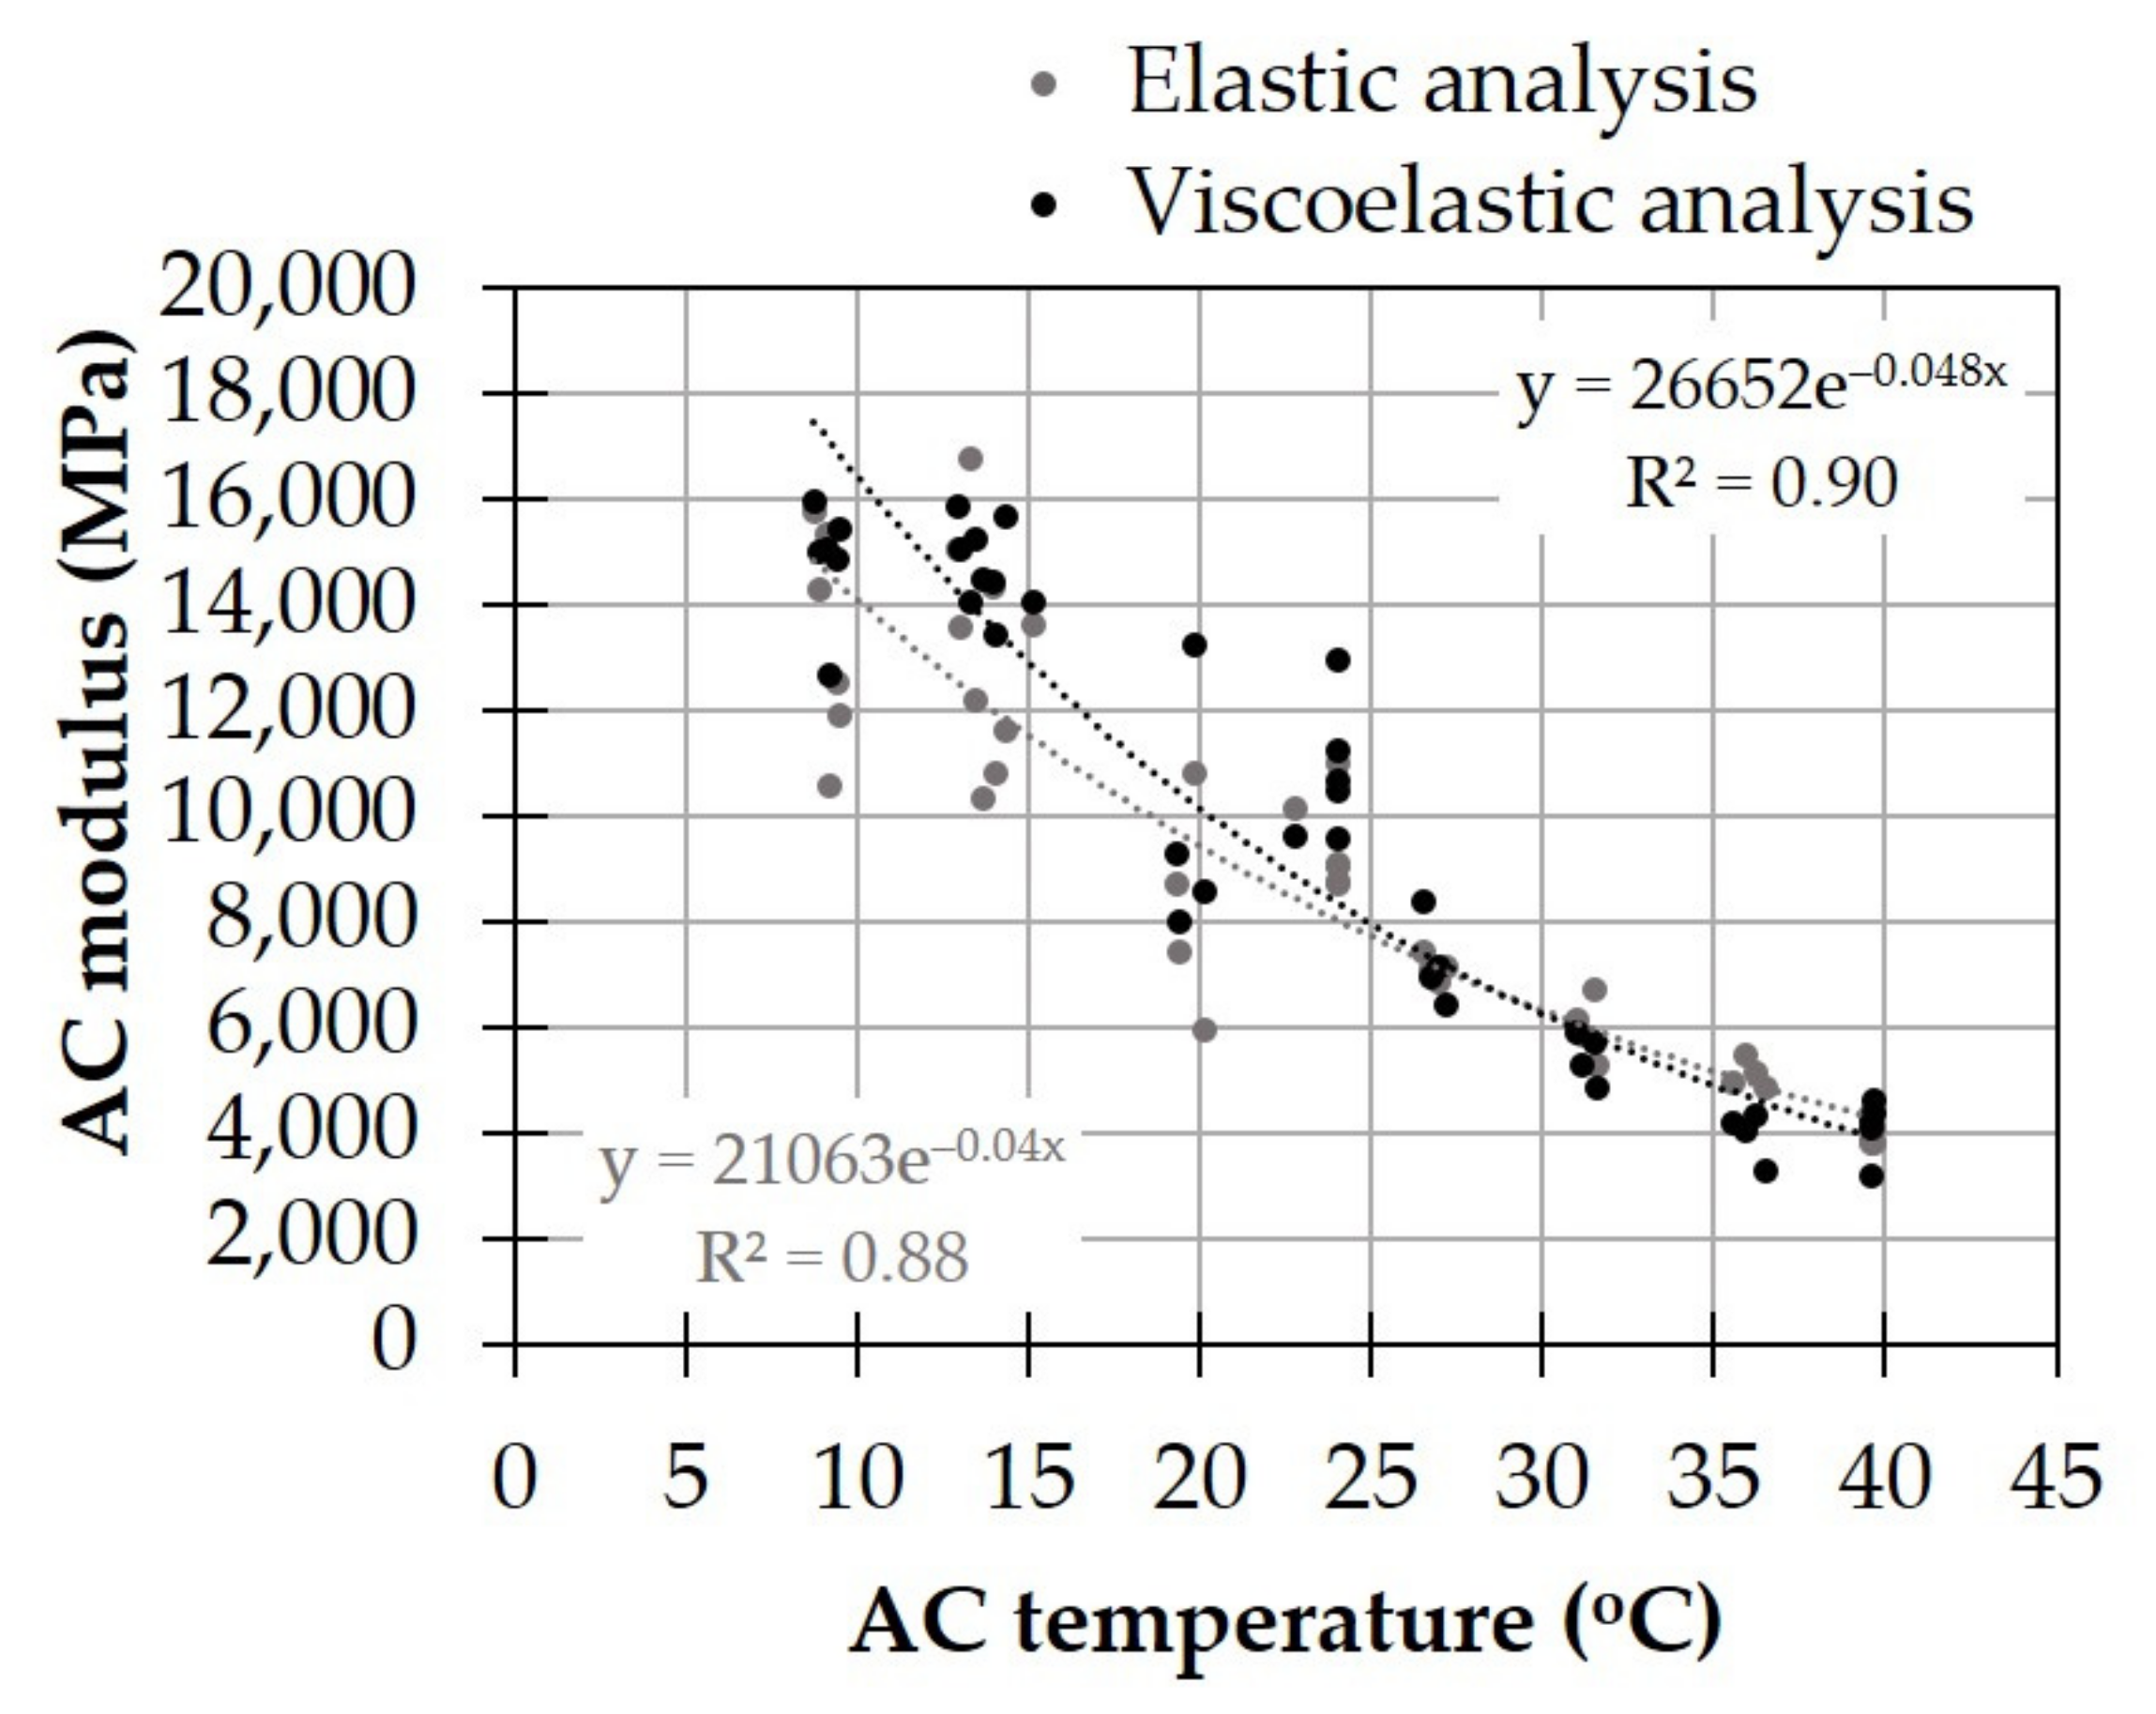
Figure 10.
Strain distribution at the bottom of the AC: (a) longitudinal and (b) transverse strain profile.
Figure 10.
Strain distribution at the bottom of the AC: (a) longitudinal and (b) transverse strain profile.
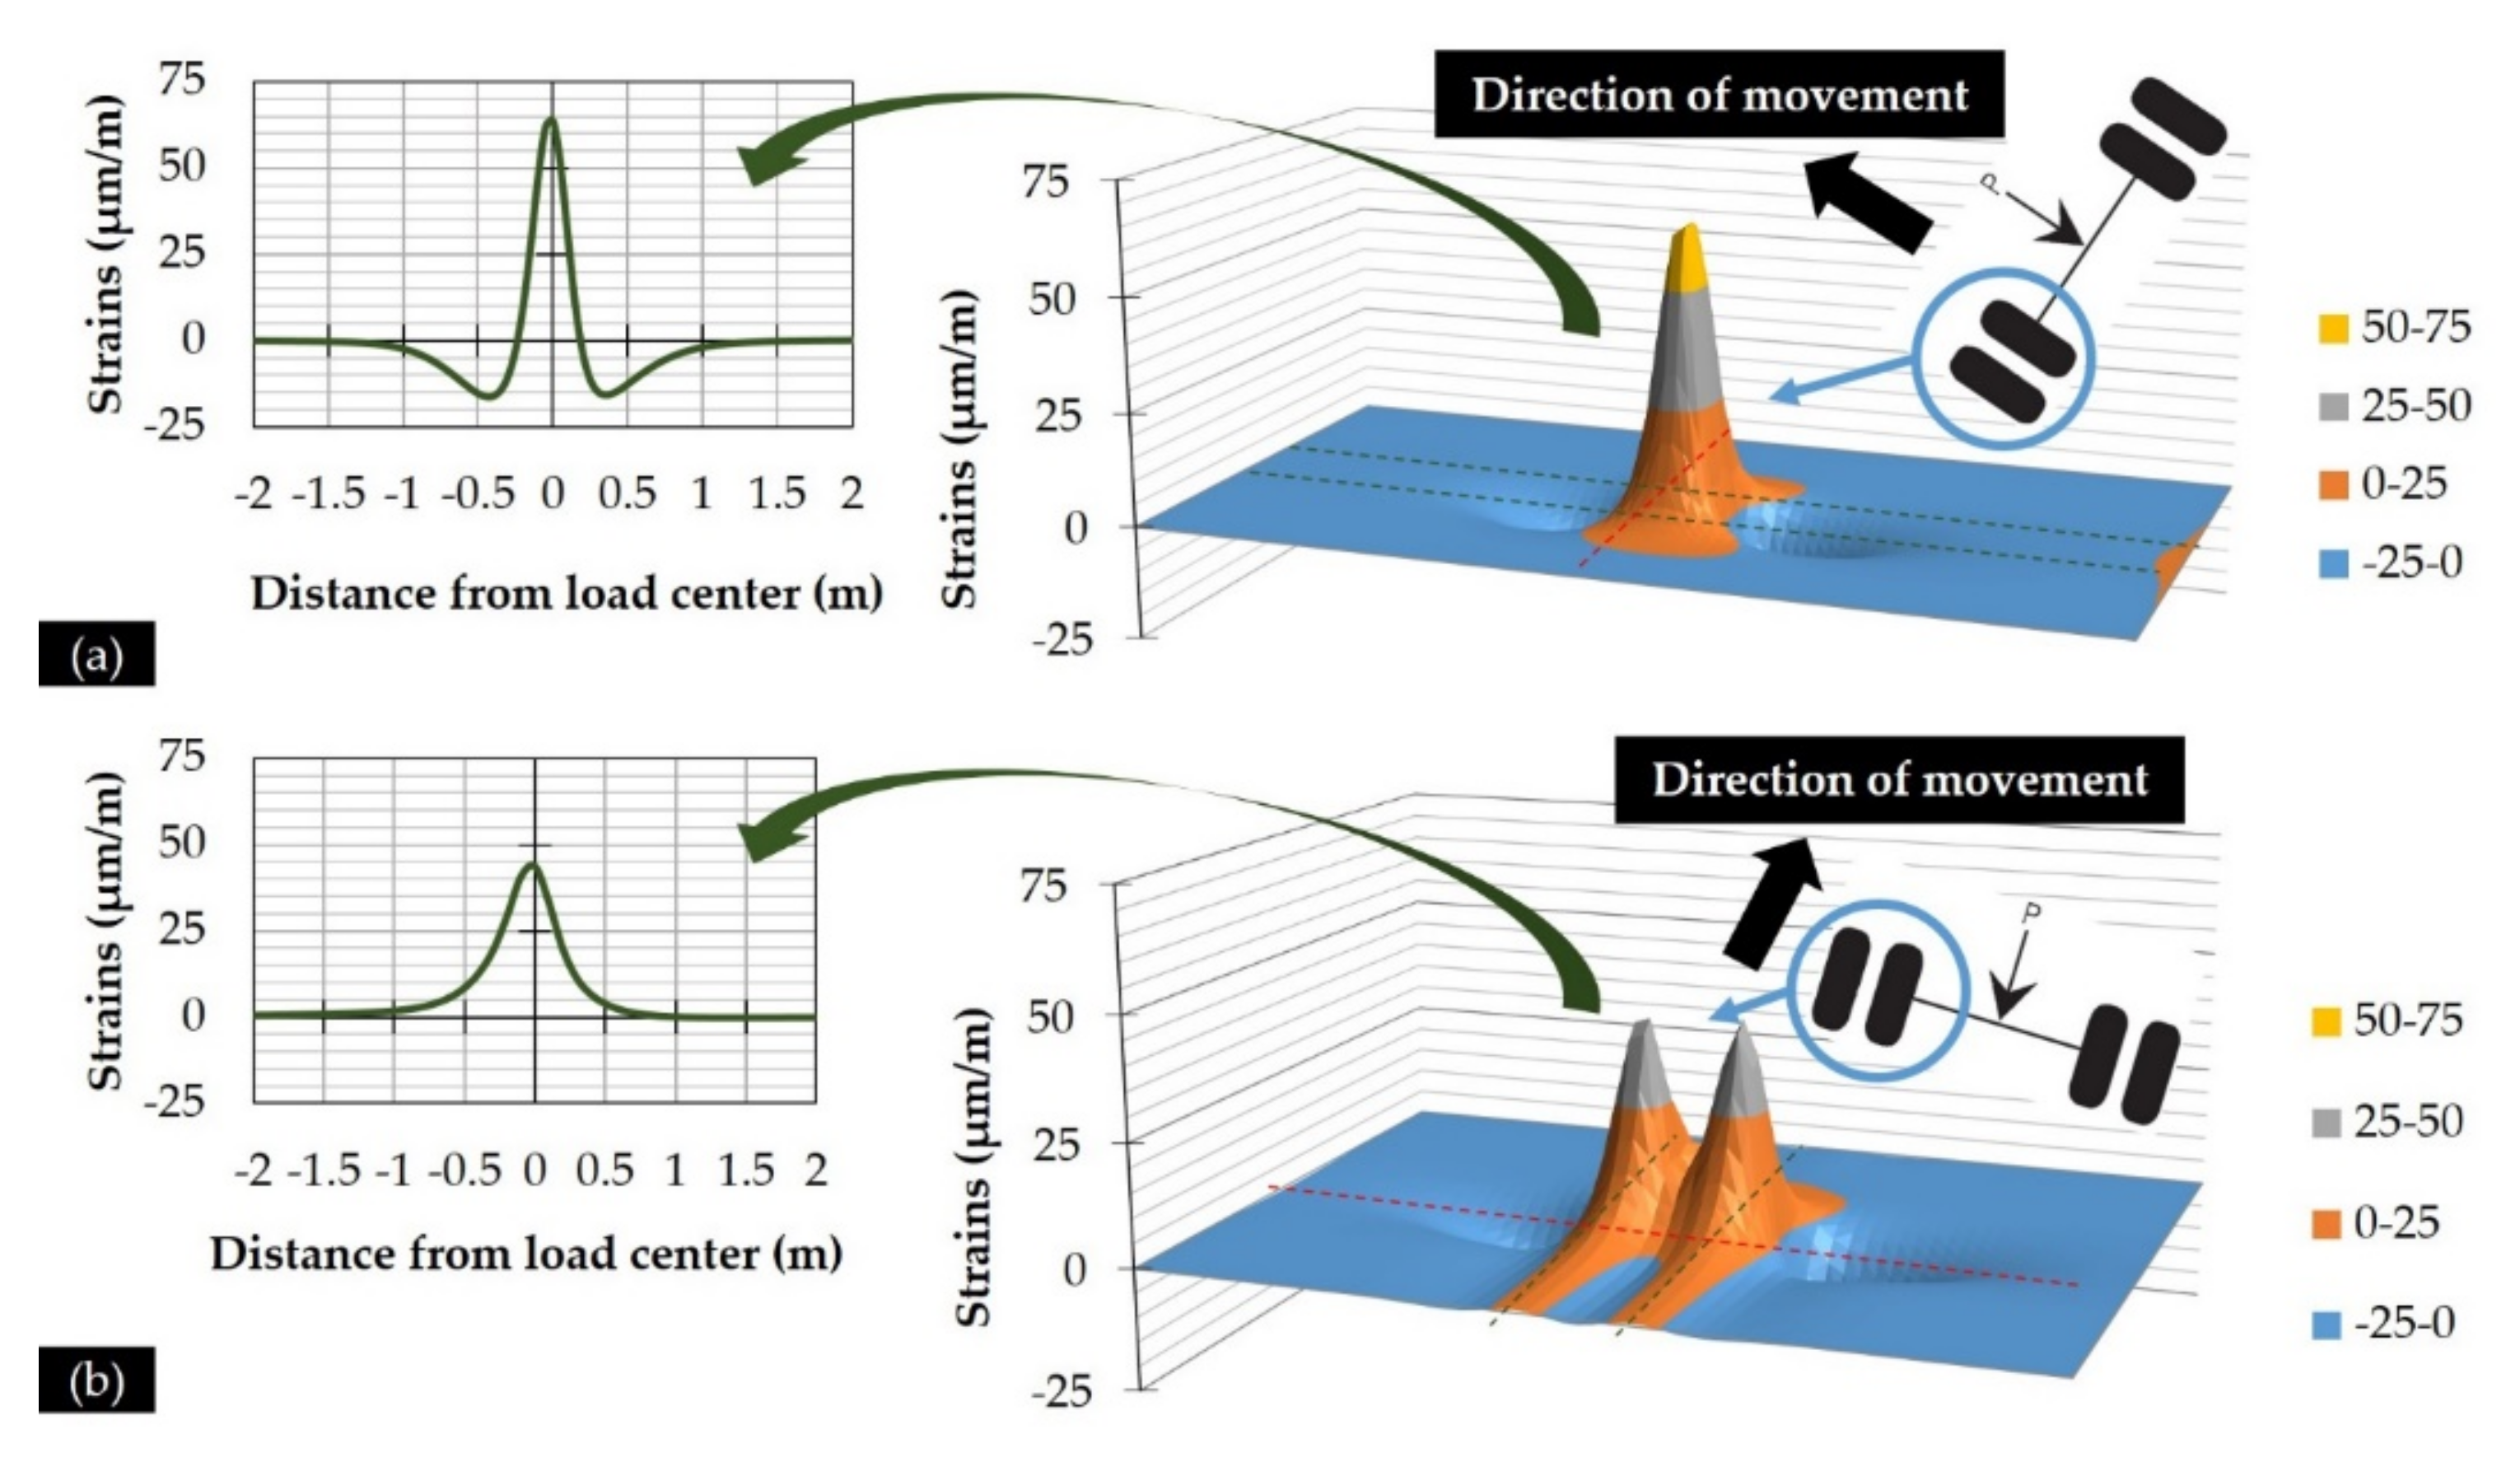
Figure 11.
Comparison of horizontal strains at the bottom of the AC.
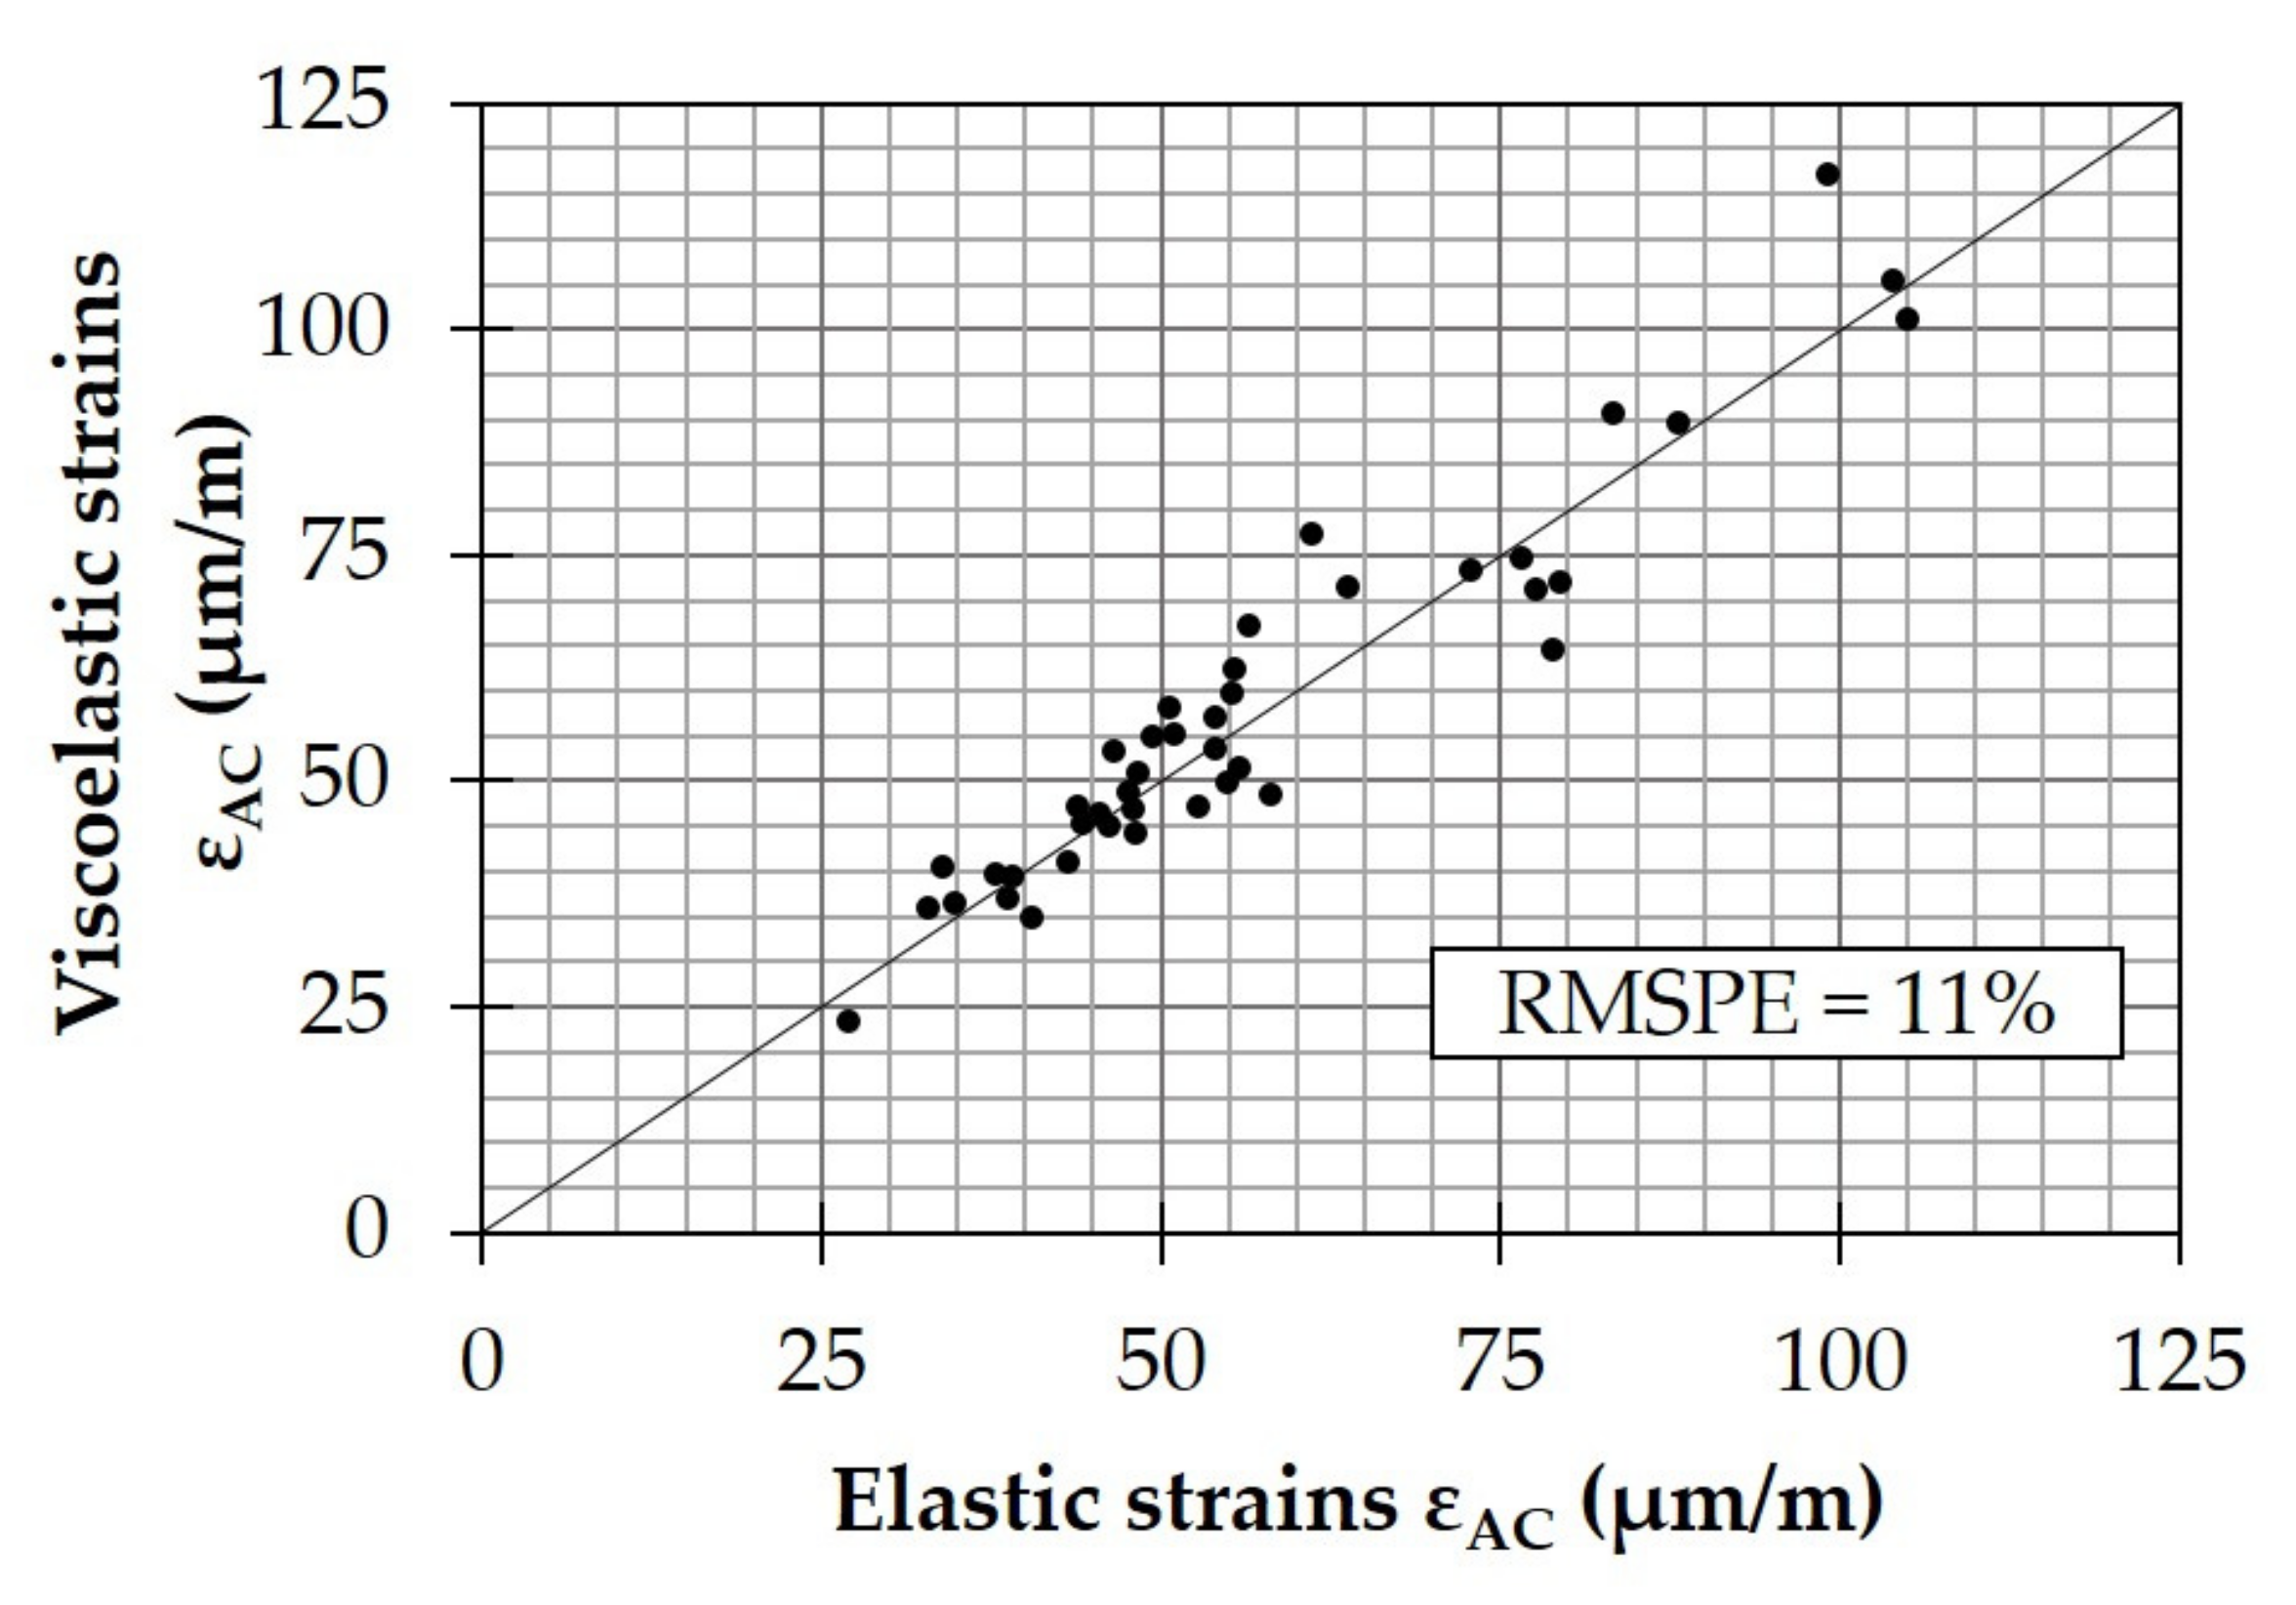
Figure 12.
Strain distribution at the pavement’s surface (zero depth).

Figure 13.
Comparison of horizontal strains at the pavement’s surface (zero depth).

Figure 14.
Alligator cracking prediction (bottom-up fatigue failure) for cross-sections at (a) pavement A and (b) pavement B.
Figure 14.
Alligator cracking prediction (bottom-up fatigue failure) for cross-sections at (a) pavement A and (b) pavement B.

Figure 15.
Longitudinal cracking prediction (top-down fatigue failure) for cross-sections at (a) pavement A and (b) pavement B.
Figure 15.
Longitudinal cracking prediction (top-down fatigue failure) for cross-sections at (a) pavement A and (b) pavement B.

Figure 16.
Longitudinal crack at location A4 three years after the experiment.


Table 1.
Geophone array of the utilized FWD system.
| Geophone | 1 | 2 | 3 | 4 | 5 | 6 | 7 | 8 | 9 |
|---|---|---|---|---|---|---|---|---|---|
| Distance from center (mm) | 0 | 200 | 300 | 450 | 600 | 900 | 1200 | 1500 | 1800 |
Table 2.
Values of thickness parameters for fatigue analysis-factor: Ch.
| Failure Mode | a | b | c | d |
|---|---|---|---|---|
| Bottom-up cracking | 0.000398 | 0.003602 | 11.02 | 3.49 |
| Top-down cracking | 0.001 | 29.844 | 30.544 | 5.7357 |
Table 3.
Paired t-test with 41 degrees of freedom () for the assessment of strain differences.
| Tools (i and j) Used for Moduli Estimation | Strain AC Bottom | Strain at Top of Subgrade | ||
|---|---|---|---|---|
| Null Hypothesis: | Null Hypothesis: | |||
| EVERCALC-BAKFAA | 4.00 | Reject | 1.37 | Accept |
| EVERCALC-BackGenetic3D | −0.04 | Accept | 1.58 | Accept |
| BackGenetic3D-BAKFAA | −4.37 | Reject | −0.77 | Accept |
Table 4.
Correlations (values of R2) between deflection indicators and predicted fatigue cracking.
| Deflection Indicators (Di, Where i Is the Distance from the Loading Center) | Alligator Cracking Prediction (BC Potential) | Longitudinal Cracking Prediction (TDC Potential) | ||
|---|---|---|---|---|
| Elastic AC Behavior | Viscoelastic AC Behavior | Elastic AC Behavior | Viscoelastic AC Behavior | |
| D0 (maximum deflection—μm) | 0.82 | 0.79 | 0.47 | 0.43 |
| SCI = D0–D300 (μm) | 0.46 | 0.43 | 0.66 | 0.52 |
| BDI = D300–D600 (μm) | 0.84 | 0.81 | 0.51 | 0.43 |
| BCI = D600–D900 (μm) | 0.53 | 0.52 | 0.30 | 0.28 |
| D900–D1200 (μm) | 0.23 | 0.24 | 0.23 | 0.24 |
| D1800 (outermost deflection—μm) | 0.03 | 0.01 | 0.10 | 0.02 |
Publisher’s Note: MDPI stays neutral with regard to jurisdictional claims in published maps and institutional affiliations. |
© 2022 by the authors. Licensee MDPI, Basel, Switzerland. This article is an open access article distributed under the terms and conditions of the Creative Commons Attribution (CC BY) license (https://creativecommons.org/licenses/by/4.0/).
Share and Cite
MDPI and ACS Style
Gkyrtis, K.; Plati, C.; Loizos, A. Mechanistic Analysis of Asphalt Pavements in Support of Pavement Preservation Decision-Making. Infrastructures 2022, 7, 61. https://doi.org/10.3390/infrastructures7050061
AMA Style
Gkyrtis K, Plati C, Loizos A. Mechanistic Analysis of Asphalt Pavements in Support of Pavement Preservation Decision-Making. Infrastructures. 2022; 7(5):61. https://doi.org/10.3390/infrastructures7050061
Chicago/Turabian StyleGkyrtis, Konstantinos, Christina Plati, and Andreas Loizos. 2022. "Mechanistic Analysis of Asphalt Pavements in Support of Pavement Preservation Decision-Making" Infrastructures 7, no. 5: 61. https://doi.org/10.3390/infrastructures7050061