

Probability of Risk Factors Affecting Small-Scale LNG Supply Chain Activities in the Indonesian Archipelago

 ,
,
Abstract
:1. Introduction
2. Theoretical Study
2.1. Small-Scale LNG Supply Chain
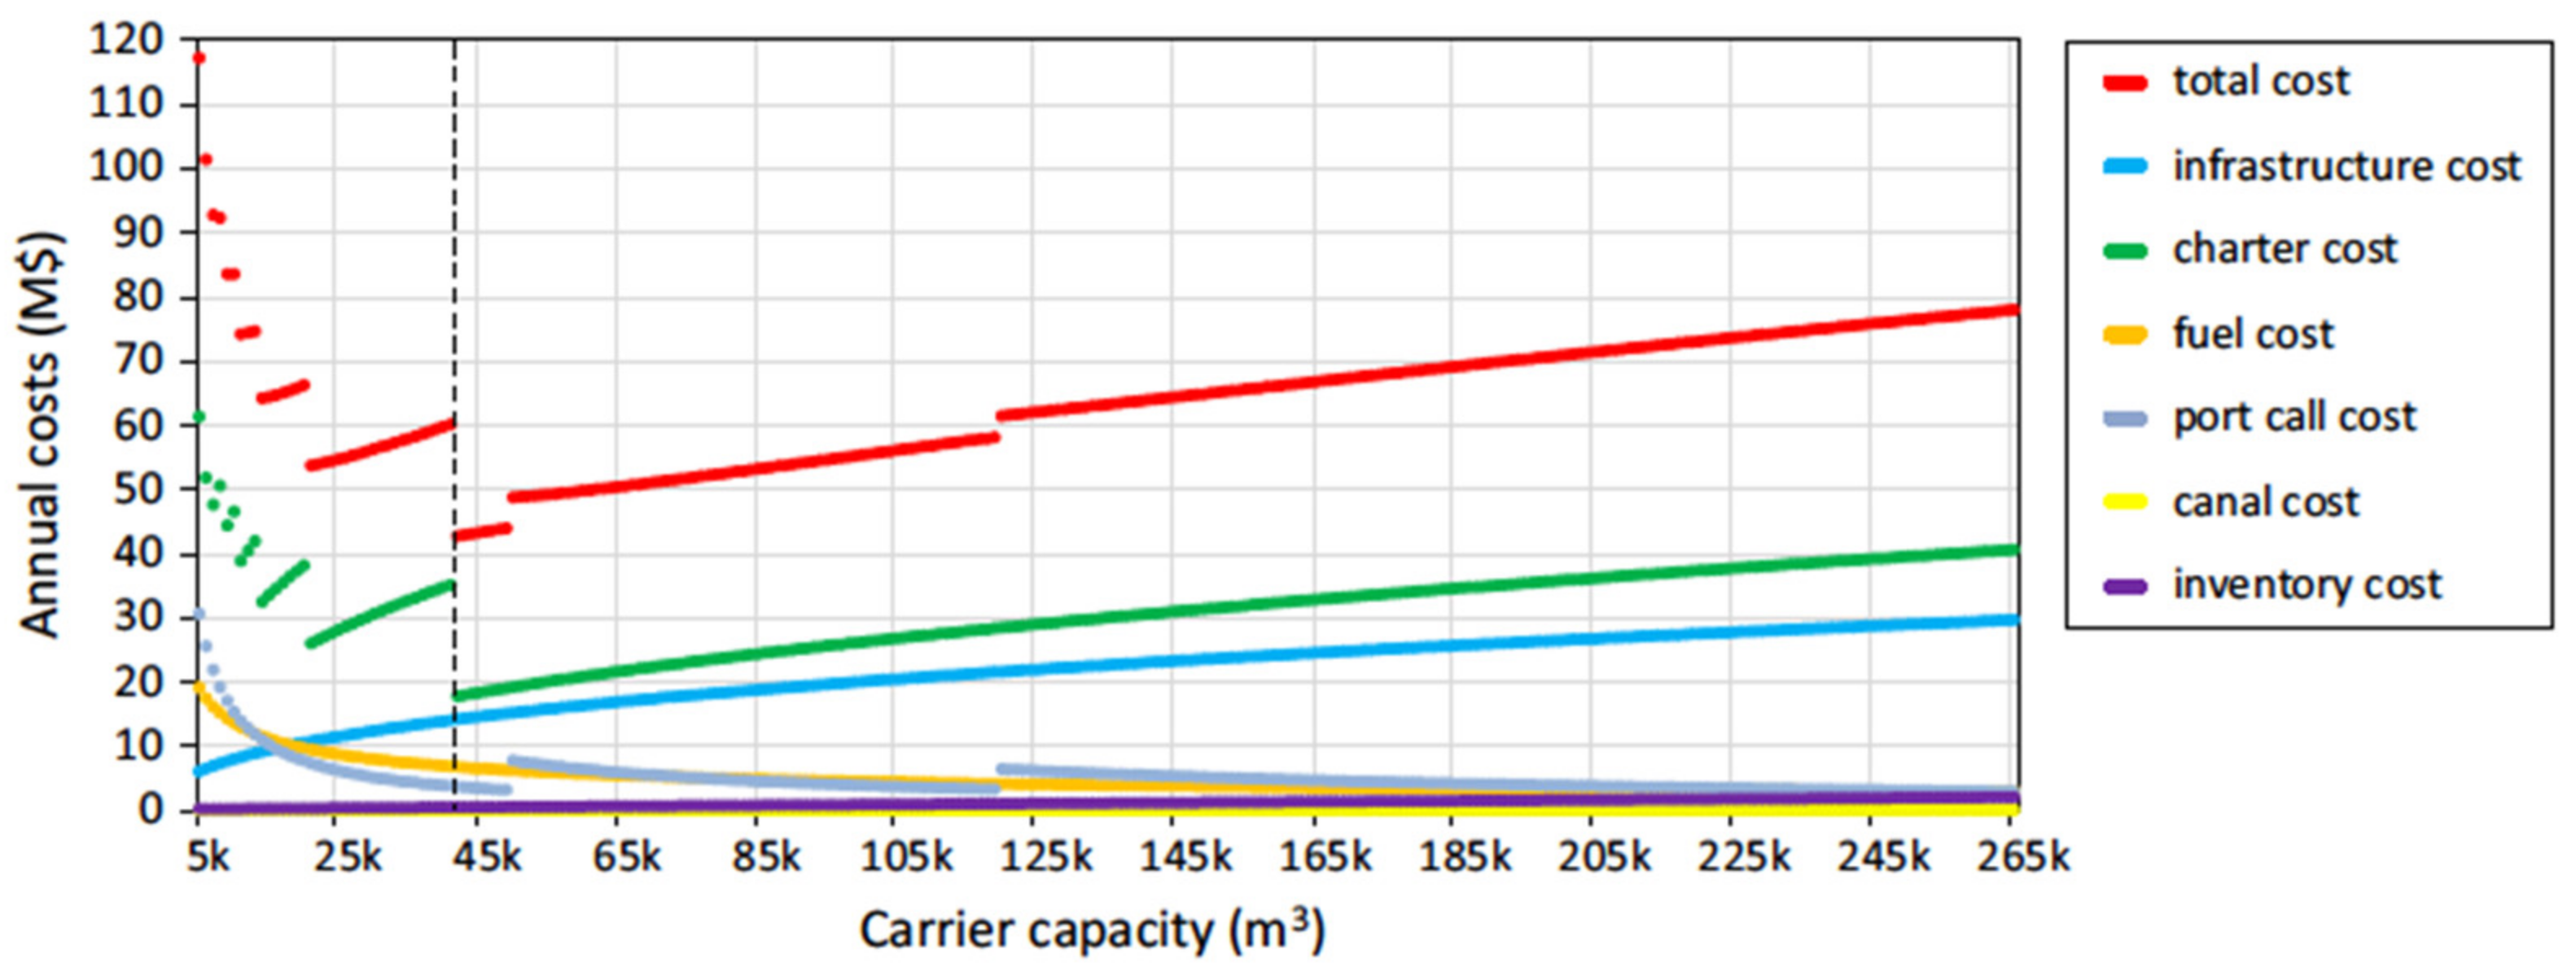
2.2. Risk and Cost
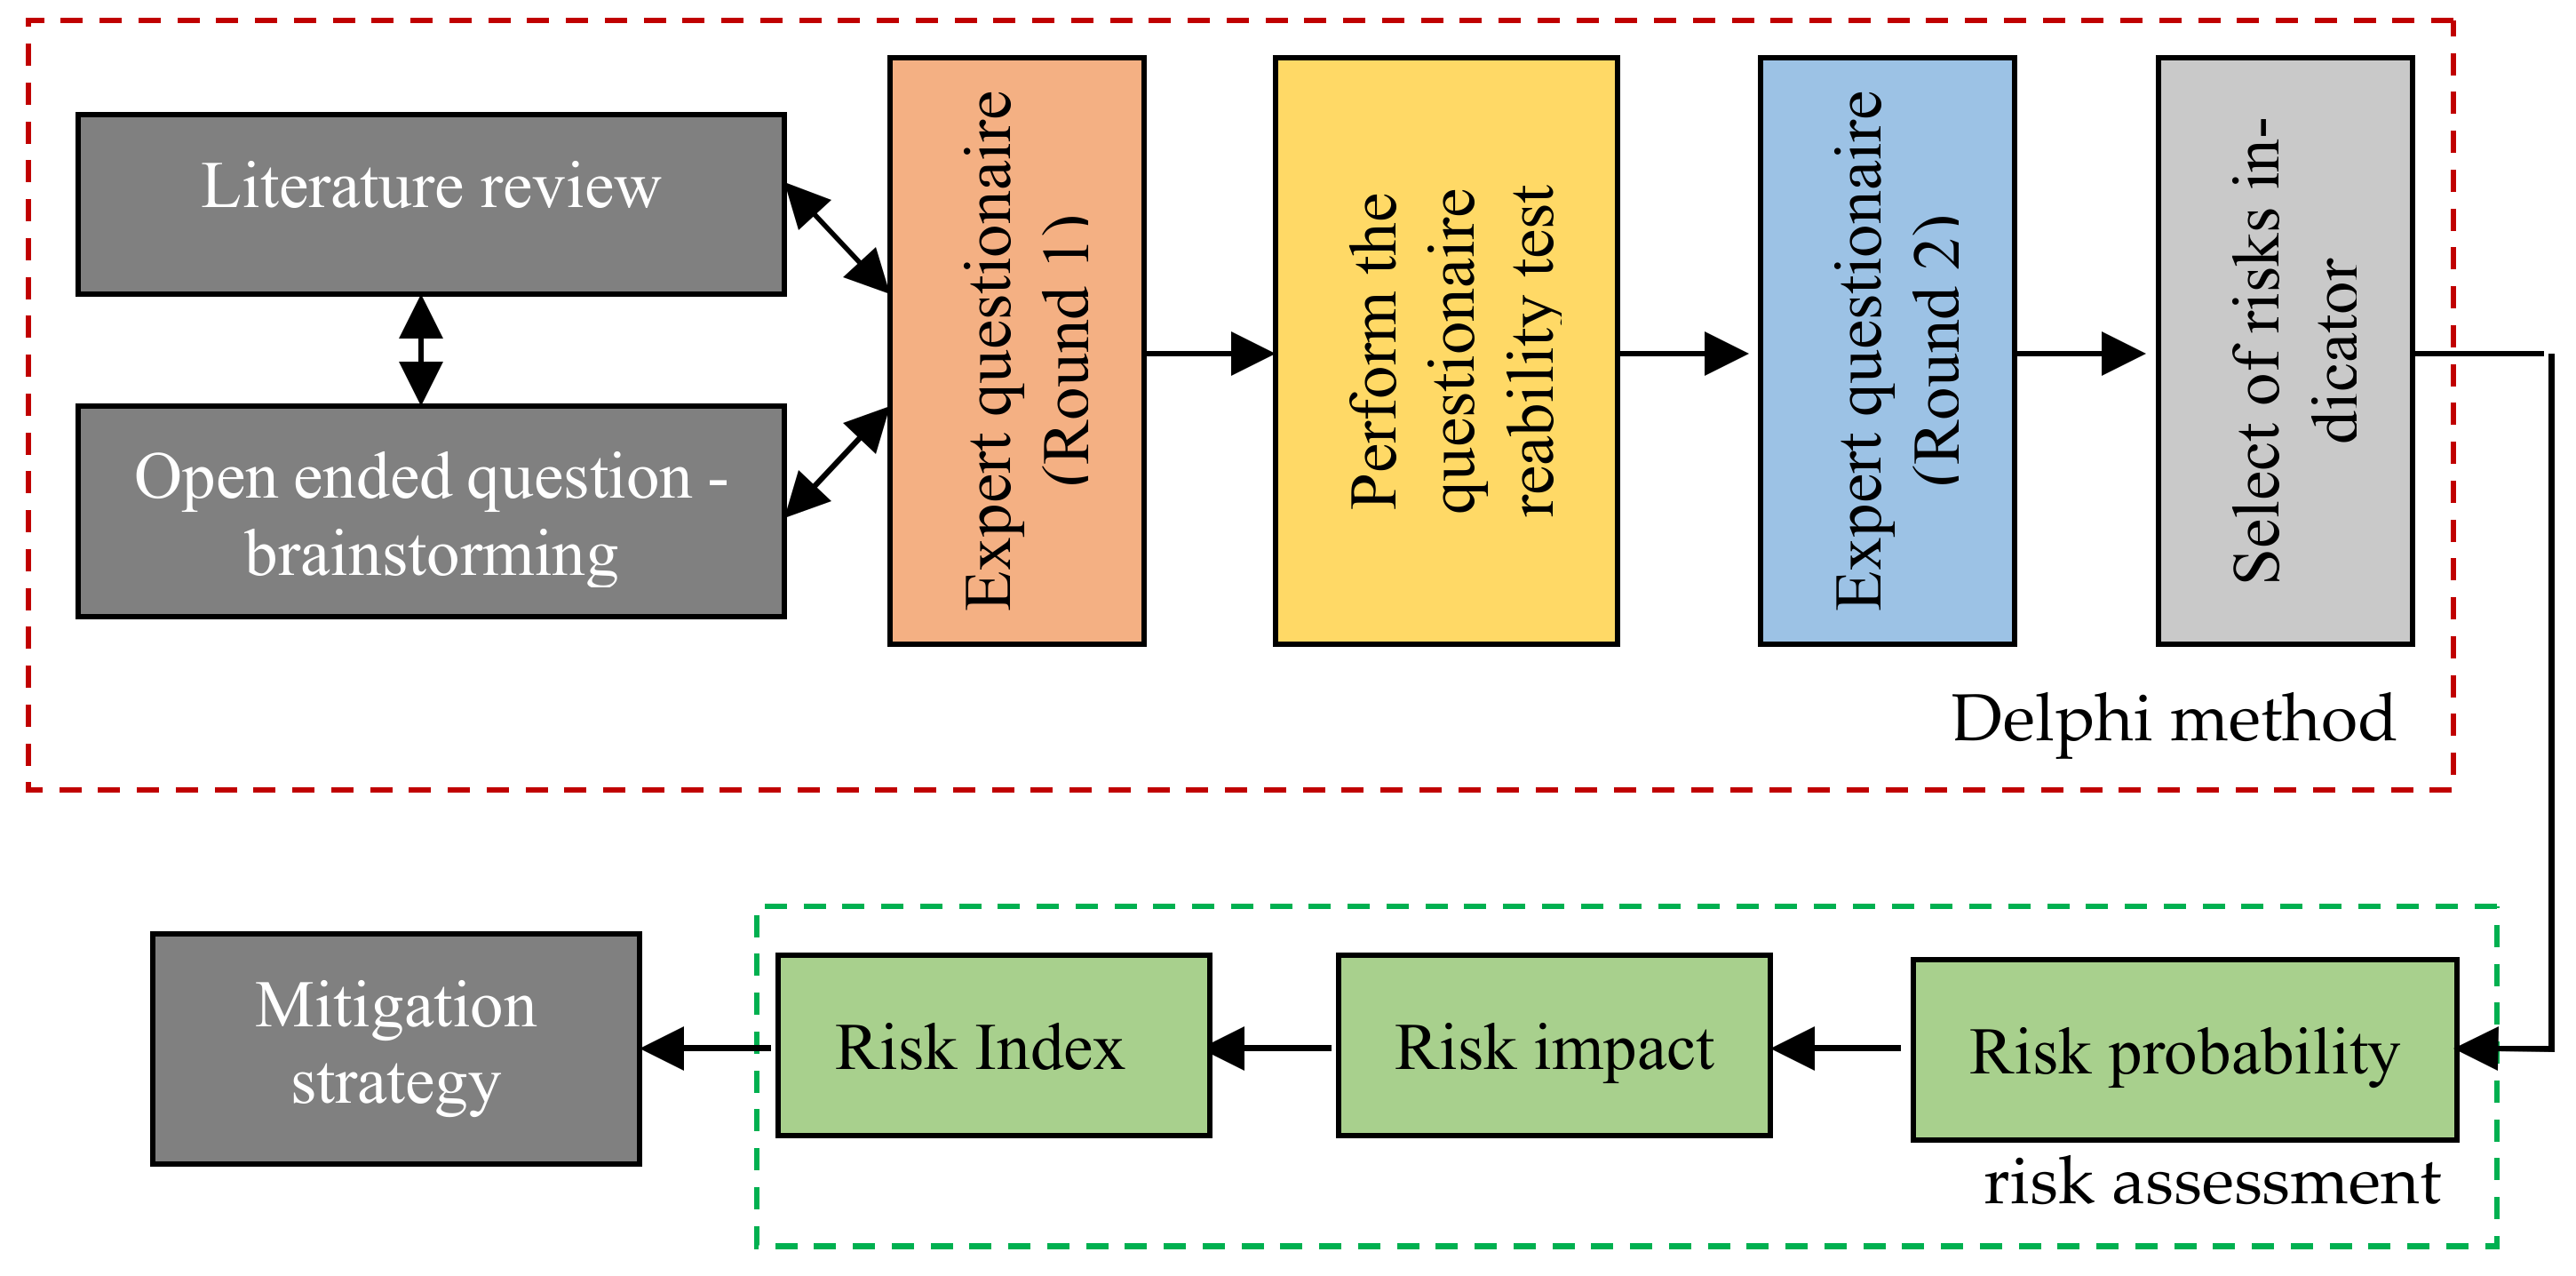
3. Methods
- Practitioner Experts: (1) have at least 5 yrs of work experience and (2) occupy a managerial position in the supply chain sector for at least 5 yrs with a good reputation;
- Academic Experts: (1) have education and knowledge supporting a minimum academic level of bachelor S1 and (2) have at least 10 yrs of teaching experience with a good reputation.
4. Results
4.1. Validity and Reliability Test
4.2. Determination of Risk Indicators Based on Expert Validation
4.3. Probability and Impact of Risk Indicators
4.4. SS-LNG Supply Chain Risk Index
4.5. Discussion and Mitigation Strategies
Agree, special risks frequently arise on ships, in old berths, or when ships are not docked. So that often happens, and our ship explodes with steam. If there is a shortage of transport ships, it is actually because the ships are damaged, so it is as if there is a shortage of ships. But that can be mitigated in the scheduling of cargo when dry dock occurs; when it has to be replaced with another ship only if the case is due to an accident so that a replacement ship is needed, it is difficult to mitigate. What can still be mitigated is the shortage of transport vessels, in the sense that there is a significant increase in demand or there is a supply chain failure at PLN, for example:
“Head of Commercial Division of Mid-stream LNG Company.”
5. Conclusions
Author Contributions
Funding
Data Availability Statement
Conflicts of Interest
References
- Legal Information Section–Ditama Binbangkum, The Ministry of Energy and Mineral Resources Asks PLN to Be More Efficient in Providing Electricity. Available online: https://jdih.bpk.go.id/ (accessed on 20 June 2021).
- Minister of Energy and Mineral Resources. Handbook of Energy & Economy Statistics of Indonesia 2020; Minister of Energy and Mineral Resources of the Republic of Indonesia: Jakarta, Indonesia, 2020. Available online: https://www.esdm.go.id/en/publication/handbook-of-energy-economic-statistics-of-indonesia-heesi (accessed on 2 December 2021).
- Indrawan, R. PLN Requested Efficient, Pursue BPP Target 1,334.4 per kWh. Available online: https://www.dunia-energi.com/pln-diminta-efisien-kejar-target-bpp-1-3344-per-kwh/ (accessed on 23 February 2021).
- No: 55K/20/MEM/2019; Concerning the Amount of Cost of Provision of PT PLN (Persero) in 2018. Minister of Energy and Mineral Resources of the Republic of Indonesia: Jakarta, Indonesia, 2019.
- No: 1772K/20/MEM/2018; Concerning the Amount of Cost of Providing Power of PT PLN (Persero) Plants in 2017. Decree of the Minister of Energy and Mineral Resources of the Republic of Indonesia. Minister of Energy and Mineral Resources of the Republic of Indonesia: Jakarta, Indonesia, 2018. Available online: http://jdih.esdm.go.id/peraturan/Kepmen-esdm-1772-Thn2018.pdf (accessed on 5 June 2021).
- No: 1404K/20/MEM/2017; Concerning the Amount of Cost of Providing Power of PT PLN (Persero). Minister of Energy and Mineral Resources of the Republic of Indonesia: Jakarta, Indonesia, 2016. Available online: https://jdih.esdm.go.id/peraturan/Kepmen-esdm-1404-Th2017.pdf (accessed on 21 August 2020).
- National Energy Balance Review Report 2019; Secretariat General of the National Energy Council: Jakarta, Indonesia, 2019.
- Electricity Statistics 2019; Secretariat General of Electricity: Jakarta, Indonesia, 2020.
- No: 13K/13/MEM/2020; Concerning the Assignment of Implementation of Supply Supply and Development of Liquefied Natural Gas (LNG) Infrastructure, as Well as Conversion of Fuel Oil Use with Liq. Minister of Energy and Mineral Resources of the Republic of Indonesia: Jakarta, Indonesia, 2020.
- Small Scale LNG; International Gas Union: Vevey, Switzerland, 2015.
- Setyorini., P.D. AHP-PROMETHEE Combination for LNG Terminal Selection and LNG Distribution Optimization with Set Partitioning Problem. Master’s Thesis, Institut Teknologi Sepuluh, Surabaya, Indonesia, November 2018. [Google Scholar]
- Antara, G.B.D.S. Optimization and Economic Analysis of LNG Distribution to Plants in Papua Region. Int. J. Energy Econ. Policy 2019, 9, 179–187. [Google Scholar] [CrossRef]
- Pratiwi, E.; Handani, D.W.; Antara, G.B.D.S.; Dinariyana, A.A.B.; Abdillah, H.N. Economic analysis on the LNG Distribution to power plants in Bali and Lombok by utilizing mini-LNG carriers. IOP Conf. Ser. Mater. Sci. Eng. 2021, 1052, 012053. [Google Scholar] [CrossRef]
- Dewanto, Y.A.; Faturachman, D.; Marine, F.T. Analysis of Marine Transportation Accidents in Indonesia 2003–2013; Darma Persada: Jakarta, Indonesia, 2017; pp. 1–16. [Google Scholar]
- Daily Forecast for Wave Height of Shipping Activity Solid Waters; BMKG: Jakarta, Indonesia, 2021.
- U.S. Government Limits Downstream Gas Selling Price, ‘Small LNG’ Business Is Demanded More Efficiently. Available online: https://jurnalmaritim.com/pemerintah-batasi-harga-jual-gas-hilir-bisnis-small-LNG-dituntut-lebih-efisien/ (accessed on 26 February 2022).
- Budiyanto, M.A.; Riadi, A.; Buana, I.G.N.S.; Kurnia, G. Study on the LNG distribution to mobile power plants utilizing small-scale LNG carriers. Heliyon 2020, 6, e04538. [Google Scholar] [CrossRef] [PubMed]
- Sulmaihati, F. PLN Re-Auctions Gas Supply in Tanjung Benoa. Available online: https://katadata.co.id/arnold/berita/5e9a55dcef794/pln-lelang-ulang-pasokan-gas-di-tanjung-benoa (accessed on 26 February 2022).
- Zhang, L.; Bai, W. Risk assessment of China’s natural gas Importation: A supply chain perspective. Sage Open. 2020, 10, 215824402093991. [Google Scholar] [CrossRef]
- Sreedevi, R.; Saranga, H. Uncertainty and supply chain risk: The moderating role of supply chain flexibility in risk mitigation. Int. J. Prod. Econ. 2017, 193, 332–342. [Google Scholar] [CrossRef]
- Gurning, R.O.S. Maritime Disrutions in the Australian Indonesian Wheat Supply Chain; an Analysis of Risk Assessment and Mitigation Strategies. Available online: https://eprints.utas.edu.au/12929/2/Whole_thesis_excluding_Appendix_I_Gurning_thesis.pdf (accessed on 23 June 2021).
- Arianto, D.; Marpaung, E.; Malisan, J.; Humang, W.P.; Puriningsih, F.S.; Mardiana, T.S.; Siahaan, W.J.; Pairunan, T.; Kurniawan, A. Cost Efficiency and CO2 Emission Reduction in Short Sea Shipping: Evidence from Ciwandan Port–Panjang Port Routes, Indonesia. Sustainability 2022, 14, 6016. [Google Scholar] [CrossRef]
- Al-Haidous, S.; Al-Ansari, T. Sustainable liquefied natural gas supply chain management: A review of quantitative models. Sustainability 2020, 12, 243. [Google Scholar] [CrossRef] [Green Version]
- Chopra, S.; Meindl, P. Supply Chain Management Strategy, Planning, and Operation, 5th ed.; Pearson Education: New York, NY, USA, 2013. [Google Scholar]
- Mokhatab, S.; Mak, J.Y.; Valappil, J.; Wood, D.A. Handbook of Liquefied Natural Gas; Gulf Professional Publishing: Oxford, UK, 2013. [Google Scholar]
- Bittante, A.; Saxen, H. Design of Small LNG Supply Chain by Multi Period Optimization. Energies 2020, 13, 6704. [Google Scholar] [CrossRef]
- Chang, W.; Ellinger, A.E.; Blackhurst, J. A contextual approach to supply chain risk mitigation. Int. J. Logist. Manag. 2015, 26, 642–656. [Google Scholar] [CrossRef]
- Wan, C. Modelling and Systematic Assessment of Maritime Container Supply Chain Risks. Ph.D. Thesis, Liverpool John Moores University, Liverpool, UK, July 2018. [Google Scholar]
- Tran, T.H.; Dobrovnik, M.; Kummer, S. Supply chain risk assessment: A content analysis-based literature review. Int. J. Logist. Syst. Manag. 2018, 31, 562–591. [Google Scholar] [CrossRef]
- Sun, S.; Ertz, M. Life cycle assessment and risk assessment of liquefied natural gas vehicles promotion. Renew. Sustain. Energy Rev. 2022, 153, 111769. [Google Scholar] [CrossRef]
- Humang, W.P.; Hadiwardoyo, S.; Nahry, P. Bi-level model on freight distribution network integration in archipelagic region with milk run time windows and uncertainty. Int. J. Eng. Res. Technol. 2020, 13, 831–841. [Google Scholar] [CrossRef]
- Humang, W.P.; Hadiwardoyo, S.; Nahry, P. Clustering on freight distribution system in archipelagic region with deterministic allocation model. Int. J. Eng. Res. Technol. 2019, 12, 2997–3005. [Google Scholar]
- Humang, W.P.; Hadiwardoyo, S.; Nahry, P. Factors influencing the integration of freight distribution networks in the Indonesian archipelago: A structural equation modeling approach. Adv. Sci. Technol. Eng. Syst. 2019, 4, 278–286. [Google Scholar] [CrossRef] [Green Version]
- Humang, W.P.; Hadiwardoyo, S.; Nahry, P. The Effectiveness of Pilot Marine Transport Services for Goods Distribution in Maluku Island Group, Indonesia. In Proceedings of the 6th IEEE International Conference on Advanced Logistics and Transport (ICALT), Bali, Indonesia, 24–27 July 2017; pp. 165–169. [Google Scholar]
- Koza, D.F.; Ropke, S.; Boleda Molas, A. The liquefied natural gas infrastructure and tanker fleet sizing problem. Transp. Res. Part E Logist. Transp. Rev. 2017, 99, 96–114. [Google Scholar] [CrossRef] [Green Version]
- Tsai, H.Y.; Chang, C.W.; Lin, H.L. Fuzzy hierarchy sensitive with Delphi method to evaluate hospital organization performance. Expert Syst. Appl. 2010, 37, 5533–5541. [Google Scholar] [CrossRef]
- Wang, Y.; Yeo, G.T.; Ng, A.K. Choosing optimal bunkering ports for liner shipping companies: A hybrid Fuzzy-Delphi–TOPSIS approach. Transp. Policy 2014, 35, 358–365. [Google Scholar] [CrossRef]
- Kumar, R. Research Methodology: A Step-by-Step Guide for Beginners; Sage: London, UK, 2018. [Google Scholar]
- Machfudiyanto, R.A.; Syahreza, A. Supply chain analysis to reduce delays on green building projects with analytical hierarchy process method. J. Infrastrukt. 2022, 8, 71–78. [Google Scholar] [CrossRef]
- Nguyen, S.; Chen, P.S.L.; Du, Y.; Shi, W. A quantitative risk analysis model with integrated deliberative Delphi platform for container shipping operational risks. Transp. Res. Part E Logist. Transp. Rev. 2019, 129, 203–227. [Google Scholar] [CrossRef]
- Cafiso, S.; Di Graziano, A.; Pappalardo, G. Using the Delphi method to evaluate opinions of public transport managers on bus safety. Saf. Sci. 2013, 57, 254–263. [Google Scholar] [CrossRef]
- Schuckmann, S.W.; Gnatzy, T.; Darkow, I.L.; von der Gracht, H.A. Analysis of factors influencing the development of transport infrastructure until the year 2030—A Delphi based scenario study. Technol. Forecast. Soc. Change 2012, 79, 1373–1387. [Google Scholar] [CrossRef]
- Faisal, M.N.; Banwet, D.K.; Shankar, R. Supply chain risk mitigation: Modeling the enablers. Bus. Process Manag. J. 2006, 12, 1463–7154. [Google Scholar]
- McCormack, K. Measuring and Managing Risk. In Supply Chain Risk Management: Minimizing Disruptions in Global Sourcing, 1st ed.; Routledge: Oxfordshire, UK, 2008; pp. 65–91. [Google Scholar]
- Gaonkar, R.S.; Viswanadham. Analytical framework for the management of risk in supply chains. IEEE Trans. Autom. Sci. Eng. 2007, 4, 265–273. [Google Scholar] [CrossRef]
- Handfield, R.B.; Blackhurst, J.; Elkins, D.; Craighead, C.W. A Framework for Reducing the Impact of Disruptions to the Supply Chain: Observations from Multiple Executives. In Supply Chain Risk Management: Minimizing Disruption in Global Sourcing; Taylor and Francis: Boca Raton, FL, USA, 2007; pp. 29–49. [Google Scholar]


| Variable/Code | Activities/Code |
|---|---|
| LNG Plant X.1.1 | LNG Loading, X.1.1.1 LNG stored in storage tanks is pumped to the product dock. |
| X.1.1.2 At the dock, LNG is loaded onto the export vessels. | |
| X.1.1.3 Boil of Gas (BOG) formed on the tarmac is retransferred to the LNG plant. | |
| LNG Loading, X.1.1.4 Ship activities include the following (a) berth to the dock, and (b) unberth with stages of changing basins (turning basins), docking, as well as preparation for loading and unloading, and departure | |
| Transportation X.1.2 | LNG Shipment, X.1.2.1 LNG-laden ship sails from LNG plant to the collection terminal X.1.2.2 Ships/trucks transport LNG from the first to the next terminals |
| LNG Retrieval, X.1.2.3 The ballast condition vessel returns to the plant to obtain LNG | |
| LNG Receiving Terminal X.1.3 | LNG Unloading, X.1.3.1 Removing LNG from the ship, using the pump and loading arm (unloading arm) at the dock, and returning the boil of gas (BOG) to the ship’s tank keeps the pressure at 8–10 KPa. |
| X.1.3.2 Ship activities include the following, (a) berth to the dock and (b) unberth with stages of changing the basins (turning basins), docking, loading and unloading preparations, as well as departure | |
| LNG Storage: X.1.3.3 Storing LNG in onshore tanks | |
| LNG Regasification: X.1.3.4 LNG is subjected to pressure using the pump in a tank, and then converted into gas. This is carried out by heating, through media such as seawater, hot water, and air. | |
| Gas Distribution, X.1.3.5 Addition of odorant (odorant) to gas, and gas delivery to customers/power plants through pipes |
| No | Characteristics | Percentage (%) |
| 1 | Gender:
| 74% 26% |
| 2 | Work experience:
| 12% 38% 34% 16% |
| 3 | Education:
| 63% 37% |
| 4 | Work unit:
| 12% 47% 19% 22% |
| Code | Sub-Variables/Indicators | Reference | In Depth Interview (Expert) |
|---|---|---|---|
| (a) | (b) | (c) | (d) |
| X.2.1 | Security and safety | ||
| X.2.1.1 | Ship accident | [21,28] | Yes |
| X.2.1.2 | Politics (riots and wars) | [21,28] | No |
| X.2.1.3 | Piracy | [21,28] | Yes |
| X.2.1.4 | Terrorist attack | [21,28] | No |
| X.2.1.5 | Sabotage | [28] | Yes |
| X.2.1.6 | Smuggling | [28] | No |
| X.2.1.7 | Spy | [28] | No |
| X.2.1.8 | Epidemic | [28] | Yes |
| X.2.1.9 | Refugee | [28] | No |
| X.2.2 | Service-related factors | ||
| X.2.2.1 | Equipment damage | [21,25,28] | Yes |
| X.2.2.2 | Power outage | [21,25,28] | Yes |
| X.2.3 | Factors related to infrastructure | ||
| X.2.3.1 | Communication facility failure | [21,25,28] | Yes |
| X.2.3.2 | Lack of railway facilities | [21,25,28] | No |
| X.2.3.3 | Port Congestion | [21,25,28] | Yes |
| X.2.3.4 | Land access issues | [21,25,28] | Yes |
| X.2.3.5 | Limited storage capabilities | [25,28] | Yes |
| X.2.3.6 | Inadequate anchoring capability | [25,28] | Yes |
| X.2.4 | Market | ||
| X.2.4.1 | Bunkering costs uncertain | [21,28] | Yes |
| X.2.4.2 | Lack of transport ships | [21,25,28] | Yes |
| X.2.4.3 | Insufficient containers | [21,25,28] | No |
| X.2.4.4 | Inaccurate demand forecasts | [28] | Yes |
| X.2.5 | Organization and relationships | ||
| X.2.5.1 | Port strike | [21,28] | Yes |
| X.2.5.2 | Slow quarantine | [21,28] | Yes |
| X.2.5.3 | Old customs process | [21,28] | Yes |
| X.2.5.4 | Port shipping dispute | [21,28] | Yes |
| X.2.5.5 | Less flexible schedules drawn up | [25,28] | Yes |
| X.2.6 | Environmental | ||
| X.2.6.1 | Bad weather | [21,25,28] | Yes |
| X.2.6.2 | Earthquake | [21,25,28] | Yes |
| X.2.6.3 | Tsunami | [21,25,28] | Yes |
| X.2.7 | Human resources and work environment | ||
| X.2.7.1 | Lack of skilled workforce | [25,28] | Yes |
| X.2.7.2 | Lack of motivation | [25,28] | Yes |
| X.2.7.3 | Sailor’s mental health | [25,28] | Yes |
| X.2.7.4 | Human error | [28] | Yes |
| X.2.7.5 | Unreasonable welfare | [28] | Yes |
| X.2.7.6 | Diversity of languages and cultures | [28] | Yes |
| X.2.7.7 | Poor safety culture | [25,28] | Yes |
| X.2.7.8 | Low level of safety leadership | [25,28] | Yes |
| Frequency | Never | Once a Year | Four Times a Year |
|---|---|---|---|
| Risk Indicator |
|
|
|
| Code | Risks Indicator | Frequency | Probability | Impact | Risk Index | ||
|---|---|---|---|---|---|---|---|
| Index | Average | Index | Average | ||||
| (a) | (b) | (c) | (d) | (e) | (f) | (g) | (h) = (d × f) |
| X.2.6.1 | Bad weather | 4 times a year | 3.3 | 29% | 3.0 | 4.69 | 9.9 |
| X.2.1.1 | Ship accident | 1 times a year | 2.3 | 13% | 3.6 | 8.20 | 8.2 |
| X.2.2.1 | Equipment damage | 1 times a year | 2.8 | 22% | 2.9 | 3.94 | 8.2 |
| X.2.7.4 | Human error | 4 times a year | 2.9 | 24% | 2.6 | 2.25 | 7.6 |
| X.2.4.3 | Inaccurate demand forecasts | 4 times a year | 3.0 | 25% | 2.5 | 1.69 | 7.6 |
| X.2.7.7 | Poor safety culture | 1 times a year | 2.7 | 21% | 2.8 | 3.19 | 7.6 |
| X.2.4.2 | Lack of transport ships | 1 times a year | 2.7 | 20% | 2.8 | 3.38 | 7.6 |
| X.2.4.1 | Bunkering costs uncertain | 1 times a year | 2.9 | 23% | 2.6 | 2.25 | 7.5 |
| X.2.7.8 | Low level of safety leadership | 4 times a year | 2.7 | 20% | 2.7 | 2.44 | 7.1 |
| Risk Mitigation | Risk Indicator | |
|---|---|---|
| Strategy | Activity | |
| Changes in work practices |
|
|
| Develop an early warning system |
|
|
| Alternative route |
| |
| Alternative planning | Develop and implement:
|
|
| Order Policy Optimization | Agree on optimal planning and scheduling clauses in the sales and purchase agreement (SPA) |
|
| Supply Flexibility | Agree on ADP Clauses, Spot Cargo Options, Multi-Source LNG, SWAP Mechanism, and Substitute Fuel in Agreement. | |
Disclaimer/Publisher’s Note: The statements, opinions and data contained in all publications are solely those of the individual author(s) and contributor(s) and not of MDPI and/or the editor(s). MDPI and/or the editor(s) disclaim responsibility for any injury to people or property resulting from any ideas, methods, instructions or products referred to in the content. |
© 2023 by the authors. Licensee MDPI, Basel, Switzerland. This article is an open access article distributed under the terms and conditions of the Creative Commons Attribution (CC BY) license (https://creativecommons.org/licenses/by/4.0/).
Share and Cite
Machfudiyanto, R.A.; Humang, W.P.; Wahjuningsih, N.; Kamil, I.; Putra, Y.Y.A. Probability of Risk Factors Affecting Small-Scale LNG Supply Chain Activities in the Indonesian Archipelago. Infrastructures 2023, 8, 74. https://doi.org/10.3390/infrastructures8040074
Machfudiyanto RA, Humang WP, Wahjuningsih N, Kamil I, Putra YYA. Probability of Risk Factors Affecting Small-Scale LNG Supply Chain Activities in the Indonesian Archipelago. Infrastructures. 2023; 8(4):74. https://doi.org/10.3390/infrastructures8040074
Chicago/Turabian StyleMachfudiyanto, Rossy Armyn, Windra Priatna Humang, Nurul Wahjuningsih, Insannul Kamil, and Yanuar Yudha Adi Putra. 2023. "Probability of Risk Factors Affecting Small-Scale LNG Supply Chain Activities in the Indonesian Archipelago" Infrastructures 8, no. 4: 74. https://doi.org/10.3390/infrastructures8040074