Abstract
This paper is focused on the evaluation of the liquefaction hazard for different sites in Romania. To this aim, a database of 139 ground motions recorded during Vrancea intermediate-depth earthquakes having moment magnitudes MW ≥ 6.0 is employed for the evaluation of the equivalent number of cycles for this seismic source. Several functional forms for the empirical evaluation of the equivalent number of cycles considering various seismological or engineering parameters are tested and evaluated. The regression analysis shows smaller uncertainties for the empirical models based on ground motion engineering parameters. Considering the lack of information in terms of engineering parameters, a simpler empirical model which accounts for the earthquake magnitude, source–site distance and soil conditions is selected for the liquefaction hazard analysis. Based on the proposed empirical model, specific magnitude scaling factors for Vrancea intermediate-depth earthquakes are proposed for the first time as well. The liquefaction hazard analysis is performed for sites whose seismic hazard is generated by either the Vrancea intermediate-depth seismic source or by local shallow crustal seismic sources. In the case of some of the selected sites, liquefaction phenomena were observed during past large-magnitude earthquakes. Unlike previous studies dealing with liquefaction analyses for sites in Romania, in this research, the hazard assessment is performed for various ground motion levels evaluated based on probabilistic seismic hazard assessment. Liquefaction hazard curves are constructed for each analyzed site. The results of the liquefaction hazard analysis show that this phenomenon is more likely to occur in the areas exposed to Vrancea intermediate-depth earthquakes, compared to the areas affected by local shallow earthquakes. In the case of the analyzed soil profiles from Bucharest, Craiova and Ianca, the minimum liquefaction safety factors less than one even for seismic hazard levels having mean return periods of 100 years and less.
1. Introduction
Liquefaction represents one of the most important primary hazards generated by earthquake ground shaking. Significant damage to both buildings and lifelines has been observed during earthquakes occurring in various places [1]. Liquefaction case histories and empirical relations of earthquake magnitude versus source–site distance at which liquefaction can occur based on data in the Aegean Sea region have been proposed by Papathanassiou et al. [2]. In the same context, the study of Meisina et al. [3] presents a history of occurrences of liquefaction phenomena in Europe. The liquefaction occurrences during the Canterbury 2010–2011 earthquake sequence are documented by Green et al. [4]. Case histories of liquefaction phenomena in Italy during historic earthquakes were documented by Berardi et al. [5]. An in-depth geological and geotechnical analysis of the whole area affected by liquefaction as a result of the 2012 Emilia earthquakes is shown in the study of Minarelli et al. [6]. Liquefaction case histories observed during the 2001 Nisqually (Washington) earthquake are presented by Rasanen et al. [7]. Other earthquakes during which such phenomena were observed occurred in Japan [8,9], Chile [10], Turkey [11] or Ecuador (gravelly soil liquefaction phenomena) [12]. Other liquefaction case histories of gravelly soils have been documented by Hu et al. [13]. Analytical assessments of liquefaction potential, as well as studies related to liquefaction risk were performed in a significant number of studies in the literature (e.g., [14,15,16,17,18,19,20,21,22,23,24,25,26]).
It has to be emphasized that although liquefaction phenomena occurred in Romania during large-magnitude earthquakes, the number of studies focusing on this topic is extremely limited. Thus, in the case of Romania, liquefaction phenomena have been observed during the major Vrancea intermediate-depth earthquakes of November 1940 [27] and March 1977 [28,29], in some cases at significant distances from the epicenter of the earthquake (more than 300 km in the case of Craiova and other sites situated nearby). The report on the Vrancea 1977 earthquake of the Japanese International Cooperation Agency [30] mentions liquefaction phenomena in Bucharest, Giurgiu, Bragadiru, Craiova, Faurei and Buda, all sites situated in the southern part of Romania on quaternary deposits near riverbeds. Some damage to rural buildings was observed at several sites during the 1977 event. It has to be highlighted that one of the first studies in the literature which deals with the liquefaction phenomena was published in 1962 [31] (in Romanian language). In the previously mentioned study, a liquefaction analysis is performed for a site situated on the Black Sea coast of Romania, a site which is also analyzed in the final section of this study.
In this research, an evaluation of the liquefaction hazard is performed for a number of sites in Romania. To this aim, considering the characteristics of the Vrancea intermediate-depth seismic source (influencing the seismic hazard of a large part of the Romanian territory), an empirical assessment of the number of equivalent cycles is performed using various models based on both seismological and engineering parameters. Based on a proposed empirical model, specific magnitude scaling factors to be used in liquefaction hazard analyses for sites affected by Vrancea intermediate-depth earthquakes are proposed for the first time. Finally, a liquefaction hazard assessment is performed for sites in Romania affected by either Vrancea intermediate-depth earthquakes or local shallow earthquakes. It has to be mentioned that some of the sites were selected based on past liquefaction occurrence during Vrancea intermediate-depth earthquakes. Moreover, the liquefaction hazard analysis is performed using ground motion amplitudes obtained from probabilistic seismic hazard assessment, unlike previous research dealing also with liquefaction hazard, which employed single scenarios and ground motion amplitudes. Finally, based on the results of the analyses, liquefaction hazard curves are developed for the analyzed sites.
2. Research Methodology
The research methodology applied in this study is described in this section. The methodology involves an empirical evaluation of the equivalent number of cycles for ground motions recorded during Vrancea intermediate-depth earthquakes. The empirical evaluation is used subsequently in order to evaluate the magnitude scaling factors for liquefaction hazard analysis, since no such factors are available in the literature for Vrancea intermediate-depth seismic source. A liquefaction hazard assessment is performed for a number of sites in Romania, affected by either Vrancea intermediate-depth earthquakes or crustal local earthquakes. The liquefaction safety factor is computed for ground motion amplitudes having various exceedance probabilities, which were determined from a probabilistic seismic hazard assessment. Finally, the liquefaction hazard curves allow for a rapid evaluation of the occurrence probabilities of this phenomenon. All these steps of the research methodology are summarized in Table 1.

Table 1.
Flowchart of the research methodology applied in this study.
3. Evaluation of the Number of Equivalent Cycles
In order to perform the liquefaction hazard analysis for the selected sites in Romania, the equivalent number of cycles for ground motions recorded during Vrancea intermediate-depth earthquakes has to be evaluated, since no such model exists in the literature. A ground motion database of recordings from five Vrancea intermediate-depth earthquakes having moment magnitudes MW ≥ 6.0 is compiled for this analysis. The database is a part of the larger ground motion database used in the past studies of Yaghmaei-Sabegh et al. [32] and Pavel and Yaghmaei-Sabegh [33], which deal with the evaluation of the mean period TM and of the control period TC for intermediate-depth earthquakes. Only ground motion recordings having a minimum peak ground acceleration (PGA) of 0.05 g [34] are selected for the analysis. The total number of ground motion recordings used for the evaluation of the number of equivalent cycles is 139. Some characteristics of the earthquakes in the database are given in Table 2. Smaller-magnitude Vrancea earthquakes were not considered in the analysis because of the low levels of ground shakings they produce (leading to small macrosiesmic intensities). In this study, the procedure of Seed et al. [35], described also in the study of Castiglia and Santucci de Magistris [34], is employed for the evaluation of the equivalent number of cycles for the ground motion recordings in the database.
Table 2.
Characteristics of the earthquakes used in this study.
The distribution of the equivalent number of cycles as a function of the hypocentral distance R and peak ground acceleration is shown in Figure 1. It can be observed from Figure 1 that the number of ground motions recorded at distances larger than 300 km is rather limited, as is the number of ground motion recordings having peak ground accelerations larger than 0.2 g.
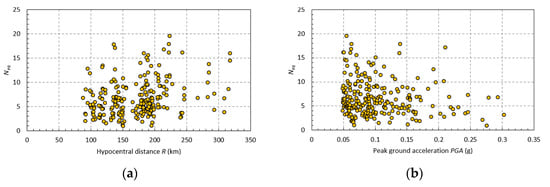
Figure 1.
Distribution of the equivalent number of cycles as a function of: (a) hypocentral distance R; (b) peak ground acceleration.
Figure 2 illustrates the distribution of the equivalent number of cycles with the earthquake magnitude. It can be observed that there is a significant increase in the equivalent number of cycles with the earthquake magnitude, especially for events having MW ≥ 7.0. A fitted exponential trendline is also shown in the plot. The value of the coefficient of determination R2 for the exponential fit is rather small.
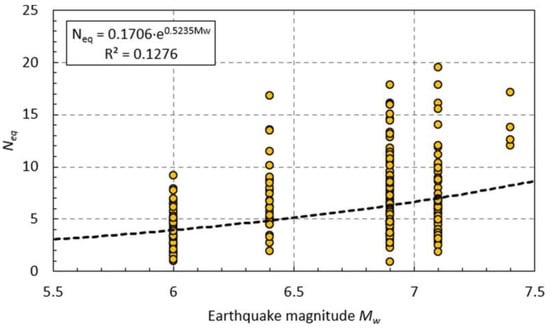
Figure 2.
Distribution of the equivalent number of cycles as a function of earthquake magnitude. The fitted exponential trendline is shown with the black dashed line.
Subsequently, the correlation of the equivalent number of cycles with various engineering parameters is studied. The peak ground velocity of the ground motion recordings in the database is in the range 1.5–70 cm/s (the latter value corresponding to a ground motion recorded in Bucharest during the Vrancea earthquake of 1977).
The computed correlation coefficients are reported in Table 2. Among the selected engineering parameters, besides the peak ground acceleration (PGA), the peak ground velocity (PGV), the mean period TM [36], Arias Intensity [37] and the significant ground motion duration D5-95 [38] are selected as well. It can be observed from Table 3 that the largest correlation coefficients for the equivalent number of cycles are obtained with the earthquake magnitude MW, hypocentral distance R and significant ground motion duration D5-95. The same observation holds true also for the logarithm of the equivalent number of cycles, albeit the values of the correlation coefficients can differ substantially for the same considered parameter.
Table 3.
Correlation coefficients between the equivalent number of cycles and other parameters.
4. Empirical Models for the Number of Equivalent Cycles
Empirical models for the evaluation of the equivalent number of cycles have been proposed in various studies in the literature [34,35,39,40,41,42,43,44,45]. Initially, the empirical relations employed only the magnitude as a dependent parameter, while the more recent models consider other parameters as well (source–site distance, soil conditions, faulting mechanism, other ground motion parameters, etc.). A review of some of the empirical models mentioned above can be found in the study of Lasley et al. [43], as well as in the study of Castiglia and Santucci de Magistris [34].
In this study, a total number of 10 empirical models are proposed for the evaluation of the equivalent number of cycles using the available parameters (both seismological and engineering). The soil conditions for each seismic station are evaluated using the criteria from the proposed Eurocode 8 draft [46] and are taken from the study of Pavel and Yaghmaei-Sabegh [33]. Due to the limited number of ground motions recorded on site classes A, D and E, the recordings from soil classes A and B are grouped into a single category. The same grouping is applied for the recordings obtained on soil classes C, D and E, while the recordings from soil class F sites remain as such. The following seismological parameters are employed in the empirical models: (1) earthquake moment magnitude; (2) hypocentral distance and (3) site class. The engineering parameters employed for the development of the empirical models are: (1) PGA; (2) PGV; (3) IA; (4) TM and (5) D5-95.
The functional forms of the proposed empirical models based on previous models available in the literature and using both seismological and engineering parameters are given below:
For each proposed empirical model, the regression coefficients (c1–c5), (d1–d7) and (e1–e5) and the model standard deviation are reported in Table 4, Table 5 and Table 6. In Equations (4)–(8), PGA is measured in g and the PGV is in m/s.
Table 4.
Regression coefficients for empirical models (1)–(3).
Table 5.
Regression coefficients for empirical models (4)–(7).
Table 6.
Regression coefficients for empirical models (8)–(10).
From the proposed empirical models, it can be observed that, as expected, the smallest uncertainty is obtained for the model considering all the engineering parameters. It can be observed that as the number of engineering parameters introduced in the regression increases, the regression coefficient associated with the peak ground velocity decreases and approaches 0. The introduction of the significant ground motion duration as a parameter of the empirical model does not improve the overall uncertainty of the models. Another important observation made based on the values of the regression coefficients is that the equivalent number of cycles decreases from soil classes A and B to soil class F (deep soft sites).
Considering the lack of such information for liquefaction hazard analysis, the empirical model (3) is selected in this study to be used in the subsequent section. In the absence of reliable data, empirical models for the estimation of the engineering parameter may be used, but the level of uncertainty in the estimations would become considerable.
The variation of the predicted equivalent number of cycles as a function of the earthquake magnitude and soil class for three hypocentral distances, R = 100 km, R = 200 km and R = 300 km, is shown in Figure 3. In Figure 3, the values obtained using the relation of Seed et al. [35] are also shown for comparison purposes. It can be observed that the equivalent number of cycles computed using the relation proposed by Seed et al. [35] is larger than the one obtained using the empirical model from this study, whereby the difference decreases with the hypocentral distance.
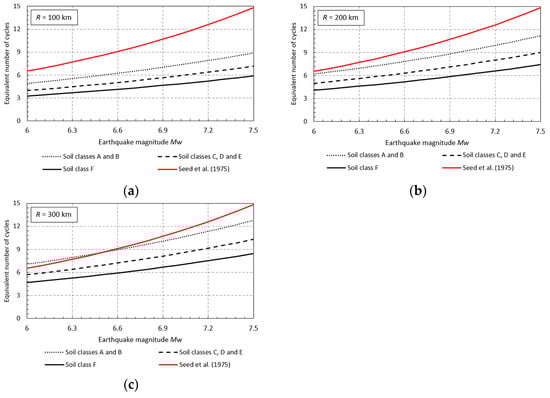
Figure 3.
Variation of the equivalent number of cycles as a function of the earthquake magnitude and soil class for: (a) R = 100 km; (b) R = 200 km; (c) R = 300 km [35].
The distribution of the residuals (difference between observed and estimated values using the proposed empirical model) is shown in Figure 4. No bias can be observed in the distribution of the residuals with respect to both the earthquake magnitude and the hypocentral distance as the slopes of the fitted trendlines are practically zero.
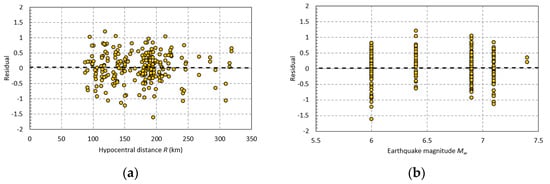
Figure 4.
Distribution of the residuals as a function of: (a) earthquake magnitude; (b) hypocentral distance R. The fitted linear trendlines are shown with black dashed line.
The histograms of the residuals as a function of the soil class for the recording seismic station are presented in Figure 5. It can be observed from Figure 5 that there is a certain degree of asymmetry in the distribution of the residuals for all soil classes.
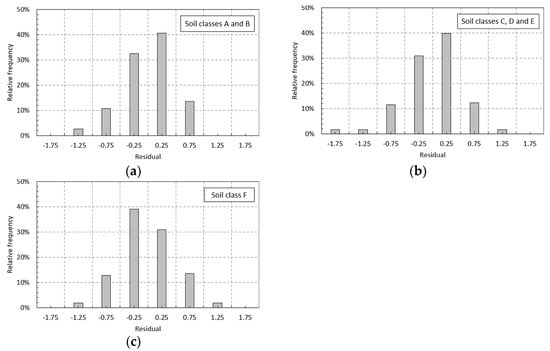
Figure 5.
Histograms of residuals as a function of the soil class: (a) soil classes A and B; (b) soil classes C, D and E; (c) soil class F.
The mean, median, standard deviation and skewness of the residuals as a function of the soil class are reported in Table 7. It can be observed that the largest skewness is obtained for the recordings obtained on soil classes C, D and E. The mean and the median values in all cases are close to zero. The largest skewness is obtained for soil classes C, D and E, which is also observed from the distributions shown in Figure 5.
Table 7.
Statistical indicators of the residuals as a function of the soil class.
5. Liquefaction Hazard Analysis for Selected Sites
Liquefaction studies for sites in Bucharest have been performed in other studies available in the literature (e.g., [47,48,49,50]). It has to be mentioned that these studies have used as input a single earthquake scenario characterized by a peak ground acceleration of approximately 0.30 g, which represents the elastic peak ground acceleration for Bucharest in the current Romanian seismic design code P100-1/2013 [51]. The soil liquefaction susceptibility performed for Europe within the LIQUEFACT project [3] assigns a high or very high susceptibility for such a phenomenon for the sites situated in the southern part of Romania.
The following sites have been selected based on the available information (soil profiles, liquefaction during past earthquakes, seismic hazard, etc.) for the liquefaction hazard assessment: Bucharest (three sites), Timisoara, Craiova (two sites), Constanta, Arad, Giurgiu, Medias, Ianca, Caracal and Sighisoara. The sites can be divided into two categories from the point of view of the seismic hazard [52]: (i) sites for which the seismic hazard is generated by the Vrancea intermediate-depth seismic source—Bucharest, Craiova, Constanta, Giurgiu, Caracal and Ianca; (ii) sites for which the seismic hazard is generated by local crustal seismic sources—Timisoara, Arad, Oradea, Medias and Sighisoara. The soil profiles for the Bucharest sites were taken from Calarasu [50]. The soil profiles for Timisoara and Arad were taken from Mihu [53]. A more detailed seismic hazard analysis of some of the sites analyzed in this study can be found in the paper of Pavel and Vacareanu [54]. In the case of Bucharest, detailed hazard analyses and evaluations of the site-specific seismic response were performed in the studies of Pavel [55] and Pavel et al. [56]. The positions of the analyzed sites are shown in Figure 6.
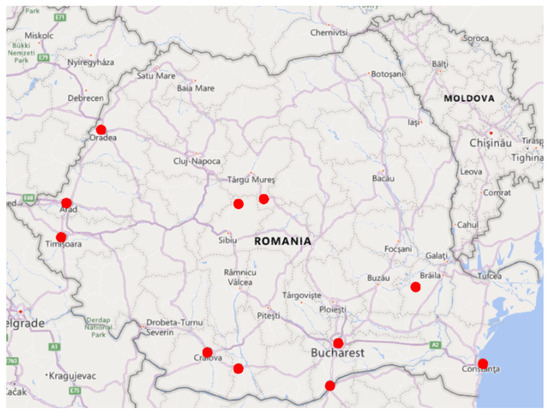
Figure 6.
Positions of the analyzed sites.
The seismic hazard curves for peak ground acceleration for the analyzed sites are illustrated in Figure 7 [52]. It can be observed that the slope of the seismic hazard curve is different in the case of sites affected by the Vrancea intermediate-depth seismic source, as compared to sites affected by local shallow crustal seismic sources. The main reason for this difference is related to the seismicity parameters used in the probabilistic seismic hazard assessment of Romania [52], in the sense that seismic rates have larger uncertainties in the case of the crustal seismic sources, as compared to the Vrancea intermediate-depth seismic source. While the seismic activity of the Vrancea intermediate-depth seismic source is rather constant, with medium- and large-magnitude events occurring regularly in each century, the seismic activity of the majority of the crustal seismic sources in Romania shows rather long periods of inactivity followed by earthquake swarms lasting some months.
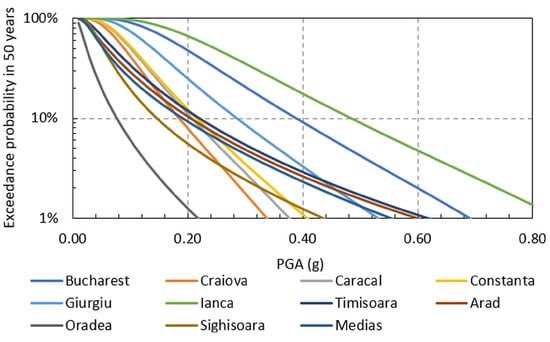
Figure 7.
Seismic hazard curves for peak ground acceleration for the analyzed sites [52].
A description of the analyzed sandy soil profiles for which the liquefaction hazard analysis is performed is shown in Table 8.
Table 8.
Characteristics of the soil profiles used for liquefaction hazard analysis.
A plot of the minimum and maximum particle size distribution curves for 177 samples of sands, which liquefied during the Vrancea 1977 earthquake, is shown in Figure 8 [29].
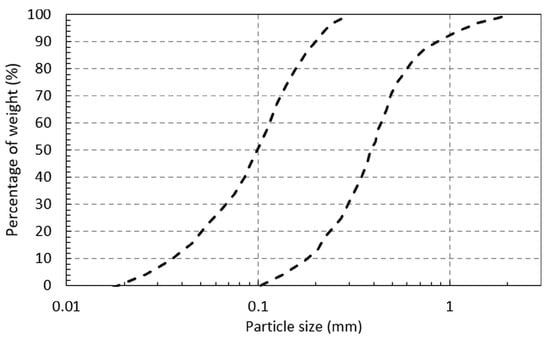
Figure 8.
Comparison of the minimum and maximum particle size distribution curves for sands in Romania which liquefied during the Vrancea 1977 earthquake [29].
The Standard Penetration Test (SPT) results are used in this study for evaluating the liquefaction resistance of the soil layers. The cyclic shear ratio (CSR) is obtained using the classic relation of Seed and Idriss [57]. The cyclic resistance ratio (CRR) is evaluated using the relation proposed by Youd et al. [58]. Finally, the factor of safety against liquefaction (FS) is the magnitude adjusted ratio between the cyclic resistance ratio for magnitude 7.5 earthquakes and the cyclic shear ratio [59]. For each analyzed site, the equivalent number of cycles corresponding to a given peak ground acceleration having a specific exceedance probability is evaluated by considering the seismic hazard disaggregation results.
The magnitude scaling factor (MSF) used in the liquefaction hazard analysis for the sites under the influence of the sites under the influence of the Vrancea intermediate-depth seismic source is evaluated following the procedure given in the work of Boulanger and Idriss [60]. The number of equivalent cycles is evaluated using the empirical model developed in the previous section. The magnitude scaling factor is computed as [60]:
In rel. (11), b is taken as 0.34 [34]. The resulting magnitude scaling factor for Vrancea intermediate-depth earthquakes is illustrated in Figure 9. Other magnitude scaling factors proposed in the literature (e.g., [61,62,63]) are also shown for comparison purposes. It can be observed that the proposed model provides the lowest magnitude scaling factors for earthquake magnitudes MW ≤ 7.5. In addition, the proposed magnitude scaling factors are close to the ones proposed by Seed and Idriss [61].
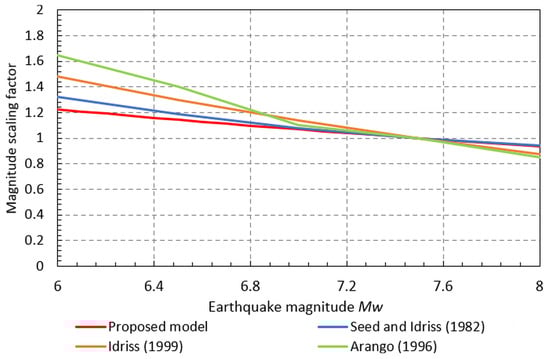
Figure 9.
Comparison of the magnitude scaling factor for Vrancea intermediate-depth earthquakes with other relations in the literature [61,62,63].
In the case of the sites affected by crustal earthquakes, the magnitude scaling factor relation proposed by Idriss [62] and given below is employed:
When considering the site selection for this study, the criteria from Eurocodes 8–5 [64] were considered. The previously mentioned document allows for the neglection of the liquefaction analysis in the following conditions:
- The saturated sand deposits are situated at depths larger than 15 m;
- The site design peak ground acceleration is less than 0.15 g, coupled with some other requirements related to the clay or silt content of the sands and the SPT blow count value normalized for overburden effects, and for the energy ratio, N1(60) is more than 20 or 30.
The liquefaction hazard analysis is performed by considering the peak ground accelerations having mean return periods of 20, 50, 100, 225, 475 and 975 years for each site determined by a probabilistic seismic hazard assessment of Romania [52]. The resulting curves are shown in Figure 10. It can be observed that there are a number of sites (e.g., Craiova, Bucharest, Ianca and Constanta) for which the minimum value of the liquefaction safety factor is less than one even for seismic hazard levels corresponding to mean return periods of less than 100 years (in the first three cases). For the other sites, the minimum safety factor against liquefaction decreases below one only for seismic hazard levels having mean return periods larger than 1000 years (except for Giurgiu and one site in Timisoara). These results show that the liquefaction phenomenon appears more likely in the areas exposed to Vrancea intermediate-depth earthquakes, compared to the areas affected by local shallow earthquakes.
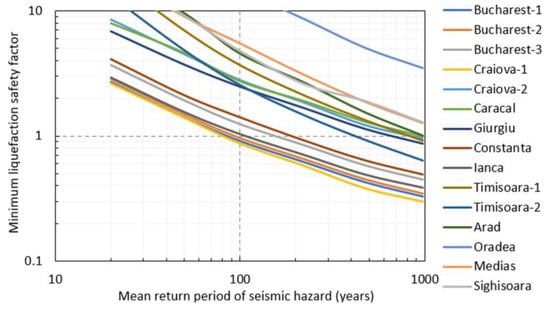
Figure 10.
Liquefaction hazard curves for the selected sites.
6. Conclusions
This study is focused on the liquefaction hazard analysis for sites in Romania. Empirical models are used for the computation of the equivalent number of cycles of ground motions recorded during Vrancea intermediate-depth earthquakes. A database consisting of 139 ground motions recorded during five intermediate-depth Vrancea earthquakes having moment magnitudes MW ≥ 6.0 is employed in this study for the development of the empirical models. Several empirical models having various dependent parameters are proposed in the study. Specific magnitude scaling factors for liquefaction are proposed for the Vrancea intermediate-depth earthquakes. Subsequently, liquefaction hazard curves are developed for the analyzed sites considering the ground motion input obtained from probabilistic seismic hazard assessment. The most important observations of the study are summarized below:
- The largest correlation coefficients for the equivalent number of cycles are obtained with the earthquake magnitude MW, hypocentral distance R and significant ground motion duration D5-95;
- It was observed that the smallest uncertainty of the proposed empirical models is obtained for the model considering all the engineering parameters;
- The equivalent number of cycles computed using the relation proposed by Seed et al. [35] is larger than the ones obtained using the empirical model from this study, but the difference between the two empirical models decreases with the hypocentral distance;
- The regression coefficients show that the equivalent number of cycles decreases from soil classes A and B to soil class F (deep soft sites);
- Specific magnitude scaling factors for Vrancea intermediate-depth earthquakes are proposed for the fist time using the procedure from Boulanger and Idriss [60]. The resulting factors are close to the ones proposed by Seed and Idriss [61];
- The analyzed soil profiles for Bucharest, Craiova and Ianca show minimum liquefaction safety factors less than one even for seismic hazard levels having mean return periods of 100 years and less;
- The results of the liquefaction hazard analysis show that this phenomenon appears more likely in the areas exposed to Vrancea intermediate-depth earthquakes, compared to the areas affected by local shallow earthquakes.
Author Contributions
Conceptualization, F.P.; methodology, F.P. and R.V.; investigation, F.P.; data curation, R.V.; writing—original draft preparation, F.P.; writing—review and editing, R.V.; visualization, R.V. All authors have read and agreed to the published version of the manuscript.
Funding
This research received no external funding.
Data Availability Statement
The data used in this study are available upon request.
Conflicts of Interest
The authors declare no conflict of interest.
References
- Kramer, S. Geotechnical Earthquake Engineering; Prentice-Hall: Upper Saddle River, NJ, USA, 1996; ISBN 0-13-374943-6. [Google Scholar]
- Papathanassiou, G.; Pavlides, S.; Christaras, B.; Pitilakis, K. Liquefaction Case Histories and Empirical Relations of Earthquake Magnitude versus Distance from the Broader Aegean Region. J. Geodyn. 2005, 40, 257–278. [Google Scholar] [CrossRef]
- Meisina, C.; Bonì, R.; Bozzoni, F.; Conca, D.; Perotti, C.; Persichillo, P.; Lai, C.G. Mapping Soil Liquefaction Susceptibility across Europe Using the Analytic Hierarchy Process. Bull. Earthq. Eng. 2022, 20, 5601–5632. [Google Scholar] [CrossRef]
- Green, R.A.; Cubrinovski, M.; Cox, B.; Wood, C.; Wotherspoon, L.; Bradley, B.; Maurer, B. Select Liquefaction Case Histories from the 2010–2011 Canterbury Earthquake Sequence. Earthq. Spectra 2014, 30, 131–153. [Google Scholar] [CrossRef]
- Berardi, R.; Margottini, C.; Molin, D.; Parisi, A. Soil Liquefaction: Case Histories in Italy. Tectonophysics 1991, 193, 141–164. [Google Scholar] [CrossRef]
- Minarelli, L.; Amoroso, S.; Civico, R.; De Martini, P.M.; Lugli, S.; Martelli, L.; Molisso, F.; Rollins, K.M.; Salocchi, A.; Stefani, M.; et al. Liquefied Sites of the 2012 Emilia Earthquake: A Comprehensive Database of the Geological and Geotechnical Features (Quaternary Alluvial Po Plain, Italy). Bull. Earthq. Eng. 2022, 20, 3659–3697. [Google Scholar] [CrossRef]
- Rasanen, R.A.; Geyin, M.; Maurer, B.W. Select Liquefaction Case Histories from the 2001 Nisqually, Washington, Earthquake: A Digital Data Set and Assessment of Model Performance. Earthq. Spectra 2023, 39, 87552930231174240. [Google Scholar] [CrossRef]
- Ishihara, K.; Koga, Y. Case Studies of Liquefaction in the 1964 Niigata Earthquake. Soils Found. 1981, 21, 35–52. [Google Scholar] [CrossRef] [PubMed]
- Yamaguchi, A.; Mori, T.; Kazama, M.; Yoshida, N. Liquefaction in Tohoku District during the 2011 off the Pacific Coast of Tohoku Earthquake. Soils Found. 2012, 52, 811–829. [Google Scholar] [CrossRef]
- Montalva, G.; Ruz, F.; Escribano, D.; Bastías, N.; Espinoza, D.; Paredes, F. Chilean Liquefaction Case History Database. Earthq. Spectra 2022, 38, 2260–2280. [Google Scholar] [CrossRef]
- Kanıbir, A.; Ulusay, R.; Aydan, Ö. Assessment of Liquefaction and Lateral Spreading on the Shore of Lake Sapanca during the Kocaeli (Turkey) Earthquake. Eng. Geol. 2006, 83, 307–331. [Google Scholar] [CrossRef]
- Lopez, J.S.; Vera-Grunauer, X.; Rollins, K.; Salvatierra, G. Gravelly Soil Liquefaction after the 2016 Ecuador Earthquake. Geotech. Earthq. Eng. Soil Dyn. V 2018, 273–285. [Google Scholar] [CrossRef]
- Hu, J.; Wang, J.; Zou, W.; Yang, B. Datasets for Gravelly Soil Liquefaction Case Histories. Data Brief. 2021, 36, 107104. [Google Scholar] [CrossRef] [PubMed]
- Mansoor, N.M.; Niemi, T.M.; Misra, A. A GIS-Based Assessment of Liquefaction Potential of the City of Aqaba, Jordan. Environ. Eng. Geosci. 2004, 10, 297–320. [Google Scholar] [CrossRef]
- Du, X.; Sun, Y.; Song, Y.; Xiu, Z.; Su, Z. Submarine Landslide Susceptibility and Spatial Distribution Using Different Unsupervised Machine Learning Models. Appl. Sci. 2022, 12, 10544. [Google Scholar] [CrossRef]
- Hossain, M.S.; Kamal, A.S.M.M.; Rahman, M.Z.; Farazi, A.H.; Mondal, D.R.; Mahmud, T.; Ferdous, N. Assessment of Soil Liquefaction Potential: A Case Study for Moulvibazar Town, Sylhet, Bangladesh. SN Appl. Sci. 2020, 2, 777. [Google Scholar] [CrossRef]
- Norini, G.; Aghib, F.S.; Di Capua, A.; Facciorusso, J.; Castaldini, D.; Marchetti, M.; Cavallin, A.; Pini, R.; Ravazzi, C.; Zuluaga, M.C.; et al. Assessment of Liquefaction Potential in the Central Po Plain from Integrated Geomorphological, Stratigraphic and Geotechnical Analysis. Eng. Geol. 2021, 282, 105997. [Google Scholar] [CrossRef]
- Ahmad, M.; Tang, X.-W.; Qiu, J.-N.; Ahmad, F. Evaluating Seismic Soil Liquefaction Potential Using Bayesian Belief Network and C4.5 Decision Tree Approaches. Appl. Sci. 2019, 9, 4226. [Google Scholar] [CrossRef]
- Selcukhan, O.; Ekinci, A. Assessment of Liquefaction Hazard and Mapping Based on Standard Penetration Tests in the Long Beach and Tuzla Regions of Cyprus. Infrastructures 2023, 8, 99. [Google Scholar] [CrossRef]
- Ahmad, M.; Tang, X.-W.; Ahmad, F.; Jamal, A. Assessment of Soil Liquefaction Potential in Kamra, Pakistan. Sustainability 2018, 10, 4223. [Google Scholar] [CrossRef]
- Wen, H.-C.; Li, A.-J.; Lu, C.-W.; Chen, C.-N. Application of the Coupled Markov Chain in Soil Liquefaction Potential Evaluation. Buildings 2022, 12, 2095. [Google Scholar] [CrossRef]
- Chen, Z.; Li, H.; Goh, A.T.C.; Wu, C.; Zhang, W. Soil Liquefaction Assessment Using Soft Computing Approaches Based on Capacity Energy Concept. Geosciences 2020, 10, 330. [Google Scholar] [CrossRef]
- Acharya, P.; Sharma, K.; Acharya, I.P.; Adhikari, R. Seismic Liquefaction Potential of Fluvio-Lacustrine Deposit in the Kathmandu Valley, Nepal. Geotech. Geol. Eng. 2023, 41, 1977–1997. [Google Scholar] [CrossRef]
- Arango-Serna, S.; Gallo, L.; Zambrano, J.H.; Cruz, A.; Sandoval, E.; Thomson, P. New Seismic Monitoring Center in South America to Assess the Liquefaction Risk Posed by Subduction Earthquakes. J. Seismol. 2023, 27, 385–407. [Google Scholar] [CrossRef]
- Manoharan, S.G.; Ganapathy, G.P. GIS Based Urban Social Vulnerability Assessment for Liquefaction Susceptible Areas: A Case Study for Greater Chennai, India. Geoenviron. Disasters 2023, 10, 1. [Google Scholar] [CrossRef]
- Kanth, A.; Bishoyi, N.; Kumar, R. Probabilistic Estimation of Earthquake Source Location and Magnitude Using Inverse Analysis of Regional Paleoliquefaction Studies. Nat. Hazards 2023, 118, 807–841. [Google Scholar] [CrossRef]
- Radulescu, N. Research on the November 10, 1940 Earthquake in the South Part of Moldova; Tipografia Ziarului Universul: Bucharest, Romania, 1941. [Google Scholar]
- Ishihara, K.; Perlea, V. Liquefaction-Associated Ground Damage during the Vrancea Earthquake of 4 March 1977. Soils Found. 1984, 24, 90–112. [Google Scholar] [CrossRef][Green Version]
- Mandrescu, N. The 4 March 1977 Vrancea Earthquake: Aspects of Soil Behaviour. In Seismological Research on the 4 March 1977 Earthquake; Cornea, I., Radu, C., Eds.; CFPS: Bucharest, Romania, 1979; pp. 569–614. [Google Scholar]
- JICA. The Romania Earthquake Survey Group of Experts and Specialists Dispatched by the Government of Japan: Survey Report; JICA: Tokyo, Japan, 1977.
- Cunitescu Jianu, G.; Balasescu, A. Seismic Stability of Buildings Situated in Saturated Sands. INCERC-ISCAS Bull. 1962, 105–119. [Google Scholar]
- Yaghmaei-Sabegh, S.; Pavel, F.; Shahvar, M.; Qadri, S.M.T. Empirical Frequency Content Models Based on Intermediate-Depth Earthquake Ground-Motions. Soil Dyn. Earthq. Eng. 2022, 155, 107173. [Google Scholar] [CrossRef]
- Pavel, F.; Yaghmaei-Sabegh, S. Empirical Evaluation of the Control Period TC for Intermediate-Depth Earthquakes: Application for Romania. Nat. Hazards 2023, 118, 2609–2628. [Google Scholar] [CrossRef]
- Castiglia, M.; Santucci de Magistris, F. Prediction of the Number of Equivalent Cycles for Earthquake Motion. Bull. Earthq. Eng. 2018, 16, 3571–3603. [Google Scholar] [CrossRef]
- Seed, H.B.; Idriss, I.M.; Makdisi, F.; Banerjee, N. Representation of Irregular Stress Time Histories by Equivalent Uniform Stress Series in Liquefaction Analyses; Earthquake Engineering Research Center, University of California: Berkeley, CA, USA, 1975. [Google Scholar]
- Rathje, E.M.; Abrahamson, N.A.; Bray, J.D. Simplified Frequency Content Estimates of Earthquake Ground Motions. J. Geotech. Geoenviron. Eng. 1998, 124, 150–159. [Google Scholar] [CrossRef]
- Arias, A. Measure of Earthquake Intensity. In Seismic Design for Nuclear Power Plants; Hansen, R., Ed.; Massachusetts Inst. of Tech. Press: Cambridge, MA, USA, 1970; pp. 438–483. [Google Scholar]
- Bommer, J.; Martinez-Pereira, A. The Effective Duration of Earthquake Strong Motion. J. Earthq. Eng. 1999, 3, 127–172. [Google Scholar] [CrossRef]
- Liu, A.H.; Stewart, J.P.; Abrahamson, N.A.; Moriwaki, Y. Equivalent Number of Uniform Stress Cycles for Soil Liquefaction Analysis. J. Geotech. Geoenviron. Eng. 2001, 127, 1017–1026. [Google Scholar] [CrossRef]
- Biondi, G.; Casconi, E.; Maugeri, M. Number of Uniform Stress Cycles Equivalent to Seismic Loading; Elsevier: Berkeley, CA, USA, 2004; Volume 2, pp. 705–712. [Google Scholar]
- Green, R.A.; Terri, G.A. Number of Equivalent Cycles Concept for Liquefaction Evaluations—Revisited. J. Geotech. Geoenviron. Eng. 2005, 131, 477–488. [Google Scholar] [CrossRef]
- Onder Cetin, K.; Tolga Bilge, H. Performance-Based Assessment of Magnitude (Duration) Scaling Factors. J. Geotech. Geoenviron. Eng. 2012, 138, 324–334. [Google Scholar] [CrossRef]
- Lasley, S.J.; Green, R.A.; Rodriguez-Marek, A. Number of Equivalent Stress Cycles for Liquefaction Evaluations in Active Tectonic and Stable Continental Regimes. J. Geotech. Geoenviron. Eng. 2017, 143, 04016116. [Google Scholar] [CrossRef]
- Cetin, K.O.; Altinci, E.; Bilge, H.T. Probability-Based Assessment of Number of Equivalent Uniform Stress Cycles. Soil Dyn. Earthq. Eng. 2021, 143, 106583. [Google Scholar] [CrossRef]
- Lee, J.; Green, R.A. An Empirical Significant Duration Relationship for Stable Continental Regions. Bull. Earthq. Eng. 2014, 12, 217–235. [Google Scholar] [CrossRef]
- CEN. CEN/TC 250/SC 8 Eurocode 8: Earthquake Resistance Design of Structures Working Draft 18.02.2021; CEN: Brussels, Belgium, 2021. [Google Scholar]
- Arion, C.; Calarasu, E.; Neagu, C. Evaluation Of Bucharest Soil Liquefaction Potential. Math. Model. Civ. Eng. 2015, 11, 40–48. [Google Scholar] [CrossRef][Green Version]
- Bala, A.; Hannich, D. Liquefaction Potential Analysis in Bucharest City as a Result of the Ground Shaking during Strong Vrancea Earthquakes. Athens J. Technol. Eng. AJTE 2021, 8, 113–138. [Google Scholar] [CrossRef]
- Stãnciucu, M. A Brief Method for Evaluation of the Liquefaction Susceptibility in Bucharest Area. In Proceedings of the Engineering Geology for Society and Territory—Volume 5; Lollino, G., Manconi, A., Guzzetti, F., Culshaw, M., Bobrowsky, P., Luino, F., Eds.; Springer International Publishing: Cham, Switzerland, 2015; pp. 1183–1186. [Google Scholar]
- Calarasu, E. Microzonation of Local Soil Conditions for Bucharest and Its Metropolitan Area with Applications for the Evaluation of Seismic Risk; Technical University of Civil Engineering Bucharest: Bucharest, Romania, 2012. [Google Scholar]
- MDRAP. Code for Seismic Design—Part I—Design Prescriptions for Buildings; MDRAP: Bucharest, Romania, 2013.
- Pavel, F.; Vacareanu, R.; Douglas, J.; Radulian, M.; Cioflan, C.; Barbat, A. An Updated Probabilistic Seismic Hazard Assessment for Romania and Comparison with the Approach and Outcomes of the SHARE Project. Pure Appl. Geophys. 2016, 173, 1881–1905. [Google Scholar] [CrossRef]
- Mihu, P. Contributions to the Study of Liquefaction Potential Using Cone Penetration; Polytehnica University of Timisoara: Timisoara, Romania, 2007. [Google Scholar]
- Pavel, F.; Vacareanu, R. Ground Motion Simulations for Seismic Stations in Southern and Eastern Romania and Seismic Hazard Assessment. J. Seismol. 2017, 21, 1023–1037. [Google Scholar] [CrossRef]
- Pavel, F. Investigation on the Variability of Simulated and Observed Ground Motions for Bucharest Area. J. Earthq. Eng. 2018, 22, 1737–1757. [Google Scholar] [CrossRef]
- Pavel, F.; Vacareanu, R.; Pitilakis, K.; Anastasiadis, A. Investigation on Site-Specific Seismic Response Analysis for Bucharest (Romania). Bull. Earthq. Eng. 2020, 18, 1933–1953. [Google Scholar] [CrossRef]
- Seed, H.B.; Idriss, I.M. Influence of Soil Conditions on Building Damage Potential during Earthquakes. J. Struct. Div. 1971, 97, 639–663. [Google Scholar] [CrossRef]
- Youd, T.L.; Idriss, I.M.; Andrus, R.D.; Arango, I.; Castro, G.; Christian, J.T.; Dobry, R.; Finn, W.D.L.; Harder, L.F.; Hynes, M.E.; et al. Liquefaction Resistance of Soils: Summary Report from the 1996 NCEER and 1998 NCEER/NSF Workshops on Evaluation of Liquefaction Resistance of Soils. J. Geotech. Geoenviron. Eng. 2001, 127, 817–833. [Google Scholar] [CrossRef]
- Boulanger, R.W.; Idriss, I.M. CPT and SPT Based Liquefaction Triggering Procedures; University of California, Department of Civil and Environmental Engineering: Davis, CA, USA, 2014. [Google Scholar]
- Boulanger, R.W.; Idriss, I.M. Magnitude Scaling Factors in Liquefaction Triggering Procedures. Soil Dyn. Earthq. Eng. 2015, 79, 296–303. [Google Scholar] [CrossRef]
- Seed, H.B.; Idriss, I.M. Ground Motions and Soil Liquefaction during Earthquakes; EERI: Oakland, CA, USA, 1982. [Google Scholar]
- Idriss, I.M. An Update to the Seed-Idriss Simplified Procedure for Evaluating Liquefaction Potential. In Proceedings of the TRB Workshop on New Approaches to Liquefaction, Washington, DC, USA, 10 January 1999; Federal Highway Administration: Washington, DC, USA, 1999. [Google Scholar]
- Arango, I. Magnitude Scaling Factors for Soil Liquefaction Evaluations. J. Geotech. Eng. 1996, 122, 929–936. [Google Scholar] [CrossRef]
- CEN. Eurocode 8: Design of Structures for Earthquake Resistance. In Part 5: Foundations, Retaining Structures and Geotechnical Aspects; European Commission: Bruxelles, Belgium, 2004. [Google Scholar]
Disclaimer/Publisher’s Note: The statements, opinions and data contained in all publications are solely those of the individual author(s) and contributor(s) and not of MDPI and/or the editor(s). MDPI and/or the editor(s) disclaim responsibility for any injury to people or property resulting from any ideas, methods, instructions or products referred to in the content. |
© 2023 by the authors. Licensee MDPI, Basel, Switzerland. This article is an open access article distributed under the terms and conditions of the Creative Commons Attribution (CC BY) license (https://creativecommons.org/licenses/by/4.0/).