
Impacts on Crash Cushions—Analysis of the Safety Performance of Passenger Cars with Improved Safety Equipment Compared with Test Vehicles Based on Assessment Criteria as Defined in EN 1317

Abstract
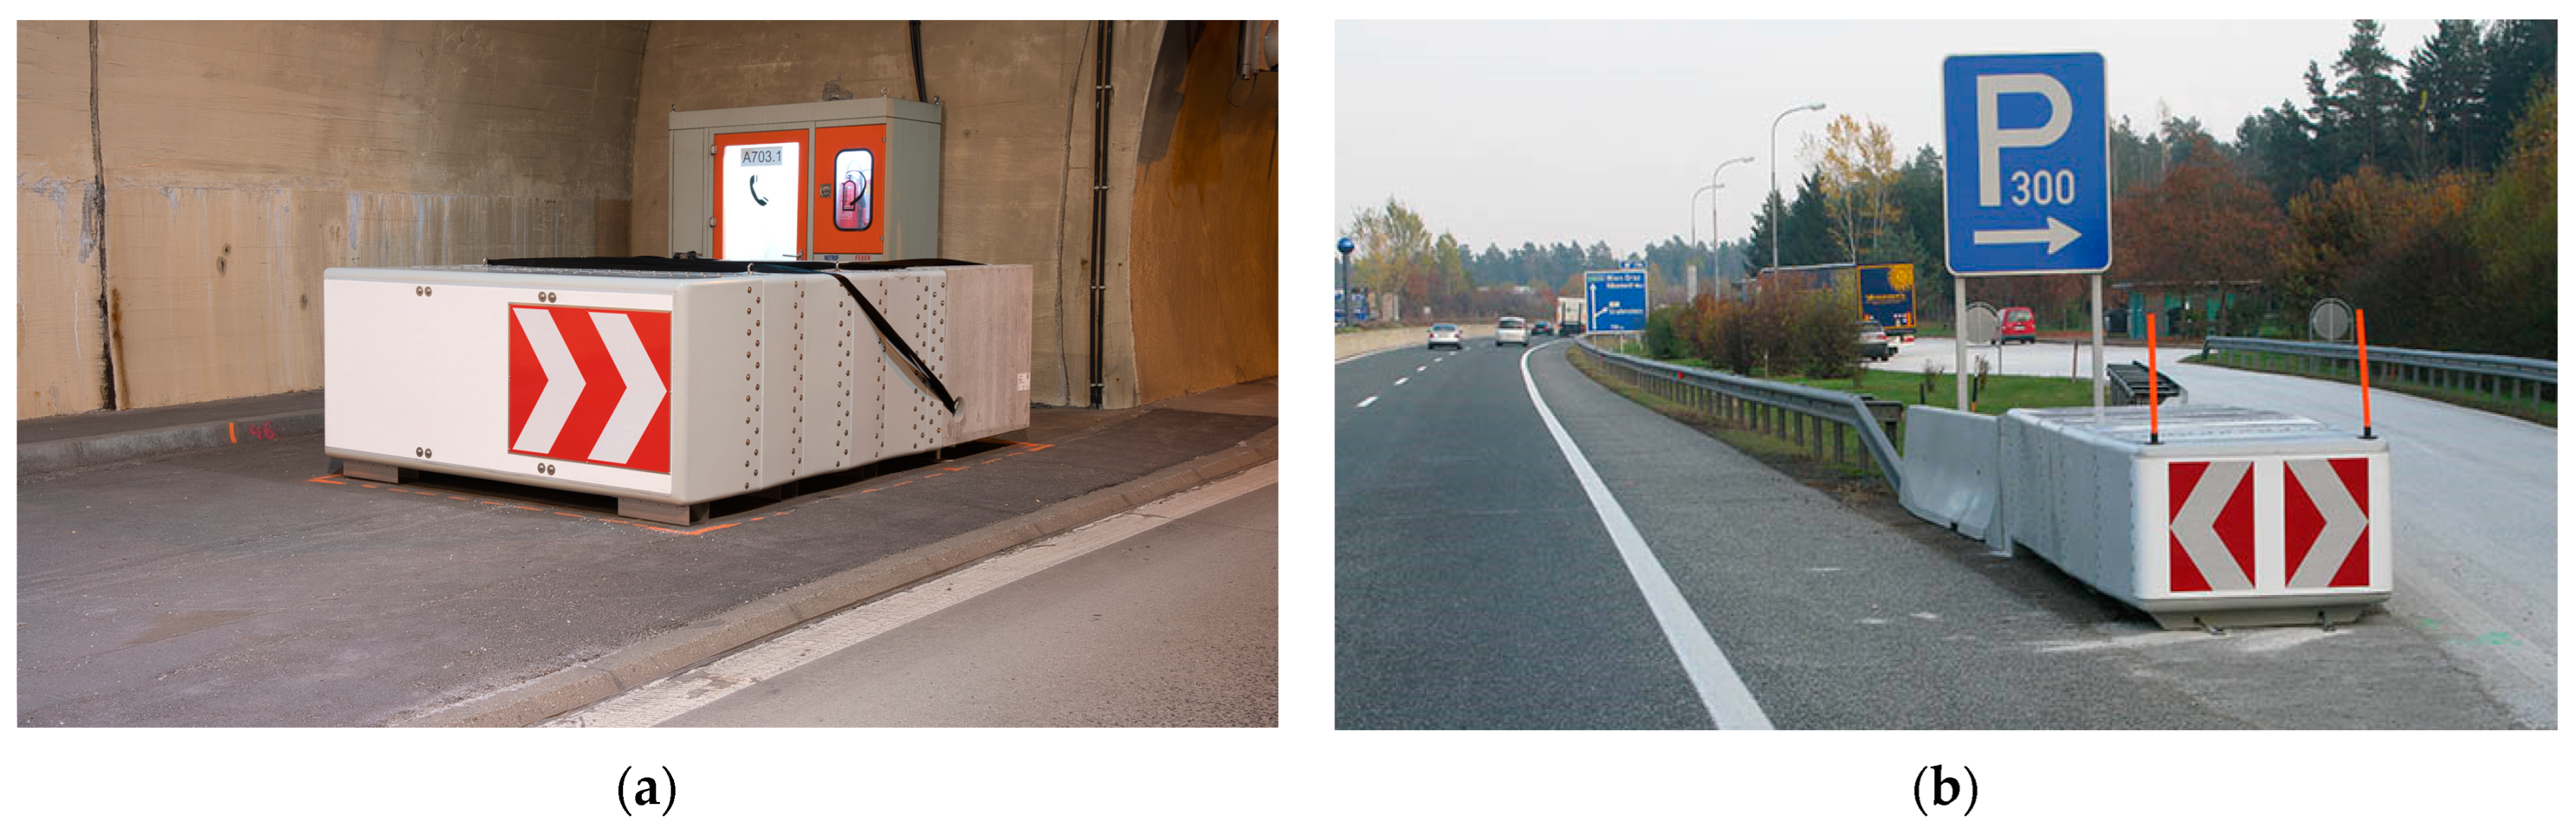
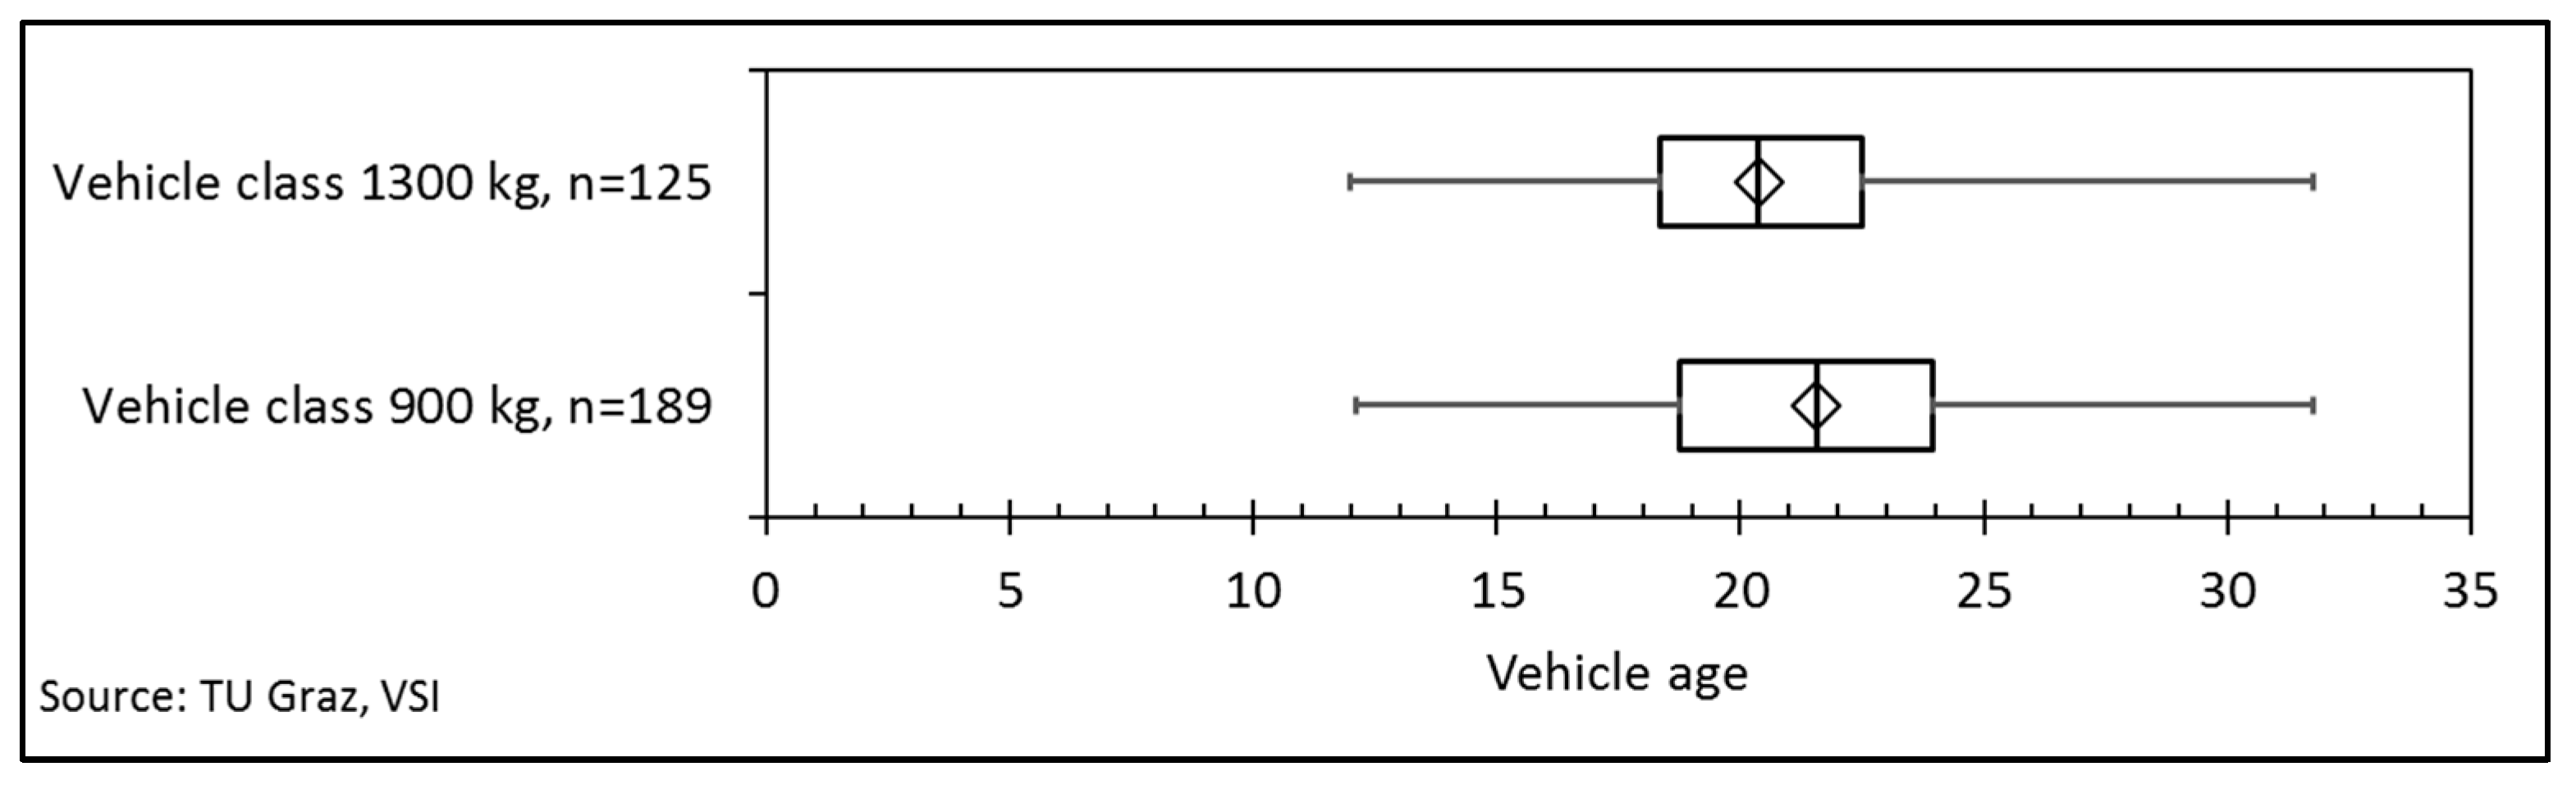
:1. Introduction
2. Materials and Methods
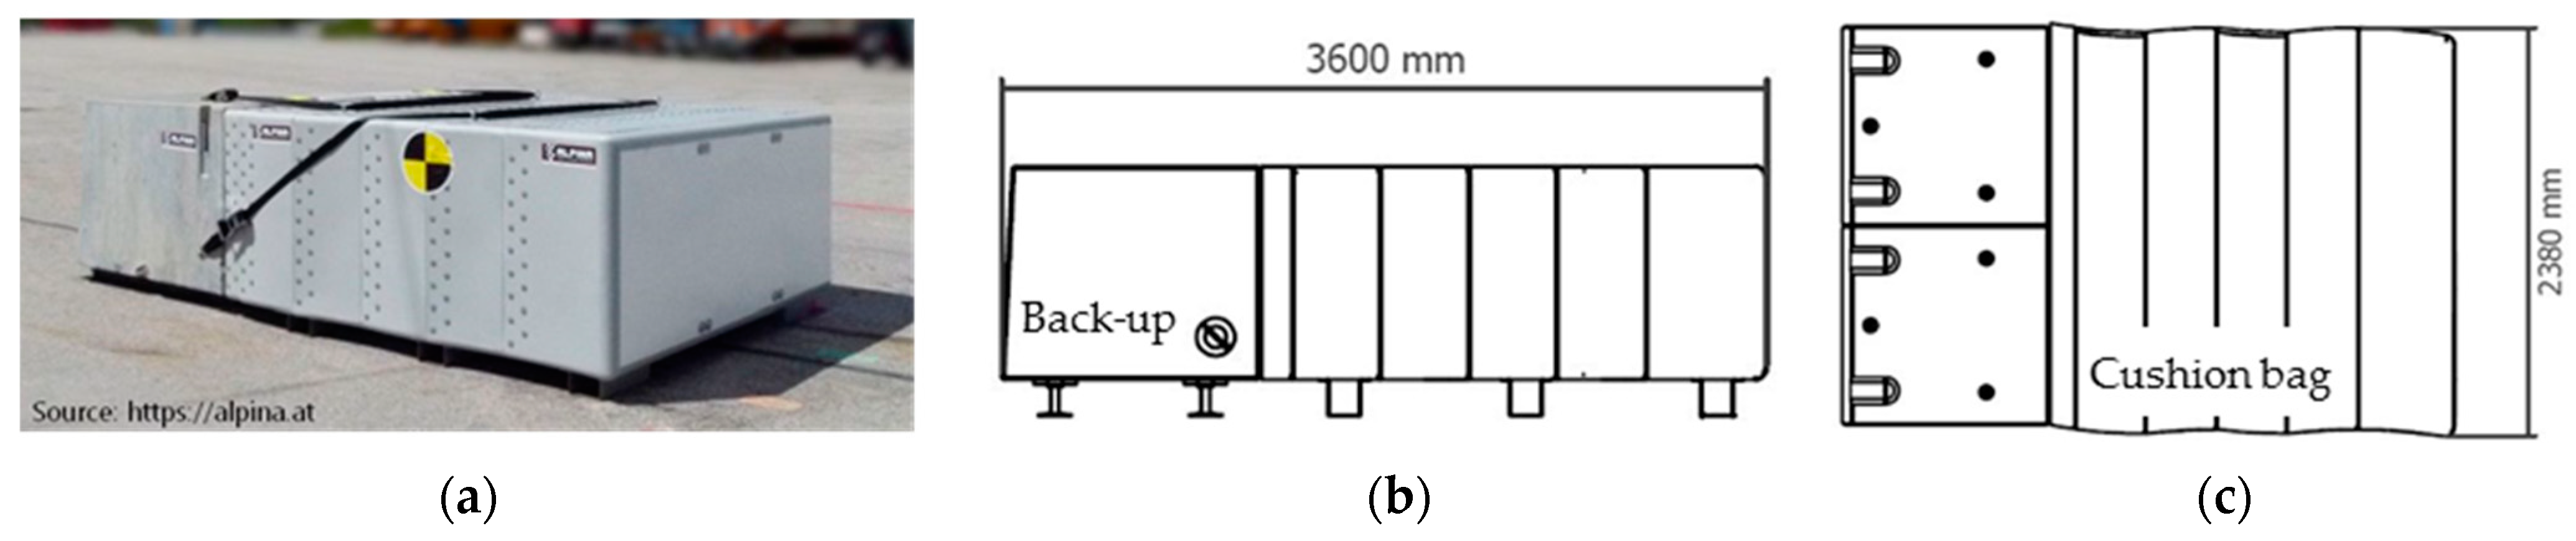
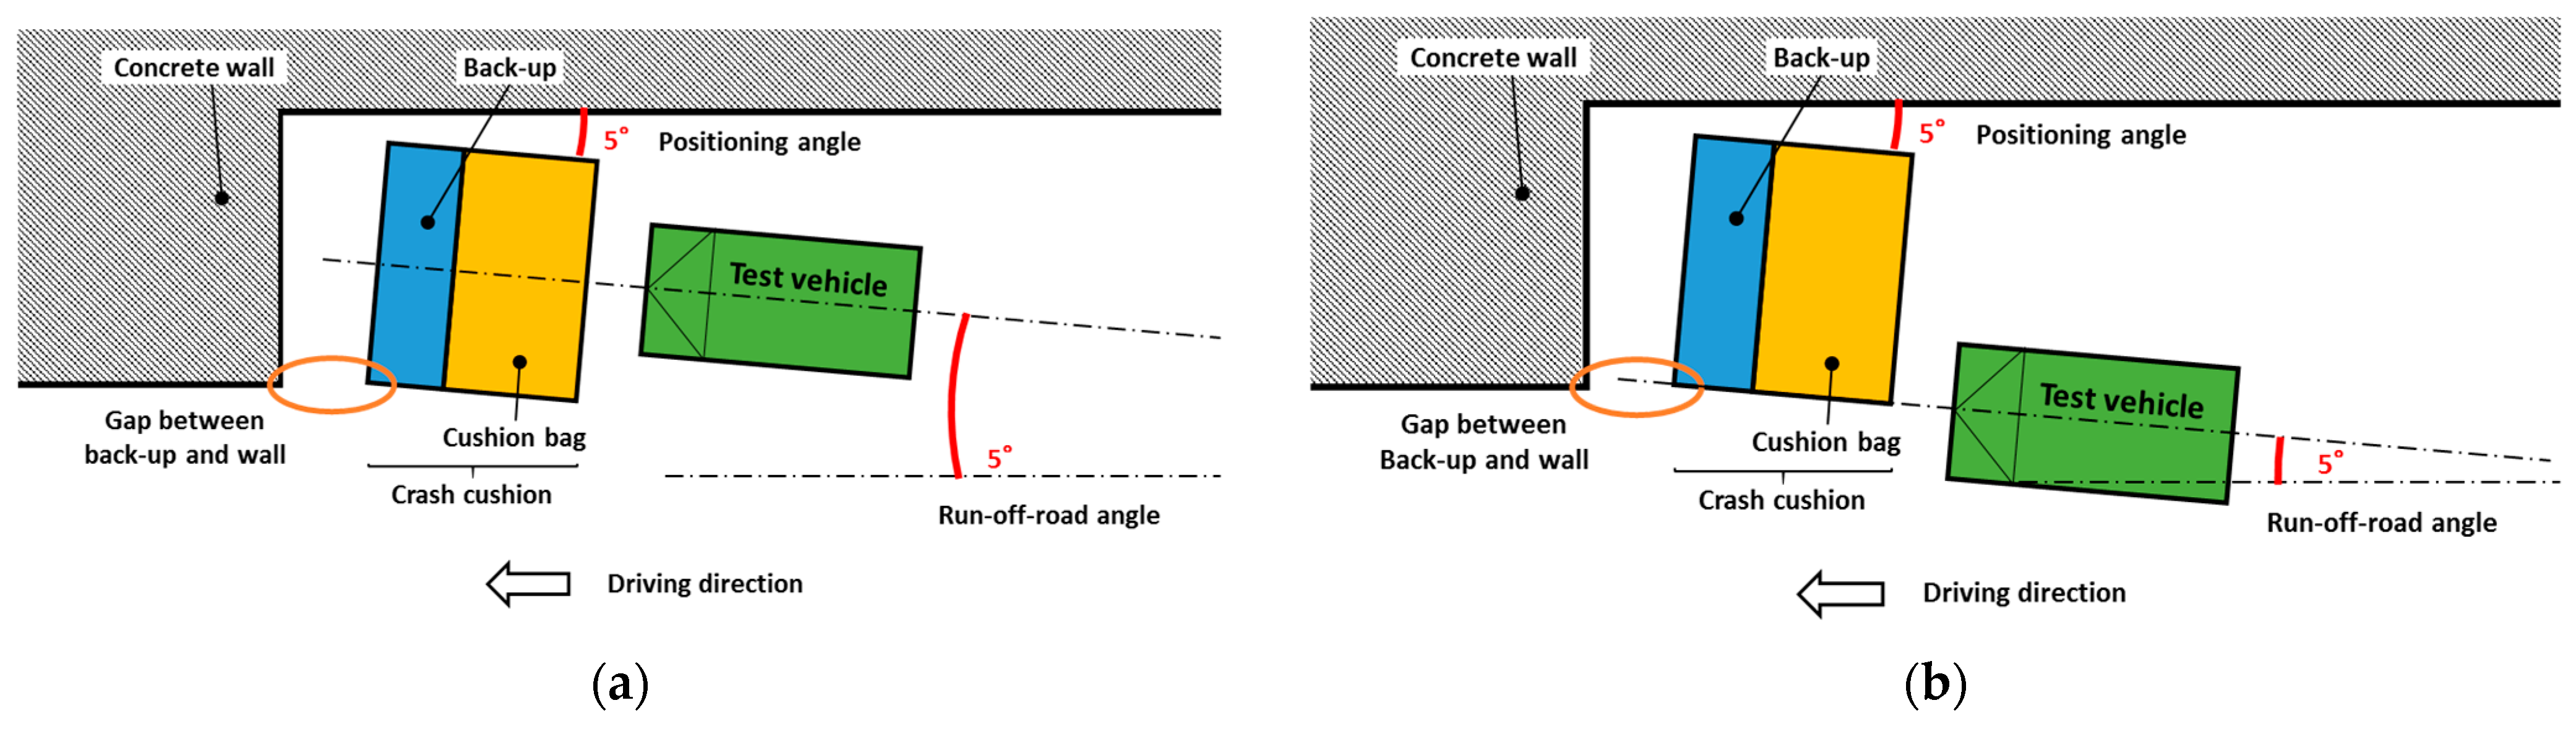
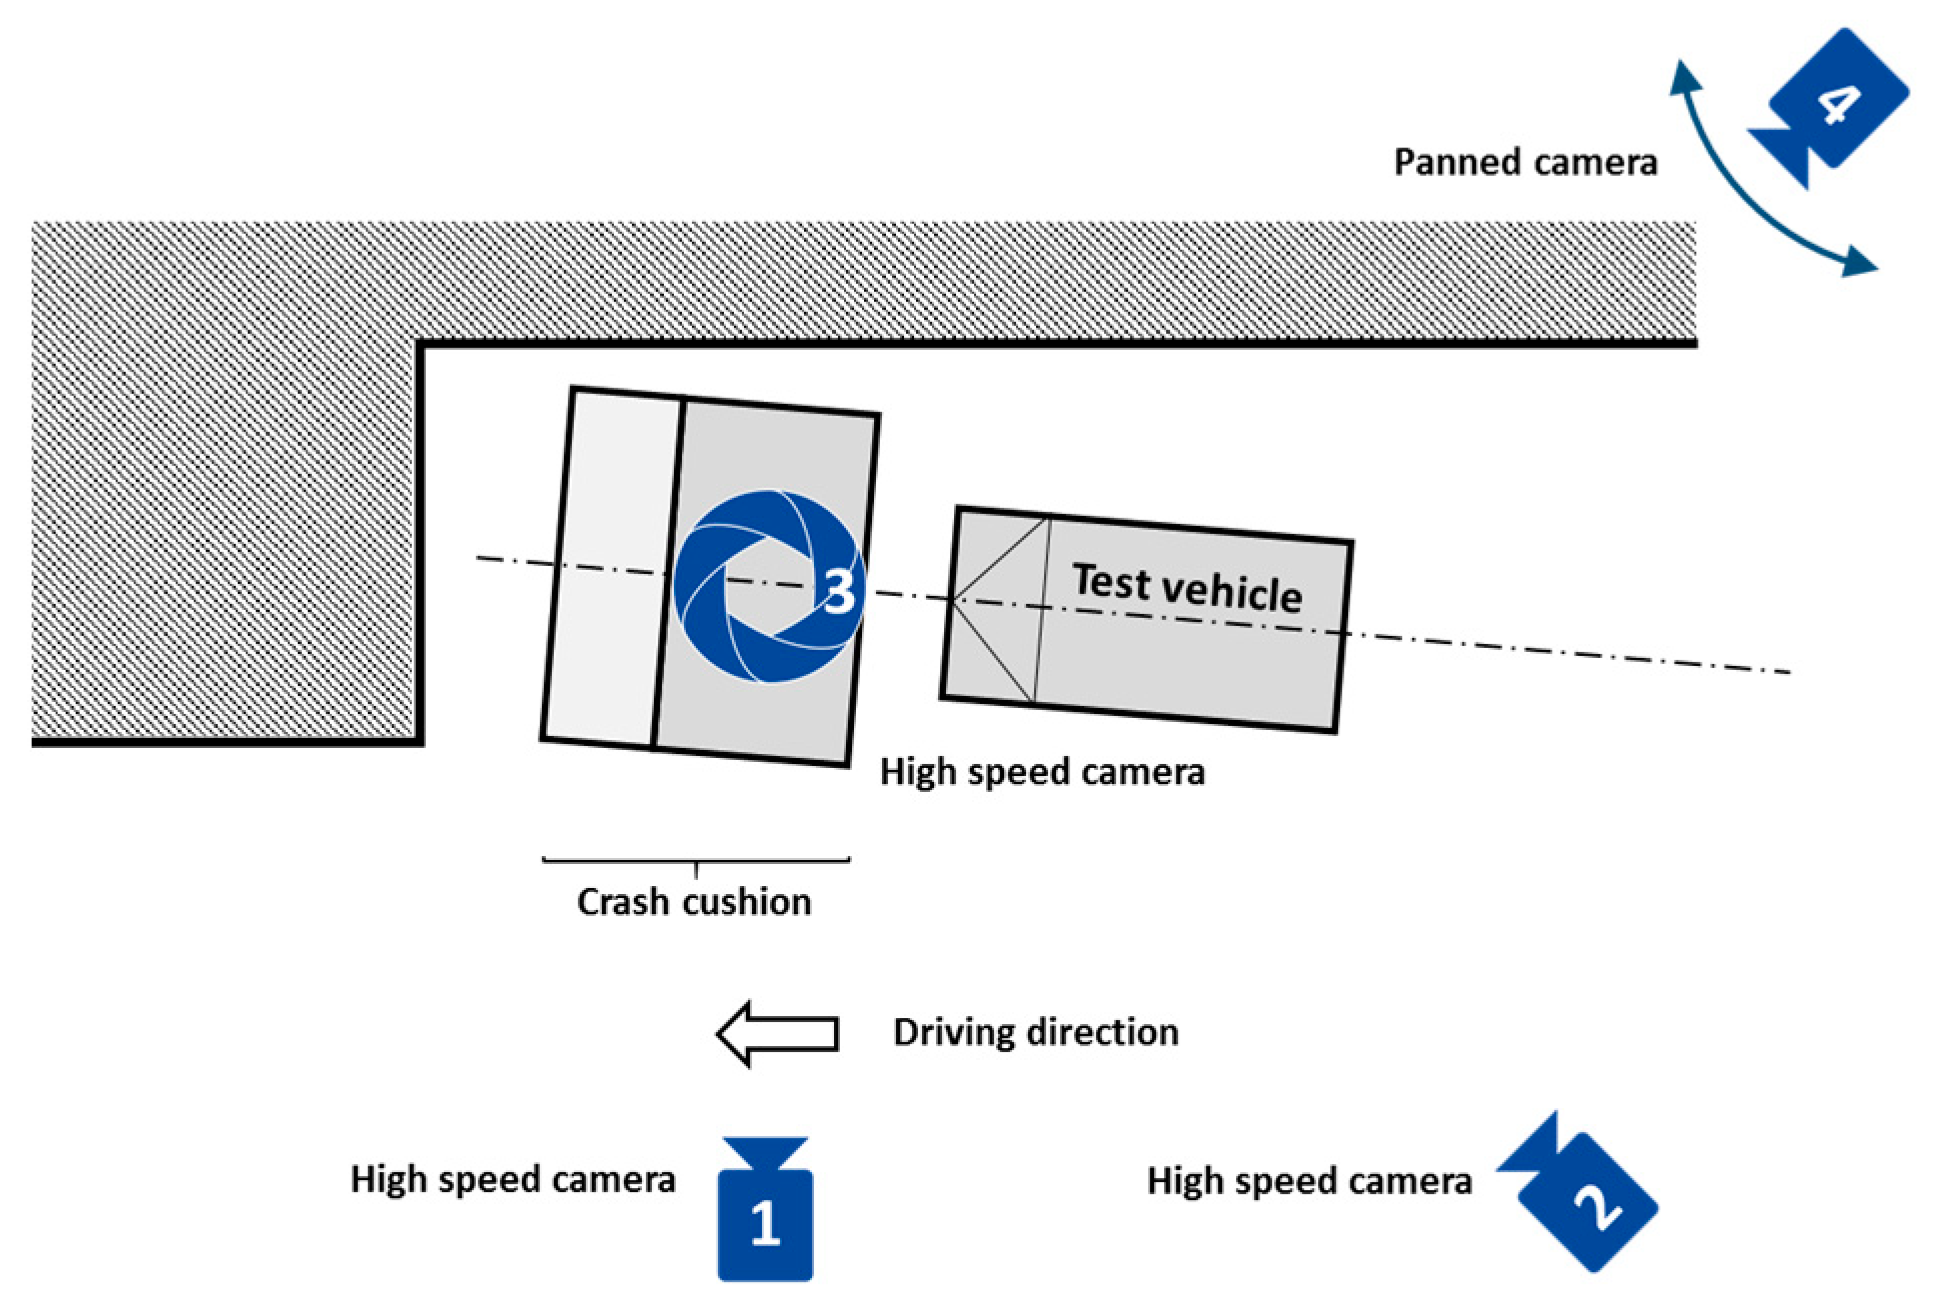
2.1. Experimental Set-Up
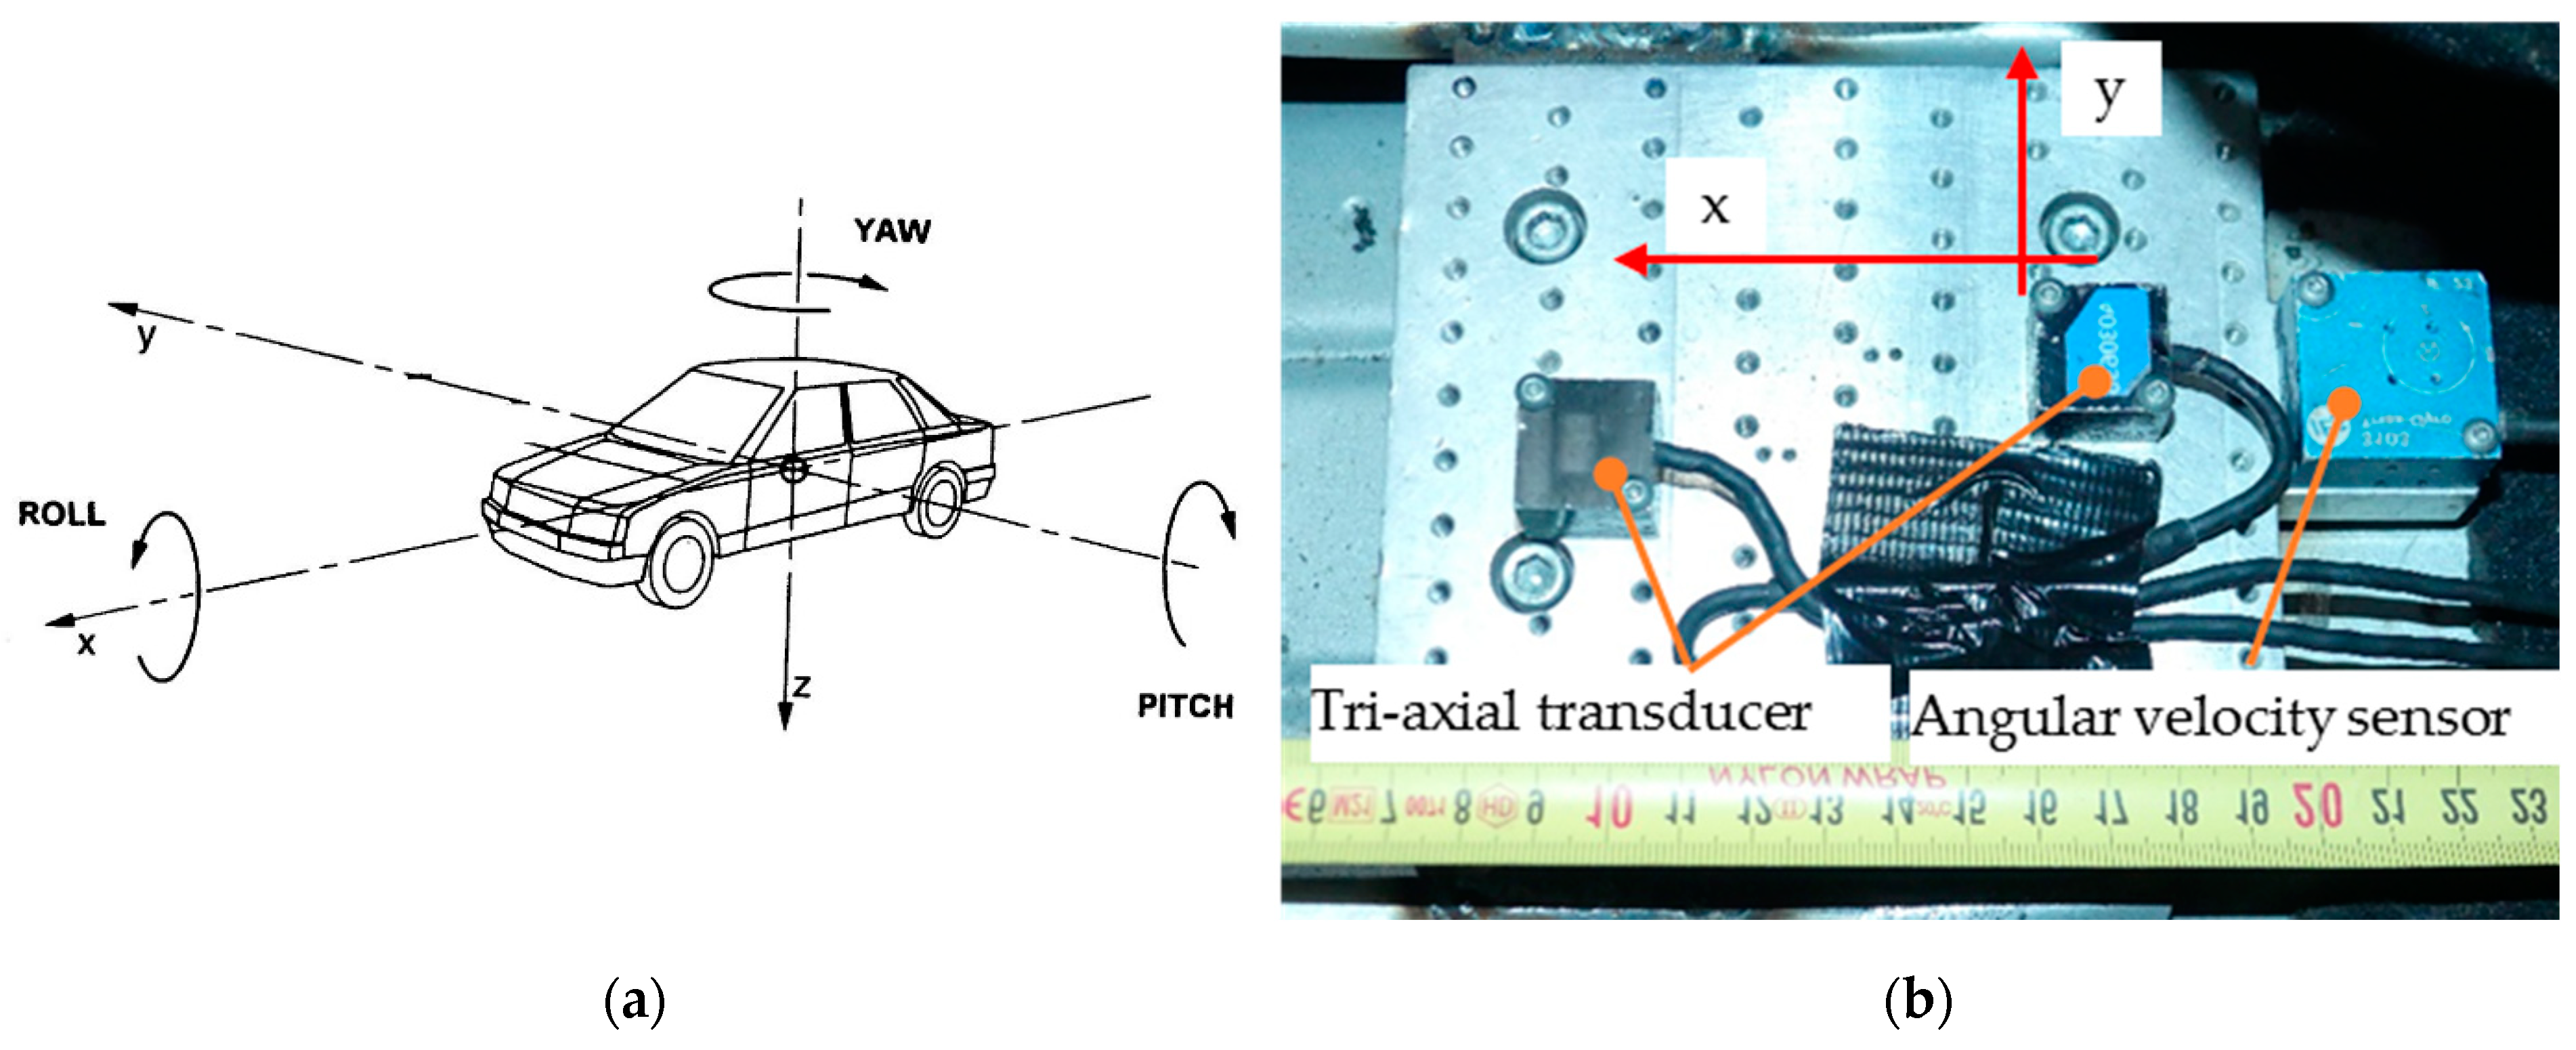
2.2. Data Acquisition
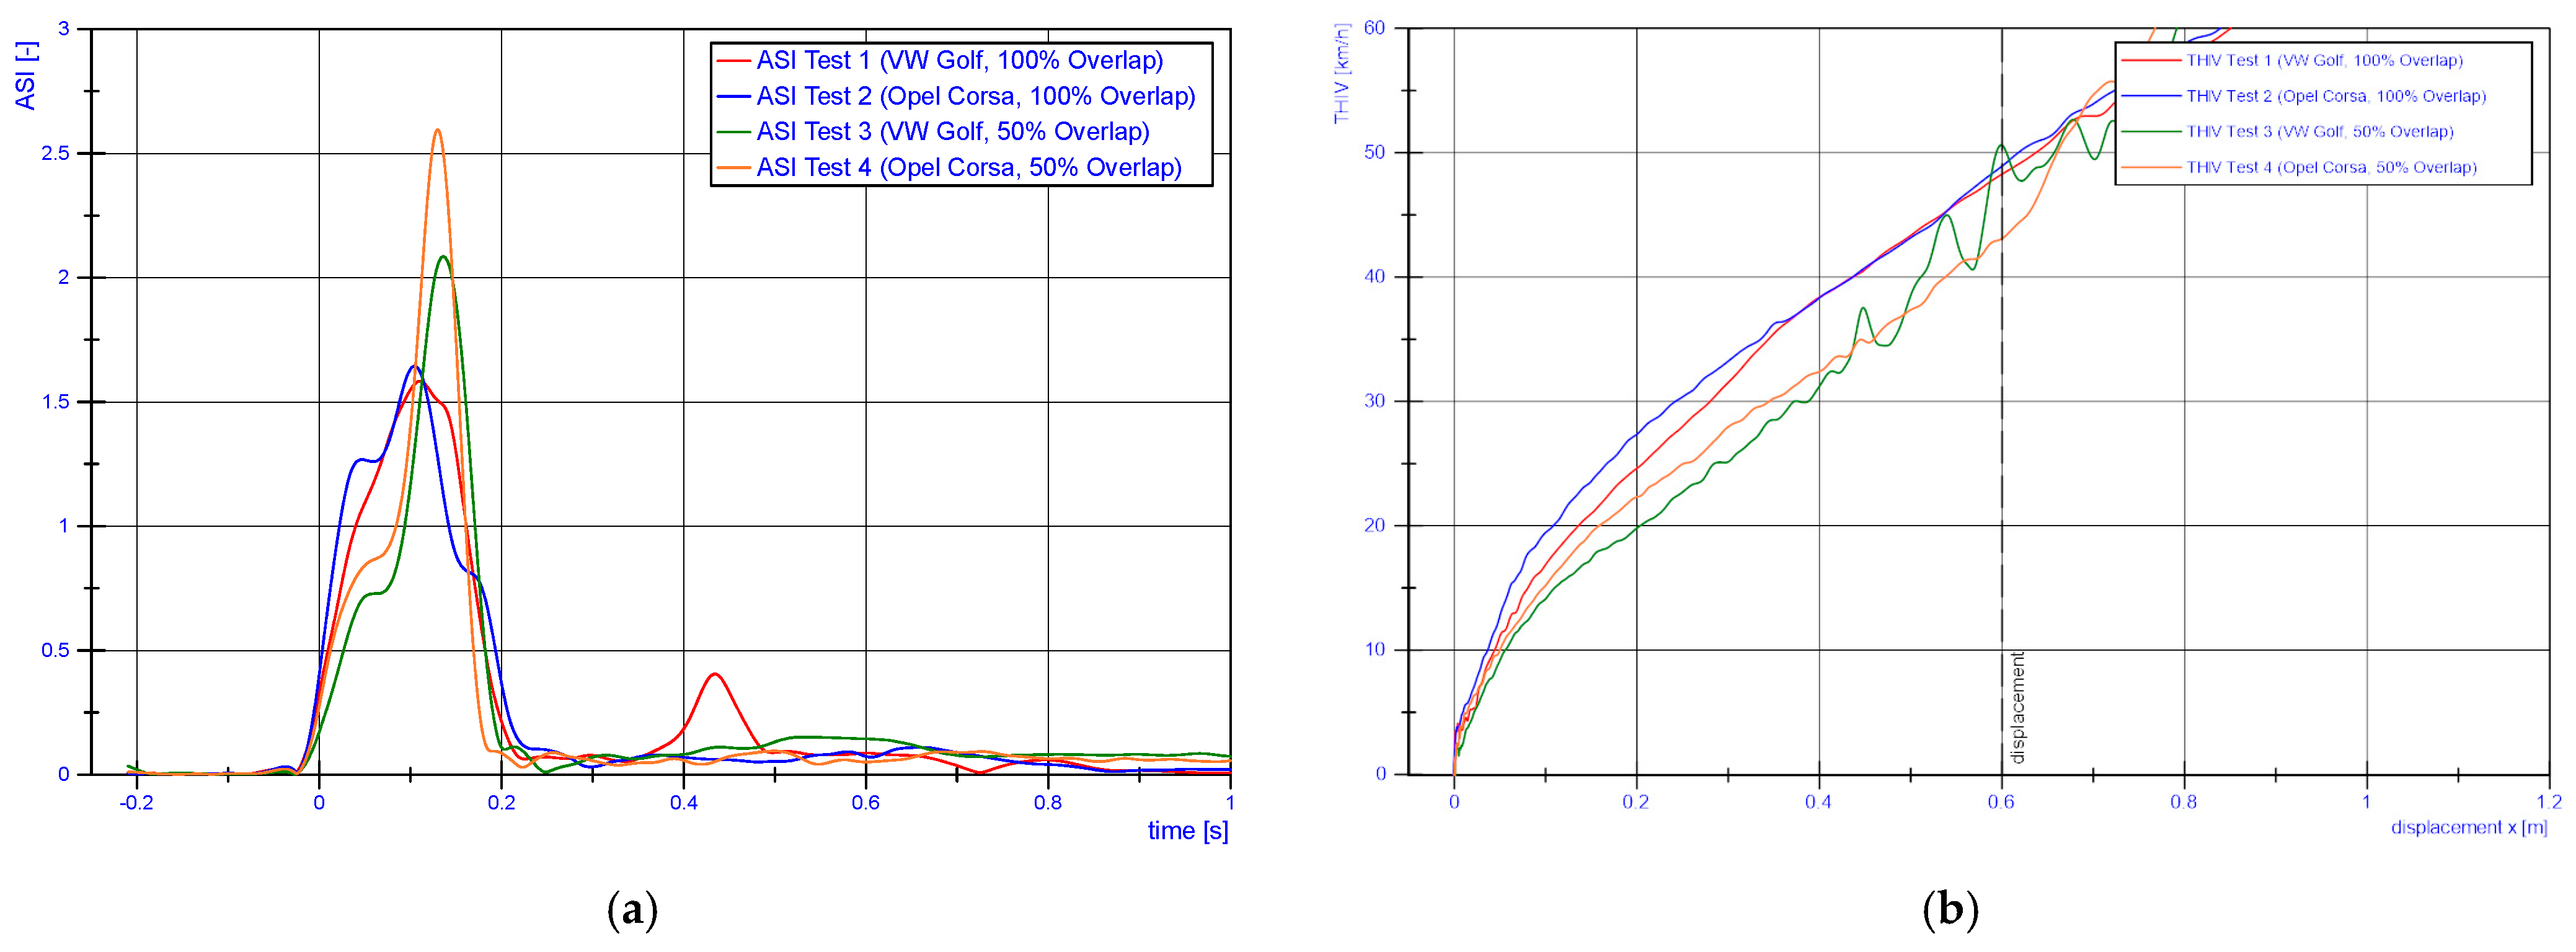
2.3. Assessment
- ASI (Acceleration Severity Index);
- THIV (Theoretical Head Impact Velocity);
- PHD (Post Head Deceleration);
- OIV (Occupant Impact Velocity);
- ORA (Occupant Ride down Acceleration);
- Delta-v (instantaneous change of velocity).
3. Results
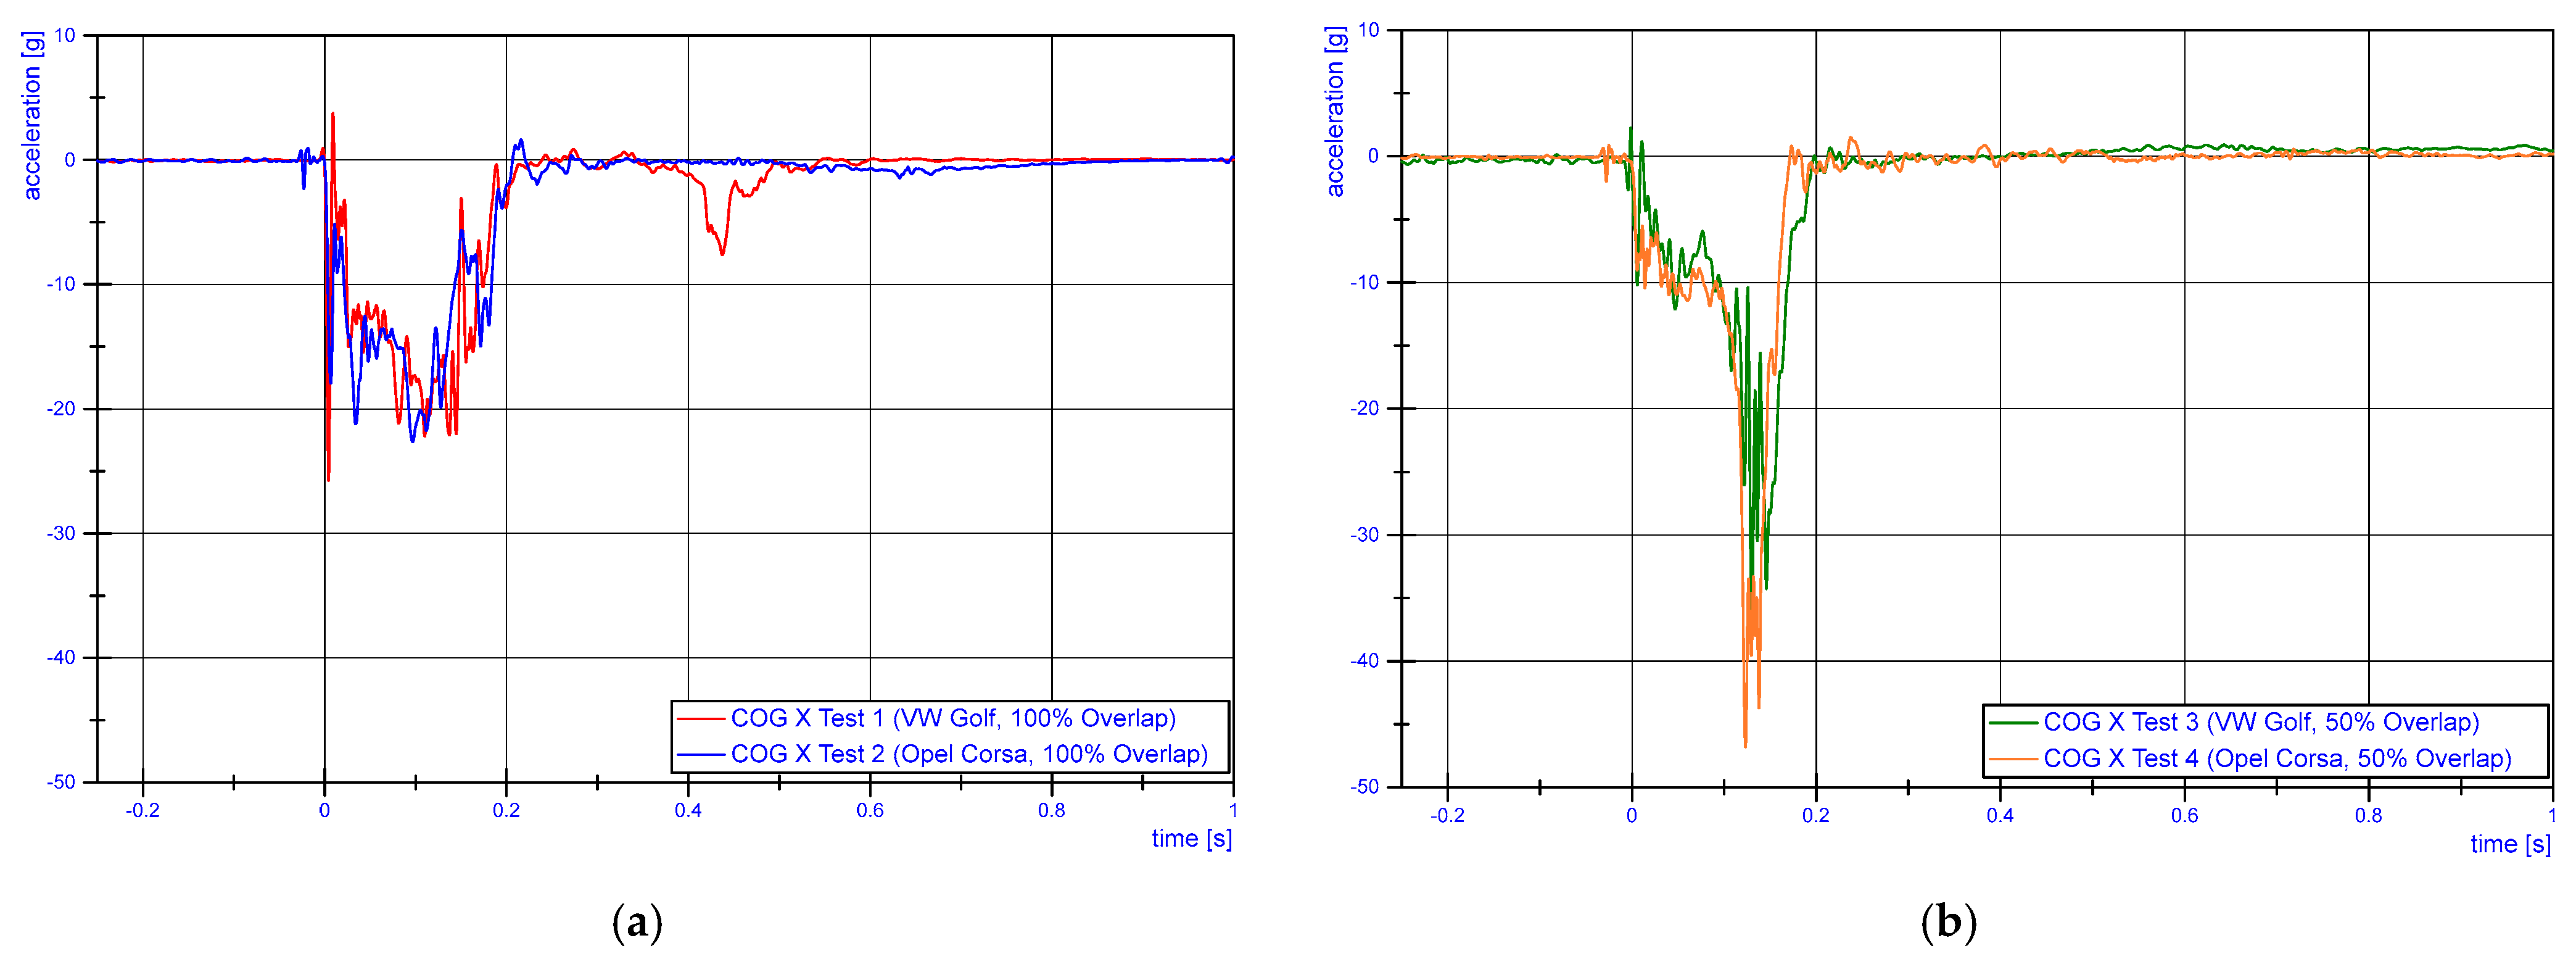
3.1. Case by Case Study
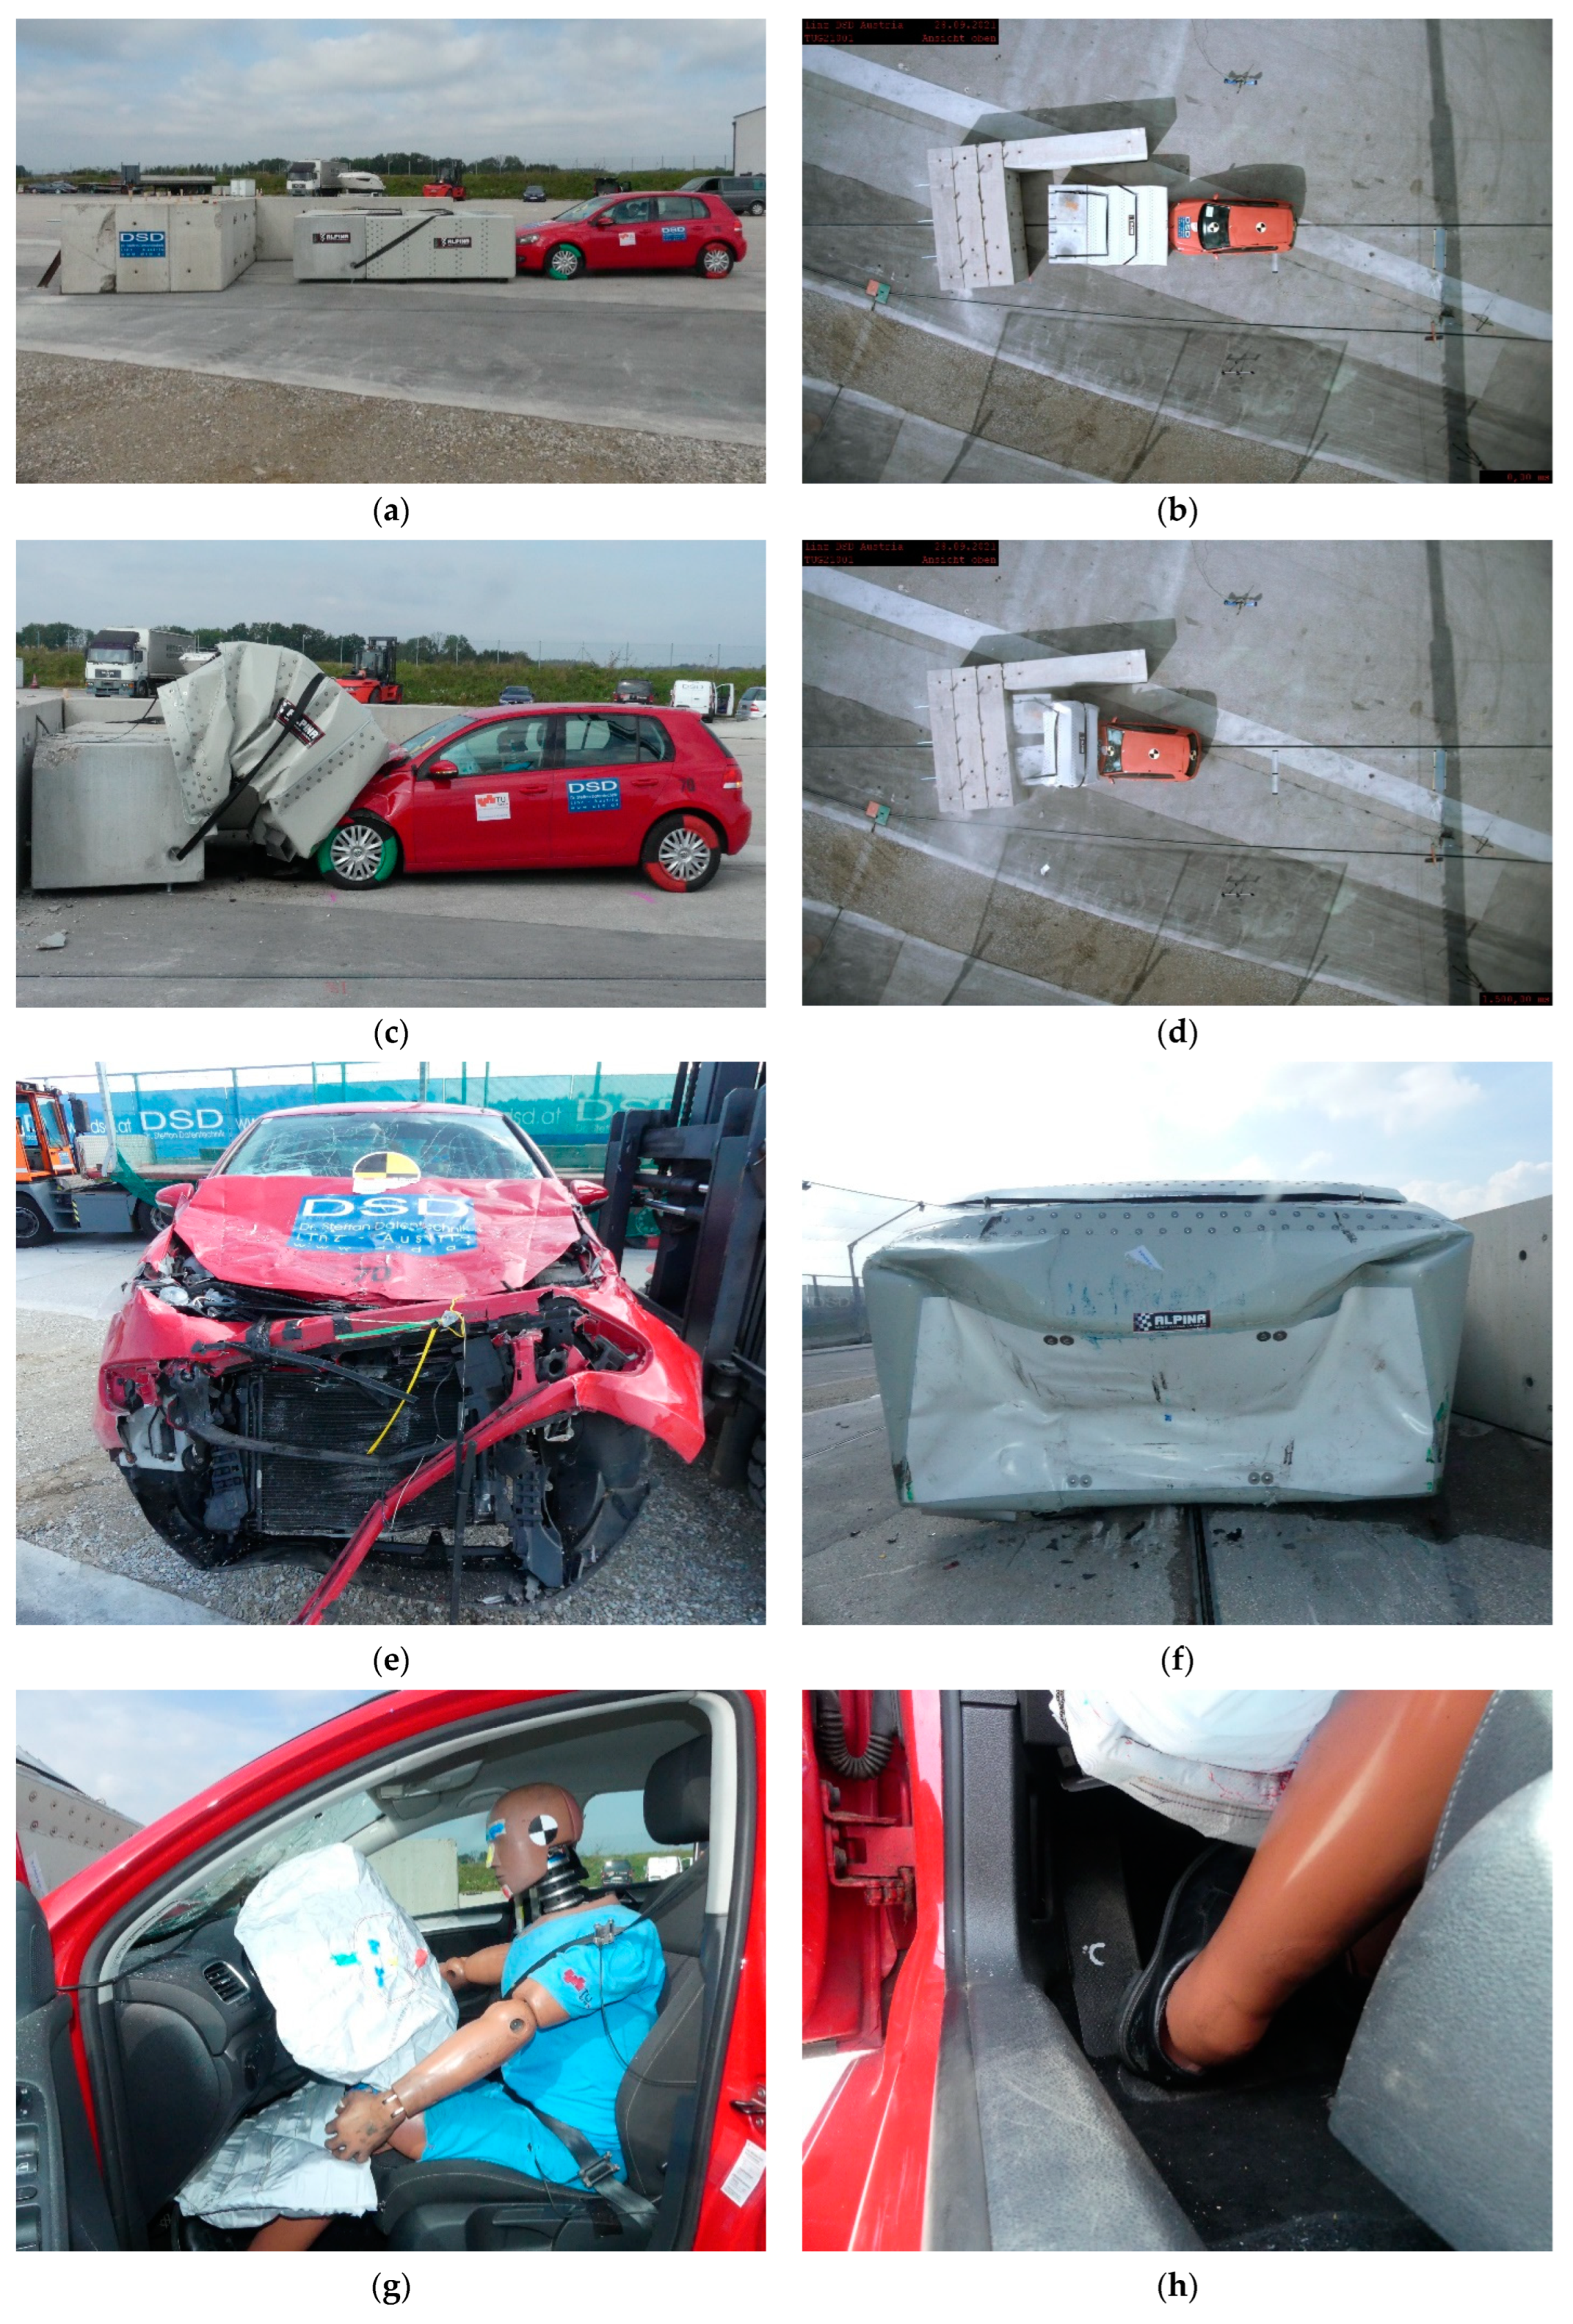
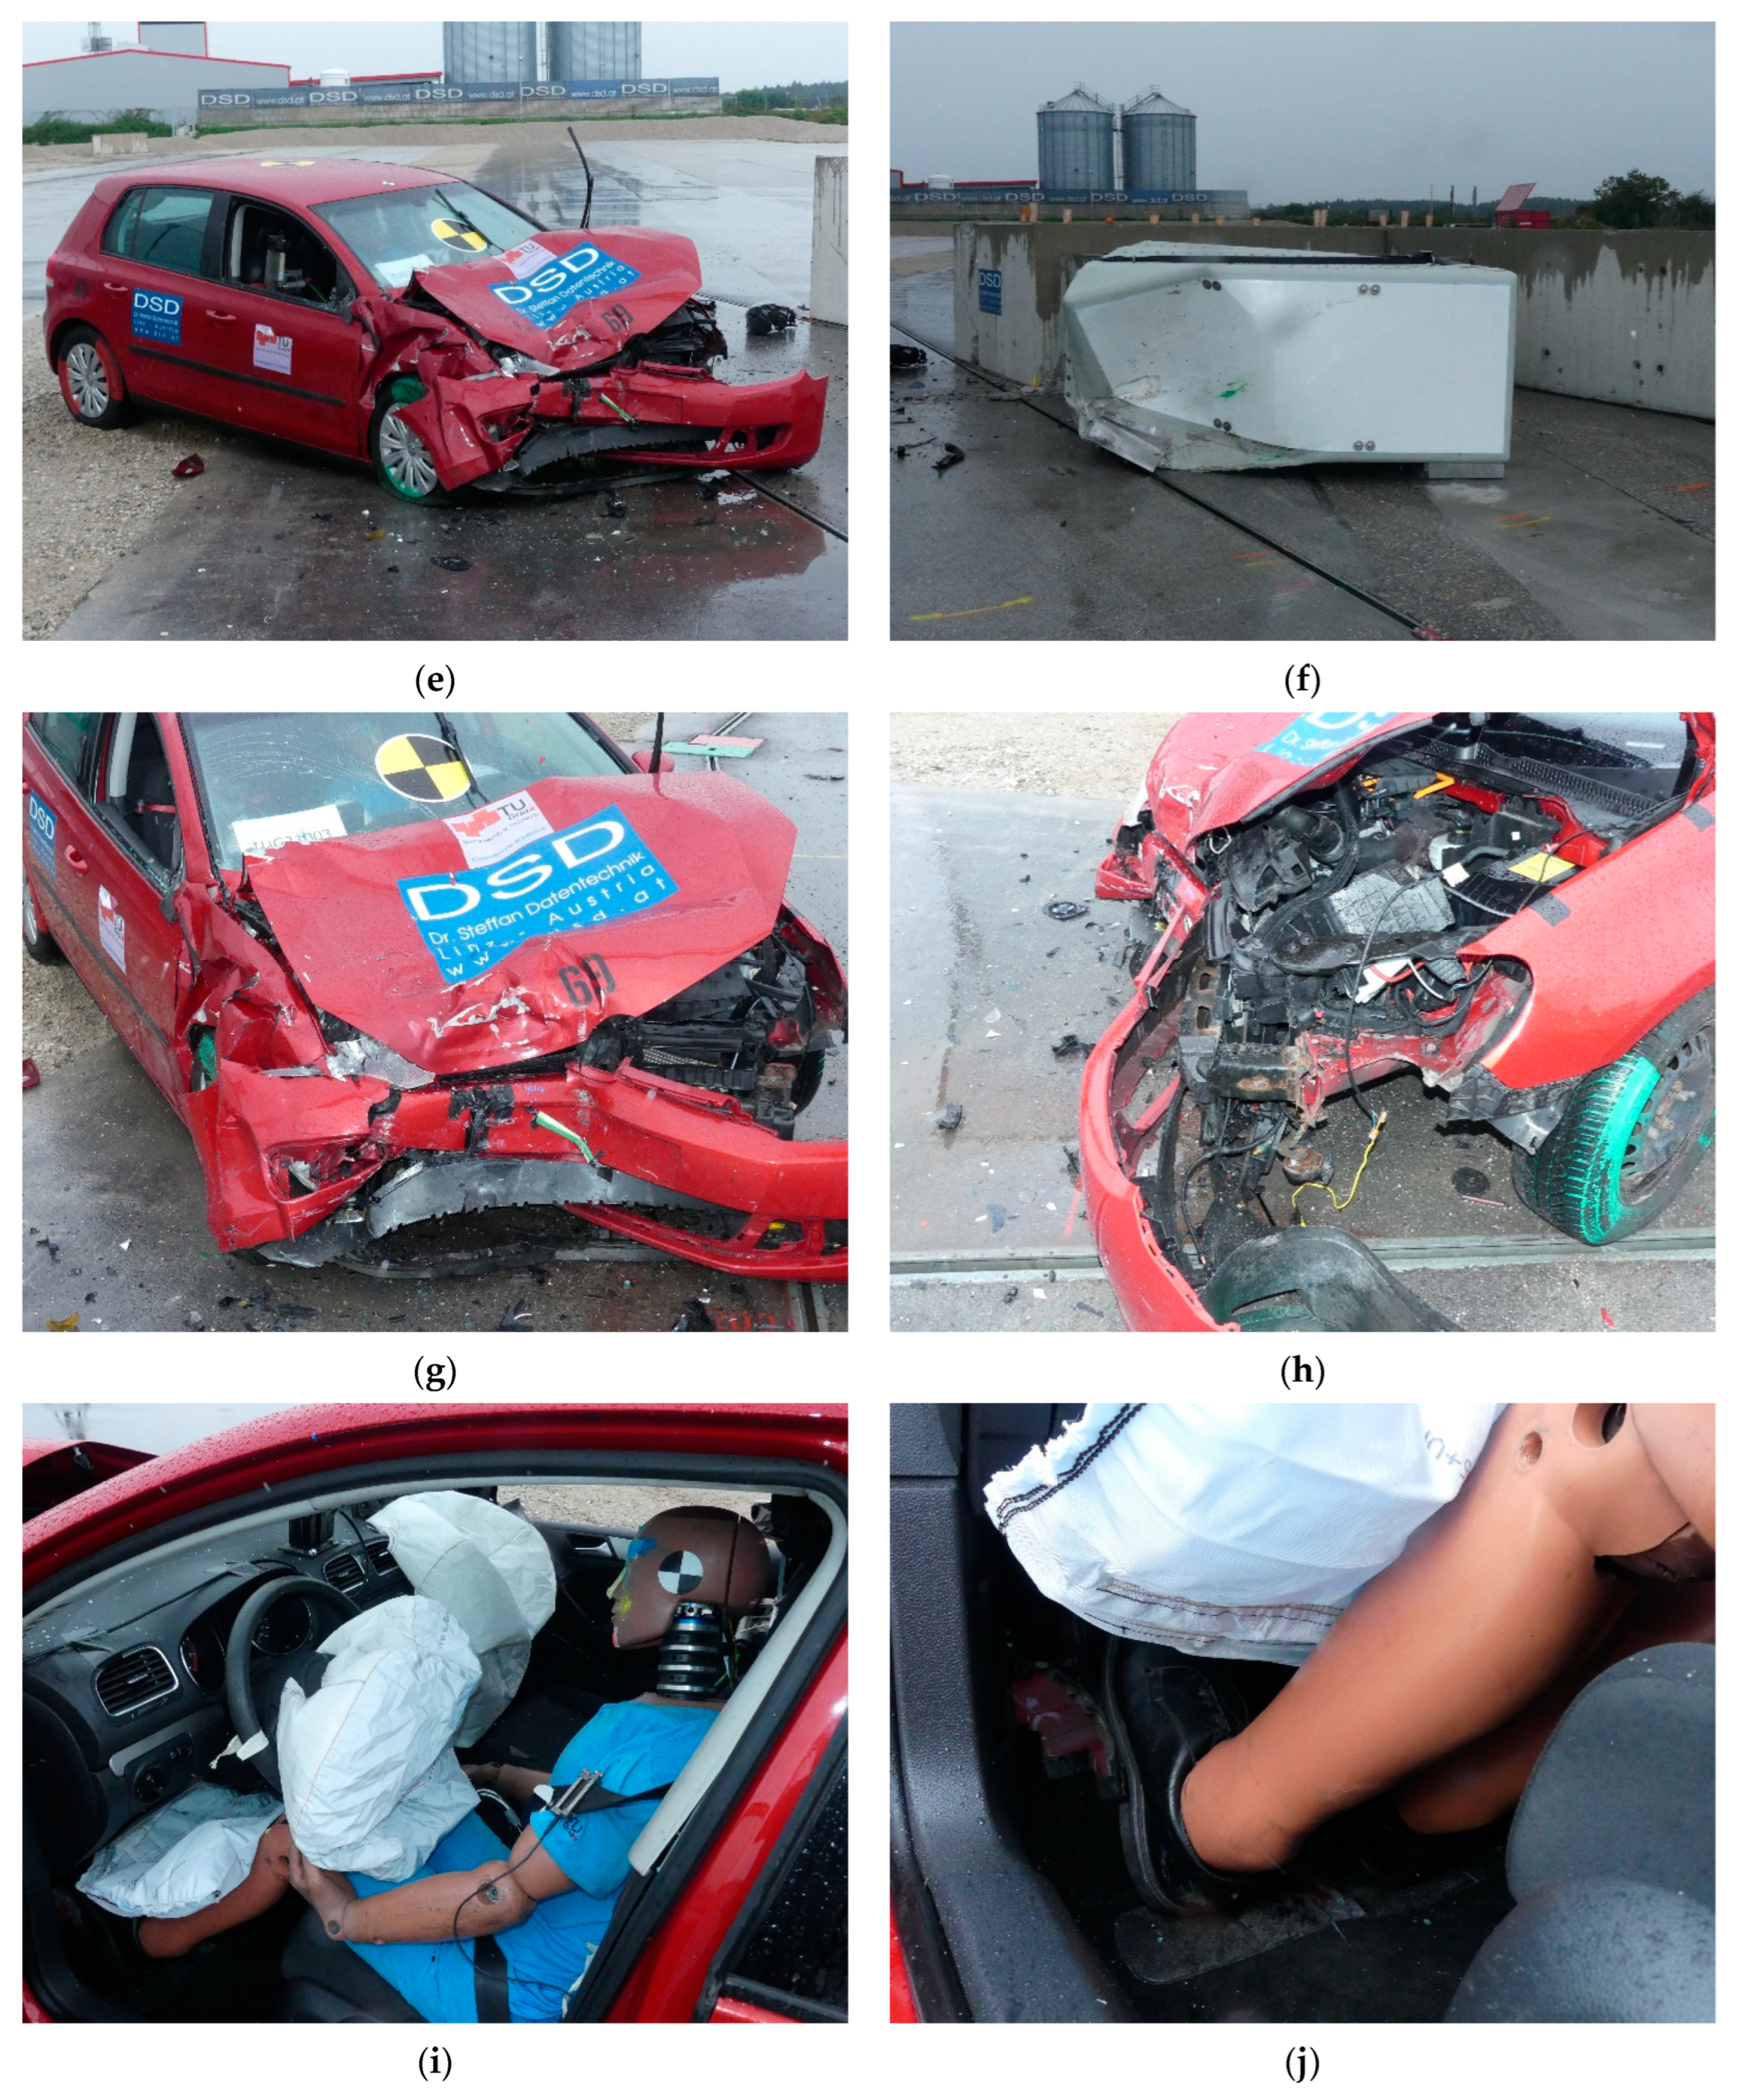
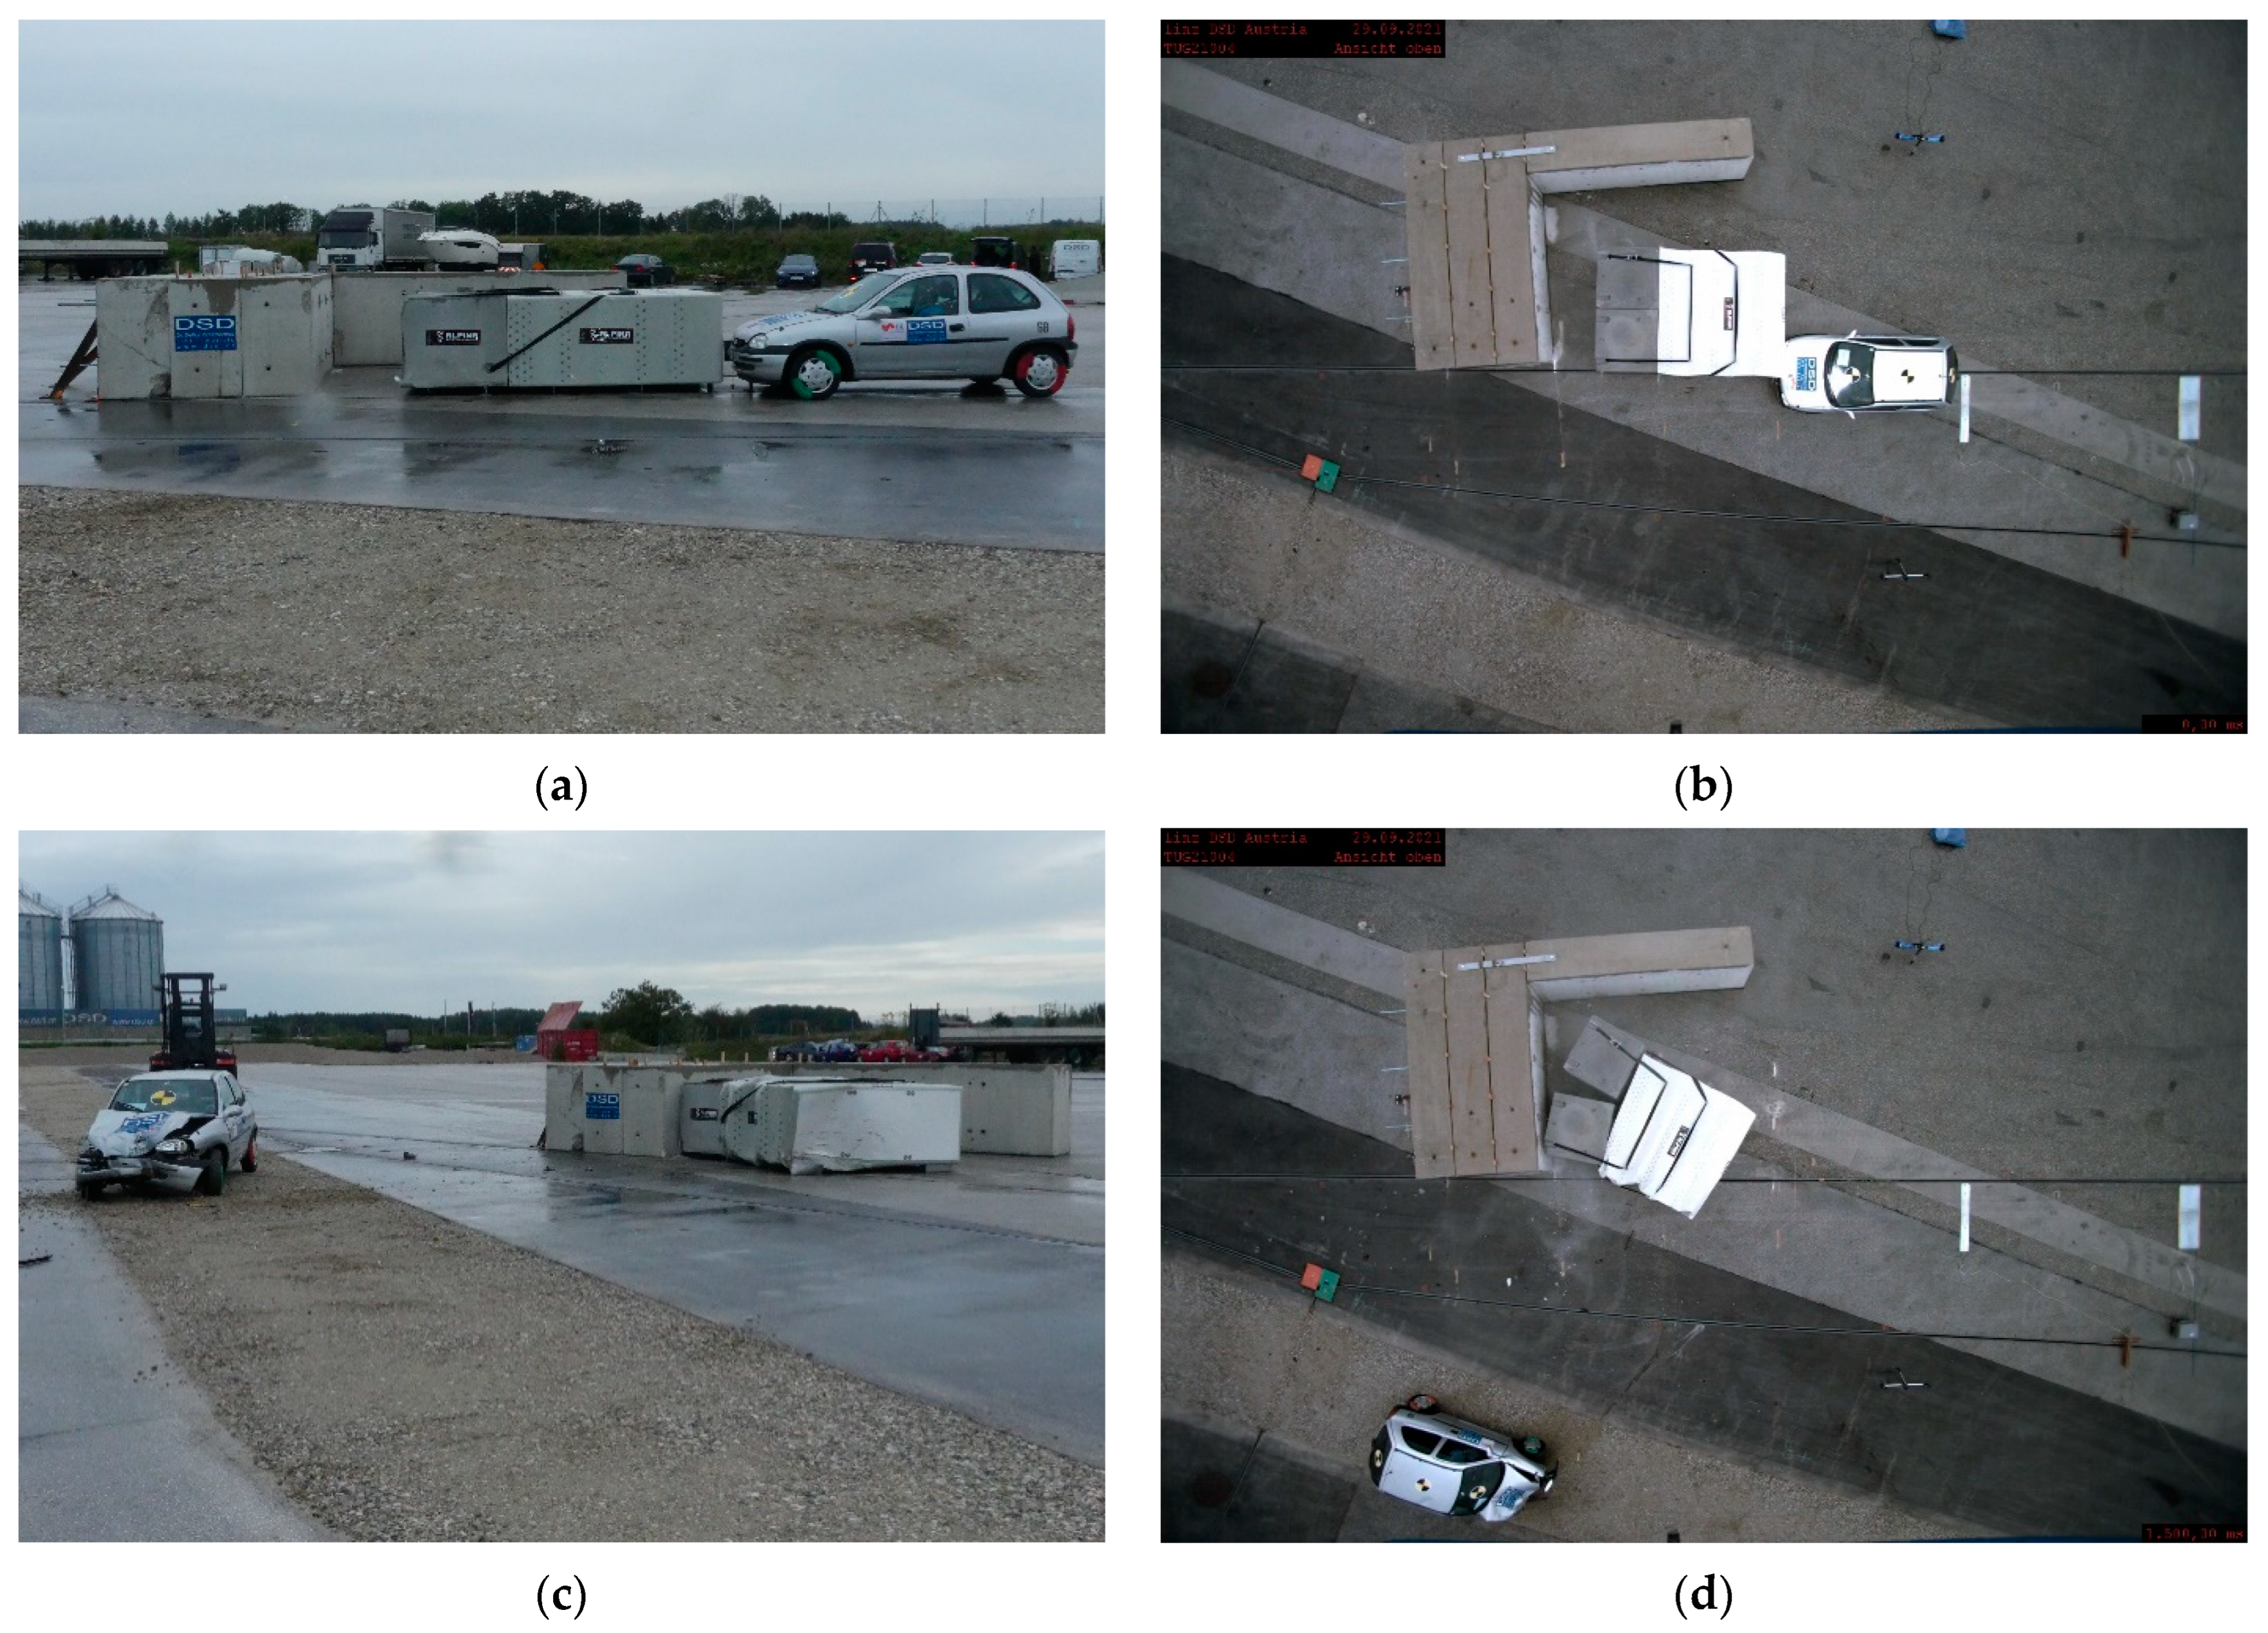
3.1.1. Test 1—VW Golf, Full Overlap Impact
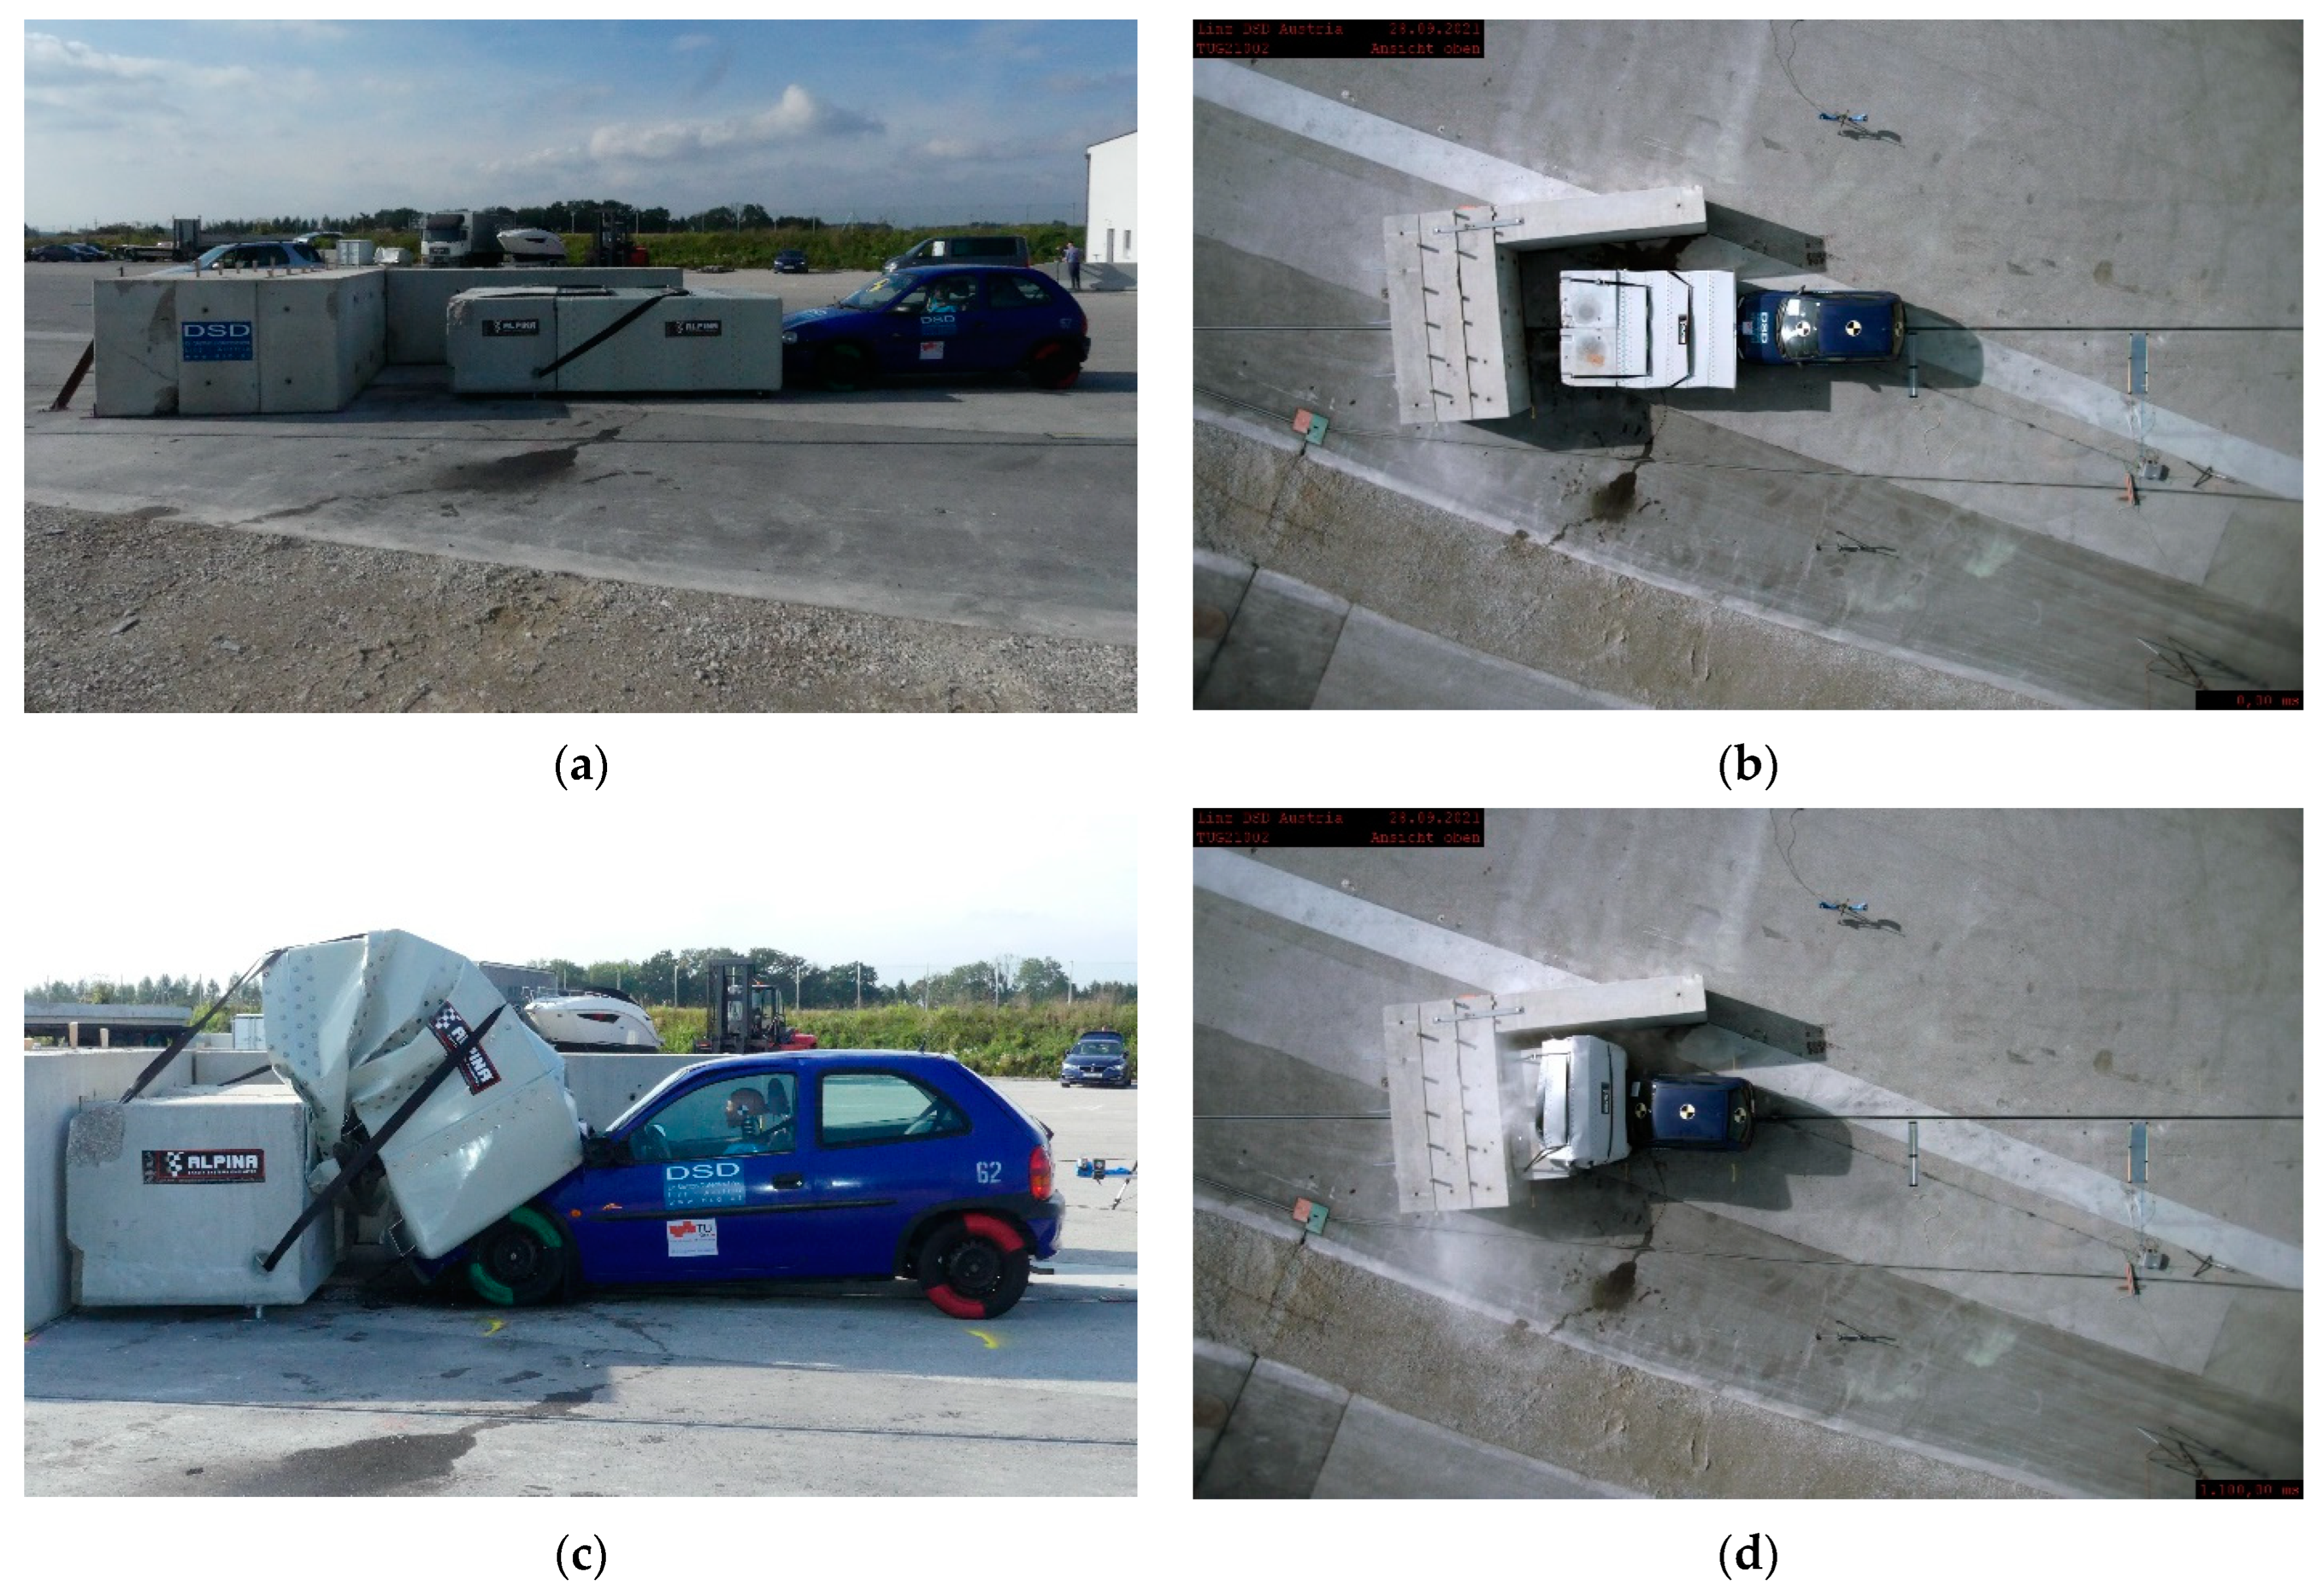
3.1.2. Test 2—Opel Corsa, Full Overlap Impact
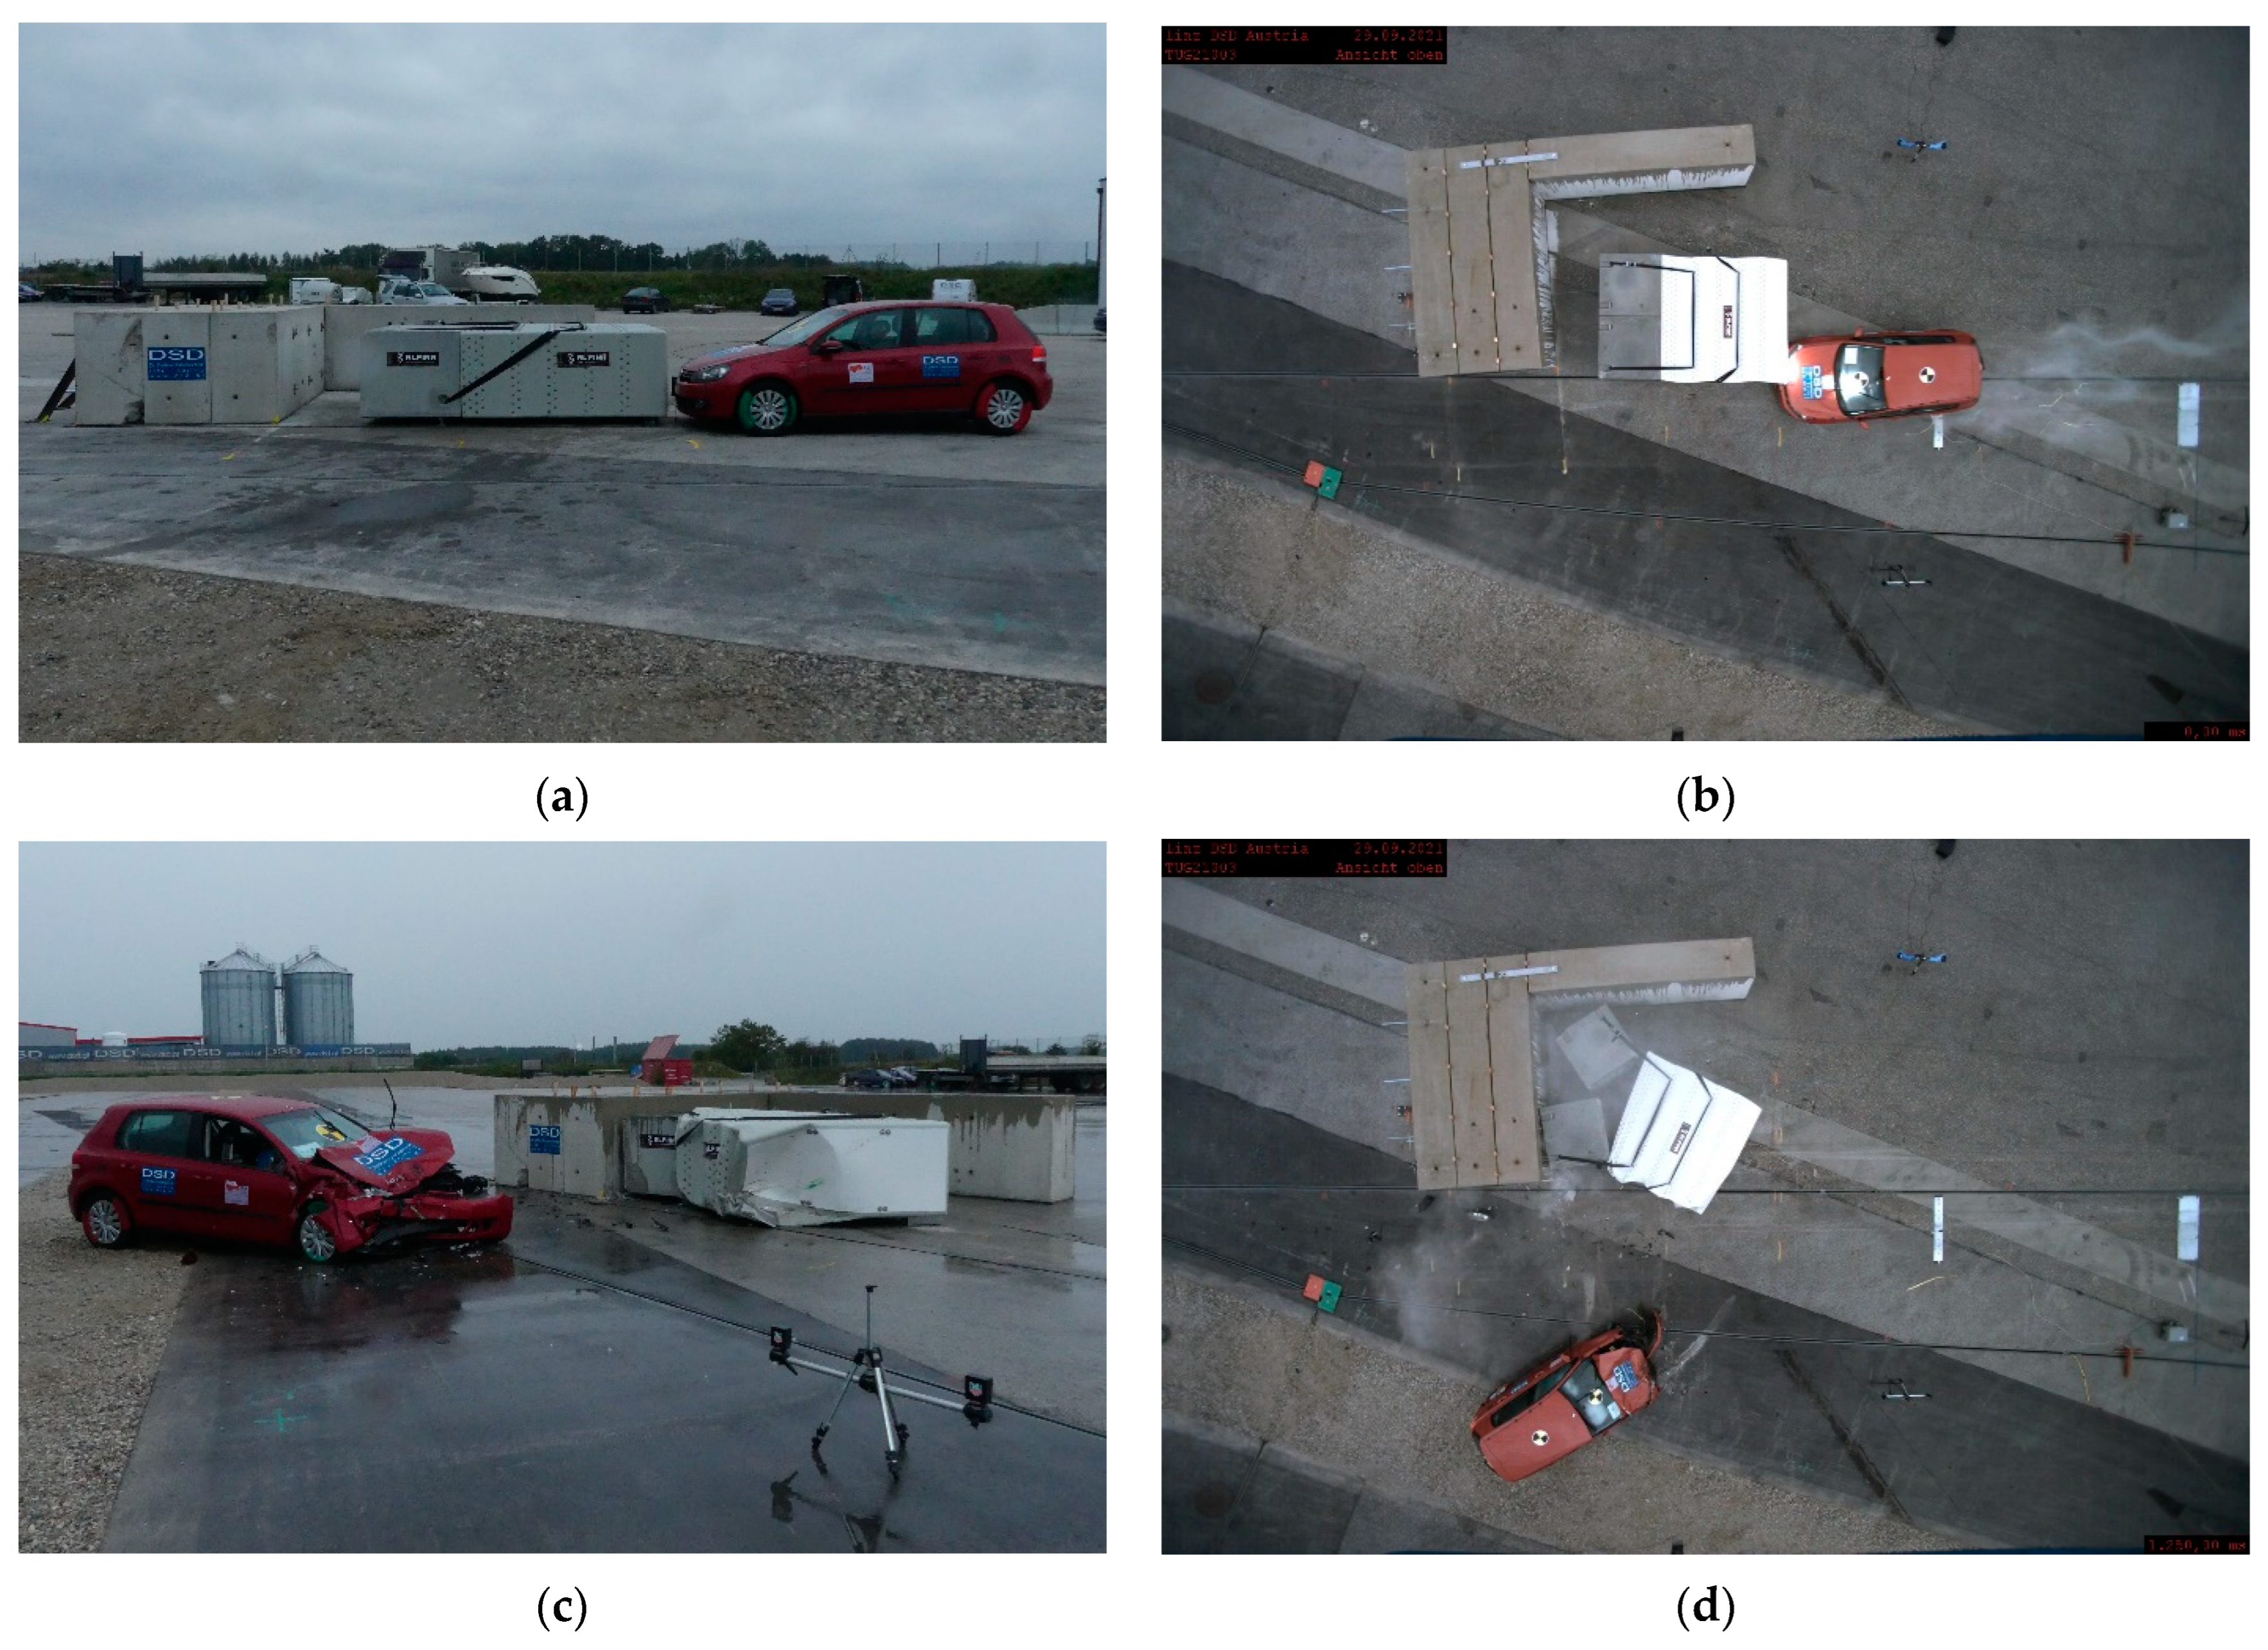
3.1.3. Test 3—VW Golf, Offset Impact
3.1.4. Test 4—Opel Corsa, Offset Impact
3.2. Injury Risk Assessment
4. Discussion
5. Limitations
6. Conclusions
Author Contributions
Funding
Institutional Review Board Statement
Informed Consent Statement
Data Availability Statement
Acknowledgments
Conflicts of Interest
References
- Alpina, Roadairbag Catalogue. Available online: https://alpina.at/wp-content/uploads/2021/11/alpina_roadairbag_katalog_2021-web.pdf (accessed on 9 January 2024).
- EN 1317-3:2000; EN 1317-3: Road Restraint Systems—Part 3: Performance Classes, Impact Test Acceptance Criteria and Test Methods for Crash Cushions 13.200. Comité Européen De Normalisation: Bruxelles, Belgium, 2001.
- EN 1317-1:2010-07; EN 1317-1: Road Restraint Systems—Part 1: Terminology and General Criteria for Test Methods 13.200. Comité Européen De Normalisation: Bruxelles, Belgium, 2010.
- Dudenhöffer, F. Stetige Verbesserung macht müde: Das Auto. Wirtschaftsdienst 2017, 97, 600–602. [Google Scholar] [CrossRef]
- International Council on Clean Transportation Europe. Europen Vehicle Market Statistics: Pocketbook 2021/22; International Council on Clean Transportation Europe: Berlin, Germany, 2021.
- Hernández, Z.A.; Álvarez, F.; Alonso, M.; Sañudo, L. Analysis of the test criteria for vehicle containment systems in the Standard EN 1317 regarding the number of vehicles in use. Transp. Res. Procedia 2018, 33, 315–322. [Google Scholar] [CrossRef]
- Méndez, A.G.; Izquierdo, F.A.; Ramírez, B.A. Evolution of the crashworthiness and aggressivity of the Spanish car fleet. Accid. Anal. Prev. 2010, 42, 1621–1631. [Google Scholar] [CrossRef]
- Gaylor, L.; del Fueyo, R.S.; Junge, M. Crashworthiness improvements of the vehicle fleet, International Research Council on the Biomechanics of Injury. In Proceedings of the 2016 IRCOBI Conference Proceedings, Malaga, Spain, 14–16 September 2016; pp. 592–605. [Google Scholar]
- Blows, S.; Ivers, R.Q.; Woodward, M.; Connor, J.; Ameratunga, S.; Norton, R. Vehicle year and the risk of car crash injury. Inj. Prev. 2003, 9, 353–356. [Google Scholar] [CrossRef] [PubMed]
- Newstead, S.V.; Watson, L.M.; Cameron, M.H.; Rampollard, C.L. Trends in Crashworthiness of the New Zealand Vehicle Fleet by Year of Manufacture: 1964 to 2018; Monash University: Clayton, VIC, Australia, 2020. [Google Scholar]
- Newstead, S.V.; Cameron, M.H.; Le, C. Vehicle Crashworthiness and Aggressivity Ratings and Crashworthiness by Year of Vehicle Manufacture: Victoria and NSW Crashes During 1987–98, Queensland Crashes during 1991–98; Monash University: Clayton, VIC, Australia, 2000. [Google Scholar]
- Kahane, C.J. Lives Saved by Vehicle Safety Technologies and Associated Federal Motor Vehicle Safety Standards, 1960 to 2012—Passenger Cars and LTVs, National Highway Traffic Safety Administration (NHTSA). In Proceedings of the 24th ESV Conference Proceedings, Yokohama, Japan, 8–11 June 2015. [Google Scholar]
- Forman, J.; Michaelson, J.; Kent, R.; Kuppa, S.; Bostrom, O. Occupant Restraint in the Rear Seat: ATD Responses to Standard and Pre-tensioning, Force-Limiting Belt Restraints. Ann. Adv. Automot. Med. 2008, 52, 141–154. [Google Scholar]
- Ekambaram, K.; Frampton, R.; Bartlett, L. Improving the Chest Protection of Elderly Occupants in Frontal Crashes Using SMART Load Limiters. Traffic Inj. Prev. 2015, 16 (Suppl. S2), S77–S86. [Google Scholar] [CrossRef] [PubMed]
- Tavakoli, M.; Brelin-Fornari, J. Effects of Pretensioners and Load Limiters on 50th Male and 5th Female Seated in Rear Seat during a Frontal Collision; SAE Technical Paper Series; SAE International: Warrendale, PA, USA, 2015. [Google Scholar]
- Walz, M. NCAP test improvements with pretensioners and load limiters. Traffic Inj. Prev. 2004, 5, 18–25. [Google Scholar] [CrossRef] [PubMed]
- Nusholtz, G.S.; Rabbiolo, G.; Shi, Y. Estimation of the Effects of Vehicle Size and Mass on Crash-Injury Outcome through Parameterized Probability Manifolds; SAE Technical Paper Series; SAE International: Warrendale, PA, USA, 2003. [Google Scholar]
- Evans, L. Causal influence of car mass and size on driver fatality risk. Am. J. Public Health 2001, 91, 1076–1081. [Google Scholar] [PubMed]
- Tolouei, R.; Maher, M.; Titheridge, H. Vehicle mass and injury risk in two-car crashes: A novel methodology, Accident. Anal. Prev. 2013, 50, 155–166. [Google Scholar] [CrossRef] [PubMed]
- Evans, L. Age Dependence of Female to Male Fatality Risk in the Same Crash: An Independent Reexamination. J. Crash Prev. Inj. Control 2000, 2, 111–121. [Google Scholar] [CrossRef]
- Evans, L. Female Compared with Male Fatality Risk from Similar Physical Impacts. J. Trauma Acute Care Surg. 2001, 50, 281. [Google Scholar] [CrossRef] [PubMed]
- American Association of State Highway and Transportation Officials. Manual for Assessing Safety Hardware (MASH); American Association of State Highway and Transportation Officials: Washington, DC, USA, 2016. [Google Scholar]
- Alpina, Crash Cushion. Available online: https://www.alpina.at/alpina-expandiert-nach-irland-alpina-anpralldampfer-im-dublin-port-tunnel-aufgestellt/ (accessed on 9 January 2024).
- Tomasch, E.; Heindl, S.F.; Gstrein, G.; Sinz, W.; Steffan, H. Assessment of the Effectiveness of Different Safety Measures at Tunnel Lay-Bys and Portals to Protect Occupants in Passenger Cars. Infrastructures 2021, 6, 81. [Google Scholar] [CrossRef]
- Tomasch, E.; Steffan, H.; Darok, M. Retrospective accident investigation using information from court, TRA. In Proceedings of the Transport Research Arena Europe 2008 (TRA), Laibach, Slovenia, 21–24 April 2008. [Google Scholar]
- Tomasch, E.; Steffan, H. ZEDATU—Zentrale Datenbank tödlicher Unfälle in Österreich—A Central Database of Fatalities in Austria, ESAR. In Proceedings of the 2nd International Conference on ESAR “Expert Symposium on Accident Research”, Hanover, Germany, 1st/2nd September 2006. [Google Scholar]
- EN 1317-3:2010-07; EN 1317-3: Road Restraint Systems—Part 3: Performance Classes, Impact Test Acceptance Criteria and Test Methods for Crash Cushions 13.200. Comité Européen De Normalisation: Bruxelles, Belgium, 2011.
- Weaver, G.D.; Marquis, E.L. The Relation of Side Slope Design to Highway Safety (Combinations of Slopes); Texas Transportation Institute: College Station, TX, USA, 1973. [Google Scholar]
- Weaver, G.D.; Marquis, E.L. Safety aspects of roadside slope combinations. Transp. Res. Rec. 1974, 518, 25–28. [Google Scholar]
- Michie, J.D. Collision risk assessment based on occupant flail-space model. Transp. Res. Rec. 1981, 796, 1–9. [Google Scholar]
- ISO 12353-1; Road Vehicles—Traffic Accident Analysis. Part 1: Vocabulary, 2nd ed. 01.040.43. International Organization for Standardization: Geneva, Switzerland, 2020.
- Gabauer, D.J.; Gabler, H.C. Comparison of roadside crash injury metrics using event data recorders. Accid. Anal. Prev. 2008, 40, 548–558. [Google Scholar] [CrossRef] [PubMed]
- Augenstein, J.; Bahouth, G.; Digges, K.; Stratton, J.; Perdeck, E. Characteristics of Crashes that Increase the Risk of Serious Injuries; Annual Proceedings/Association for the Advancement of Automotive Medicine: Chicago, IL, USA, 2003. [Google Scholar]
- Burbridge, A.; Naish, D.; Troutbeck, R. Predicting occupant risk indicators for frontal impacts with redirective crash cushions, Australasian Road Safety Conference. In Proceedings of the 2015 Australasian Road Safety Conference, Gold Coast, Australia, 14–16 October 2015; pp. 1–10. [Google Scholar]


| Unit | Test 1 | Test 2 | Test 3 | Test 4 | |
|---|---|---|---|---|---|
| Specimen | - | ALPINA F1-80 | ALPINA F1-80 | ALPINA F1-80 | ALPINA F1-80 |
| Vehicle | - | VW Golf 6 | Opel Corsa | VW Golf 6 | Opel Corsa |
| Year of manufacture | - | 2009.03 | 1997.10 | 2009.04 | 1998.10 |
| Weight incl. ATD | [kg] | 1245 | 935 | 1245 | 937 |
| Length | [m] | 4.21 | 3.74 | 4.21 | 3.74 |
| Width | [m] | 1.79 | 1.62 | 1.79 | 1.62 |
| Wheelbase | [m] | 2.574 | 2.443 | 2.574 | 2.443 |
| Airbag | - | activated | activated | activated | activated |
| Pretensioner | - | yes | yes | yes | yes |
| Load limiter | - | yes | no | yes | no |
| Target speed | [km/h] | 100 | 100 | 100 | 100 |
| Measured collision speed | [km/h] | 101.12 | 101.04 | 99.45 * | 100.28 |
| Gap of specimen to the wall | [cm] | 100 | 102 | 100 | 99 |
| Impact angle | [°] | 0.1 | 0.9 | 0.1 | 0.5 |
| Overlap | [%] | 100 | 100 | 50 | 50 |
| Road conditions | - | dry | dry | wet | slightly wet |
| Test 1 | Test 2 | Test 3 | Test 4 | ||
|---|---|---|---|---|---|
| Criterion | Unit | VW Golf Mk6 | Opel Corsa | VW Golf Mk6 | Opel Corsa |
| Delta-v | [km/h] | 91 | 93 | 81 | 87 |
| ASI (Sensor 1) | [-] | 1.60 | 1.66 | 2.11 | 2.63 |
| ASI (Sensor 2) | [-] | 1.58 | 1.64 | 2.09 | 2.60 |
| THIV (Sensor 1) | [km/h] | 48.53 | 49.09 | 51.56 | 43.37 |
| THIV (Sensor 2) | [km/h] | 48.35 | 48.95 | 50.70 | 43.29 |
| OIV (Sensor 1) | [km/h] | 48.52 | 49.09 | 48.13 | 43.90 |
| OIV (Sensor 2) | [km/h] | 48.37 | 49.03 | 47.53 | 43.74 |
| PHD (Sensor 1) | [g] | 20.94 | 20.76 | 30.83 | 42.41 |
| PHD (Sensor 2) | [g] | 20.81 | 20.67 | 30.80 | 42.22 |
| ORA (Sensor 1) | [g] | 20.94 | 21.78 | 31.90 | 42.41 |
| ORA (Sensor 2) | [g] | 20.81 | 21.67 | 31.78 | 42.22 |
Disclaimer/Publisher’s Note: The statements, opinions and data contained in all publications are solely those of the individual author(s) and contributor(s) and not of MDPI and/or the editor(s). MDPI and/or the editor(s) disclaim responsibility for any injury to people or property resulting from any ideas, methods, instructions or products referred to in the content. |
© 2024 by the authors. Licensee MDPI, Basel, Switzerland. This article is an open access article distributed under the terms and conditions of the Creative Commons Attribution (CC BY) license (https://creativecommons.org/licenses/by/4.0/).
Share and Cite
Tomasch, E.; Gstrein, G. Impacts on Crash Cushions—Analysis of the Safety Performance of Passenger Cars with Improved Safety Equipment Compared with Test Vehicles Based on Assessment Criteria as Defined in EN 1317. Infrastructures 2024, 9, 59. https://doi.org/10.3390/infrastructures9030059
Tomasch E, Gstrein G. Impacts on Crash Cushions—Analysis of the Safety Performance of Passenger Cars with Improved Safety Equipment Compared with Test Vehicles Based on Assessment Criteria as Defined in EN 1317. Infrastructures. 2024; 9(3):59. https://doi.org/10.3390/infrastructures9030059
Chicago/Turabian StyleTomasch, Ernst, and Gregor Gstrein. 2024. "Impacts on Crash Cushions—Analysis of the Safety Performance of Passenger Cars with Improved Safety Equipment Compared with Test Vehicles Based on Assessment Criteria as Defined in EN 1317" Infrastructures 9, no. 3: 59. https://doi.org/10.3390/infrastructures9030059