


Analysis of E-Scooter Crashes in the City of Bari
1
Department of Civil, Environmental, Building, Land Engineering and Chemistry, Politecnico di Bari, Via Orabona 4, 70125 Bari, BA, Italy
2
Department of Engineering for Innovation, Università del Salento, S.P. Lecce-Monteroni, 73100 Lecce, LE, Italy
*
Authors to whom correspondence should be addressed.
Infrastructures 2024, 9(3), 63; https://doi.org/10.3390/infrastructures9030063
Submission received: 27 December 2023
/
Revised: 12 March 2024
/
Accepted: 15 March 2024
/
Published: 19 March 2024
(This article belongs to the Special Issue Sustainable Infrastructures for Urban Mobility)
Abstract
:The remarkable impact that e-scooters have had on the transportation system drives research on this phenomenon. The widespread use of e-scooters also poses several new safety issues, which should be necessarily studied. The aim of this paper points in this direction, investigating the main contributing factors, causes, and patterns of recorded e-scooter crashes, considering also different crash types and severity, using the City of Bari (Italy) as a case study. The crash dataset based on police reports and referring to the period July 2020–November 2022 (i.e., the first period of e-scooter implementation in the City of Bari) was investigated. Crashes were clustered according to several variables. No fatal crashes occurred, even though crashes mostly resulted in injuries (70%). Considering road type, divided roads were found to be less safe than undivided ones, due to higher mean speeds than on other roads and to a less constrained e-scooter driving behavior. Calm (off-peak) daytime hours seem to lead to more frequent e-scooter crashes with respect to both peak and nighttime hours, even if the latter hours are associated with an increased severity. Once controlled for exposure, season, lighting conditions, and the private/sharing ratio do not seem influential. E-scooters are more prone to be involved in single-vehicle and pedestrian crashes at segments than other vehicles, but they show similar crash trends than other vehicles (i.e., angle crashes) at intersections. As emerged from traffic surveys, not all e-scooter users were found to use cycle paths. Combining this information with crash data, it seems that not using cycle paths is considerably less safe than using them. Besides engineering measures and policies, awareness campaigns should be promoted to elicit safe users’ behavior and to tackle the several violations and misbehaviors emerging from the crash data.
1. Introduction
Urban traffic is facing a drastic change due to the introduction of new vehicles, such as e-scooters, especially in last-mile travels [1,2,3]. Ensuring e-scooter safety is then an emerging topic, considering their interactions with other road users [4]. The benefits of e-scooters in reducing private vehicle use and promoting sustainable transport have already been evaluated [5,6,7,8,9]. However, research is still needed regarding e-scooter crash frequency and severity [10,11,12,13,14]. Considering e-scooters as a hybrid means of transport poses challenges because e-scooter drivers can be considered vulnerable road users (VRUs), even if their classification is not standardized. In fact, from a regulatory point of view, legislation regarding e-scooters is inconsistent, and thus dealing with their safety issues is particularly demanding. For instance, it is still unclear whether they should be treated like bicycles or motorized vehicles, since differences and similarities can be highlighted in both cases. This is a crucial aspect since it involves allowing e-scooters on cycle paths together with bicycles or not.
More specifically, both these micro-mobility solutions (e-scooters and bicycles) are recognized components of a broader global movement towards sustainable urban transportation [1]. They are eco-friendly alternatives, fostering a collective effort to alleviate traffic congestion and reduce greenhouse gas emissions [6,8,15]. Moreover, they enhance last-mile connectivity by linking public transportation hubs to final destinations within urban environments [1,2,3,15]. Despite these similarities, bicycles and electric scooters have distinct identities. A key difference lies in their legal classification, which varies significantly across different jurisdictions. In fact, electric scooters are not uniquely classified, since they may still be designated as motor vehicles, personal mobility devices, or bicycles, being subject to different sets of rules and regulations according to their classification [16].
Looking at the problem from an infrastructural point of view, some differences between e-scooters and bicycles are evident. The latter often benefit from dedicated bike paths in many cities, which promotes a safe and well-organized environment. In contrast, specific indications for an e-scooter-dedicated infrastructure are still lacking and this is a complex and debated issue [17]. Currently, e-scooters merge and interact with other drivers in the traffic flow, pedestrians on sidewalks, and bicycles on cycle paths [15,18]. This remarkable infrastructural lack also depends on speed differences between vehicles. Electric scooters are motorized and, if not regulated, can achieve higher speeds compared to traditional bicycles. Managing and regulating speeds become critical for ensuring the safety of both riders and pedestrians [16].
This speed-related issue also has consequences for the age limitations for e-scooter drivers. While age restrictions do not typically apply to bicycles, some countries impose age requirements or provide that e-scooter riders should have specific licenses, further influencing accessibility and usage patterns [16]. In conclusion, precise legal indications about e-scooters can overcome some of these issues, allowing them to travel safely and on specific paths [1,15,16,18,19].
Several studies focused on the comparison between bicycle and e-scooter behaviors. The comparative behavioral analysis of users of a bicycle (with and without pedal assistance), a lightweight personal e-scooter, and a larger e-scooter for public sharing [20] revealed that braking and steering performances vary depending on the vehicle and the urgency of the maneuver. Cyclists exhibit variable decelerations and jerks during braking, while steering maneuvers involve varying angles and lateral clearances. E-scooters demonstrate lower braking capabilities compared to bicycles, especially the lightweight ones. Steering performances are similar across the vehicles. It is emphasized that, in some scenarios, steering may be safer than braking for electric scooter riders. Another study [21] showed that e-scooters are generally less comfortable in terms of response to vibrations caused by irregularities in the pavement, also stating that e-scooters and bicycles exhibit similar braking performance behaviors. According to [22], e-scooters seem universally less comfortable than e-bikes. In particular, a higher vibrational intensity was associated with higher speeds, being tall, female (possibly due to generally different physical characteristics), and young drivers (indicating a less prudent behavior). On the other hand, at low speeds, an inverse relationship between the user’s mass and the vibrations was found [23].
A priority e-scooter safety issue is to analyze the recurring crash patterns, factors, and circumstances in the urban environment starting from crash datasets, also relying on surrogate safety measures [24], to identify dedicated countermeasures.
For this reason, the objective of this study is to analyze e-scooter crash data, by identifying causes and circumstances of e-scooter crashes. This analysis starts from the urban crash dataset available for the City of Bari (Italy). Such studies can be useful for the practical aim of proposing potential safety measures to prevent e-scooter crashes and enhance road safety and sustainable mobility. Results could be a useful resource for policymakers, urban planners, designers, and transportation authorities in Bari and other cities facing similar e-scooter safety challenges.
This approach is in line with some other studies in the literature [25] that, starting from the analysis of crash reports, attempted to reproduce e-scooter crash patterns through simulations for the aim of safety assessments [26] or to investigate the most common injury mechanisms to propose specific policies (such as mandatory helmets [27]). Clearly, this depends on the availability of crash datasets, which can be at the national or local level [25] or taken from a retrospective analysis of hospital data [24].
Previous research dealt with the investigation of e-scooter crash dynamics by covering topics such as rider behavior, the role of infrastructure, and possible safety measures. Sun et al. (2023) [28] focused on crashes involving e-scooters used for deliveries, identifying clusters of factors influencing crash severity. Their contribution was valuable in outlining heterogeneity in the involved variables. Das et al. (2023) [29] provided an in-depth look into traffic collision patterns of e-scooter users, highlighting risks associated with driving behaviors and possible collisions with motorists. The application of the Perceptual Cycle Model (PCM) allowed analyzing causal factors in detail, by providing crucial policy recommendations to enhance road safety. A different approach, always focused on crash-driving factors, was pursued by White et al. (2023) [30]. In this analysis, a naturalistic approach was adopted, emphasizing the importance of infrastructure, behavioral, and environmental factors. Findings indicate the need for educational programs and infrastructure improvements to mitigate safety risks. Another important issue related to e-scooter misbehaviors was tackled by Oshanreh et al. (2024) [31]. They focused on evaluating the effectiveness of an artificial intelligence-based feedback system in reducing sidewalk riding by shared e-scooter drivers. This study provides practical insights into the potential of technological interventions to improve user behavior and compliance with regulations. Kuskapan et al. (2023) [32] pushed forward the investigation of e-scooter sidewalk riding, introducing the use of Inertial Measurement Unit (IMU) coupled with machine learning algorithms for detecting improper sidewalk usage. Moreover, this analysis ended with an insight into the pandemic effects on e-scooter user behavior. The latter study represents a step forward in applying innovative technologies to promote safer behaviors.
Considering the presented background, this research work focuses on a specific urban context (the City of Bari, Italy), aiming at making a significant contribution to understanding e-scooter crash dynamics and identifying the most influential crash-related variables with respect to crash types and injury severity. This is an important contribution to the scientific literature, filling a gap represented by the limited presence of studies dedicated to the analysis of e-scooter crashes, with particular attention to their severity and type. This was obtained by analyzing the case study of the City of Bari (Italy), which was decisive to achieve the research objectives. In the next section, the methodology used is presented, and then results are discussed in light of their planning and design implications and by comparing them to the previous literature. In the last section, the main conclusions from this study are drawn.
2. Methodology
2.1. Data Collection
The methodology used in this study aims at identifying e-scooter crash patterns based on a crash dataset and police reports. This methodology differs from commonly used methods in the previous literature, which was focused on hospital [24] or insurance company reports [25].
The reports used in this study are those provided by the Local Police of the Municipality of Bari, related to e-scooter crashes only. The availability of crash reports allowed us to rely on a more detailed dataset, including also property-damage-only (PDO) crashes. Thus, the following injury severity levels are considered: fatal, injury, and no-injury crashes. Injury crashes are not further differentiated into more disaggregated severity classes given that this information is available only for some very limited cases in the crash reports. On the other hand, crash dynamics are explained in much more detail than in the reports from the National Institute of Statistics (see, e.g., [33]). During the investigated period, July 2020–November 2022 (December 2022 was not available during the data collection phase), 257 e-scooter crashes were recorded by the Local Police in the City of Bari area (Table 1). The crashes were homogenously spread over the entire analyzed area (see Figure 1).
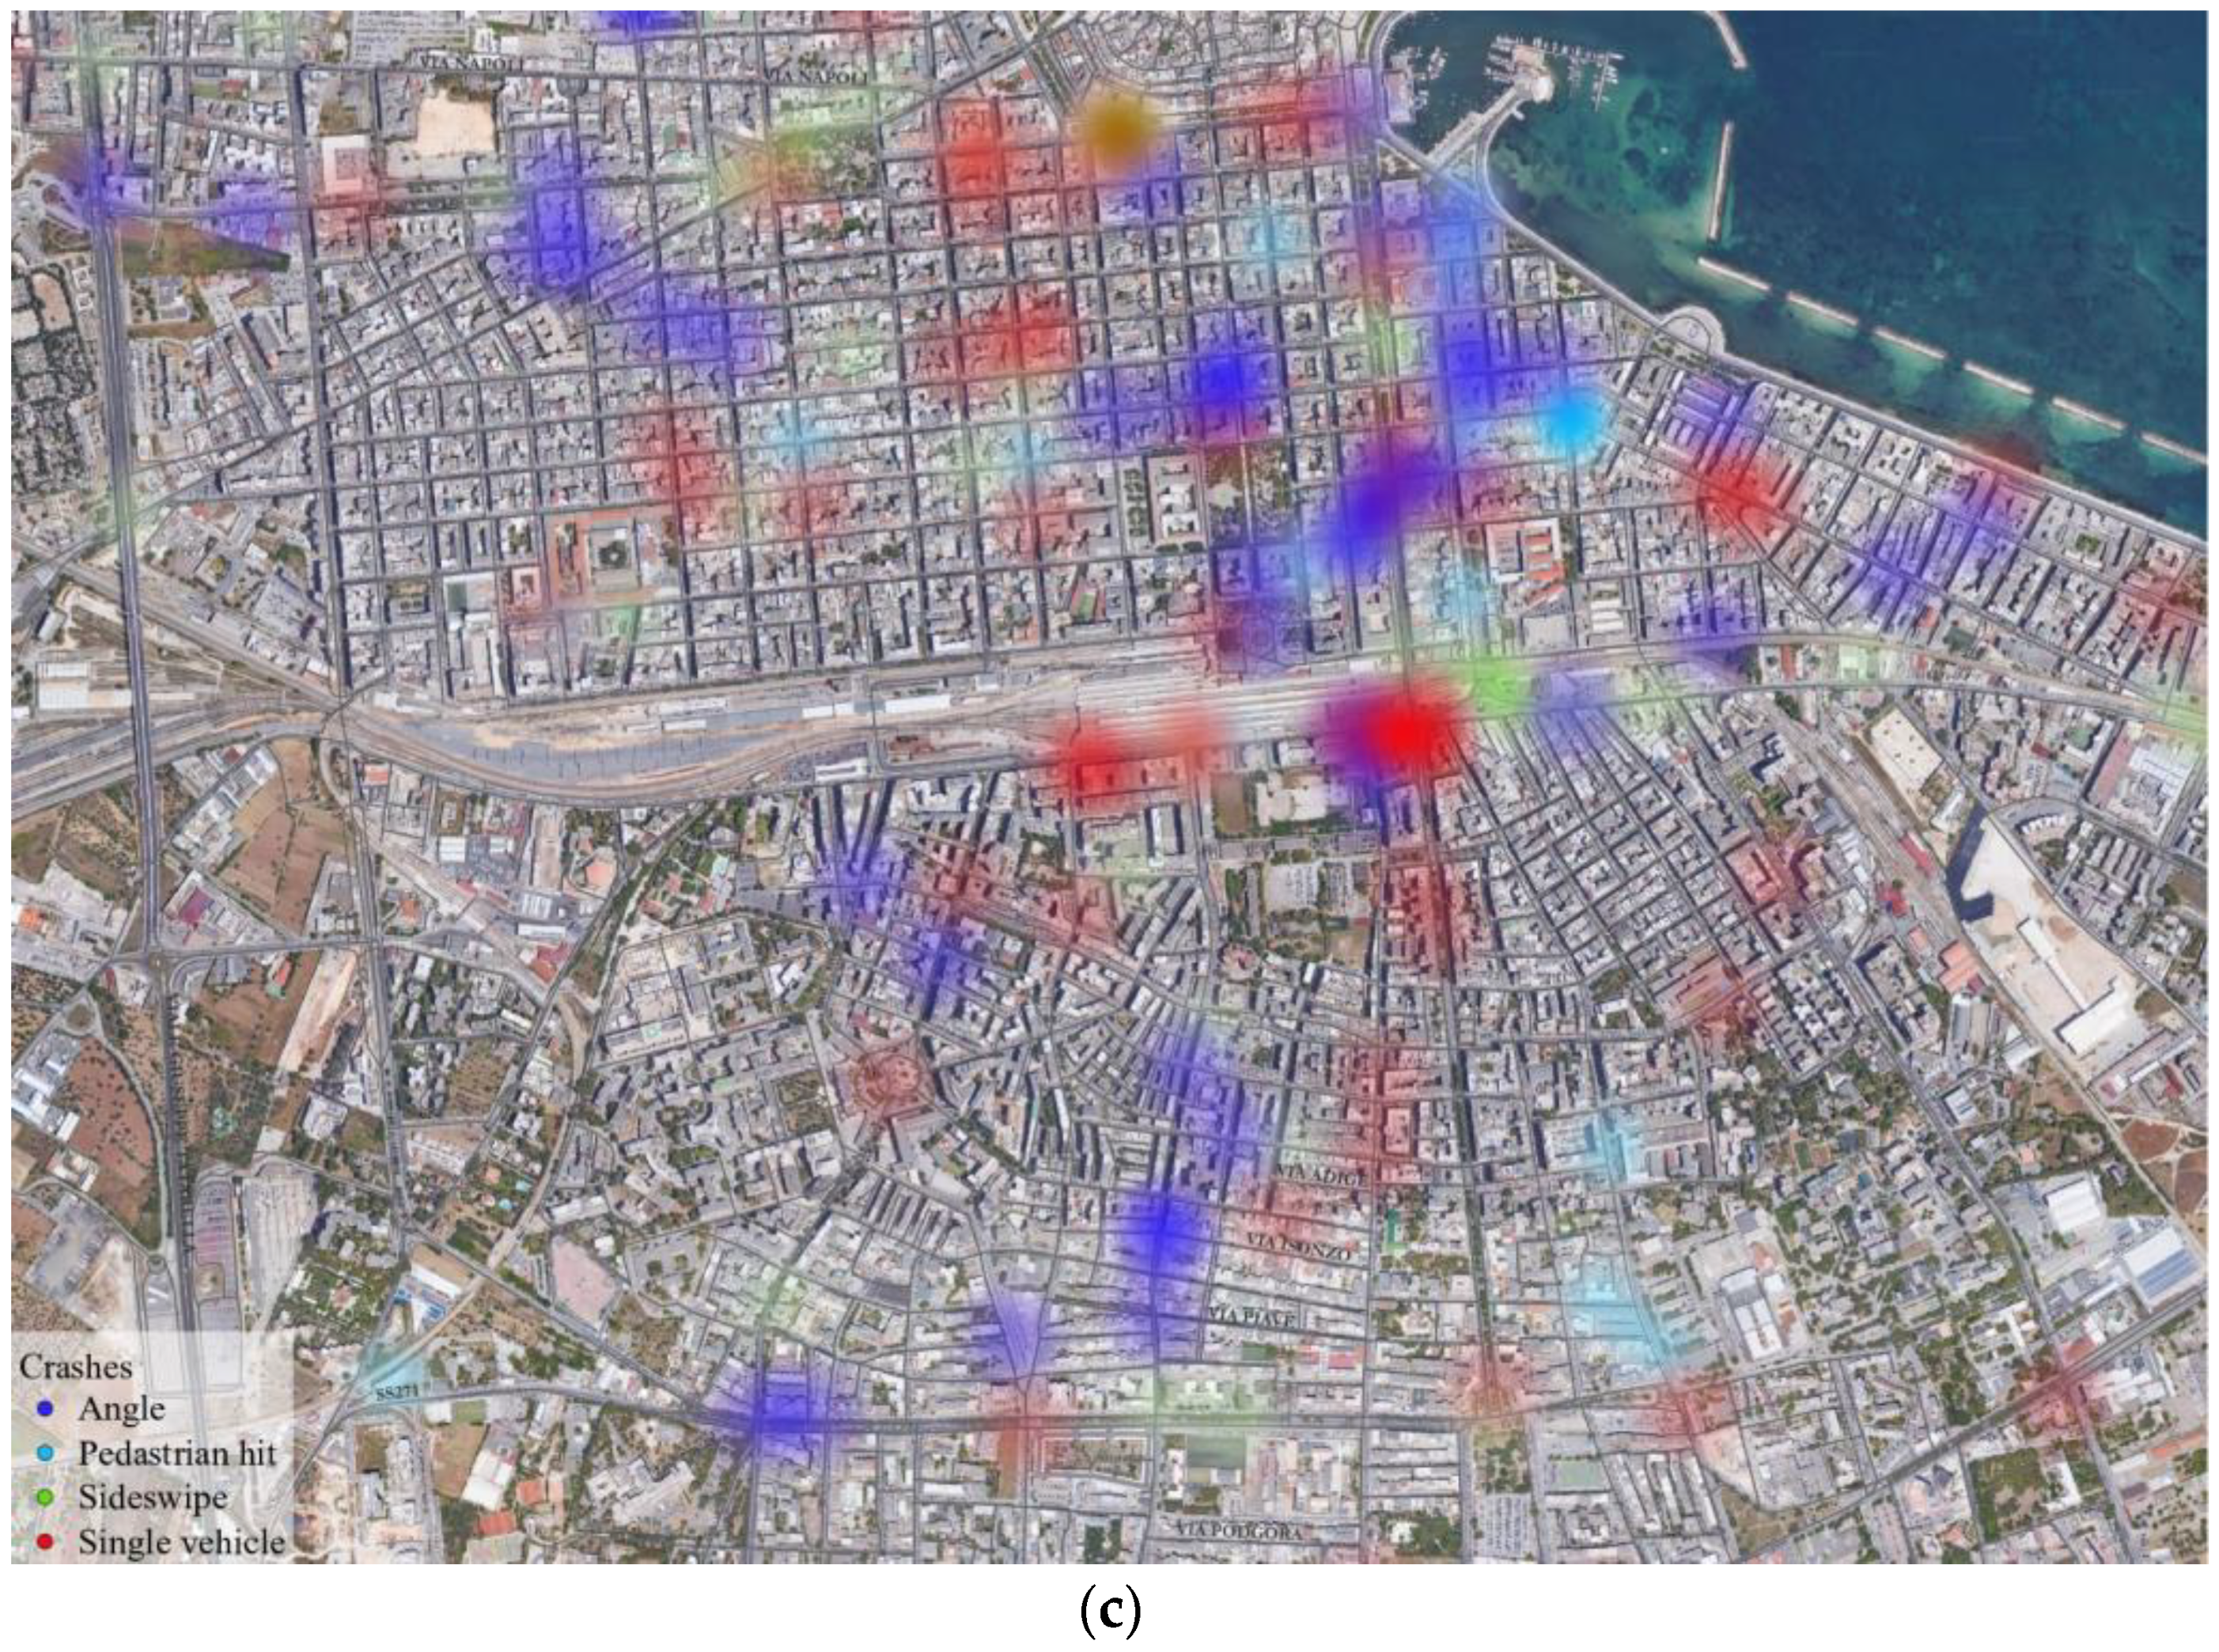
E-scooters were introduced in the City of Bari at the beginning of 2020, when the pandemic restrictions due to COVID-19 were loosened. For this reason, the crash analysis only consists of two years of reported crashes. These data were first investigated by grouping crashes to define the most frequent scenarios and crash factors. To provide a general overview of the different distribution of crash types and severities, specific heatmaps are shown in Figure 2.
The available dataset provides all the following information, other than the above mentioned: latitude, longitude, crash date, time, type of crash, type of vehicles involved, street name, road type, crash severity, number of injured persons, number of deaths, and type of violation. Additional variables, different than those found in the dataset, were considered. These variables were retrieved using visual on-site surveys: Average Hourly Traffic, one-way or two-way road, pavement conditions, presence of cycle path, and signalized or unsignalized intersection (presence of traffic lights).
2.2. Study Variables
Descriptive statistics of the e-scooter crash dataset are presented as follows, according to the study variables defined with the help of the information found in local police reports.
For the aim of the further statistical analyses performed, variables have been grouped into more parsimonious classes, as follows:
- Injury severity: No, Yes.
- Road category: Undivided two-way, Undivided one-way, Divided multi-lane, Pedestrian zone.
- Day hour: Calm hours, Peak hour, Night hours.
- Week day: Weekday, Weekend and Holiday (including Sundays).
- Season: Summer, Autumn, Winter, Spring.
- Road Geometry: Segment (including bridges, tunnels), Unsignalized intersection, Signalized intersection, Roundabout.
- Crash Type: Single-vehicle, Angle, Sideswipe, Pedestrian hit, Other.
- Pavement: Dry, Wet/Slippery.
- Age: <18, 18–30, 31–40, >40, Unspecified.
- Sex: Man, Woman, Unspecified.
- Passengers: No, Yes, Unspecified.
- Sharing: Private, Sharing, Unspecified.
- Dynamics: Crash not caused by the e-scooter, Irregular e-scooter behavior, Other, Road surface issues.
- Crash on a cycle path: No, Yes, Unspecified.
- Presence of cycle paths: No, Yes.
The above-reported classification of factors aim to provide a structured framework for analyzing and interpreting data.
2.3. Statistical Methods
In the context of this research, aimed at explaining e-scooter crash dynamics, one of the main goals is to identify the most influential variables on e-scooter crash types and injury severity.
For this reason, the following statistical modeling approaches were used:
- A binary logit model, having the injury severity as independent variable (injuries: yes or no) and the other above defined crash-related variables as potential predictors;
- A multinomial logit model, having the crash type as independent variable (single-vehicle as the reference type, other types: angle, sideswipe, pedestrian hit, and other crashes) and the other above defined crash-related variables as potential predictors.
Following the multinomial logit approach, the probability of observing a given crash type among the set of alternative crash types is given as follows:
where:
- crash type;
- = i-th independent variable;
- = i-th coefficient ( is the intercept) associated with the j-th crash type chosen among the set of alternative m crash types.
If the probability of observing the crash type t = j is compared with the probability of observing the base alternative “0” (single-vehicle crashes in this case):
where all the terms are as previously defined in Equation (1).
Based on the logit transformation, if each included in the model is exponentiated, the relative risk ratio (with respect to the base outcome) for a one-unit change in the modality of the variable (all variables considered here are categorical) with respect to the base modality is obtained.
In the case of the binary logit model, the previous equations are simplified since there are only two alternatives in the set. Thus, there is only one set of model coefficients for estimating the probability of observing injury crashes with respect to non-injury (property-damage-only) crashes.
Predictors were retained in the final models if at least one estimated coefficient associated with a variable modality was significant at the 10% level, given the exploratory nature of this study. Likelihood ratio tests and pseudo-R2 were used to evaluate the goodness-of-fit of alternative models. Statistical analyses were run in the STATA environment.
3. Results
3.1. Results from the Descriptive Analysis
Most e-scooter crashes led to injuries (70%), while no fatal incidents were recorded. It should be noted that property-damage-only crash data may suffer from under-reporting, since, e.g., individuals who experience falls without injuries usually do not report the crash to the police.
E-scooter crashes are much more frequent on undivided roads (91%, almost equally split between one-way and two-way roads), with respect to divided roads (9%). Since 23 km (about the 2%) of the 1321 km composing the road network of the City of Bari are divided roads, the lower percentage of crashes occurring on these roads appears to be justified and, at the same time, it highlights how divided roads seem less safe than undivided roads.
It is also worth noting that 1% of crashes occurred in pedestrian zones, even if riding an e-scooter in the pedestrian area represents a traffic violation.
To understand the impact of road traffic on e-scooter crashes, the study looked at the time when the crashes occurred. As shown in Table 2, by relying on the local definition [34] of peak hours (7 a.m.–9 a.m., 1 p.m.–3 p.m.) and calm hours (all other hours) related to motor-vehicle traffic volumes, 19% of crashes occurred during peak hours, 10% during the night (10 p.m.–6 a.m.), and the remainder 71% during the other calm hours.
Continuing to analyze the different crash-related variables shown in Table 2, it is evident that most crashes occurred during the summer, as well as during daylight hours.
Considering different road elements, 52% of e-scooter crashes occurred at segments, 42% at intersections (mostly unsignalized: 31%), and 4% at roundabouts. On the other hand, the most common crash type (31%) is the “single-vehicle” one, where the e-scooter driver crashed alone. The second most common type (27%) is the angle collision with another vehicle, followed by sideswipe (22%).
Analyzing the type of e-scooter users and those involved in at least one crash, most users (37%) were young, aged between 18 and 30.
As far as the sex of crashed riders is concerned, based on Table 2, most users were male (60% of total crashes, up to 73% if missing data are excluded).
Another issue highlighted from the data shown in Table 2 is that 5% of crashes involved a second passenger on the e-scooter, which is another aberrant behavior, like driving on pedestrian zones.
Finally, the dataset allowed the study of crash-contributing factors and dynamics. By excluding not specified factors (4%), it is evident that most crashes were caused by e-scooter drivers (65%, the sum of all dynamics different than “crash not caused by the e-scooter”). Among these crashes, e-scooter driver distraction accounted for a significant portion (23%) of crashes. Road pavement issues were a notable precursor (11%), as alongside the failure to yield the right of way (11%, also frequently found in the analysis of pedestrian crashes [35]).
Analyzing data about bicycle infrastructure (that can be travelled on as dedicated lanes by e-scooters), it is firstly noted that in the City of Bari, 32 km (about 2%) of the total road network length (1321 km) have bicycle paths. As mentioned earlier, 19% of crashes occurred on roads with cycle paths (47 out of 257 crashes analyzed). The effects of bike paths might be seen in a wider context. It should be noted that not all e-scooter users choose to ride on the bike path even if it is available on the road. In fact, it was found from on-site traffic surveys in Bari that 9% of e-scooter drivers choose to ride outside the cycle path, even if they are present. Therefore, the occurrence of crashes outside the bike path is not surprising. Out of the 47 crashes recorded on roads with cycle paths, 25 occurred on the path, and 22 happened outside (47%). Considering that this percentage (47%) is due to few users riding outside the cycle paths (9% of the total), it is evident that, if bike paths are present, e-scooter driver safety increases by traveling on them. In fact, 91% of bike path users were involved in almost the same number of crashes with respect to the 9% of users who travelled outside the path: therefore, not using the path seems 10 times more dangerous than using it. Finally, based on the spatial analysis, most crashes cluster in the city center, in particular close to the railway station, reflecting the travel concentration in this area. In fact, most of these spots are located on high-traffic urban arterial segments and the related intersections in the above-described area, exhibiting a high density of injury crashes, particularly of the “single-vehicle” and “angle” types. Clearly, as also highlighted in the descriptive analyses, angle crash types are mostly clustered at intersections, while single-vehicle crashes at segments.
3.2. Results of the Statistical Models
The results from the binary logistical regression model for e-scooter crash injury severity are shown in the Table 3.
Statistically significant associations were noted for the variables: “Day hour”, “Crash Type”, “Age”, “Sharing”, and “Dynamics”. Specifically, the analysis reveals that the severity increases during night hours and if the crash dynamics are linked to road surface issues. These findings provide insights into the factors influencing the severity of e-scooter crashes, underscoring the importance of considering temporal aspects and dynamics related to road surface conditions in safety assessments.
The results from the multinomial logistical regression model for e-scooter crash types are shown in the Table 4.
In the second model, a reference class is established, with “single-vehicle” serving as the baseline for comparison against other crash types. The analysis indicates a higher likelihood of angle crashes compared to single-vehicle crashes on undivided one-way roads compared to undivided two-way roads. Additionally, there is a greater likelihood of angle crashes compared to single-vehicle crashes at intersections and roundabouts compared to those occurring at segments. Notably, instances of sideswipe crashes are more likely than single-vehicle crashes during night hours compared to calm hours and at intersections compared to segments.
4. Discussion
In this section, the results obtained from both the descriptive and statistical analyses are discussed in detail.
E-scooter crashes are more frequent on undivided roads than on divided roads. However, when controlled for the respective network length, divided roads seem relatively more dangerous. This can be clearly due to higher vehicular speeds on divided roads with respect to undivided roads. In fact, divided roads generally induce drivers to increase their traveling speeds. This behavior can create dangerous situations, especially if vehicles face e-scooters which travel at lower speeds. The great difference in speeds between regular vehicles and e-scooters leads to an increase in the likelihood of high-risk conflicts because evasive maneuvers become more difficult. Moreover, the separation of traffic by means of physical elements may induce e-scooter drivers to riskier behaviors. In fact, they were also found to travel on the right side of each lane and not only on the side of the rightmost lane on multi-lane divided roads. However, this information, as well as the division into one-way and two-way roads will be analyzed later in this section, by coupling it with the crash dynamics and contributing factors, to help further discuss this aspect.
Regarding the distribution of crashes throughout the day in different time slots, it is important to explain that, while it is well known that motor-vehicle traffic volumes greatly vary with the day hours (with the peak hour absorbing up to about 10% of total daily traffic [36]), the same cannot be stated for e-scooters. In fact, ad hoc in situ traffic monitoring surveys were conducted in 11 sections within the municipality of Bari during the spring of 2023 in two one-hour slots: 7.45 a.m.–8.45 a.m., belonging to the above defined motor-vehicle peak hours; and 3.00 p.m.–4 p.m., belonging to the calm hours. These sections were chosen because they are the most traveled by e-scooters and affected by crashes. The number of total e-scooters which crossed the traffic survey sections during the calm hour is only about 10% lower than those recorded in the peak hour. Moreover, based on an example of aggregated statistics from an e-scooter sharing provider in Bari (Vento Mobility srl), night runs (10 p.m.–6 a.m.) represent almost 20% of the total e-scooter runs, a percentage that can be attributed to the absence of other public means of transport. Hence, in summary, e-scooter traffic volume is greatly different between day and night, but substantially uniform during the day. This difference is also in line with data from different cities’ surveys, which also highlight wide peak hour slots, being not homogenous throughout the day, especially for weekdays [9,37,38,39]. However, considering the uniformity of e-scooter traffic in Bari, the interactions between e-scooters and other vehicles may significantly vary during the day according to the fluctuation of motor-vehicle volumes between peak and calm hours.
Hence, the classification of crashes into day hours reported in Table 2 should be looked at from this perspective. E-scooter crashes during the eight night hours represent 10% of the total, compared to almost 20% of estimated e-scooter traffic. Given the quasi-uniformity of e-scooter traffic volumes during the remaining sixteen day-hour slots, one should expect a uniform classification of the total crashes into these hours, that is, an average of 14.5 e-scooter crashes for each of the sixteen hour slots. However, crashes during the considered four peak hour slots were only 48, which is lower than the expected number (14.5 × 4 peak hour slots = 58). Thus, contrary to what could be expected, it is possible to conclude that the effect of peak hour traffic seems beneficial for e-scooter safety. Nevertheless, if the average traffic speed is taken into account, this is not surprising [28]. In fact, during motor-vehicle peak hours, the average traffic speed may be significantly lower, and then collisions with e-scooters may be more easily avoided in case of potential conflicts. This seems to confirm that, in the case of mixed traffic, the speed difference between vehicles is a serious road safety issue [40,41]. Moreover, congested traffic flows naturally imply less maneuvering space for motor-vehicles. On the other hand, the night period also seems to be less dangerous for e-scooters (in terms of crash frequency) because the motor-vehicle traffic volume is scarce, even less than the motor-vehicle calm hours which, in conclusion, seem to be the worst condition for the e-scooter crash frequency. However, at the same time, statistical analyses indicate that crashes occurring during night hours exhibit higher severity. This result seems in line with the existing literature, which highlights the issue of nighttime crashes, even though they are relatively few with respect to daytime hours [42,43]. In addition, the sideswipe crash type was revealed as more likely than single-vehicle crashes during night hours. Hence, while the e-scooter traffic flow and crashes are substantially low during night hours, according with the literature [44,45], some criticalities were highlighted with respect to the injury severity and to conflicts leading to sideswipe crashes.
Most crashes occurred during summer (see also [42,46,47]), as well as during daylight hours. Clearly, this result can be attributed to the increased usage rate of e-scooters during warm weather and daylight hours. In fact, by looking at aggregate statistics from “Vento Mobility srl”, an e-scooter sharing provider in Bari (2022 data), seasonal variations in e-scooter usage rates seem in line with the percentages shown in Table 2 and reported in Figure 3. Moreover, the same figure graphically reports the combined effect of the two factors (season and lighting conditions). For analyzing the combination of variables, it should be considered that, on average, during autumn and winter, the number of daylight hours is similar (<11 h), while daylight hours are also similar during summer and spring (about 14 h). Hence, one should expect similar shares of crashes without natural light during the two macro-categories of seasons: (1) spring–summer, and (2) autumn–winter. However, by looking at the percentages in the figure below, while autumn and winter crashes confirm this tendency (in both cases, about 37% of crashes occurred without natural light), crashes occurring in the absence of natural light during summer were significantly higher (9% out of a total 39% summer crashes, about 23%) than crashes occurring under the same conditions during spring (2% out of a total 21% spring crashes, less than 10%). This could again be attributed to the higher usage rate of e-scooters during summer evenings with respect to spring, confirmed by looking at the above-mentioned aggregate statistics of the e-scooter provider. Hence, based on these data, no particular influence of season and natural lighting conditions on the e-scooter safety can be highlighted.
As far as different road elements are concerned, these are analyzed together with crash types, in order to discuss some useful planning and design implications. Figure 4 shows the distribution of e-scooter crashes with respect to the geometric element (segment or intersection, including roundabouts) where the crash occurred. In the same bar chart, the classification by road type and crash type is reported for crashes that occurred to all other vehicles in the same city, based on [33].
By looking at this figure, two main arguments can be discussed: (a) the classification of e-scooter crash types for different road elements, and (b) the difference between e-scooter crashes and other vehicle crashes. As far as the first point is concerned, it is evident that e-scooter single-vehicle and pedestrian crashes at segments outnumber single-vehicle and pedestrian crashes at intersections. This is a peculiar aspect of e-scooters, since the same tendency is not that evident for other vehicle crashes. The larger share of e-scooter single-vehicle crashes at segments could be explained by greater speeds and less attention, which is typically higher when crossing traffic nodes. The larger share of e-scooter crashes with pedestrians at segments could be explained by the reduced maneuvering space left for the e-scooter driver (who may drive on the edge of the carriageway) to avoid a pedestrian who is crossing the street. This suggests paying attention to the design of pedestrian crossings, especially in narrow streets traveled by e-scooters and provided with parking lots at both sides. On the other hand, e-scooter angle crashes are clearly higher at intersections than at segments, as also confirmed by statistical analyses, but, in this case, the same tendency can be noted for other vehicle crashes. However, this was expected given the intrinsic nature of angle crashes, which depend on intersecting conflicts. Moreover, the analysis of crash reports revealed that distracted driving is a frequent cause of angle e-scooter collisions at intersections. Other peculiar differences of e-scooter crashes with respect to other vehicle crashes lie in a disproportionate share of single-vehicle crashes (about one third of all crashes) and, to a lesser extent, in significantly fewer rear-end crashes. The first aspect highlights how e-scooter drivers can be significantly exposed to losing control of the vehicle, to a far greater extent than other vehicles. This can be triggered by bad pavement conditions, distraction, and/or attempts at evasive maneuvers to avoid obstacles, vehicles, or pedestrians on the road. In fact, both improving road design and maintaining existing roads are commonly deemed helpful solutions to reduce e-scooter crashes [30]. On the other hand, rear-end crashes caused by e-scooters may be less frequent than those caused by other vehicles given their reduced stopping distance at low speeds.
The peculiar situation of pedestrian hits can be also solved by reducing the interactions between pedestrians and e-scooters that, in other contexts, were also due to e-scooters irregularly travelling on sidewalks [31,32].
The latter discussion about single-vehicle e-scooter crashes can be compared (see Table 2) with the share of crashes that occurred on wet pavements or with having bad pavements as the main crash contributing factor. However, it is worth noting that crashes on wet pavements are only 3% of all e-scooter crashes and that “road surface issues” were highlighted as crash dynamics in the police reports in only 11% of cases. Hence, while it is obvious that pavement maintenance is of paramount importance for e-scooter safety [30], it is also evident that other factors should justify the great share of single-vehicle crashes. It is worth noting that the extremely small percentage of crashes on wet pavements also imply that bad weather conditions influence e-scooter users, who tend to dismiss the e-scooter as a mobility alternative in such conditions (see also [15]). Furthermore, statistical analyses indicate that crashes occurring due to dynamics related to road surface issues have a higher severity compared to crashes not caused by e-scooters. Hence, while e-scooter crashes due to road surface issues are relatively few (11%), they are associated with a higher severity, which has important practical implications.
The age of involved users in e-scooter crashes is in line with other studies. In fact, the average age of crashed users is approximately 31 years, according to the literature [15,48]. Moreover, the average age of e-scooter drivers can have an impact on crash severity [28]. This aspect was deeply investigated by a study conducted in Denmark [49], with specific regard to the young age of e-scooter drivers involved in crashes. Starting from hospital reports about severe head and musculoskeletal injuries involving users aged between 18 and 25 years old, the study establishes a correlation between observed behaviors leading to these crashes and the consumption of alcohol and drugs. Clearly, based on these results, awareness campaigns dedicated to young users are needed.
The results regarding gender differences related to e-scooter crashes are in line with the existing literature, which also indicates a male predisposition for involvement in such accidents [50,51].
Five percent of crashes involved a second passenger on the e-scooter. This is a traffic violation since riding e-scooters with passengers is not allowed. This behavior falls under user negative behavior like wearing headphones, talking with other cyclists, or using a mobile phone while driving [18]. One possible countermeasure to prevent this issue is implementing weight-control devices on e-scooters.
An important aspect to consider is that e-scooters are available in two forms, shared and private. Italian cities were able to introduce e-scooter sharing services starting from 2019, thanks to a national law (L. 30.12.2018, 2018), and specific local regulations that respect the boundaries imposed by the government (D.M. 04.06.2019, 2019). In fact, national standards provide more details about how the e-scooter sharing experimentation should be conducted: e-scooters must satisfy a number of technical constraints (e.g., a power of at most 0.5 kW and a limited maximum speed of 20 km/h); e-scooters are allowed in pedestrian zones with speed limiters to keep speed below 6 km/h; and in shared bicycle–pedestrian lanes, bicycle lanes, and 30 km/h zones, if they are equipped with speed limiters up to 20 km/h [16]. In order to adequately discuss the percentage split of crashes into private and sharing e-scooters, data from the conducted in situ e-scooter traffic surveys should again be considered. Thanks to these surveys, it was possible to estimate the percentage of sharing e-scooters which crossed the surveyed road sections, relative to the total number of e-scooters. The measured percentage of sharing e-scooters is 23%. Since surveys were conducted in the spring of 2023, this percentage was compared with crashes which occurred only in the last semester of available crash data in 2022. In fact, using the percentage of e-scooter sharing crashes in Table 2 (28%) referring to the overall observation period (2020–2022), the possible change in the sharing/private usage ratio since its beginning in 2020 would have not been detected. In the last available semester of 2022, the percentage of sharing e-scooter crashes (23% out of 60 crashes with no missing data) is perfectly in line with the percentage emerging from traffic surveys. Thus, the e-scooter type seems not to be influential on e-scooter safety. This can be explained by the fact that shared scooters have an imposed 20 km/h speed limitation but, on the other hand, e-scooter sharing users are expected to be less experienced and thus possibly more accident-prone. Thus, the current speed limitation applied to shared e-scooters appears to be an appropriate measure to prevent accidents due to users’ unfamiliarity.
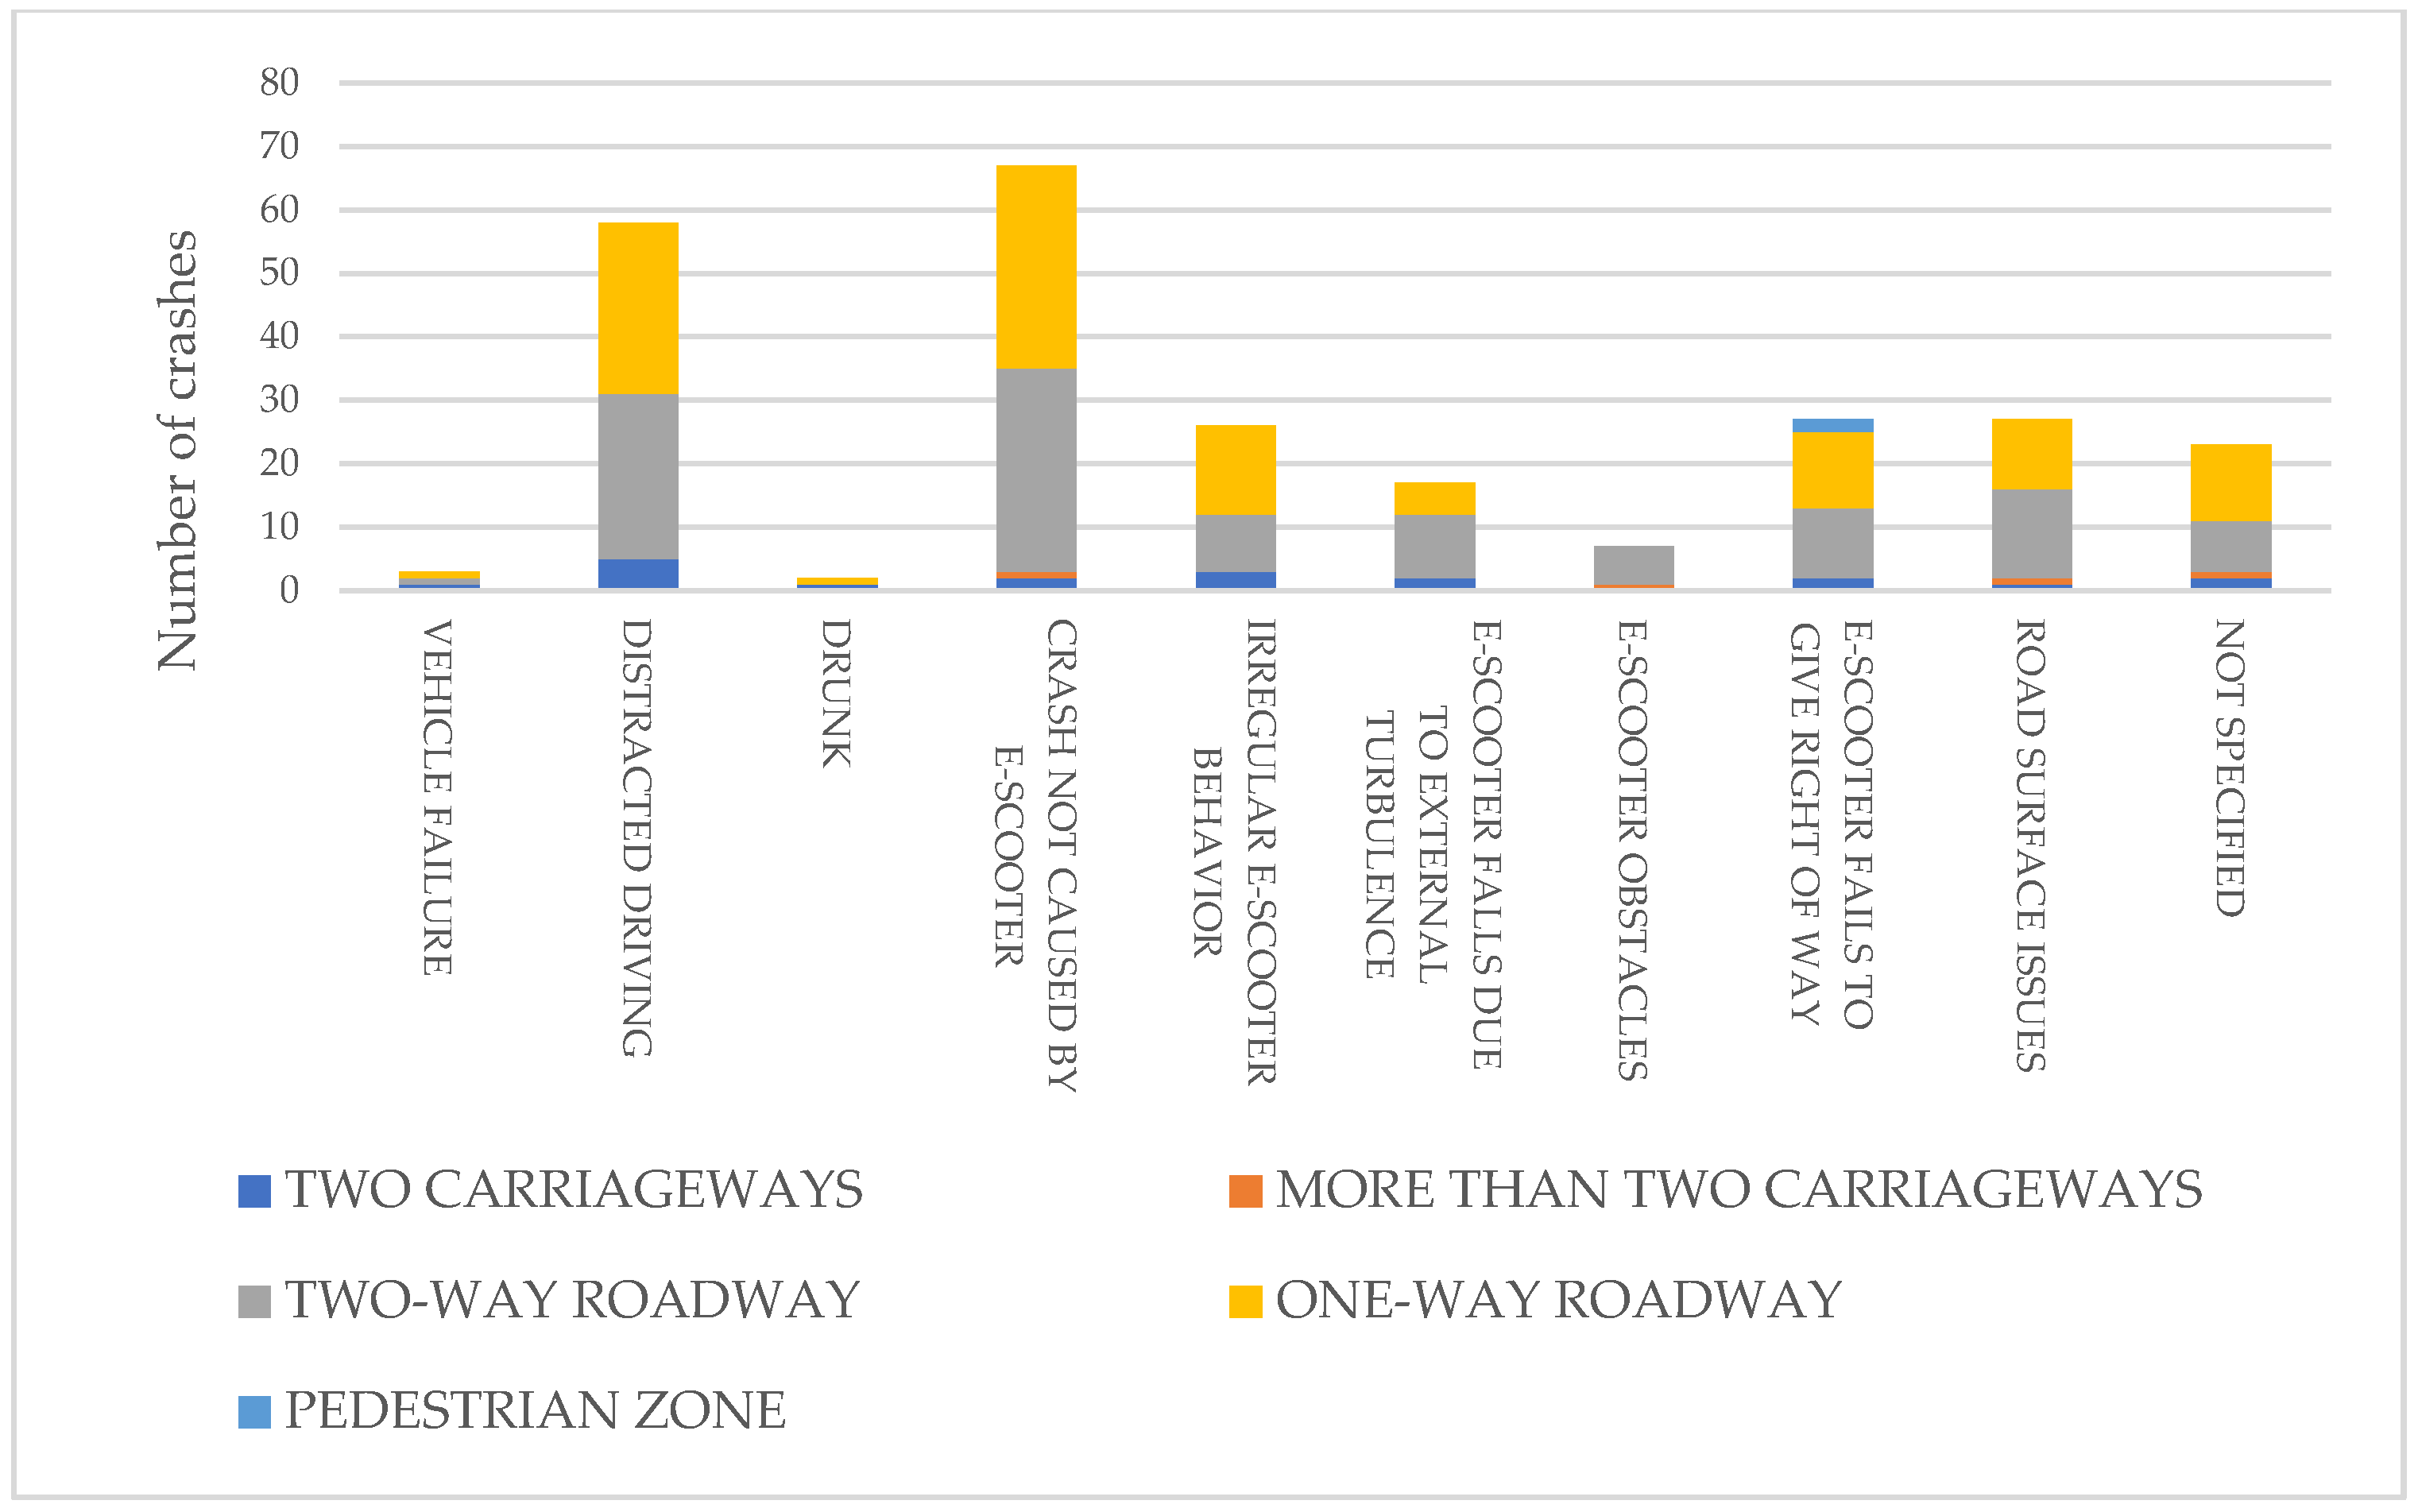
The information about crash-contributing factors and dynamics can be coupled together with infrastructure-related variables, already presented at the beginning of this section, aiming to obtain some useful insights. Figure 5 graphically reports the combination of these variables. E-scooter crashes on undivided roads outnumber those on divided roads (which may have two or more carriageways, as reported in the figure), as previously reported. However, it is interesting to note that the two major dynamics/contributing factors (distracted driving and crashes not caused by e-scooters) are not equally distributed among divided and undivided roads. In fact, a significant share of distracted driving e-scooter crashes occurs on divided roads (dark blue and orange bars in the figure), while very few crashes not caused by e-scooters occur on the same category of roads. This confirms the initial hypothesis made about the high-speed differential between e-scooter and other vehicles on divided roads. Moreover, the speculation is corroborated by the result from this further analysis which reveals that most crashes on divided roads seem not to be caused by the e-scooter drivers, who, however, may suffer severe consequences from their distraction while driving. Hence, it is paramount to implement speed reduction measures on divided roads traveled by mixed traffic flows including e-scooters, or to build dedicated paths. An interesting aspect is the one-/two-way road classification (respectively, the yellow and grey bars in Figure 5). As previously reported, crashes are almost equally split among the two categories, and this is clearly visible even after dividing crashes according to contributing factors. However, as a peculiar aspect, it is possible to note that the dynamic “e-scooter falls due to external turbulence” is much more unbalanced in favor of two-way roads. This is clearly due to the higher possibility of traffic conflicts on two-way compared to one-way roads. Moreover, even if they represent very few cases, the dynamic revealing the parked e-scooter being passively hit during a crash (renamed in the figure “e-scooter obstacles”) is present only on two-way roads (among the undivided roads). This reflects the need for eliciting a safe parking behavior for e-scooter users, or to provide dedicated parking spaces, especially on two-way roads.
Traveling outside the bike path seems very dangerous, as also stated in other studies [28,52]. Strengthening and enhancing the visibility of bike path signage can effectively guide and inform both cyclists and other road users about the dedicated cycling infrastructure. This may involve clear and frequent signage indicating the presence of a bike path, using universally understood symbols and colors. Additionally, public awareness campaigns and educational initiatives could be implemented to promote the importance of bike path usage and its benefits for overall road safety and traffic flow. Collaborating with local authorities, communities, and cycling advocacy groups can contribute to a comprehensive strategy for increasing adherence to bike path usage. At least, given the evidence of the different safety outcomes of using/not using the cycle path, a specific traffic rule could be introduced in the national regulation, which should consider riding e-scooters and bikes outside the cycling path (when they are present) a traffic violation.
The positive effects of bike paths in preventing e-scooter crashes can be also improved, in order to meet the zero crashes target, by applying some useful countermeasures. In fact, the dynamics of crashes recorded on the bike path are mainly due to vehicles encroaching on bike lanes by crossing them or while opening car doors (8 out of 21), road surface deterioration (3 out of 21), and cars not yielding the right of way to e-scooters on the cycle path (4 out of 21). Hence, providing wide or physical separations between car lanes and bike paths is crucial to prevent those accidents. In addition, it is clear that protecting or dividing cycle paths from road lanes can prevent vehicle intrusion-related crashes. Moreover, a regular maintenance program of the cycle path pavement can enhance safety and comfort (inducing more users to use bike lanes). As for the right of way, some other countermeasures can be thought of, with the aim of improving as much as possible the already high safety conditions of e-scooters on bike lanes.
5. Conclusions
The increasing penetration of e-scooters in the urban daily traffic implies that a safety assessment is needed to identify the main issues and identify possible countermeasures. Thus, the main aim of the proposed work was to analyze the crash occurrence of e-scooters and carve out all the possible causes, contributing factors, and patterns, including different crash types and severity. The analysis is based on the case study of the City of Bari (Italy), where e-scooters started circulating at the beginning of 2020. The investigated crashes, based on police reports, were related to the most recently available dataset, from July 2020 to November 2022. They were grouped according to different aspects of interest, like severity, road type, crash type, season, motor-vehicle traffic, age, and sex (Table 2). The results of a specific on-site survey were also used in the analysis.
As a general remark about the e-scooter crash injury severity in Bari no fatal crashes occurred, but 70% of the recorded crashes included at least one injured person. Thus, starting from this result, a first solution to reduce injuries can certainly be the introduction of laws that make protecting gear compulsory, as discussed worldwide. For instance, in the U.S., analyzing social media posts, only 6% of users seemed to wear protective gear [53], even though a great number of head, trunk, hand, and foot injuries have been widely reported after e-scooter crashes [54,55]. Results from the statistical analyses revealed that injury severity increases at night, in crashes with pedestrians involved, and with dynamics associated with road surface issues.
More specifically, divided roads seem less safe than undivided ones for e-scooters; calm hours, different than night hours, seem the most dangerous condition in terms of crash occurrence (even if e-scooter crashes are more severe during night hours); the greater percentage of crashes during summer and daylight hours are justified by the related increased usage rate (exposure) of e-scooters; e-scooter urban crash types are blatantly different than other vehicles (the most recurrent crash type is the single-vehicle one, especially at segments); e-scooter crashes with pedestrians (also more frequent at segments than intersections) lead to an increased severity; the larger share of private e-scooter crashes seems justified by their greater usage rate compared to the shared ones; e-scooter drivers not using the cycle paths are significantly more at risk than those using them; and irregular or distracted behavior is the most influential contributing factor associated with e-scooter crashes.
Considering the nature of the presented work, the analysis of crash data can be useful in identifying some practical countermeasures to reduce both fatalities and injuries on roads. With this aim, some practical implications of the study can be highlighted. Starting from infrastructural elements, the high crash rates occurring on roads suggest building new cycle paths or adjusting the existing ones to increase road safety. This first consideration must be strictly linked to the geo-spatial analysis of crashes. Intervention on cycle paths should be prioritized in those roads where crashes with e-scooters and vehicles are high and severe. Moreover, considering that choosing to neglect the cycle path where it is present induces higher risks, a specific traffic rule could be introduced in the national regulations, which should consider riding e-scooters and bikes outside the cycle path (when they are present) a traffic violation. Thus, results from this analysis can have implications for improving infrastructures, but also from a regulatory point of view.
Noticing the severity associated with pedestrian hits, some remarks emerge for practical implications. Firstly, high-risk interactions between pedestrians and e-scooters must be prevented at both the infrastructural and regulatory levels, on sidewalks and pedestrian areas. For the former issue, the use of unfriendly road pavement for e-scooters can be a solution; for the latter, tickets should be introduced in the case of violation of pedestrian areas or sidewalks by e-scooters.
At a regulatory level, several other interventions can be proposed starting from the highlighted results: circumscribing e-scooter use, not only outside the cycle paths, but also in terms of age restrictions and weight-control devices on e-scooters, to mitigate risky behaviors and potential violations.
Apart from the mentioned practical implications, other strategic solutions can be thought of, which may act on society’s approach to micromobility. An example can be the introduction of user awareness programs that can help to reduce distracted driving behavior and increase compliance to traffic rules, ultimately contributing to a safer environment for all road users. At an operational level, increasing the collaboration among all stakeholders (local authorities, e-scooter sharing companies, and others) can also be beneficial for a safer e-scooter environment.
Looking at all the implications that a simple crash data analysis can have, the importance of studies investigating e-scooter crashes in different contexts becomes evident. Under this light, the detailed analysis of the specific characteristics of Bari and the consideration of local factors influencing e-scooter crashes can find their own spot. The proposed approach allows an immediate one-to-one correspondence between safety issues and possible mitigation strategies to meet the needs of the local community, thereby contributing to improving e-scooter user safety in the City of Bari. Of course, results can be applied to similar contexts and comparable conditions.
The methodological approaches and best practices identified can be generally applied to other similar urban contexts, providing a useful framework to address e-scooter safety challenges, which can be integrated into general frameworks for urban road safety improvements [56]. Moreover, all findings seem to be in line with the previous literature, strengthening the idea of recurrent crash paths and circumstances for e-scooters, no matter the site of investigation. A limitation of this study is the inability to develop crash prediction models due to limited available temporal information. Typically, a minimum period of 3 years is recommended [57]. Additionally, the absence of traffic volume data on various road segments and the possible influence of the pandemic period on the crash frequency (see also [58]) have contributed to this limitation. However, it is anticipated that future studies related to this article will address this gap.
Therefore, the results of this study can serve as a foundation for developing policies and safety strategies in other urban settings.
Author Contributions
Conceptualization, V.R. and P.L.; methodology, V.R., S.C., P.I. and P.L.; validation, V.R. and P.I.; investigation, P.I. and P.L.; data curation, N.B., P.I. and P.L.; writing—original draft preparation, S.C., P.I. and P.L.; writing—review and editing, V.R., P.L., P.I. and S.C.; visualization, N.B. and S.C.; supervision, V.R. All authors have read and agreed to the published version of the manuscript.
Funding
This research received no external funding.
Data Availability Statement
The data used in this research are subject to privacy issues, and therefore they will be available only upon reasonable request.
Acknowledgments
The Local Police of the City of Bari is acknowledged for the support and availability in sharing data for research purposes. The authors would also like to thank Vento Mobility srl for support and the transmission of data useful for defining traffic data.
Conflicts of Interest
The authors declare no conflict of interest.
References
- Baek, K.; Lee, H.; Chung, J.H.; Kim, J. Electric scooter sharing: How do people value it as a last-mile transportation mode? Transp. Res. Part D Transp. Environ. 2021, 90, 102642. [Google Scholar] [CrossRef]
- McQueen, M.; Clifton, K.J. Assessing the perception of E-scooters as a practical and equitable first-mile/last-mile solution. Transp. Res. Part A Policy Pract. 2022, 165, 395–418. [Google Scholar] [CrossRef]
- Zuniga-Garcia, N.; Tec, M.; Scott, J.G.; Machemehl, R.B. Evaluation of e-scooters as transit last-mile solution. Transp. Res. Part C Emerg. Technol. 2022, 139, 103660. [Google Scholar] [CrossRef]
- Kazemzadeh, K.; Haghani, M.; Sprei, F. Electric scooter safety: An integrative review of evidence from transport and medical research domains. Sustain. Cities Soc. 2022, 89, 104313. [Google Scholar] [CrossRef]
- Liu, M.; Seeder, S.; Li, H. Analysis of e-scooter trips and their temporal usage patterns. Inst. Transp. Eng. ITE J. 2019, 89, 44–49. [Google Scholar]
- Glavić, D.; Trpković, A.; Milenković, M.; Jevremović, S. The E-Scooter Potential to Change Urban Mobility—Belgrade Case Study. Sustainability 2021, 13, 5948. [Google Scholar] [CrossRef]
- Latinopoulos, C.; Patrier, A.; Sivakumar, A. Planning for e-scooter use in metropolitan cities: A case study for Paris. Transp. Res. Part D Transp. Environ. 2021, 100, 103037. [Google Scholar] [CrossRef]
- Mclean, R.; Williamson, C.; Kattan, L. Simulation Modeling of Urban E-Scooter Mobility. In Proceedings of the 2021 29th International Symposium on Modeling, Analysis, and Simulation of Computer and Telecommunication Systems (MASCOTS), Houston, TX, USA, 3–5 November 2021; IEEE: Piscataway, NJ, USA, 2021; pp. 1–8. [Google Scholar]
- Feng, C.; Jiao, J.; Wang, H. Estimating e-scooter traffic flow using big data to support planning for micromobility. J. Urban Technol. 2022, 29, 139–157. [Google Scholar] [CrossRef]
- Laa, B.; Leth, U. Survey of E-scooter users in Vienna: Who they are and how they ride. J. Transp. Geogr. 2020, 89, 102874. [Google Scholar] [CrossRef]
- Sanders, R.L.; Branion-Calles, M.; Nelson, T.A. To scoot or not to scoot: Findings from a recent survey about the benefits and barriers of using E-scooters for riders and non-riders. Transp. Res. Part A Policy Pract. 2020, 139, 217–227. [Google Scholar] [CrossRef]
- Cloud, C.; Heß, S.; Kasinger, J. Do shared e-scooter services cause traffic crashes? Evidence from six European countries. arXiv 2022, arXiv:2209.06870. [Google Scholar]
- Karpinski, E.; Bayles, E.; Daigle, L.; Mantine, D. Comparison of motor-vehicle involved e-scooter fatalities with other traffic fatalities. J. Saf. Res. 2024, 84, 61–73. [Google Scholar] [CrossRef]
- Kelly, C.; O’Hare, C.; Ceannt, R.; O’Mahony, M.; Kelly, I.; McDermott, R.; Kiernan, R. An Analysis of E-Scooter Related Trauma. Ir. Med. J. 2022, 115, P642. [Google Scholar]
- Bieliński, T.; Ważna, A. Electric scooter sharing and bike sharing user behaviour and characteristics. Sustainability 2020, 12, 9640. [Google Scholar] [CrossRef]
- D’andreagiovanni, F.; Nardin, A.; Carrese, S. An Analysis of the Service Coverage and Regulation of E-Scooter Sharing in Rome (Italy). Transp. Res. Procedia 2022, 60, 440–447. [Google Scholar] [CrossRef]
- Pazzini, M.; Cameli, L.; Lantieri, C.; Vignali, V.; Dondi, G.; Jonsson, T. New means of transport for micro-mobility: An analysis of electric scooter users’ behaviour in Trondheim. Int. J. Environ. Res. Public Health 2022, 19, 7374. [Google Scholar] [CrossRef] [PubMed]
- Huemer, A.K.; Banach, E.; Bolten, N.; Helweg, S.; Koch, A.; Martin, T. Secondary task engagement, risk-taking, and safety-related equipment use in German bicycle and e-scooter riders—An observation. Crash Anal. Prev. 2022, 172, 106685. [Google Scholar] [CrossRef] [PubMed]
- Prencipe, L.P.; Colovic, A.; De Bartolomeo, S.; Caggiani, L.; Ottomanelli, M. An efficiency indicator for micromobility safety assessment. In Proceedings of the 2022 IEEE International Conference on Environment and Electrical Engineering and 2022 IEEE Industrial and Commercial Power Systems Europe (EEEIC/I&CPS Europe), Prague, Czech Republic, 28 June–1 July 2022; IEEE: Piscataway, NJ, USA, 2022; pp. 1–6. [Google Scholar]
- Li, T.; Kovaceva, J.; Dozza, M. Modeling collision avoidance maneuvers for micromobility vehicles. J. Saf. Res. 2023, 87, 232–243. [Google Scholar] [CrossRef] [PubMed]
- Vetturi, D.; Tiboni, M.; Maternini, G.; Barabino, B.; Ventura, R. Kinematic performance of micro-mobility vehicles during braking: Experimental analysis and comparison between e-kick scooters and bikes. Transp. Res. Procedia 2023, 69, 408–415. [Google Scholar] [CrossRef]
- Ventura, R.; Ghirardi, A.; Vetturi, D.; Maternini, G.; Barabino, B. Comparing the vibrational behaviour of e-kick scooters and e-bikes: Evidence from Italy. Int. J. Transp. Sci. Technol. 2023, in press. [Google Scholar] [CrossRef]
- Vella, A.D.; Digo, E.; Gastaldi, L.; Pastorelli, S.; Vigliani, A. Statistical Analysis of the Vibrations Transmitted from an Electric Kick Scooter to Riders. Exp. Tech. 2024, 1–11. [Google Scholar] [CrossRef]
- Brownson, A.B.; Fagan, P.V.; Dickson, S.; Civil, I.D. Electric scooter injuries at Auckland City Hospital. N. Z. Med. J. 2019, 132, 62–72. [Google Scholar]
- Stigson, H.; Malakuti, I.; Klingegård, M. Electric scooters accidents: Analyses of two Swedish accident data sets. Accid. Anal. Prev. 2021, 163, 106466. [Google Scholar] [CrossRef]
- Brunner, P.; Löcken, A.; Denk, F.; Kates, R.; Huber, W. Analysis of experimental data on dynamics and behaviour of e-scooter riders and applications to the impact of automated driving functions on urban road safety. In Proceedings of the 2020 IEEE Intelligent Vehicles Symposium (IV), Las Vegas, NV, USA, 19 October–13 November 2020; IEEE: Piscataway, NJ, USA, 2020; pp. 219–225. [Google Scholar]
- Ptak, M.; Fernandes, F.A.; Dymek, M.; Welter, C.; Brodziński, K.; Chybowski, L. Analysis of electric scooter user kinematics after a crash against SUV. PLoS ONE 2022, 17, e0262682. [Google Scholar] [CrossRef]
- Sun, Y.; Lu, J.; Ren, G.; Ma, J. Exploring the heterogeneities of factors affecting e-bicyclist severities in delivery e-scooter crashes. J. Transp. Saf. Secur. 2023, 1–24. [Google Scholar] [CrossRef]
- Das, S.; Hossain, A.; Rahman, M.A.; Sheykhfard, A.; Kutela, B. Case Study on the Traffic Collision Patterns of E-Scooter Riders. Transp. Res. Rec. 2023. [Google Scholar] [CrossRef]
- White, E.; Guo, F.; Han, S.; Mollenhauer, M.; Broaddus, A.; Sweeney, T.; Robinson, S.; Novotny, A.; Buehler, R. What factors contribute to e-scooter crashes: A first look using a naturalistic riding approach. J. Saf. Res. 2023, 85, 182–191. [Google Scholar] [CrossRef] [PubMed]
- Oshanreh, M.M.; Malarkey, D.; MacKenzie, D. Evaluation of AI-based Feedback System for Reducing Sidewalk Riding by Shared e-scooter Users. Available online: https://digital.lib.washington.edu/researchworks/handle/1773/51015 (accessed on 9 March 2024).
- Kuskapan, E.; Campisi, T.; De Cet, G.; Vianello, C.; Çodur, M.Y. Examination of the Effects of the Pandemic Process on the E-scooter Usage Behaviours of Individuals with Machine Learning. Trans. Transp. Sci. 2023, 14, 25–31. [Google Scholar] [CrossRef]
- Intini, P.; Berloco, N.; Cavalluzzi, G.; Lord, D.; Ranieri, V.; Colonna, P. The variability of urban safety performance functions for different road elements: An Italian case study. Eur. Transp. Res. Rev. 2021, 13, 30. [Google Scholar] [CrossRef]
- Ranieri, V. Intermediate Report of the Research Project “PUMS_CMB” (Agreement between Politecnico di Bari and Metropolitan City of Bari for Drafting Parts of the Sustainable Mobility Plan of the Metropolitan City of Bari): Analysis of Trips in the Metropolitan City of Bari; Technical Report; Politecnico di Bari: Bari, Italy, 2022. [Google Scholar]
- Abou-Senna, H.; Radwan, E.; Abdelwahab, H.T. Categorical principal component analysis (CATPCA) of pedestrian crashes in Central Florida. J. Transp. Saf. Secur. 2022, 14, 1890–1912. [Google Scholar] [CrossRef]
- Wolshon, B.; Pande, A. Traffic Engineering Handbook; John Wiley & Sons: Hoboken, NJ, USA, 2016. [Google Scholar]
- Zou, Z.; Younes, H.; Erdoğan, S.; Wu, J. Exploratory analysis of real-time e-scooter trip data in Washington, DC. Transp. Res. Rec. 2020, 2674, 285–299. [Google Scholar] [CrossRef]
- Younes, H.; Noland, R.B.; Andrews, C.J. Gender split and safety behavior of cyclists and e-scooter users in Asbury Park, NJ. Case Stud. Transp. Policy 2023, 14, 101073. [Google Scholar] [CrossRef]
- Foissaud, N.; Gioldasis, C.; Tamura, S.; Christoforou, Z.; Farhi, N. Free-floating e-scooter usage in urban areas: A spatiotemporal analysis. J. Transp. Geogr. 2022, 100, 103335. [Google Scholar] [CrossRef]
- Aarts, L.; Van Schagen, I. Driving speed and the risk of road crashes: A review. Accid. Anal. Prev. 2006, 38, 215–224. [Google Scholar] [CrossRef]
- Quddus, M. Exploring the relationship between average speed, speed variation, and accident rates using spatial statistical models and GIS. J. Transp. Saf. Secur. 2013, 5, 27–45. [Google Scholar] [CrossRef]
- Shah, N.R.; Aryal, S.; Wen, Y.; Cherry, C.R. Comparison of motor vehicle-involved e-scooter and bicycle crashes using standardized crash typology. J. Saf. Res. 2021, 77, 217–228. [Google Scholar] [CrossRef] [PubMed]
- Shah, N.R.; Cherry, C.R. The Chance of Getting Struck by a Car on an e-Scooter is Twice as High at Night; Findings: Sidney, Australia, 2022. [Google Scholar]
- Gao, D.; Zhang, X. Injury severity analysis of single-vehicle and two-vehicle crashes with electric scooters: A random parameters approach with heterogeneity in means and variances. Accid. Anal. Prev. 2024, 195, 107408. [Google Scholar] [CrossRef] [PubMed]
- Cicchino, J.B.; Kulie, P.E.; McCarthy, M.L. Severity of e-scooter rider injuries associated with trip characteristics. J. Saf. Res. 2021, 76, 256–261. [Google Scholar] [CrossRef] [PubMed]
- Yang, H.; Ma, Q.; Wang, Z.; Cai, Q.; Xie, K.; Yang, D. Safety of micro-mobility: Analysis of E-Scooter crashes by mining news reports. Accid. Anal. Prev. 2020, 143, 105608. [Google Scholar] [CrossRef]
- Störmann, P.; Klug, A.; Nau, C.; Verboket, R.D.; Leiblein, M.; Müller, D.; Schweigkofler, U.; Hoffmann, R.; Marzi, I.; Lustenberger, T. Characteristics and patterns of injury in electric scooter-related crashes: A prospective report on two centers in Germany. J. Clin. Med. 2020, 9, 1569. [Google Scholar] [CrossRef]
- Kleinertz, H.; Ntalos, D.; Hennes, F.; Nüchtern, J.V.; Frosch, K.H.; Thiesen, D.M. Crash mechanisms and injury patterns in E-scooter users: A retrospective analysis and comparison with cyclists. Dtsch. Ärzteblatt Int. 2021, 118, 117. [Google Scholar]
- Blomberg, S.N.F.; Rosenkrantz, O.C.M.; Lippert, F.; Christensen, H.C. Injury from electric scooters in Copenhagen: A retrospective cohort study. BMJ Open 2019, 9, e033988. [Google Scholar] [CrossRef]
- Aman, J.J.; Smith-Colin, J.; Zhang, W. Listening to electric scooter users: Extracting rider satisfaction factors from app store reviews. Transp. Res. Part D Transp. Environ. 2021, 95, 102856. [Google Scholar] [CrossRef]
- Mair, O.; Wurm, M.; Müller, M.; Greve, F.; Pesch, S.; Pförringer, D.; Biberthaler, P.; Kirchhoff, C.; Zyskowski, M. E-Scooter-Unfälle und deren Folgen: Erste prospektive Analyse der Verletzungsrate und Verletzungsmuster im urbanen Raum einer deutschen Millionenstadt. Der Unfallchirurg 2021, 124, 382. [Google Scholar] [CrossRef]
- Tian, D.; Ryan, A.D.; Craig, C.M.; Sievert, K.; Morris, N.L. Characteristics and risk factors for electric scooter-related crashes and injury crashes among scooter riders: A two-phase survey study. Int. J. Environ. Res. Public Health 2022, 19, 10129. [Google Scholar] [CrossRef] [PubMed]
- Allem, J.P.; Majmundar, A. Are electric scooters promoted on social media with safety in mind? A case study on Bird’s Instagram. Prev. Med. Rep. 2019, 13, 62–63. [Google Scholar] [CrossRef] [PubMed]
- Badeau, A.; Carman, C.; Newman, M.; Steenblik, J.; Carlson, M.; Madsen, T. Emergency department visits for electric scooter-related injuries after introduction of an urban rental program. Am. J. Emerg. Med. 2019, 37, 1531–1533. [Google Scholar] [CrossRef] [PubMed]
- Harbrecht, A.; Hackl, M.; Leschinger, T.; Uschok, S.; Wegmann, K.; Eysel, P.; Müller, L.P. What to expect. Inj. Patterns Crashes Electr. Scoot. 2022, 32, 641–647. [Google Scholar]
- Colonna, P.; Intini, P.; Berloco, N.; Fedele, V.; Masi, G.; Ranieri, V. An integrated design framework for safety interventions on existing urban roads—Development and case study application. Safety 2019, 5, 13. [Google Scholar] [CrossRef]
- AASHTO (American Association of State Highway and Transportation Officials). Highway Safety Manual; American Association of State Highway and Transportation Officials: Washington, DC, USA, 2010. [Google Scholar]
- Colonna, P.; Intini, P. Compensation effect between deaths from Covid-19 and crashes: The Italian case. Transp. Res. Interdiscip. Perspect. 2020, 6, 100170. [Google Scholar] [CrossRef]
Figure 1.
Geospatial distribution of e-scooter crashes, as reported in the dataset.
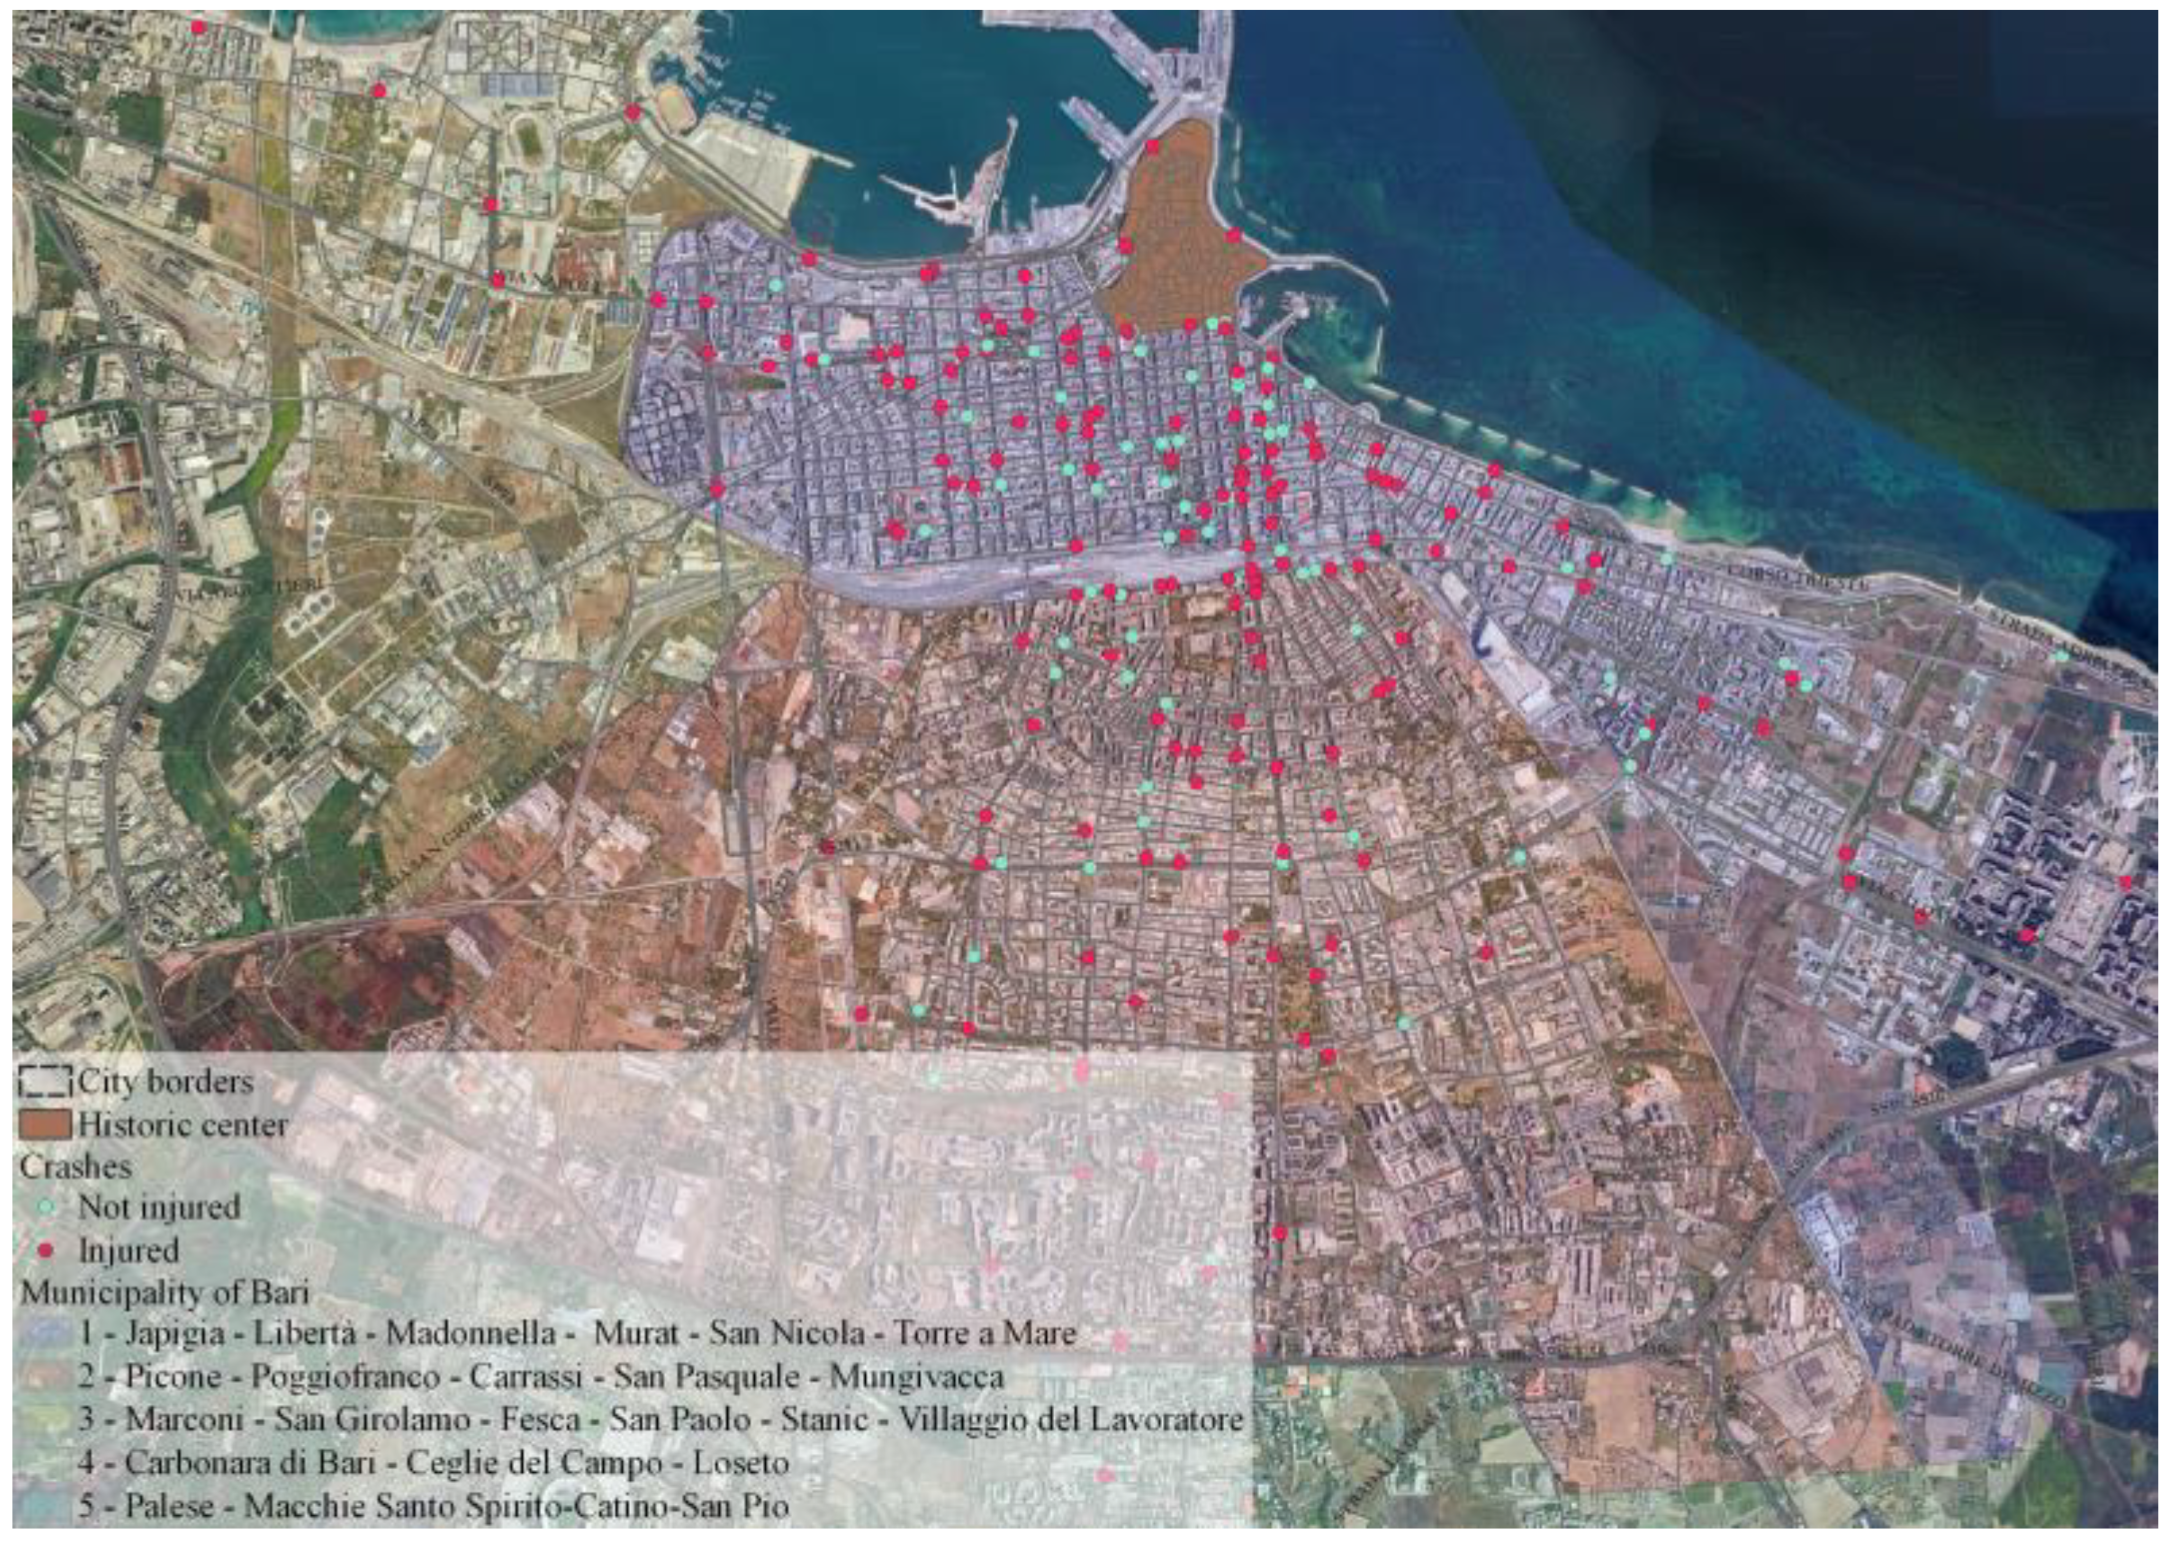
Figure 2.
Heatmap of the distribution of crashes: (a) Overall crashes. (b) Crashes divided by severity (light blue: not injured, pink: injured). (c) Crashes divided by type (violet: angle; blue: pedestrian hit; green: sideswipe; red: single-vehicle).
Figure 2.
Heatmap of the distribution of crashes: (a) Overall crashes. (b) Crashes divided by severity (light blue: not injured, pink: injured). (c) Crashes divided by type (violet: angle; blue: pedestrian hit; green: sideswipe; red: single-vehicle).
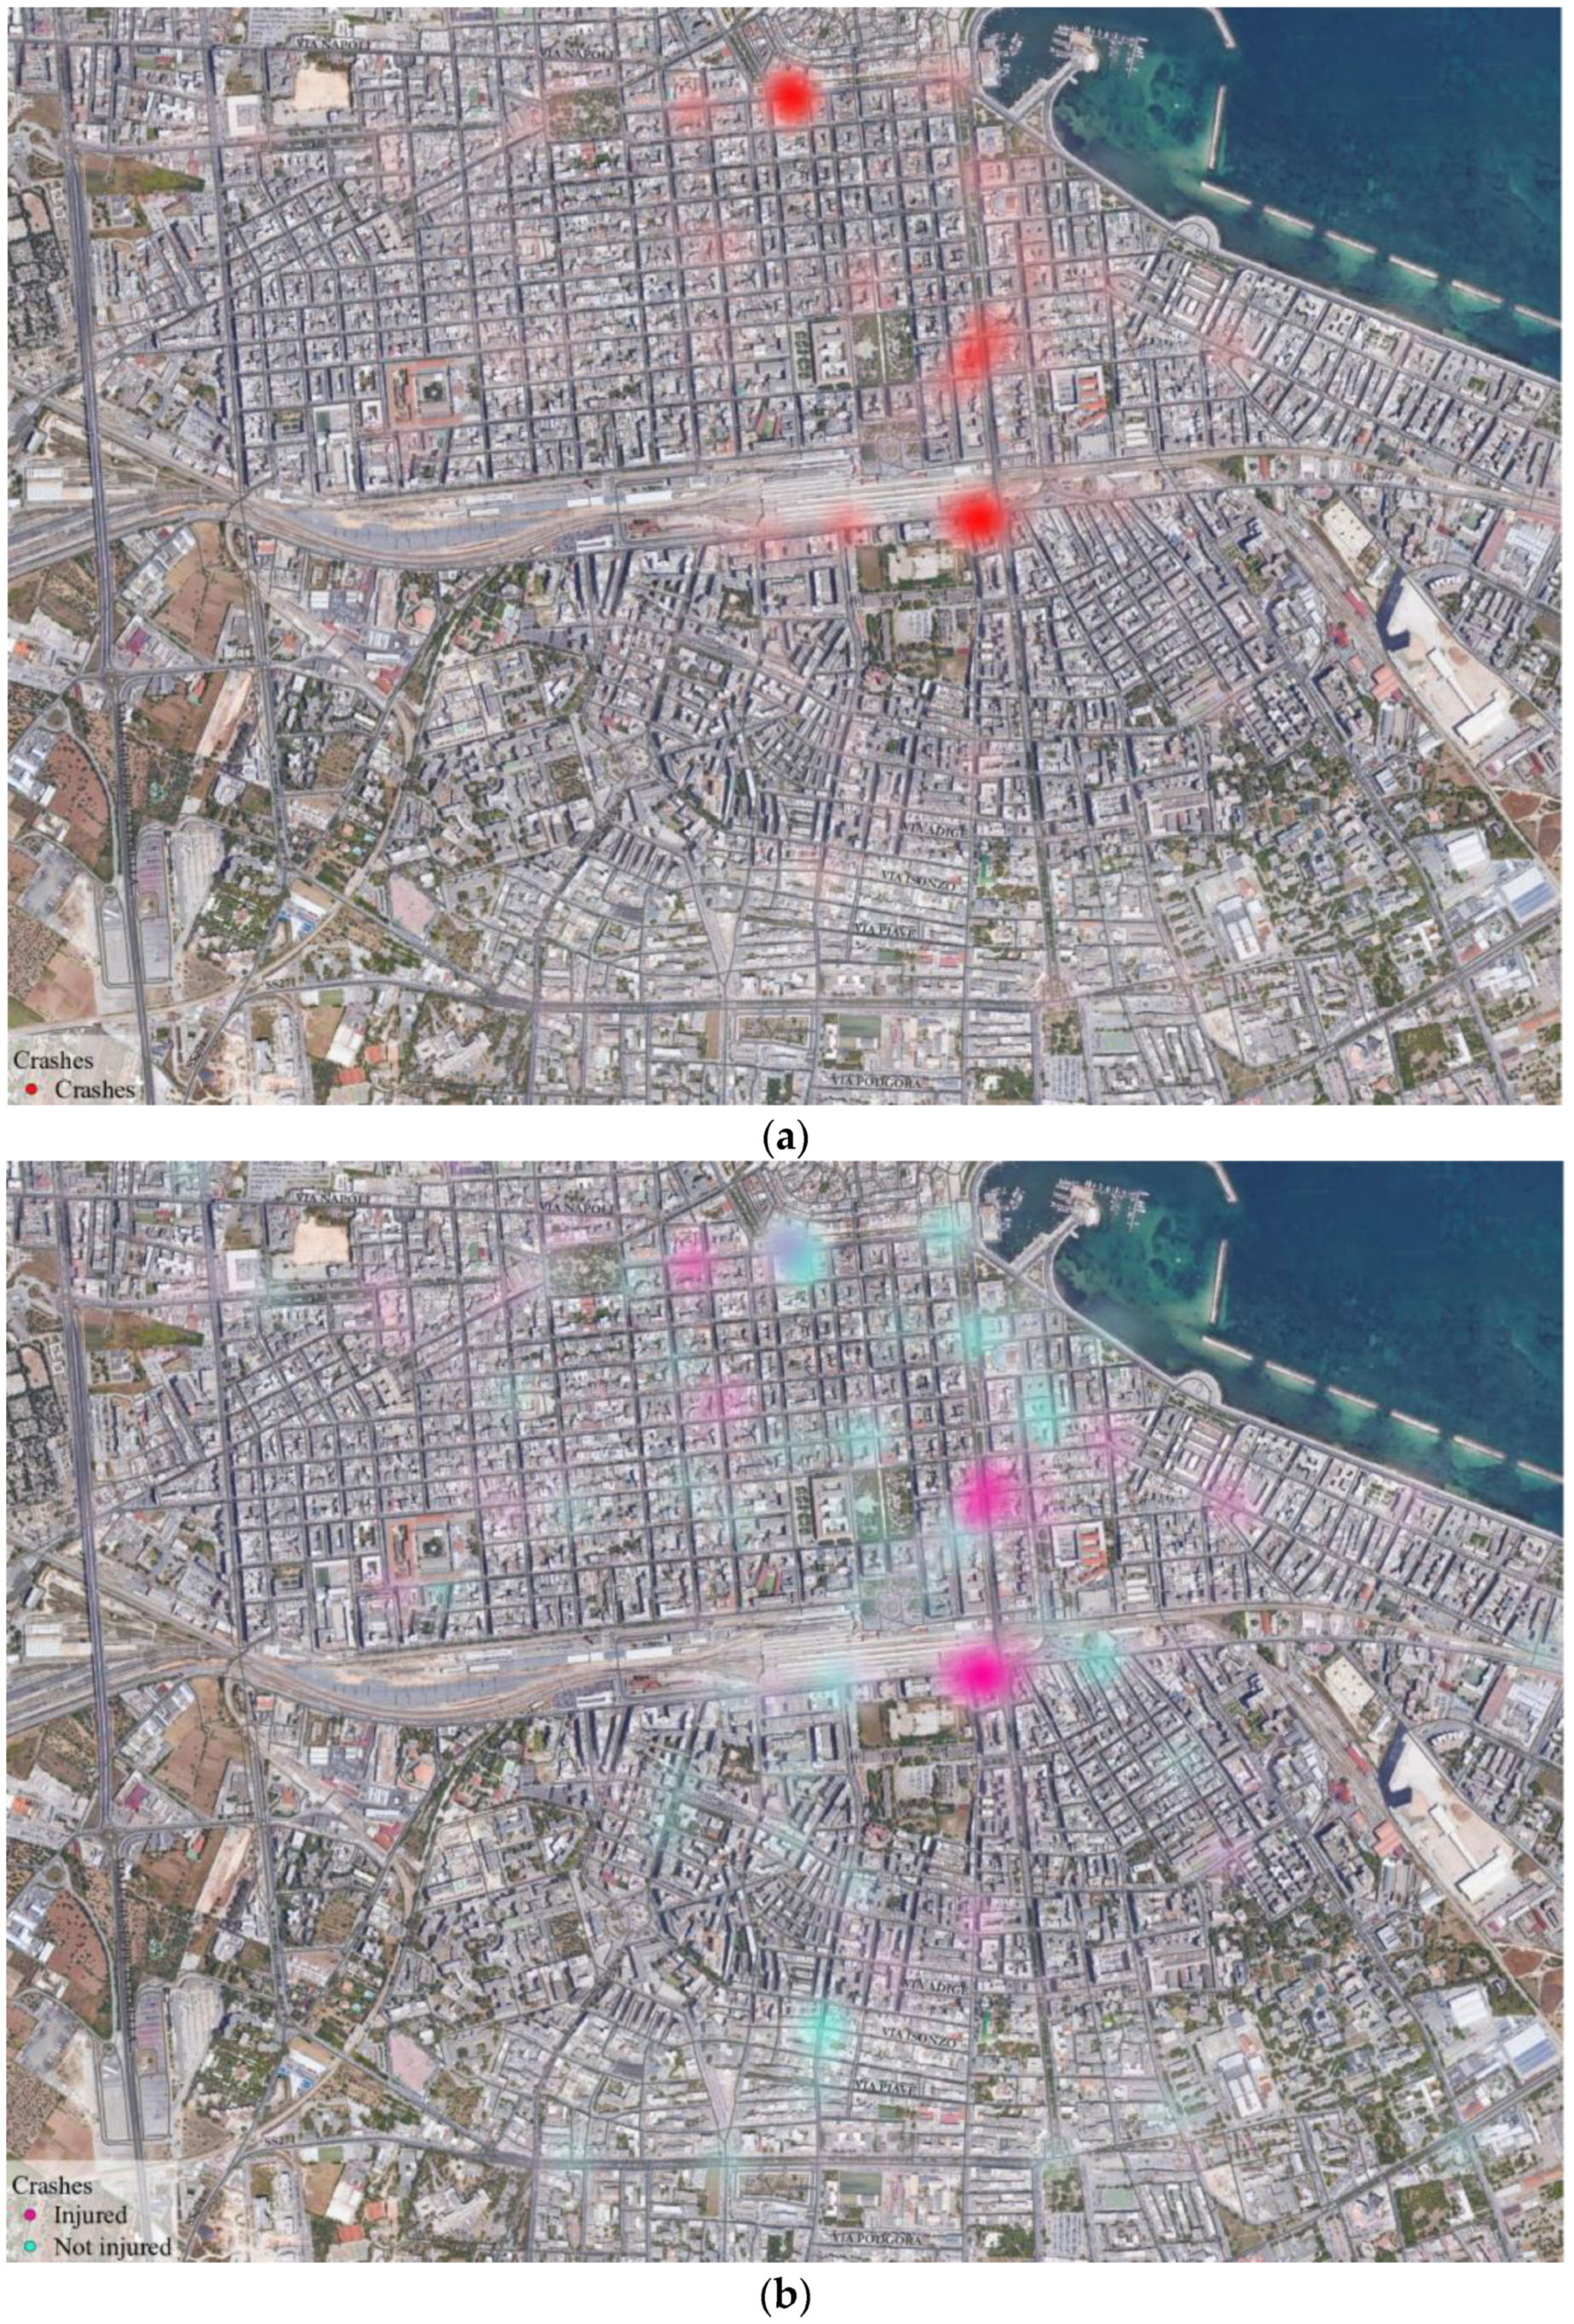

Figure 3.
Distribution of e-scooter crashes according to the combination of seasons and lighting conditions, plotted together with the distribution of the e-scooter runs (“traffic flow”: blue line in figure) in the four seasons, according to aggregate statistics provided by “Vento mobilty srl”, a sharing e-scooter provider in Bari.
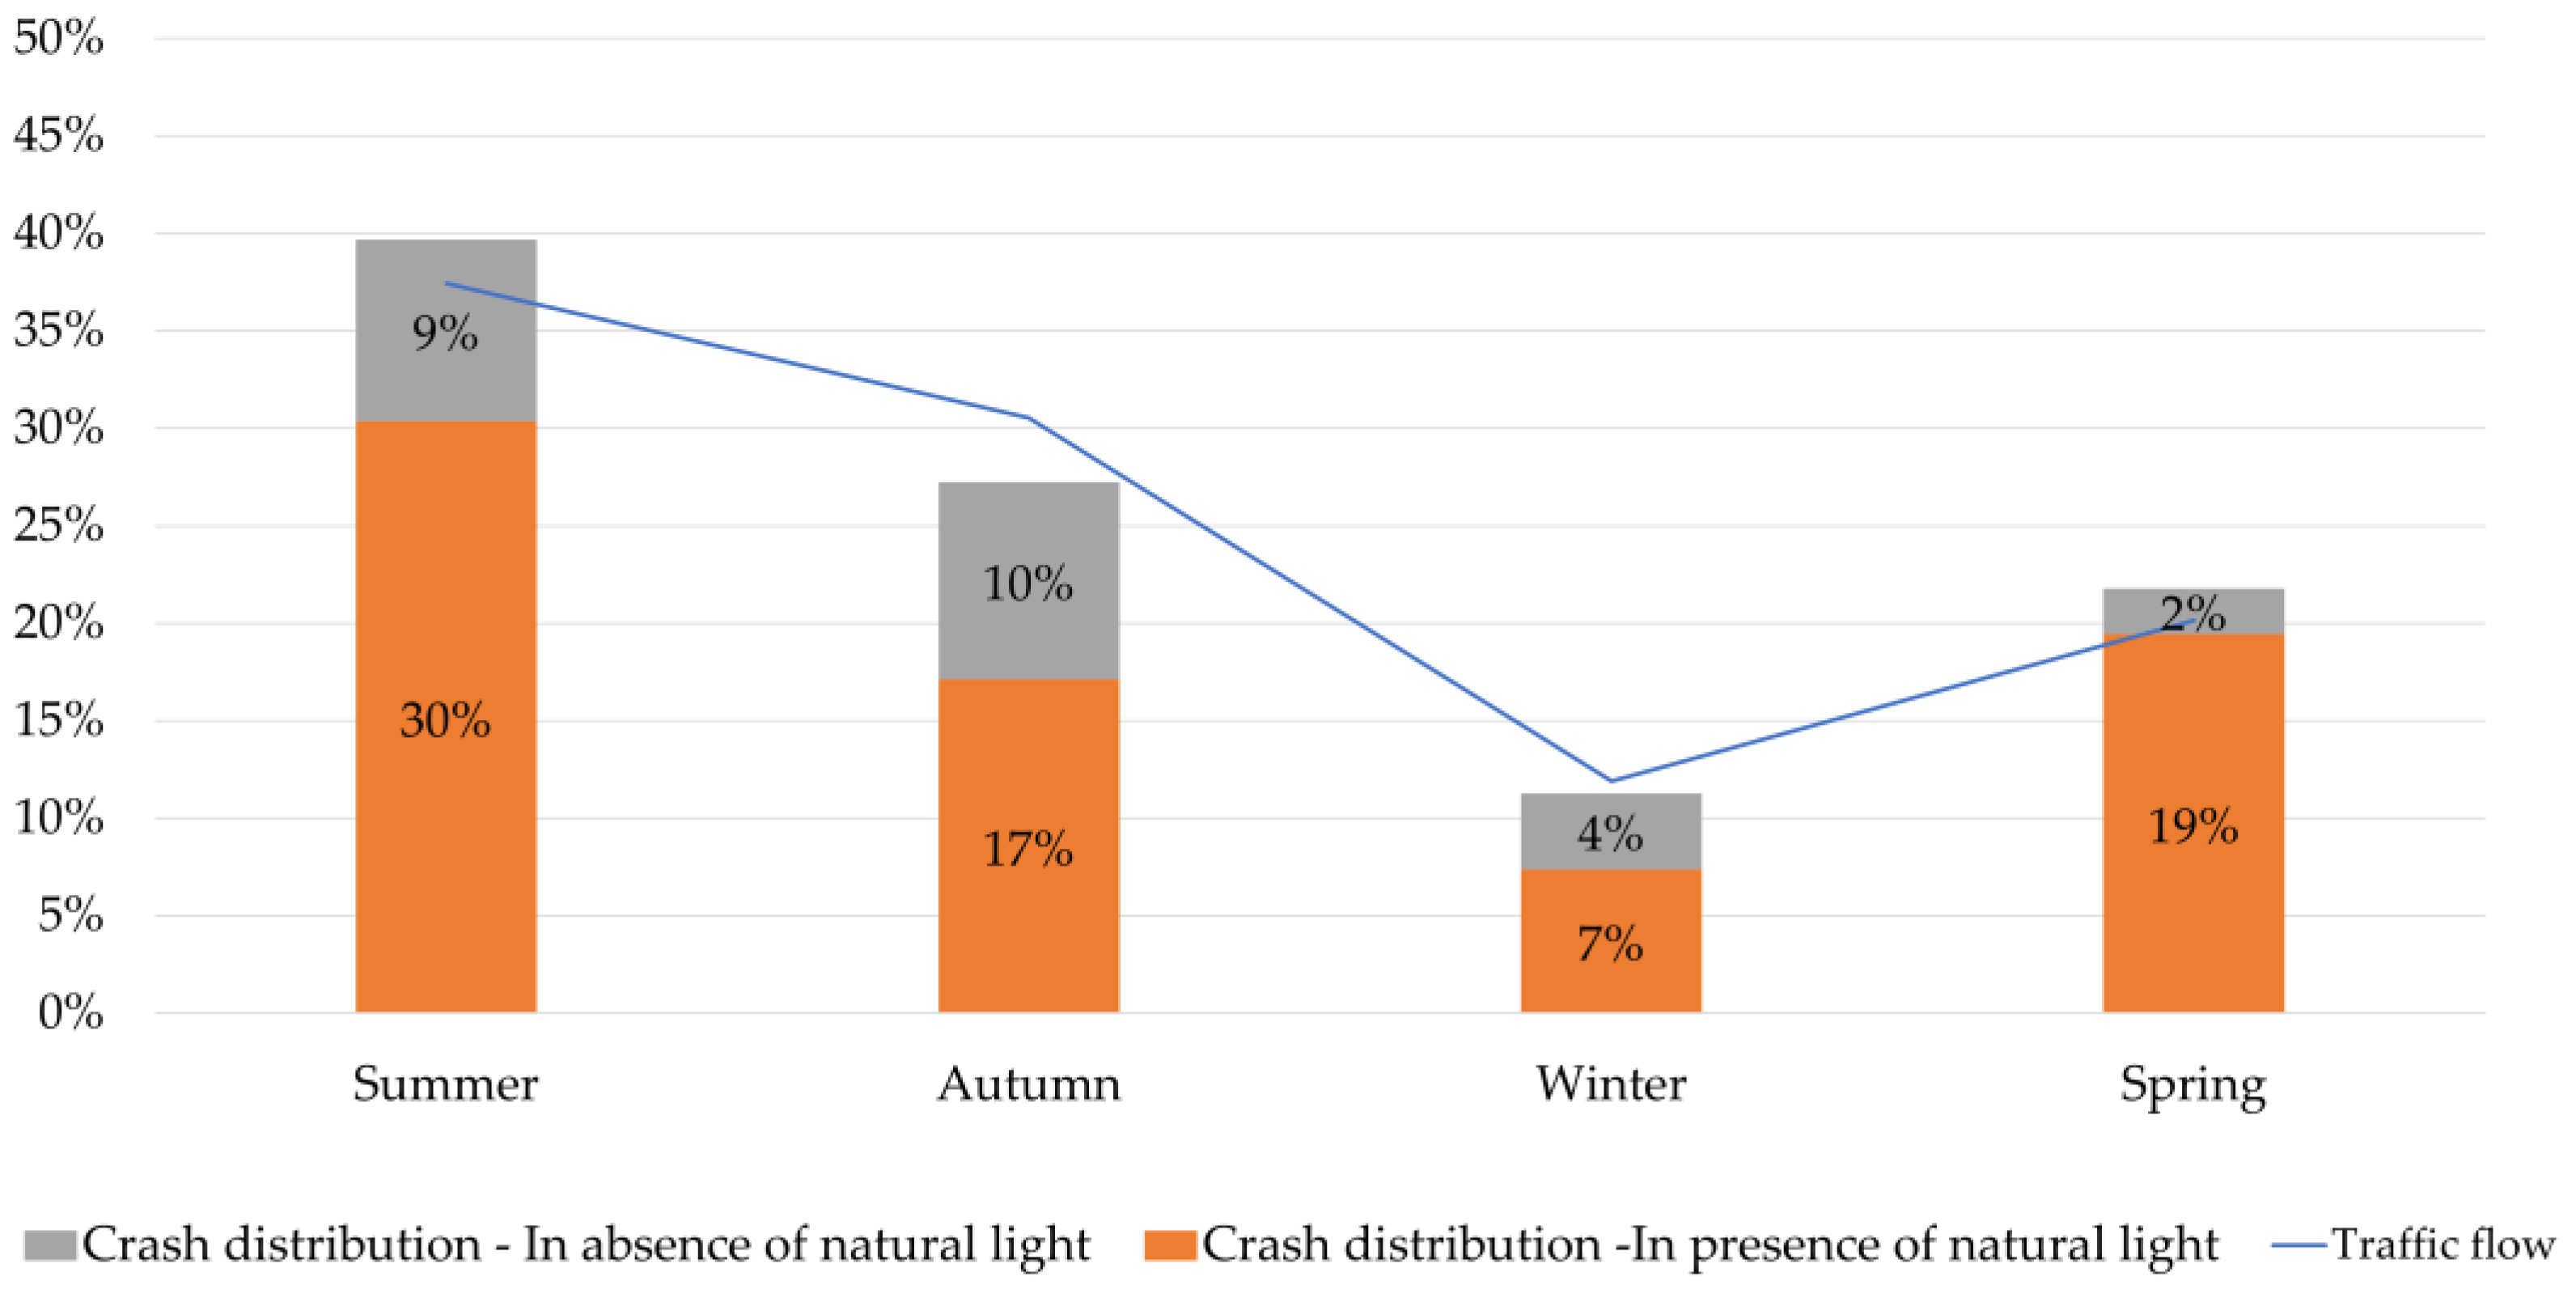
Figure 4.
Distribution of e-scooter crashes (blue and grey bars, summing up to 100%) and crashes to other vehicles (orange and yellow bars, summing up to 100%) by crash type, coupled with road elements.
Figure 4.
Distribution of e-scooter crashes (blue and grey bars, summing up to 100%) and crashes to other vehicles (orange and yellow bars, summing up to 100%) by crash type, coupled with road elements.
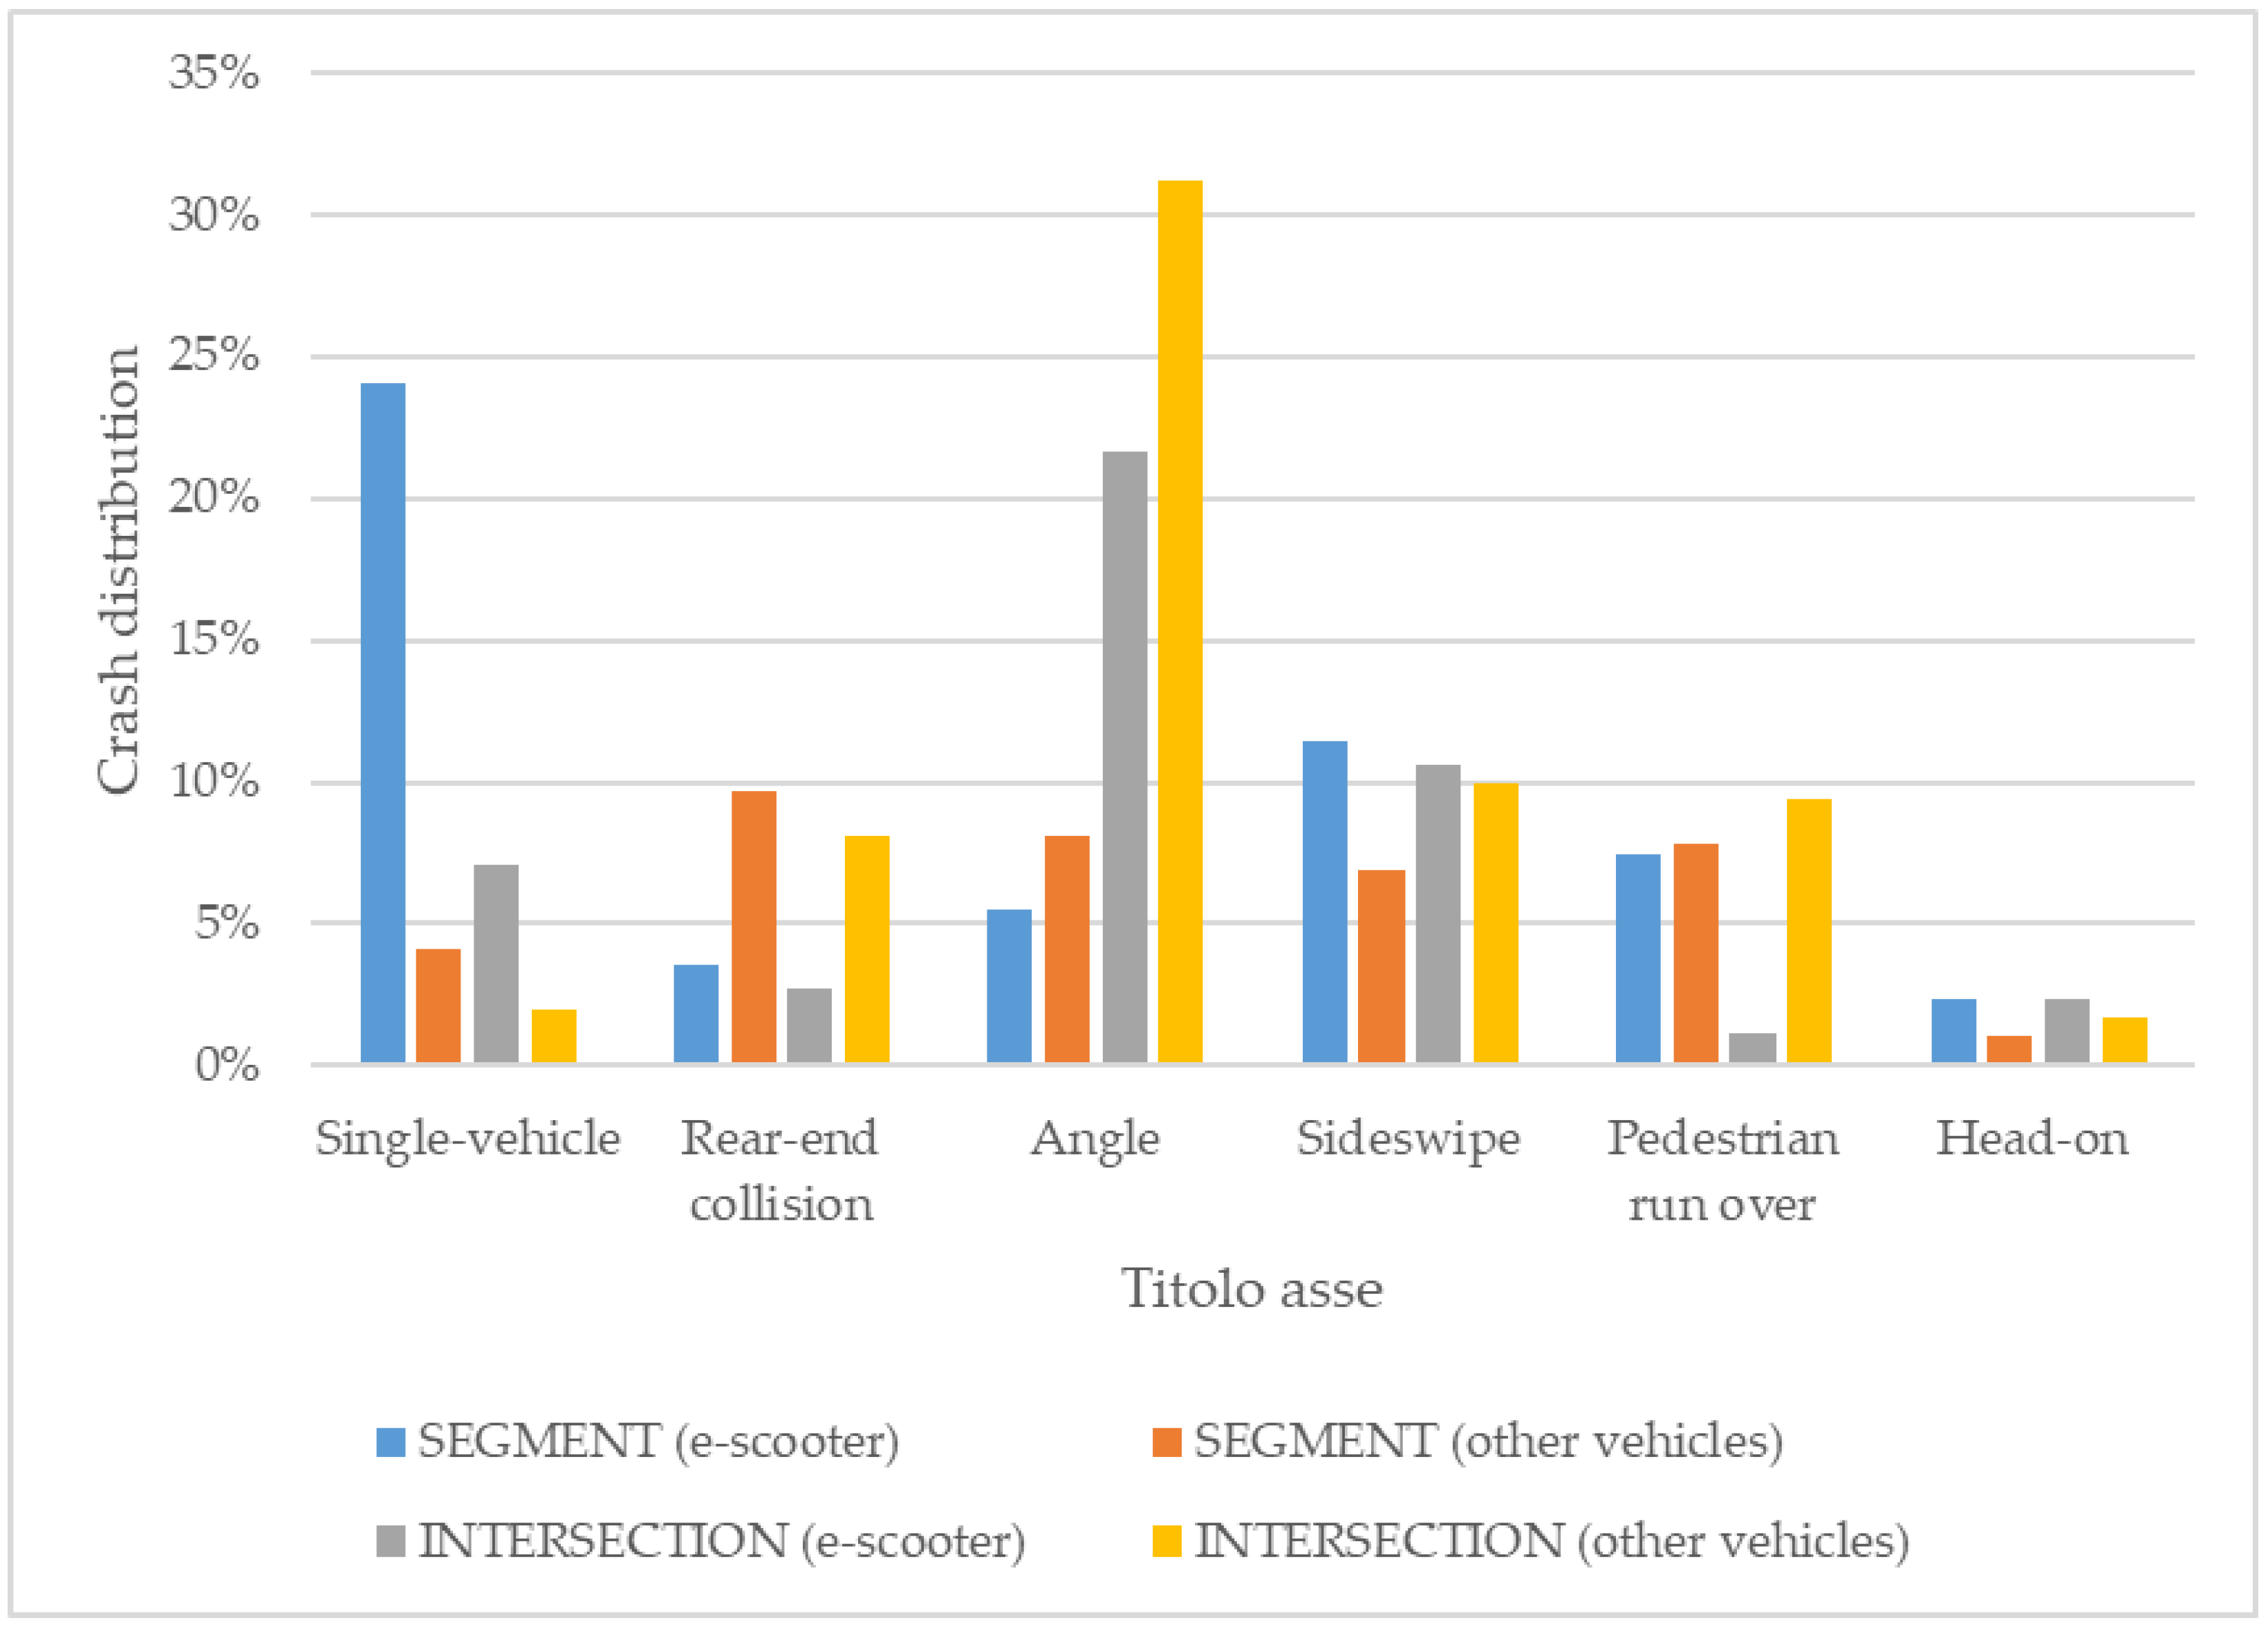
Figure 5.
Crash dynamics in relation to road type (divided roads, further divided into two or more than two carriageways; undivided roads, further divided into one-way and two-way; and pedestrian zones) for e-scooter crashes.
Figure 5.
Crash dynamics in relation to road type (divided roads, further divided into two or more than two carriageways; undivided roads, further divided into one-way and two-way; and pedestrian zones) for e-scooter crashes.


Table 1.
Distribution of crashes in the period July 2020–November 2022.
| Year | Number of Crashes |
|---|---|
| 2020 (from July to December) | 41 |
| 2021 (from January to December) | 118 |
| 2022 (from January to November) | 98 |
| Total | 257 |
Table 2.
Descriptive statistics of the e-scooter crash dataset.
| Crash-Related Variable | Number | Percentage | |
|---|---|---|---|
| Severity | |||
| Fatal | 0 | 0% | |
| With injuries to involved users No injuries | 181 76 | 70% 30% | |
| Road type | |||
| Undivided one-way Undivided one-way with cycle path Undivided one-way w/o cycle path | 115 9 106 | 45% 4% 41% | |
| Undivided two-way Undivided two-way with cycle path Undivided two-way w/o cycle path | 117 28 89 | 45% 11% 34% | |
| Divided multi-lane Divided multi-lane with cycle path Divided multi-lane w/o cycle path | 19 5 14 | 7% 2% 5% | |
| Three+ Carriageways Three+ Carriageways with cycle path Three+ Carriageways without cycle path | 4 1 3 | 2% 0% 1% | |
| Pedestrian zone | 2 | 1% | |
| Motor-vehicle traffic conditions | |||
| Peak hours (7 a.m.–9 a.m., 1 p.m.–3 p.m.) | 48 | 19% | |
| Night hours (10 p.m.–6 a.m.) Other calm hours | 26 183 | 10% 71% | |
| Season | |||
| Summer | 102 | 40% | |
| Autumn | 70 | 27% | |
| Winter | 29 | 11% | |
| Spring | 56 | 22% | |
| Lighting conditions | |||
| In presence of natural light | 191 | 74% | |
| In absence of light | 66 | 26% | |
| Road elements | |||
| Signalized intersection | 27 | 11% | |
| Unsignalized intersection | 80 | 31% | |
| Curve | 2 | 1% | |
| Segment (including bridges, tunnels) | 135 | 52% | |
| Roundabout | 9 | 4% | |
| Bridge | 4 | 2% | |
| Crash type | |||
| Single-vehicle | 82 | 31% | |
| Rear-end | 16 | 6% | |
| Angle | 69 | 27% | |
| Sideswipe | 56 | 22% | |
| Pedestrian hit | 22 | 9% | |
| Head-on | 12 | 5% | |
| Pavement conditions | |||
| Dry | 246 | 96% | |
| Wet/Slippery | 11 | 4% | |
| E-scooter driver age | |||
| <18 | 24 | 9% | |
| 18–30 | 96 | 37% | |
| 31–40 | 42 | 16% | |
| >40 | 49 | 19% | |
| Unspecified | 46 | 18% | |
| E-scooter driver sex | |||
| Man | 154 | 60% | |
| Woman | 57 | 22% | |
| Unspecified | 46 | 18% | |
| Crashes occurring with a passenger on board the e-scooter | |||
| Yes | 12 | 5% | |
| No | 245 | 95% | |
| Private or shared e-scooter | |||
| Shared | 71 | 28% | |
| Private | 158 | 72% | |
| Unspecified | 28 | 11% | |
| Crash dynamics and/or contributing factors | |||
| Crash not caused by the e-scooter | 67 | 26% | |
| E-scooter failure | 3 | 1% | |
| Distracted e-scooter driving | 58 | 23% | |
| Drunk e-scooter driving | 2 | 1% | |
| Irregular e-scooter behavior | 26 | 10% | |
| E-scooter falls due to external turbulence | 17 | 7% | |
| Obstructing parked e-scooter | 7 | 3% | |
| E-scooter fails to give right of way | 27 | 11% | |
| Road surface issues | 27 | 11% | |
| Unspecified | 23 | 9% | |
| Cycle path | |||
| Crash occurring on a cycle path | 25 | 10% | |
| Crash not occurring on a cycle path | 232 | 90% | |
| Cycle path present | 22 | 9% | |
| No cycle paths | 210 | 81% | |
Table 3.
Results of the logistic regression model for injury severity.
| Explanatory Variable | Coeff. Estimate | Std. Error | z Value | p-Value |
|---|---|---|---|---|
| Day hour: peak hour (ref.: calm hour) | 0.617 | 0.758 | 1.51 | 0.131 |
| Day hour: night hours (ref.: calm hour) | 1.451 | 2.639 | 2.35 | 0.019 |
| Crash type: angle (ref.: single-vehicle) | −0.607 | 0.256 | −1.29 | 0.196 |
| Crash type: sideswipe (ref.: single-vehicle) | −0.384 | 0.324 | −0.81 | 0.420 |
| Crash type: pedestrian hit (ref.: single-vehicle) | 2.141 | 7.572 | 2.40 | 0.016 |
| Crash type: other (ref.: single-vehicle) | −1.001 | 0.210 | −1.76 | 0.079 |
| Age: <18 (ref.: 18–30) | 0.936 | 1.503 | 1.59 | 0.113 |
| Age: 31–40 (ref.: 18–30) | 0.593 | 0.845 | 1.27 | 0.205 |
| Age: >40 (ref.: 18–30) | 0.350 | 0.622 | 0.80 | 0.424 |
| Age: Unspecified (ref.: 18–30) | −0.069 | 0.070 | −3.17 | 0.002 |
| Sharing: sharing (ref.: private) | −0.235 | 0.290 | −0.64 | 0.522 |
| Sharing: Unspecified (ref.: private) | 2.247 | 8.452 | 2.52 | 0.012 |
| Dynamics: irregular e-scooter behavior (ref: Crash not caused by the e-scooter) | 0.143 | 0.445 | 0.37 | 0.711 |
| Dynamics: other (ref: Crash not caused by the e-scooter) | 0.848 | 1.781 | 1.11 | 0.266 |
| Dynamics: Road surface issues (ref: Crash not caused by the e-scooter) | 1.601 | 4.334 | 1.83 | 0.067 |
| Likelihood ratio test (reference: null model): χ2(15) = 43.22, p < 0.001, R2 = 0.1385 | ||||
Note: estimated coefficients associated with a p-value < 0.05 are highlighted in bold, while estimated coefficients with a p-value < 0.10 are reported in italics.
Table 4.
Results of the multinomial logistic regression model for crash types.
| Explanatory Variable – Crash Type | Coeff. Estimate | Std. Error | z Value | p-Value |
|---|---|---|---|---|
| Crash type: angle (base outcome: single-vehicle) | ||||
| Road type (ref: undivided two-way) | ||||
| Undivided one-way | 0.717 | 0.409 | 1.75 | 0.080 |
| Divided multi-lane | 0.619 | 0.771 | 0.02 | 0.981 |
| Pedestrian zone | 1.136 | 88,084.55 | 0.00 | 1.000 |
| Day hour (ref.: calm hour) | ||||
| Peak hours | −0.146 | 0.499 | −0.29 | 0.769 |
| Night hours | −0.566 | 0.617 | −0.92 | 0.359 |
| Road geometry (ref.: segment) | ||||
| Unsignalized intersection | 2.793 | 0.473 | 5.90 | 0.000 |
| Signalized intersection | 2.626 | 0.687 | 3.82 | 0.000 |
| Roundabout | 2.106 | 0.960 | 2.19 | 0.028 |
| Age (ref.: 18–30) | ||||
| <18 | 1.153 | 0.905 | 1.27 | 0.203 |
| 31–40 | 0.271 | 0.538 | 0.50 | 0.614 |
| >40 | −0.563 | 0.551 | −1.02 | 0.307 |
| Unspecified | −0.562 | 0.587 | −0.96 | 0.338 |
| Crash type: sideswipe (base outcome: single-vehicle) | ||||
| Road type (ref: undivided two-way) | ||||
| Undivided one-way | 0.297 | 0.391 | 0.76 | 0.447 |
| Divided multi-lane | 0.274 | 0.696 | 0.39 | 0.693 |
| Pedestrian zone | −0.133 | 89,385.11 | 0.00 | 1.000 |
| Day hour (ref.: calm hour) | ||||
| Peak hours | −0.160 | 0.484 | −0.33 | 0.741 |
| Night hours | −1.301 | 0.731 | −1.78 | 0.075 |
| Road geometry (ref.: segment) | ||||
| Unsignalized intersection | 1.222 | 0.470 | 2.60 | 0.009 |
| Signalized intersection | 1.318 | 0.684 | 1.93 | 0.054 |
| Roundabout | 0.649 | 1.054 | 0.62 | 0.538 |
| Age (ref.: 18–30) | ||||
| <18 | 1.357 | 0.900 | 1.51 | 0.132 |
| 31–40 | −0.166 | 0.518 | −0.32 | 0.748 |
| >40 | −0.363 | 0.499 | −0.73 | 0.466 |
| Unspecified | −0.543 | 0.578 | −0.94 | 0.347 |
| Crash type: pedestrian hit (base outcome: single-vehicle) | ||||
| Road (ref: undivided two-way) | ||||
| Undivided one-way | 0.038 | 0.580 | 0.07 | 0.947 |
| Divided multi-lane | 0.511 | 1.011 | 0.51 | 0.613 |
| Pedestrian zone | 22.995 | 60,640.19 | 0.00 | 1.000 |
| Day hour (ref.: calm hour) | ||||
| Peak hours | −0.485 | 0.766 | −0.63 | 0.527 |
| Night hours | −14.041 | 638.874 | −0.02 | 0.982 |
| Road geometry (ref.: segment) | ||||
| Unsignalized intersection | −0.080 | 0.777 | −0.10 | 0.918 |
| Signalized intersection | −13.587 | 509.270 | −0.03 | 0.979 |
| Roundabout | −13.521 | 938.137 | −0.01 | 0.989 |
| Age (ref.: 18–30) | ||||
| <18 | 1.107 | 1.369 | 0.81 | 0.419 |
| 31–40 | −1.371 | 1.118 | −1.23 | 0.220 |
| >40 | −1.528 | 1.121 | −1.36 | 0.173 |
| Unspecified | 1.300 | 0.626 | 2.08 | 0.038 |
| Crash type: other (base outcome: single-vehicle) | ||||
| Road (ref: undivided two-way) | ||||
| Undivided one-way | −0.700 | 0.544 | −1.29 | 0.198 |
| Divided multi-lane | 0.448 | 0.730 | 0.61 | 0.540 |
| Pedestrian zone | −0.400 | 118,229.3 | 0.00 | 1.000 |
| Day hour (ref.: calm hour) | ||||
| Peak hours | 0.457 | 0.571 | 0.80 | 0.423 |
| Night hours | 0.262 | 0.717 | 0.37 | 0.714 |
| Road geometry (ref.: segment) | ||||
| Unsignalized intersection | 0.871 | 0.587 | 1.49 | 0.138 |
| Signalized intersection | 1.330 | 0.778 | 1.71 | 0.087 |
| Roundabout | 0.717 | 1.294 | 0.55 | 0.579 |
| Age (ref.: 18–30) | ||||
| <18 | 1.251 | 1.004 | 1.25 | 0.213 |
| 31–40 | −0.636 | 0.739 | −0.86 | 0.389 |
| >40 | 0.161 | 0.595 | 0.27 | 0.787 |
| Unspecified | −0.830 | 0.800 | −1.04 | 0.299 |
| Likelihood ratio test (reference: null model): χ2(48) = 123.43, p < 0.001, R2 = 0.1599 | ||||
Note: estimated coefficients associated with a p-value < 0.05 are highlighted in bold, while estimated coefficients with a p-value < 0.10 are reported in italics.
Disclaimer/Publisher’s Note: The statements, opinions and data contained in all publications are solely those of the individual author(s) and contributor(s) and not of MDPI and/or the editor(s). MDPI and/or the editor(s) disclaim responsibility for any injury to people or property resulting from any ideas, methods, instructions or products referred to in the content. |
© 2024 by the authors. Licensee MDPI, Basel, Switzerland. This article is an open access article distributed under the terms and conditions of the Creative Commons Attribution (CC BY) license (https://creativecommons.org/licenses/by/4.0/).
Share and Cite
MDPI and ACS Style
Longo, P.; Berloco, N.; Coropulis, S.; Intini, P.; Ranieri, V. Analysis of E-Scooter Crashes in the City of Bari. Infrastructures 2024, 9, 63. https://doi.org/10.3390/infrastructures9030063
AMA Style
Longo P, Berloco N, Coropulis S, Intini P, Ranieri V. Analysis of E-Scooter Crashes in the City of Bari. Infrastructures. 2024; 9(3):63. https://doi.org/10.3390/infrastructures9030063
Chicago/Turabian StyleLongo, Paola, Nicola Berloco, Stefano Coropulis, Paolo Intini, and Vittorio Ranieri. 2024. "Analysis of E-Scooter Crashes in the City of Bari" Infrastructures 9, no. 3: 63. https://doi.org/10.3390/infrastructures9030063