
Stresses in Saturated and Unsaturated Subgrade Layer Induced by Railway Track Vibration

1
Civil Engineering Department, University of Technology, Baghdad 10066, Iraq
2
Department of Civil Engineering, College of Engineering, Daiyla University, Baquba City 32001, Iraq
*
Author to whom correspondence should be addressed.
Infrastructures 2024, 9(4), 64; https://doi.org/10.3390/infrastructures9040064
Submission received: 21 January 2024
/
Revised: 23 February 2024
/
Accepted: 5 March 2024
/
Published: 25 March 2024
(This article belongs to the Special Issue Railway in the City (RiC))
Abstract
:The theoretical and practical studies of the cyclic loads resulting from the movement and passage of trains on the unsaturated subgrade to determine the effect of the degree of saturation and moisture content on the foundations and infrastructure of the railway lines, especially the settlement in the railway lines as a result of the development of the train loads. Thirty-six laboratory experiments were carried out using models that simulate a railway with nearly half the scale of the real one, using an iron box of (1.5 × 1.0 × 1.0) meters and a layer of clay soil with a thickness of 0.5 m representing the base layer, were constructed inside it. Above it, there is a layer of crushed stone representing a 0.2 m thick ballast, topped by a rail line of 0.8 m long installed on three sleeper beams with dimensions of 0.9 m (0.1 × 0.1 m). The subgrade layer has been constructed at different saturation degrees as follows: 100, 80, 70, and 60%. The tests were carried out using different load amplitudes and frequencies. These experiments investigated the effect of the subgrade degree of saturation on the value of the stresses generated on the surface and the middle (vertical and lateral stresses) and the settlement of the subgrade. In the case of unsaturated subgrade soil, an increase in load frequency has a clear effect on increasing the generated stresses in the subgrade layer, especially with lower saturation levels. However, the results and measurements of these experiments found that the load frequency almost had no effect on the values of the stresses generated on the surface and inside the subgrade layer with a 100% degree of saturation. The results of the investigation demonstrated that, while load frequency had a minimal effect on track-panel settlement, it increased with the load amplitude and subgrade soil saturation degree. The change of settlement of the track panel with the number of cycles has a high rate at the beginning; after a while from that, it decreases gradually until, after some value of the number of cycles, the settlement changes at a very low rate and gradually.
1. Introduction
The load of a train carriage is dispersed and transmitted from the rails to the sleepers, through the ballast and sub-ballast, and ultimately onto the subgrade in a ballasted railway track. The amount of stress that can be transferred to the subgrade layer is determined by the properties of the subgrade soil layer. Applying high loading and frequency levels to fine-grained subgrade will increase strain buildup, lead to the build-up of excess pore water pressure in saturated soil, and create a matric suction effect in unsaturated subgrade soil. This could give rise to worries regarding the stability and safety of railroads.
In the past, railway engineers focused primarily on the train and track superstructure, such as rails and sleepers. As a result, a sizable portion of the annual capital allocated to maintaining the railway track is used for track repair. Although the substructure, including subgrade, sub-ballast, and ballast, is just as important as the superstructure and has a significant impact on track maintenance costs, less thought has been given to it. This is because the properties of the substructure are more erratic and difficult to ascertain than those of the superstructure [1]. The superstructure gives the fundamental capacity of the railway, and the substructure gives the foundation to help the superstructure and to assist the superstructure in reaching its ideal execution.
Subgrade soil in the field is often unsaturated and is prone to daily variations in suction, water content, and temperature [2,3]. According to a number of experimental and theoretical investigations [4,5,6], the behavior of partially saturated soils is mostly dependent on temperature and suction.
Depending on the value of the suction, the soil’s strength and stiffness are likely to increase. Gräbe [7] discovered that, for saturated specimens that replicated railway formation, the stiffness obtained in the laboratory was less than that back-calculated from field observation. This was assumed to be related to the field’s suction effect. In order to have a clearer understanding of the behavior of in situ soil, a study is necessary to determine the influence of suction and its variation on the behavior of a railway subgrade. In general, the focus of these investigations was on cases where the soil exhibited monotonic behavior when loaded with more than 1% of stresses. At small strains (less than 1%) and various degrees of temperatures, partially saturated soils’ cyclic behaviors particularly are not fully understood [8].
Conventional ballasted railroad track is essentially a framework for dispersing loads, with the load emerging from the motion of the train and traveling through the rails to the sleepers. The ballast and sub-ballast layers then distribute the load onto the subgrade. The amount of stress that can be applied to the subgrade layer is determined by the properties of the subgrade soil layer. Cohesive soil is the most common type of problematic subgrade-layer soil [9]. It is commonly recognized that changes in the water content of cohesive soils have a significant impact on their physical characteristics, which in turn affect the parameters of shear strength and the behavior of stress and strain. Therefore, a deeper understanding of how fine-grained subgrade behaves under higher rates of loading—that is, cyclic frequency—will be essential because it affects how excess pore water pressure builds up in saturated soil, the matric suction effect occurs in unsaturated soil, and subgrade soil strain accumulates, all of which affect the stability of the railroad track.
The parts that sustain and transfer the load to the track substructure make up the track superstructure. It relieves shock and absorbs energy that could be caused by high-frequency loads on the subgrade. The rail, tie (sleeper), and fastening system are the three primary parts of the superstructure. High dynamic loads are produced by these elements and are transferred to the track substructure. The purpose of the superstructure is to reduce the high stresses at the wheel–rail contact zone to a level that the substructure can handle.
Therefore, the superstructure is needed to resist both vertical and horizontal loads with little elastic and permanent deformation. The most noticeable part of the track structure is the rails, which physically support the wheels that are passing. It is true that the rails have changed significantly over time. They are now larger rail cross sections welded into continuous strings that are commonly found on track nowadays, as opposed to the smaller rail cross sections that were built up as single rail lengths (most recently in 13 m lengths) [10].
Track foundations are affected by three different types of loading: dynamic, cyclic (periodic), and static. Quantification of the load environment is crucial for rail track foundation design and remediation [10]. On a rail track foundation, the combined effects of the train’s live loads and the rail structure’s dead loads are referred to as the static load. The design rules for track foundations conceal the effects of dead loads, but live loads predominate. In foundation designs, a traditional guideline is predicated on the actual axle load [11,12,13].
When compared to the behavior under a single static load for an axle load of equivalent magnitude, the subgrade exhibits entirely different behavior under cyclic and dynamic loads [14]. They also emphasized that the features of cyclic loads are determined by the pulse’s form, duration, magnitude, interval between consecutive pulses, and number of pulses. The length of the pulse is determined by train speed, and its amplitude is determined by the sum of the impacts of the number of axle loads taken into account.
There are two subclasses of dynamic loads, also referred to as short-duration forces: high frequency (P1) and low frequency (P2). Track modulus abnormalities, such as transition zones, and the vehicle suspension system are primarily responsible for regulating these two subclasses. P1 loads cause major issues for the sleepers, wheels, and rails, but P2 loads have a big impact on the substructure layers. Dynamic wheel loads can generally be divided into two categories based on the suspension system of the vehicle: short-term forces and long-term forces. Vehicle suspension systems play a part in long-time forces, whereas they play little or no part in short-time forces. Due to wheel or rail discontinuities, loads with a high-frequency effect are referred to as short-time forces. Additionally, it degrades the wheels and rails. There are rail discontinuities on the short track. As a result, a brief load pulse developed in which the car suspension and track foundation could not react. For this reason, only the wheel, rail, and tie are affected by corresponding dynamic loads and track deterioration. Longer wavelength rack geometry imperfections result in a longer period reaction, giving the vehicle suspension time to affect the dynamic wheel loads and transmit them into the ballast and subgrade of the track.
In general, two stress-state variables known as metric suction and net normal stress can control the behavior of unsaturated soils [15]. Yang et al. [16] created a suction-controlled triaxial apparatus to study the effects of suction on the resilient modulus. They found that the robust modulus increased by 200% when the suction was altered from 50 to 450 kPa with a cyclic stress of 103 kPa. The robust modulus rises for high matric suction and falls for low matric suction as the cyclic stress is increased.
Chao [8] investigated the cyclic behavior of unsaturated soil under modest strains at different temperatures using triaxial experiments. These experiments demonstrate that under higher suction and lower temperature, soil stiffness at small strains is consistently larger. The outcomes of cyclic triaxial testing show that the plastic strain of the soil specimen increases at a decreasing rate as the number of cycles increases. Within 100 cycles, every unsaturated test sample achieved a steady reversible response. At lower suction and higher temperature, there was a greater accumulation of plastic strain after 100 cycles. The causes of all these observations were heat softening and suction hardening. Also, suction has a major role in the robust modulus. Resilient modulus can grow by up to one order of magnitude at a given temperature when suction is increased from 0 to 250 kPa. Furthermore, the temperature had a minor impact on the unsaturated soil resilience modulus.
Yang et al. [16] investigated the effects of matric suction on the resilient modulus for two distinct soil types using a battery of tests. This suction was measured or controlled by the use of an axis-translation approach. The results of this study demonstrated a steady reduction in suctions with cyclic loading; unlike many other similar studies, the number of loading cycles was on the order of several thousand, and the size of the drop was considerable at a high degree of saturation.
Kwan [17] used a Composite Element Test (CET) to examine many aspects, including the position of the geogrid within the reinforced ballast, its characteristics, and the stiffness of the subgrade. The findings demonstrated that a reinforced composite settlement’s typical behavior was directly impacted by the geogrid’s aperture size, with the settlement with the soft subgrade being greater than the settlement with the stiff subgrade. The outcomes of the unreinforced example served as a benchmark for comparison. Additionally, it is determined that a geogrid size-to-diameter ratio of 1.6 is optimal for 40 mm aggregate attainment.
Wheel polygonization can induce severe vibration of the wheel–rail system and lead to considerable noise emission from the wheel–rail interface. As mentioned in Section 2, LIM metro-train wheels suffered from polygonal wear with nine harmonics. Fang et al. [18] used a combined numerical acoustic model to determine the effect of the polygonal wear evolution of LIM metro-train wheels on the vibration and sound radiation of the wheel and found that the wheel noise radiation decreased by 6 dB(A) after reprofiling.
Using undrained triaxial testing, Loh and Nikraz [19] examined the behavior of kaolinite clay as fine particles in soil. Additionally, the characteristics of the subgrade reaction that emerged as a result of wheel loading at the speed of a modern train were simulated. There were four different kinds of undrained triaxial tests, both static and cyclic. The findings clarified that, when doing effective shear analysis, there is a threshold for clay that has been repeatedly subjected to high loads. The study also suggested a novel strategy that clarified and updated the state-of-the-art design and management procedure for the clay subgrade used in railway-track substructures. The understanding of “lower-bound threshold stress” and the possibility of densifying and reinforcing fine-grained subgrade soil by gradually and purposefully loading the track foundation incrementally served as the foundation for the rational approach’s development.
Leshchinsky and Ling [20] used the finite element approach to examine the large-scale experimental findings of geocell-reinforced ballast embankments for confinement. The effects of geocell confinement on ballasted embankments lying on a soft subgrade, as well as variations in ballast stiffness and reinforcement stiffness, were investigated in this study. We conclude that geocell confinement has a considerable benefit for a wide range of subgrade stiffness. Additionally, constrained ballast distributes the strain on the subgrade more evenly. As a result, the settlement was decreased, and the bearing capacity was increased.
Chen [21] evaluated the behavior of railroad ballast reinforced with geogrid. Large box pull-out experiments were carried out experimentally to investigate the critical parameters affecting the ballast–geogrid interaction. The findings of the experiment showed that the triaxial geogrid with triangle apertures performs better than the biaxial geogrid with square apertures and that the geogrid aperture size has a greater impact than the junction and rib profiles. The interaction between ballast and geogrid has then been modeled using the discrete element method (DEM) by simulating big box pull-out experiments and comparing the outcomes with experimental data. It has been demonstrated that the pull-out resistance and the distribution of contact forces in the geogrid-reinforced ballast system can be accurately predicted using the DEM simulation results.
The characteristics of ballast settlement as a result of tie-tamper repair and ballast thickness were examined by Hayano et al. [22]. On a model ground, cyclic loading tests were used in a series of experiments. The roadbed compressibility’s relatively low nonlinearity makes the 250 mm ballast thickness that is now used as the standard design useless for minimizing settlement. Furthermore, the implementation of tie-tamper results in a major alteration of the early settlement process’ characteristics, whereas the degree of slow subsidence remains relatively unchanged, regardless of the kind of roadbed and thickness of ballast.
Using a full-scale model, Chen et al. [23] examined the impact of changing the water level in the subgrade for high-speed rail. The dynamic soil pressure, vibration velocity, elastic deformation, and cumulative settlement under simulated dynamic train loadings were all studied using the model that simulated dynamic train loadings. Granular material with no boundaries makes up the subgrade layer. The subgrade stratum measured 13.1, 5.0, and 2.7 m in length, width, and depth, respectively. Eight actuators in all were used in the testing to replicate the phase difference of nearby actuators, which allowed for the simulation of dynamic train loading and a maximum train speed of 360 km/h. Also, increasing the train speed leads to higher cumulative settlement.
The fill and cut portions were built by Xiao et al. [24] in compliance with the design code for a 200 km/h railway subgrade. Train loading tests were used to examine the impact of subgrade development on dynamic response in the fill section. Additionally, by utilizing a different fill sample with comparable design specifications but less ground stiffness, the impact of ground stiffness on the subgrade dynamic response was examined. The findings demonstrated that the two fill sections’ and the cut sections’ deforestation satisfied the design requirement for a 200 km/h subgrade. Furthermore, the subgrade form—fill section or cut section—had no effect on the subgrade’s permanent deformation but a considerable impact on subgrade elastic deformation and dynamic stiffness. The ground stiffness had an impact on the dynamic response for high-fill sections (more than 6 m in this case study), according to the results as well.
In 2017, Dareeju [13] developed a novel, straightforward torsional experimental technique to create a stress state akin to that of the rail-track subgrade material under actual traffic loads. In order to take into consideration the strength deformation characteristics of unsaturated subgrade materials, a modified multiring shear (MMRS) apparatus was devised. The performance of the proposed experimental approach was assessed to predict the principal stress axis rotation (PSAR)-induced plastic degradation of subgrade materials using model rail track and torsionally hollow cylindrical test data. The study showed that an approximation method of the residual and resilient deformation properties of partially saturated subgrade materials with the loading cycle number under any loading condition is a simplified version of the subgrade rutting failure criteria explained in the Japanese manual of pavement design. The study found that when subjected to PSAR effects, a recently established experimental approach may yield realistic strength-deformation characteristics of unsaturated subgrade materials.
Fattah et al. [25,26] carried out laboratory experiments to examine how load amplitude and load frequency affected the behavior of the reinforced and unreinforced ballast layer. The behavior of the clay layers and ballast when the ballast was geogrid reinforced was examined using a battery of laboratory tests. In addition to the laboratory testing, PLAXIS 3D 2013, a finite-element program, was used to conduct numerical analysis in order to validate the numerical model. The amount of settlement was found to grow when the simulated train load amplitude was increased. Depending on the frequency being employed, there was a rapid increase in settlement up to cycle 500 and then a slow increase to level out between 2500 and 4500 cycles. When the load amplitude increases from 0.5 to 1 ton, there is a slight rise in induced settlement. However, when the load amplitude increases to two tons, there is a greater amount of settlement; the existence of the geogrid and the other parameters under study determine how much settlement increases. The behavior of the numerical and experimental data is the same.
The dynamic interaction between the track and rolling stock was demonstrated in a straightforward three-beam computational model by Sysyn et al. [27], which was consistent with the experimental observations. Additionally, the model demonstrates that the impact point arises before the wheel enters the impact point and that the sleeper accelerations are greater than three times that of the corresponding wheel accelerations. The examination of ballast loadings revealed the distinct quasistatic portion and impact behavior for the void and neighboring zones, which are distinguished by significant levels of pre-stressed ballast. The investigation of the influence of void size shows that there is a maximum void depth at which the wheel and sleeper accelerations and the impact loadings arise, and then, the values start to decline. For large voids, the examination of ballast quasistatic loading showed a more than two-fold increase in ballast loading in neighboring zones, and for short-length voids, nearly complete quasistatic unloading.
High-speed rail (HSR) is a new and efficient infrastructure that is expected to provide economic and environmental benefits. Based on the STIRPAT model and the environment Kuznets curve (EKC) hypothesis, Fang employed a spatial difference-in-difference approach using 284 prefecture-level cities’ panel data from 2007 to 2016 to explore the impacts of HSR on urban smog pollution. The results demonstrated that urban smog pollution shows strong spatial correlations and that HSR can significantly reduce smog pollution. The findings have implications for policymaking, as they enrich the EKC hypothesis and provide evidence for the environmental benefits of HSR.
Fang et al. [28,29] presented a paradigm for dynamics analysis that combines the discrete element method (DEM) with the multibody dynamics technique (MBD) to account for sleeper-unsupported faults. The number of unsupported sleepers and the hanging height, for example, are examples of different sleeper hanging problems that are used as inputs for an analysis of the dynamic behavior of heavy-haul locomotives and the corresponding degradation of ballasted beds in terms of ballast particle wear. The results of the simulation showed that the average contact stress underneath the well-supported sleeper next to the hanger area and the corresponding ballasted bed stress were dramatically increased by the hanger hanging defects. This suggests that, even in cases where there are only one or two consecutive unsupported sleepers, the unsupported height should be suppressed to within a 5 mm range.
This study looks at how the saturated and unsaturated clayey subgrade soil layer behaves under the cyclic stress of the railway track. The main objective is to provide a more comprehensive understanding of how clayey soil, or fine-grained subgrade soil, behaves under cyclic loading, particularly as it relates to the foundation of railroad lines. Furthermore, the subgrade layer’s strain/deformation characteristics and stress status at various saturation levels will be examined. That means that the goal is to investigate how the degree of saturation variation in the subgrade layer, the load amplitude, and the load frequency affect the transmitted stresses from the ballast layer to the subgrade layer and the distribution of stresses within it. Further, an investigation of the effect of subgrade layer degree of saturation variation, load amplitude, and load frequency on the track panel and subgrade settlement is also made.
2. Laboratory Works, Models Preparation, and Material Properties
This section’s goal is to provide an overview of the experimental work, material characteristics, measuring tools, and apparatus. In order to achieve the purpose of this research, the methods of the testing program and the process for applying cyclic loading to the models under test are also explained.
The scale of the laboratory models utilized in these experiments is nearly half that of the real rail tracks in use on Iraqi railways. Numerous laboratory models are used in the test program to examine the stress and settling of unsaturated soil (subgrade) under the cyclic loading of railroads. This was performed by testing a series of models that have different subgrade-layer saturation degrees (Sr%) using a various frequency and loads.
3. Materials Used
Brown, clayey soil was utilized for this study. The physical parameters of the soil were obtained by conducting a routine battery of tests. Table 1 provides a detailed description of the soil characteristics. The distribution of soil particle sizes for the soil utilized in this study is depicted in Figure 1. The Unified Soil Classification System (USCS) has assigned the soil the classification of (CL).
The ballast that is being used is white in color and has sharp edges that were created by smashing larger stones that were purchased from a private quarry in Baghdad. Table 2 shows the primary physical characteristics of the ballast that was employed. Ballast utilized in this job can be classed as (GP) poorly graded ballast according to the Unified Soil Classification System.
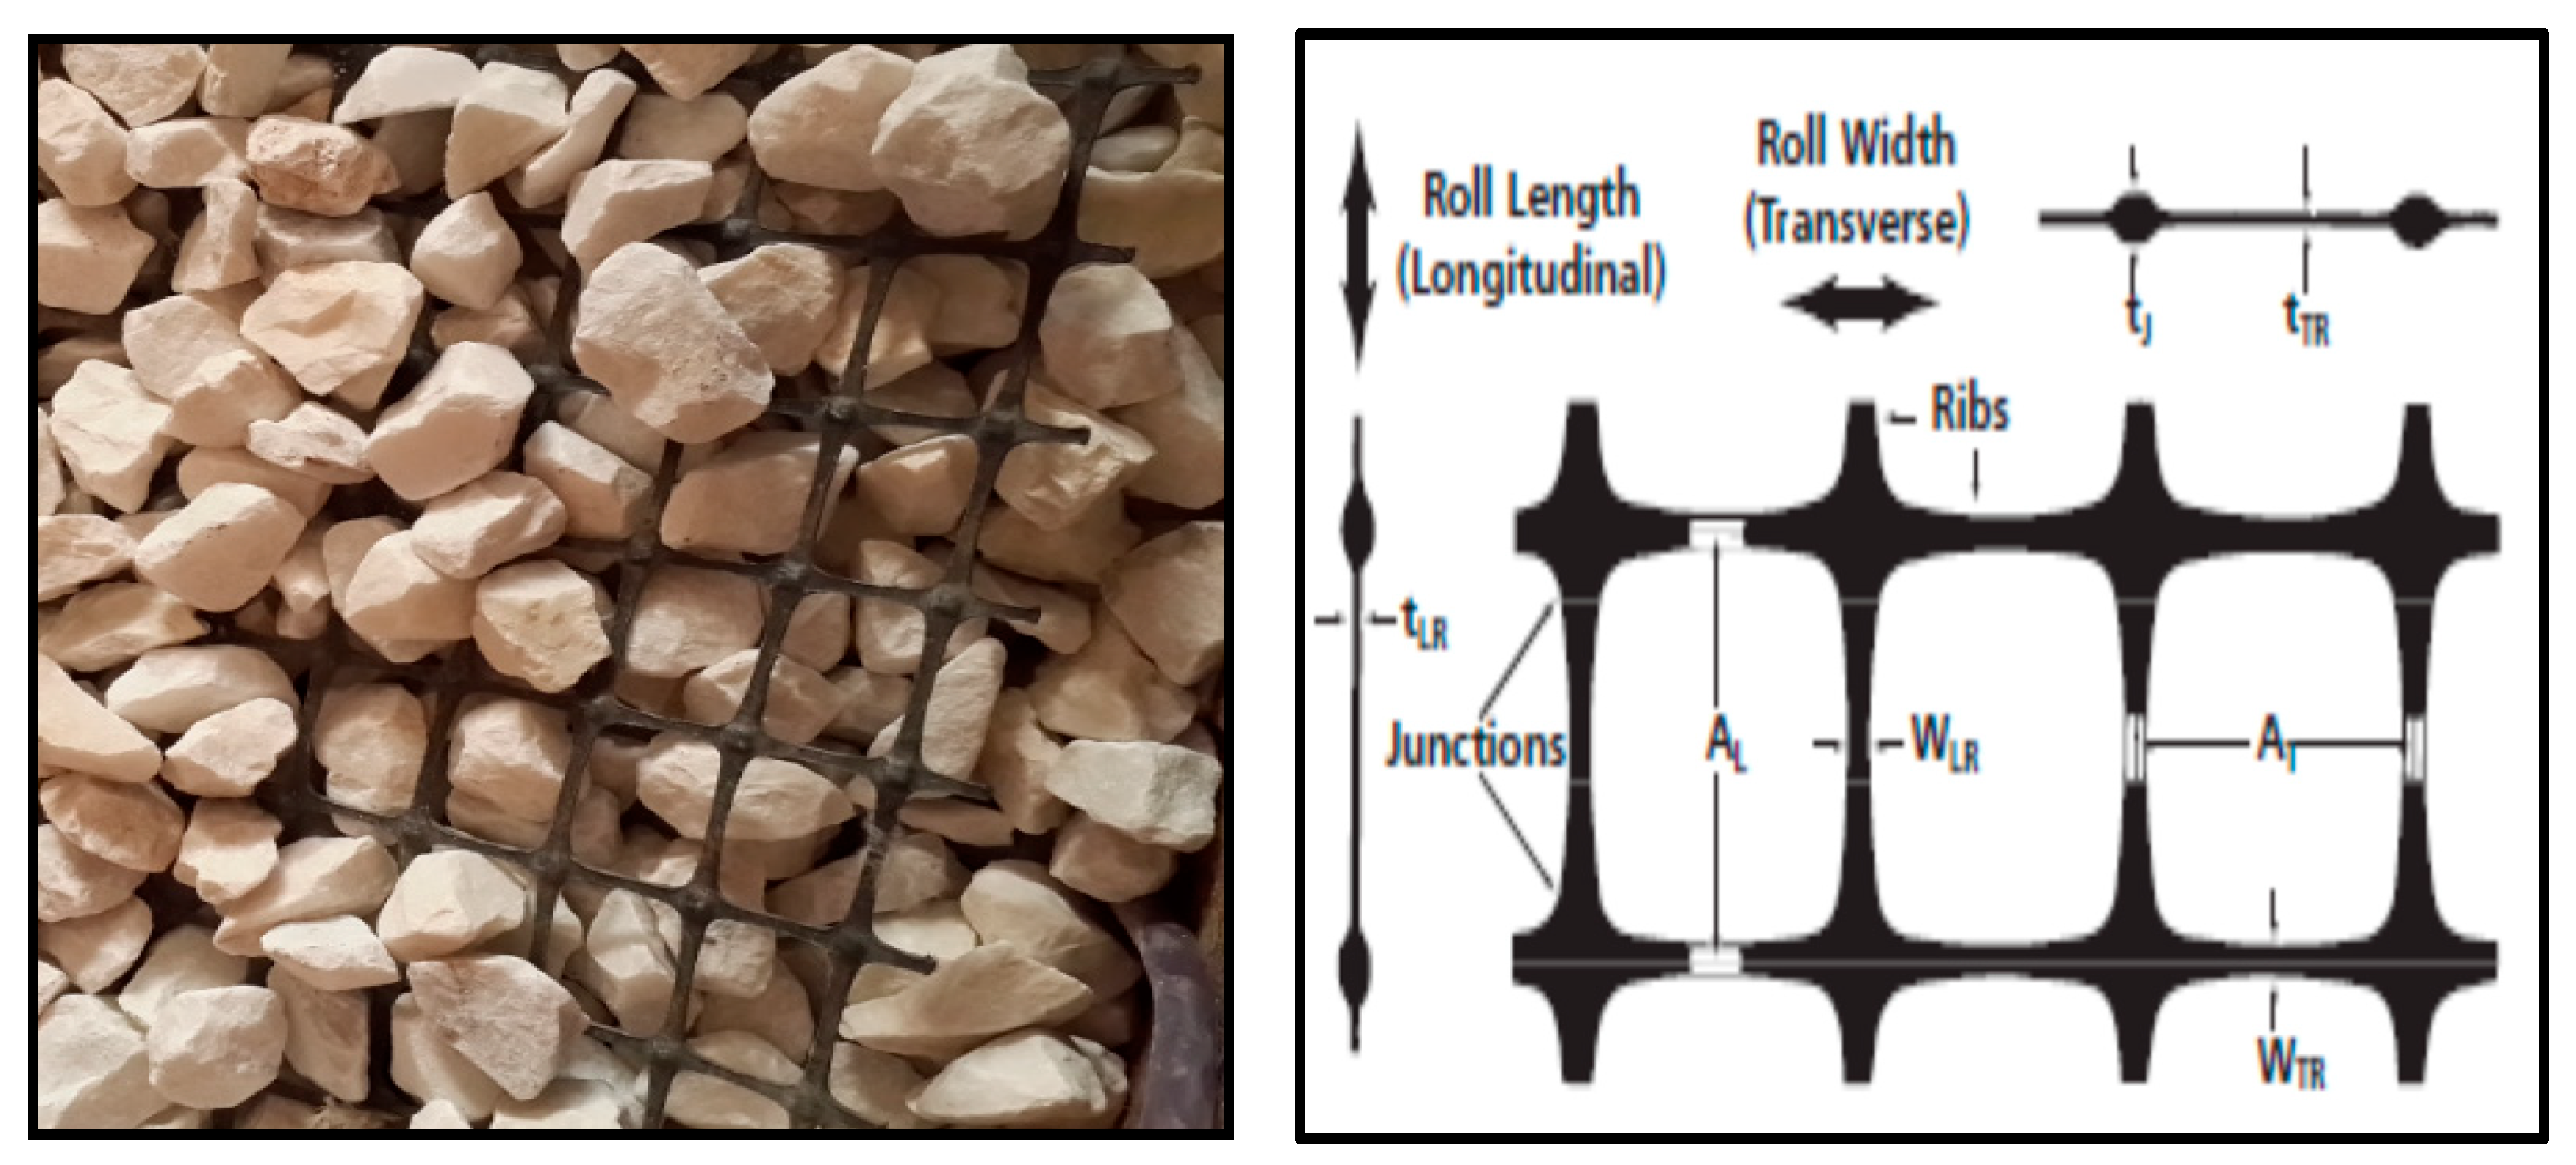
The used geogrid in the experimental tests is Tensar type SS2, as shown in Figure 2, which shows the dimensions details of geogrid reinforcement. This type of geogrid, used for the reinforcement of soil and aggregate, is produced by Tensar International.
3.1. Measurement of Soil Suction
The soil water characteristics curve was established by two indirect approaches, which are:
- the electrical method calibrated by the MP6 sensor;
- the filter-paper method.
3.2. Filter-Paper Method
The usage of filter paper is one of the most used indirect methods. It can be used to evaluate the SWCC in both wet and dry conditions. The process is followed in compliance with ASTM D5298-10 [34] guidelines. Five sets of specimens, each with eight specimens, were prepared in order to ascertain the soil’s SWCC and examine the impacts of saturation on the outcomes of SWCC in both drying and wetting situations.
Four sets of soil samples were prepared with a water content of 17.55%, which corresponds to a 70% saturation degree, and an initial γdry of 16 kN/m3. The produced soil samples have dimensions of 50 mm in diameter and 65 mm in height. The fifth group of specimens was made with varying water contents to approximate varying saturation levels (from 90% to 20% Sr.) at a dry unit weight of 16 kN/m3.
Four sets of soil specimens were oven-dried until they were totally dry, after being gradually exposed to air. Eight soil specimens from the first set were completely saturated with water by pouring it on them from the top surface of the samples in order to evaluate the samples’ drying curve SWCCs. Once the samples reached the necessary level of saturation, they were progressively air-dried. In order to create the SWCC wetting curve, eight more samples, which comprise the second set, were wetted by adding water to them from the top surface until they reached the required saturation level [35].
After being capillary rise-soaked to 100% of its degree, eight soil samples, or the third set, were air-dried gradually to the required degree of saturation in order to attain the drying curve of the SWCC. The fourth batch consisted of eight more samples that were wetted using capillary rise until they achieved the required saturation level to create the SWCC wetting curve.
In order to prepare the samples for the filter-paper test, they were all kept in a plastic case for seven days in order to achieve an equilibrium of moisture inside of them. Saturation levels for the fifth set’s preparation ranged from 90% to 20%. To prepare the samples, a specific amount of water was mixed with the soil to achieve the desired saturation level. To attain the required degree of water balance in the soil, the mixed soil was then sealed in plastic bags and left for 48 h [36].
Three stacked filter papers of the Whatman No. 42 type were placed in full contact in the center of the soil sample. The purpose of the filter papers placed abroad, as directed by ASTM D5298-10 [34], is to ensure that the central filter paper—which will be used in the test—is not contaminated by the soil in which it is placed. In order to reduce the equilibrium period between the soil sample and the filter papers, Bulut et al. [36] recommended placing the soil specimens and filter papers in a glass cylinder container with the sample filled to around two-thirds of the container space.
The samples must be kept in an airtight container for seven days in order to reach an equilibrium state for the total suction measurement. This will enable the specimen, the filter paper, and the air inside the container to all have the same pore water-vapor pressure. In the case of a mechanical suction measurement, the fluid travels from the filter paper in touch with the soil to the central filter paper used in the test, eventually reaching the equilibrium state.
As soon as the equilibrium state in the soil specimens was attained, the suction values for the placed filter sheets and the specimens grew identical. The moist filter sheets were then weighed as soon as possible on a scale with 0.0001 precision. The filter papers were then placed in tins and baked at 105 °C for six hours, as advised by Fattah et al. [37], before being weighed again to ascertain the paper’s water content. The filter paper’s W. C. differential suction calibration curve can be used to calculate the suction value using the ASTM D5298-10 [34] calibration curve, which incorporates the case wetting and drying curves.
4. Laboratory Specimens Measurement Using MP6 Sensor
An MP6 sensor was used to evaluate the soil’s SWCC on five sets of samples, each comprising seven samples. Four sets of samples with the same dry unit weight of 16 kN/m3 and water content of 17.55% were created using a modified Proctor mold. After that, the samples were left to cure in an oven and outside air until they were completely dry. After that, the sensor was put into these samples. The four sets of samples were saturated in different ways, just like filter papers. For the first two sets of seven specimens, water was added via capillary rise; the amount of water added was calculated to raise the soil’s saturation percentage (Sr.%) to the required level in order to achieve the SWCC. The other seven specimens were fully saturated in the same way and dried to the required Sr.% to evaluate the dry SWCC.
Water was poured to the top of the second set of soil specimens to make them saturated in order to evaluate the drying and wetness SWCC. Seven specimens were thoroughly saturated and allowed to dry to the required saturation percentage in order to evaluate the dry SWCC. The remaining seven specimens were saturated to the required degree of saturation (Sr.%) by adding a predetermined amount of water to obtain the soaking SWCC.
The specimens were sealed by bending them with a plastic roll and then stored. Suction readings on the specimen were monitored over time until they stabilized at a constant value, indicating moisture balance. The fifth set of samples was produced by compacting the soil with different water contents in order to obtain different saturation percentages of Sr.% at a constant dry unit weight of 16 kN/m3. After that, the samples were sealed by being bent with plastic rolls, and they were left for a whole day to reach hydro equilibrium. After the sensor was inserted into the samples, the suction value was monitored over time until it stabilized.
There were two sets of specimens used. The first group was for the MP6 device and included five sets, each of which had seven specimens made using a modified Proctor mold. The second group, which consists of five sets, with each set having eight specimens, is for the filter-paper method. For the two groups combined, the first was to look into how saturation methods affected the value of SWCC. This was the primary goal of the investigation. The second is assessing the impact of varying the water content while maintaining the same dry density on the SWWC and contrasting them with the SWCC derived from samples made with the same water content and dry density. Three ways were used to reach the required degree of saturation as following:
- Water-content variation (V). The specimens are produced by compacting them with precalculated water content to achieve the necessary degree of saturation. All specimens have the same dry density, which is 16 kN/m3;
- Saturation of capillary rise (C). Water was added to the bottom of the specimens to make them saturated, and the capillary phenomenon caused the water to ascend upward through the specimen. These samples were all compressed to the same water content and dry density;
- Adding top surface water (T). Water is introduced to the specimens’ tops to ensure that they reach the necessary level of saturation. These samples were all compressed to the same water content and dry density.
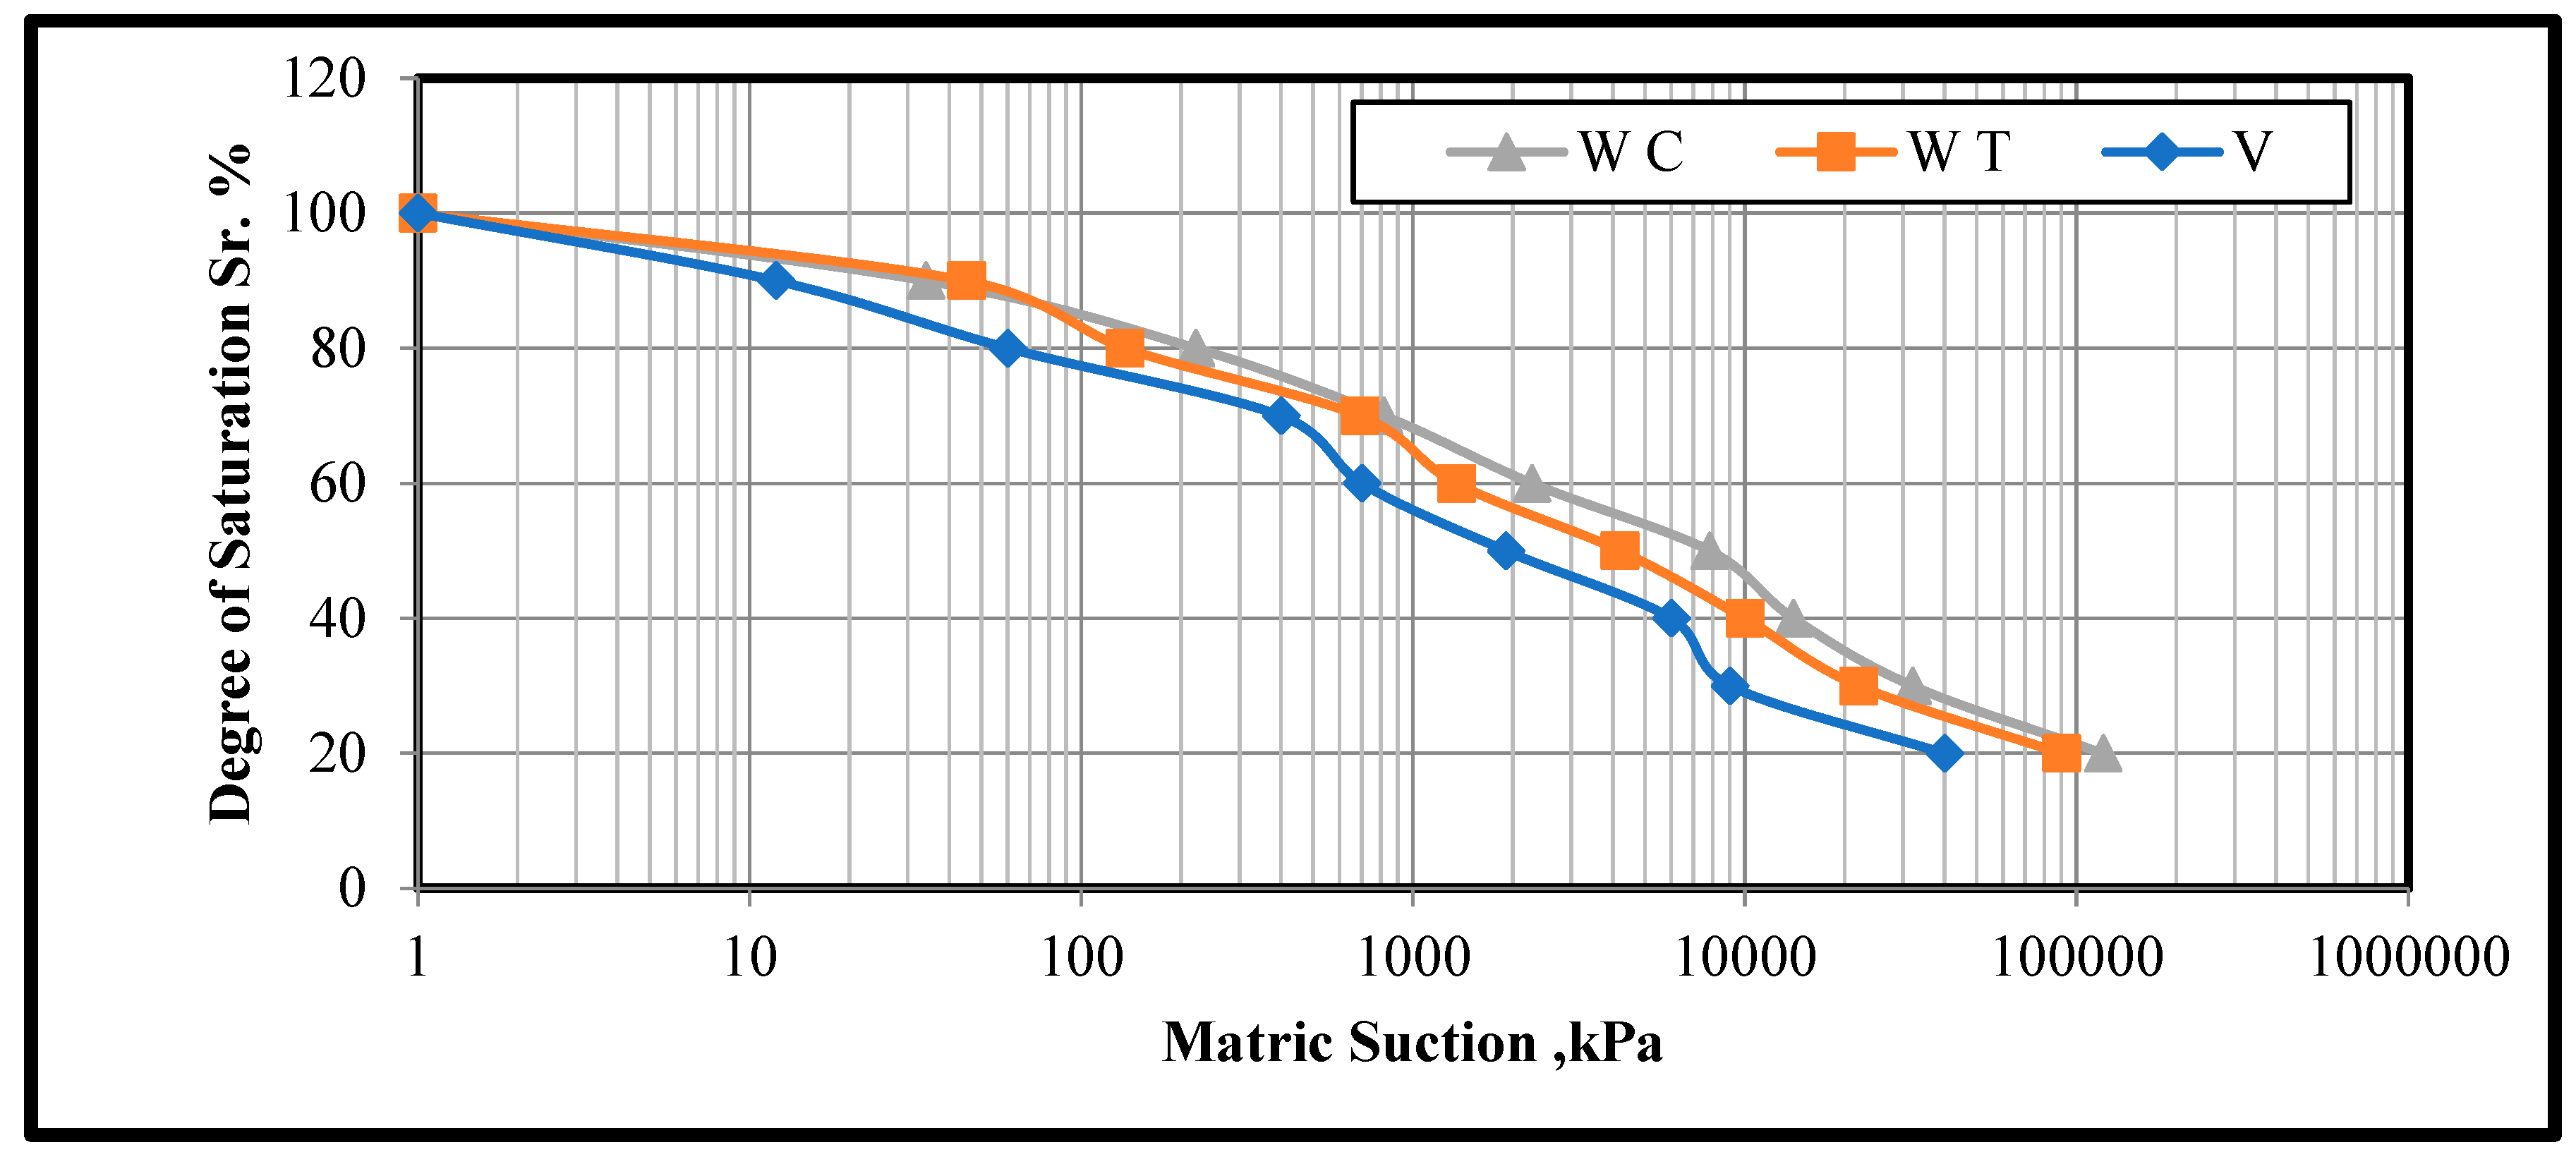
The wetting (W) and drying (D) of SWCC were established for the capillary rise saturation method and the top surface water-adding saturation method. It should be noted that, in the SWCC figures, the terms “Top” and “Capillary” denote, respectively, the top surface water adding saturation method and the capillary rise saturation method. However, the samples that were created with varying water contents are denoted by the word “Variable.” Conversely, the terms “wetting” and “drying” refer to the SWCC’s respective wetting and drying processes. It is important to note that the dry unit weight of each of the aforementioned specimens is 16 kN/m3, just as the models that were evaluated in the lab. The subgrade layer of the laboratory model was chosen with a dry unit weight of 16 kN/m3 because, after multiple trials, it was discovered that this dry unit weight was the most effective in preparing nearly homogenous density in the laboratory models, with the use of the tamping compaction method to achieve the necessary density.
5. Load Setup Design and Manufacturing
In order to conduct the experimental laboratory testing, a unique equipment system that produces various capacities of dynamic (cyclic) loads and frequencies was created and constructed. In order to replicate the real railway-track loading conditions as closely as possible, a variety of accessories were created. To accomplish the objectives of this study, the testing-apparatus system was used to investigate the stress–strain response of unsaturated subgrade soil under railway-track loading.
The testing-apparatus system components are the following:
- Loading frame made of steel;
- Two hydraulic loading systems;
- Steel beam of dimensions (800 mm × 65 mm × 65 mm) as a load distributor;
- Two data-acquisition systems;
- Shaft encoder;
- A (1.5 m length × 1 m width × 1 m height) dimensioned container made of steel.
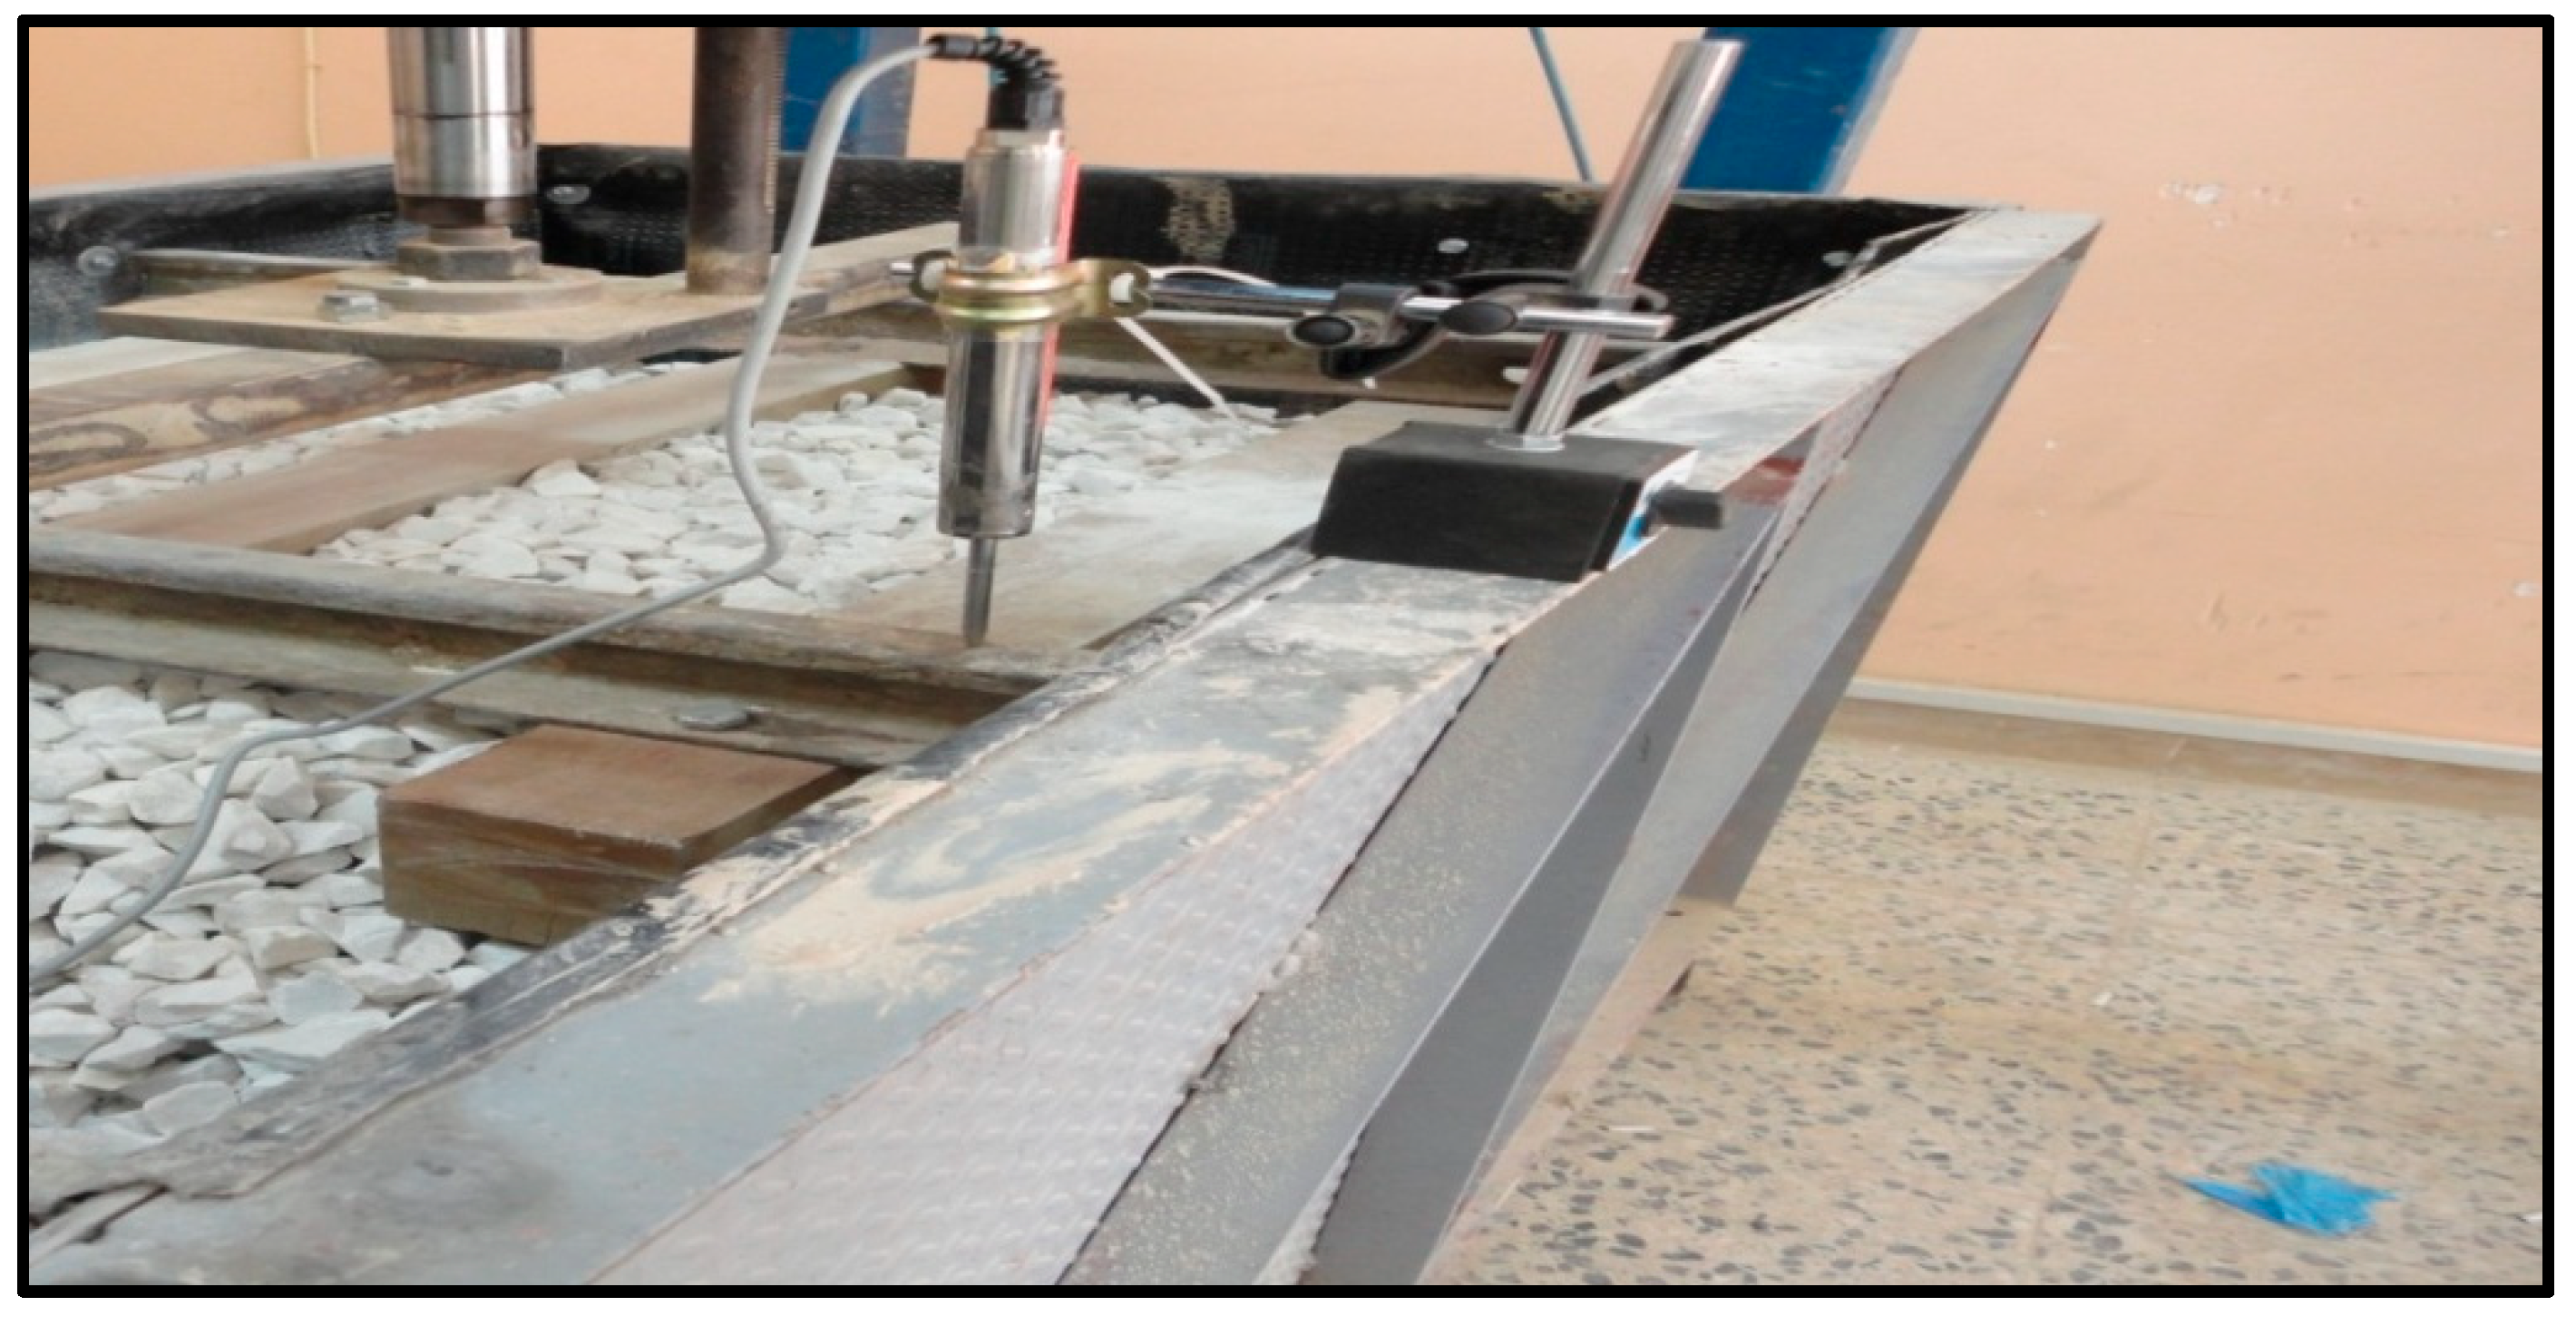
The hydraulic loading system produces a maximum load frequency of 4 Hz. The distributor beam was also manufactured with dimensions to fit the loading conditions. The apparatus system used in performing the testing is shown in Figure 3.
In order to support and ensure the verticality of the hydraulic jack utilized to apply the centrally concentrated weight, a steel frame, as shown in Figure 4, was created. The primary testing frame, measuring 1700 mm by 700 mm by 1700 mm, was constructed using four-millimeter-thick steel square sections, measuring 100 mm by 100 mm (comprising four columns and four beams). Two steel channels were welded vertically to the top of the steel frame (upper beams) from the lower end of the channels and fixed to the ceiling at their upper end in order to strengthen the steel testing frame.
The steel testing frame was installed using four 200 mm by 200 mm by 20 mm base plates that were fastened to the ground. Each base plate contains four bolts that link it to the ground. Every foundation plate was joined to the steel frame via welding.
6. The Hydraulic Loading System
The hydraulic pump gear type is present in the original testing-apparatus system. This pump’s discharge capacity of 200 CC/s allows it to deliver a maximum amplitude pressure of 15,000 kilopascal. An electrical rotary motor with a touch to three horsepower powers the pump axis. The rotation speed of this electrical rotary motor is approximately 1450 rpm. A hydraulic steel tank with a seventy-liter storage capacity has both the pump and the electrical motor mounted on its upper surface. The greatest frequency that this hydraulic system can produce is 4 Hz.
PLCs, or programmable logic controllers, regulate the direction in which they move. Two data-acquisition systems control the necessary frequency and the direction of motion of the hydraulic cylinder jack (the original and the new one). The data-acquisition system screen allows for the display and monitoring of the load amplitude. To demonstrate the necessary frequency, a further modification to the hydraulic cylinder jack was developed in this study. For the applied load magnitude, a screw attached to a hydraulic valve can regulate it. A load gauge attached to a valve measures the load, and another one inspects it. The load gauge needs to be adjusted right before the hydraulic oil access to the hydraulic jack.
To apply the load on the track panel in an appropriate and right manner, a solid steel beam with the dimensions (800 × 65 × 65 mm) shown in Figure 5 was used. To conduct tests on a half-scale model, a 1.5 m length by 1 m width by 1 m height steel container with well-welded steel-plate components that were 5 mm thick was utilized. Angles at the edges of the long sides and the base, which is reinforced by three exterior channels (a 50 mm web and a 25 mm flange), formed an external bracing.
7. The Two Data-Acquisition Systems
In order to analyze and record the displacement of the main hydraulic cylinder jack shaft during the test, two data-acquisition systems were used. This allowed the tester to quickly and accurately obtain a huge amount of displacement data. The data capture was also utilized to determine the test’s necessary frequency. Every data-acquisition system has a programmable logic controller (PLC) that can digitally evaluate the data and operate the hydraulic jack. It is made up of digital computers with high-tech processing units and electro-mechanical automation processes. The applied simulated traffic loading on the track panel is performed by means of an emendation halve sine wave load as suggested and used by Awoleye [38] and Fattah et al. [39]. This loading system simulates the passing of train wheels over the railway track.
8. Instrumentation
As seen in Figure 6, four linear variable differential transformers (LVDTs) were utilized to assess the track panel’s settlement in order to compare the accuracy of the shaft encoder settlement measurements with it. They were also employed to gauge how much the clay layer had settled.
Three pressure cells were used in the laboratory models; they are heavy-duty cells of model 3515 Geokon, which is suitable for railroad-ballast pressure measurement, and two heavy-duty cells of Model 3500 Geokon that are used to measure the pressure in clay layers (subgrade). Both types (Model 3500 and 3500) of pressure cells are capable of measuring the pressure changes according to dynamic loads.
Dynamic pressure changes are measured with a Model 3515 pressure cell. It will be the best option to put both plates in railroad ballast because they are sufficiently thick to withstand point loads from surrounding ballast. Because of its thin plate, which makes it more sensitive to pressure changes than the Model 3515 cell, Model 3500 is utilized for the study of dynamic pressure changes in clay.
It is usually advised to make sure the cell is operating properly. Every cell has a load zero reading; to adjust the readout and make it increase in accordance with rising pressure, press on the cell.
9. Track Panel
The track panel that is used in the laboratory models is composed of a pair of rails 800 mm in length and three sleepers made from wood of dimensions (900 mm × 100 mm × 100 mm) as shown in Figure 7.
10. Model Preparation
To conduct the experiments, half-scale railway laboratory models were employed. The tests were conducted in a steel well-tied box with dimensions of 1500 mm in length, 1000 mm in width, and 1000 mm in height. The test box was cushioned using two layers to prevent wave reflection during the test. The first layer is made of packed styropor sheets and is 5 mm thick, while the second layer is made of rubber and is 4 mm thick.
Each model is comprised of a 500 mm clay layer, a 200 mm ballast layer covering the clay layer, and a track panel made up of two 800 mm long rails and three 900 mm by 100 mm × 100 mm wooden sleepers. The track panel is placed on the top of the ballast layer. Figure 8 shows the laboratory test section.
11. Preparation of the Soil Layer
Numerous tests and measurements were made to ensure that the preparation procedure produced a homogenous clay soil layer in order to replicate one. Tests for unconfined compression (ASTM D2166) [40] and portable vane shear (ASTM D4648) [41] were conducted. In order to obtain uniform dispersion of water, eight samples with varying water amounts to produce varying degrees of saturation (100%, 80%, 70%, 65%, 60%, 55%, 50%, and 40%) were prepared and stored in sealed plastic bags for 72 h [42]. A modified Proctor mold was used to create the samples, and a customized compaction hammer was used to gently tamp them to a dry unit weight of 16 kN/m3. A thick plastic sheet was placed over the test specimens. Over the course of seven days, the specimens were tested daily. The purpose of this test is to ascertain how the remolded soil’s undrained shear strength changes over time, as it regains strength following the mixing procedure, as illustrated in Figure 9. Figure 10 illustrates the relationship between the undrained shear strength and the degree of saturation Sr% from the unconfined compression test and the vane shear test conducted seven days after molding.
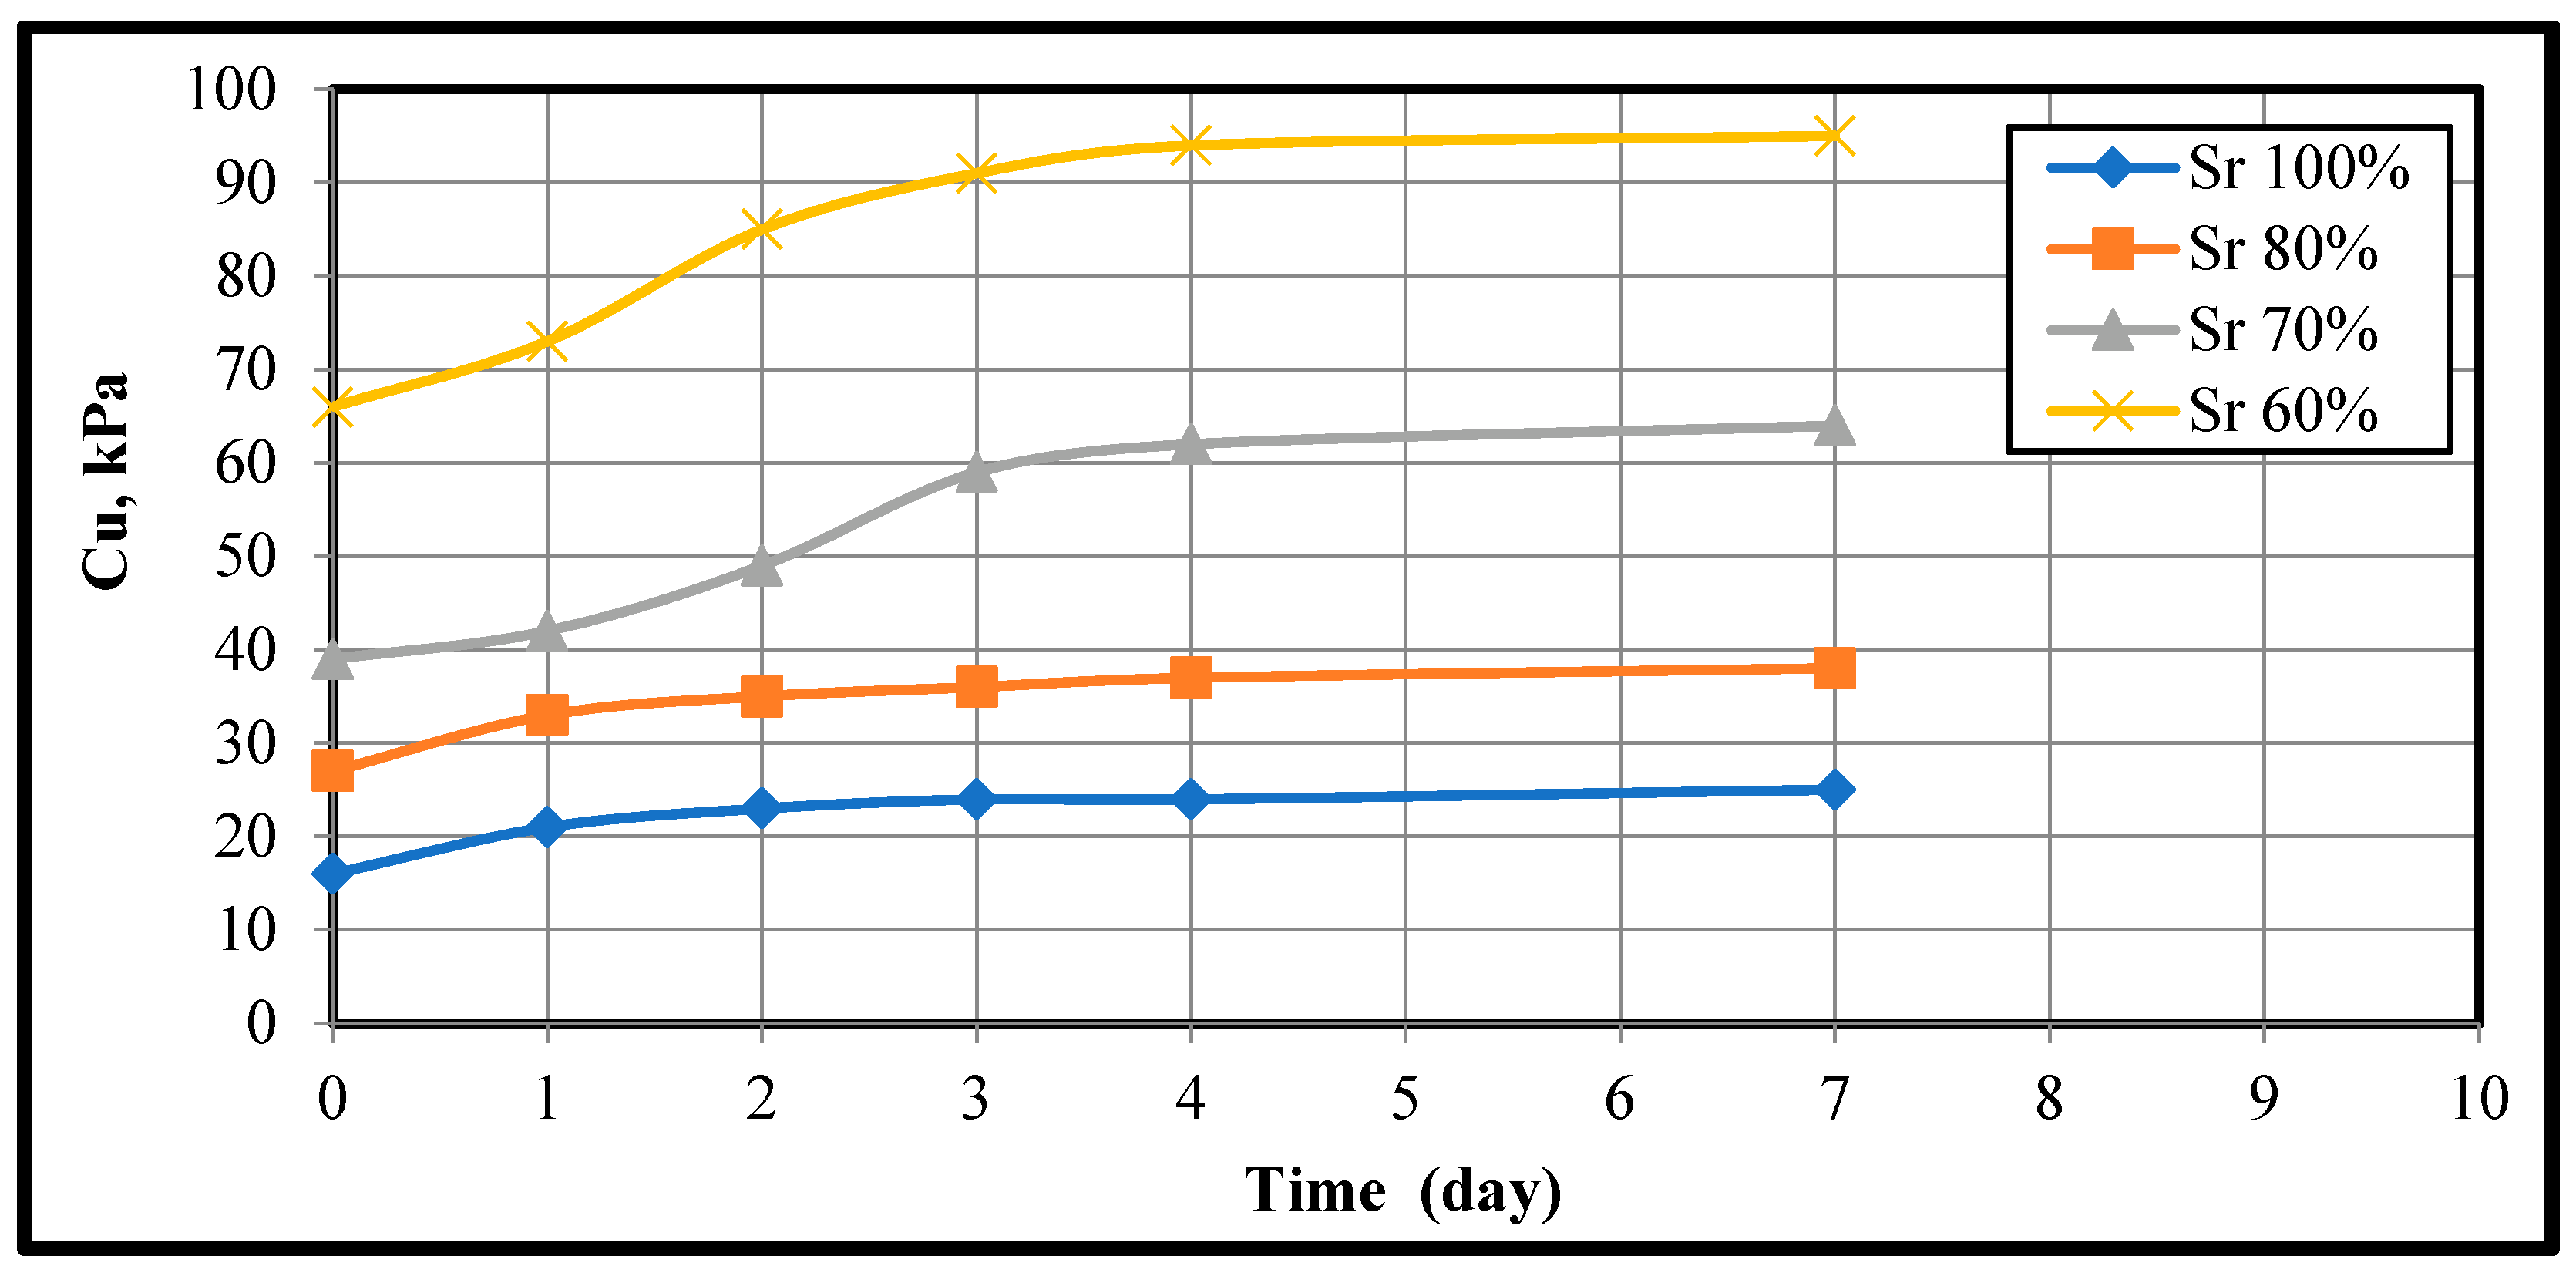
Additionally, Figure 11 demonstrates that the soil recovers its strength in two days for 100% and 80% saturation and four days for 70% and 60% saturation. According to Look [43], stiffness is defined as a degree of saturation of less than 70% and Cu greater than 50 kN/m2, as demonstrated by Figure 11, where the value of Cu obtained from the vane shear test is less than that obtained from the unconfined compression test. According to ASTM D4648 [41], this behavior could indicate that the samples are departing from the assumed cylindrical failure surface, which would cause a mistake in the observed strength.
In order to achieve the necessary degree of saturation Sr%, water was added to the soil in half-scale laboratory models of the clay layer. The clay was then compacted to the necessary dry density [9,42].
The soil sample was initially air-dried and ground for several days until it was suitable to pass through a #10 sieve, which has a 2 mm sieve aperture. Following that, the initial water content of the crushed soil was determined using (ASTM D2216) [40].
Using a big mixer, 25 kg of dirt was combined with one mixing portion of water for a sufficient amount of time to ensure homogeneity. For a minimum of seven days, the soil was kept in 50 kg plastic bags in order to ensure a consistent water distribution. Following that, the earth was compacted to the necessary dry unit weight (16 kN/m3) using a specialized compaction device. The soil was built to a depth of 500 mm, and seven layers total—six of them were 70 mm thick and one was 80 mm thick—were used for compaction.
At a depth of 250 mm from the soil surface (at the middle of the layer), two pressure cell model 3500s were instilled under the rail at the middle sleeper. One of these pressure cells was laid horizontally to measure the vertical stresses and the second one was laid vertically to measure the lateral stress.
12. Preparation of the Ballast Layer
The building of the ballast layer was the second step in the model preparation process. On top of the previously produced clay layer, a 200 mm thick ballast layer was applied. Following the five-to-seven-day storage period of the clay layer, the soil suction of unsaturated soil should be evaluated. The degree of saturation of the clay soil layer is determined by comparing the suction value reading with the SWCC. Measurements should also be taken of the clay layer’s water content and undrained shear strength.
Three levels of ballast were progressively built, each layer being 65 to 68 mm thick, until the necessary thickness of 200 mm was reached. As seen in Figure 11, a tamping rod was used to gently compact each layer in order to achieve a relative density of roughly 78% and a dry unit weight of approximately 18.21 kN/m3. A layer of ballast with a preset volume and weight was used to achieve this. The geogrid was positioned inside the ballast layer at a depth of (1/2) of the thickness of the ballast, or 100 mm below the surface of the ballast. The ballast side had about a 2:1 slope.
13. Procedure for Testing Models
For the testing program, four different saturation levels of clay soil (100, 80, 70, and 60%) were used. Once the model test preparation is finished, the test procedure—which comprises the steps outlined here—can be put into action. To determine the initial soil state, the matric soil suction should first be measured and documented. With a 3.5-ton-capacity manual movable hydraulic jack, the model is moved to the loading frame. To guarantee that both track-panel rails have the same amount of the applied load, the model must be properly positioned and centered such that the center of the load distributor beam fits with the panel center. After that, the load distributor beam was moved down slowly until full contact with the rails occurred.
The test can start when the load and frequency are adjusted via the data-acquisition system’s LCD touchscreen, as needed [44]. Different values are applied for the load and frequency. The applied load values are 15, 25, and 35 kN, and the frequency values are 1, 2, and 4 Hz. The distributor beam, which carries the load to the track panel’s rails and, subsequently, to the sleepers set on the ballast, was loaded via the jack.
A displacement transducer, sometimes known as a shaft encoder, was incorporated into the hydraulic jack’s body to measure the vertical movement of the hydraulic jack’s shaft and to record the vertical settlements of the track panel. This displacement may be regarded as the measured settlement of the track panel. In order to assess the validity of using the displacement transducer of the hydraulic jack shaft encoder’s results as the average track-panel settlement, settlements at the outer sleeper edges were measured and recorded using linear vertical displacement transformers (LVDTs). The results of the LVDT and the shaft encoder were then compared.
14. Results and Discussion
The results from tested laboratory half-scale models and laboratory specimens that were used to determine the soil’s SWCC are presented, examined, and debated.
Figure 12, Figure 13 and Figure 14 show the MP6 sensor matric measuring values results. Figure 12 illustrates the changing water content using the Mp6 sensor and the SWCC for the wetting and drying top surface addition method. With the exception of the range of 85 to 73% Sr, where the matric suction values of the variable curve were higher than those of the wetting curve values, the findings shown in this figure clearly show that the values of the variable WC are smaller than the values of the wetting and drying curves but closer to the wetting curve. Figure 13 displays the results of the wetting and drying curve for the changing water content and capillary rise saturation method. Figure 13’s wetting curve is evidently closer to the changing water content. Additionally, Figure 12 and Figure 13 show that the variable water-content curve is more similar to the wetting top curve than the wetting capillary curve. Figure 14 further supports this observation by showing that the variable water content’s matric suction is more similar to the matric suction of the wetting top curve than the wetting capillary curves.
Figure 15 shows the results of the wetting and drying process for the top surface addition method and the variable water content of the filter-paper measurement method. It can be observed that the variable water content matric suction value is closer to the wetting curve and less than the wetting and drying top curves. Capillary drying, capillary wetting, and variable water-content techniques are shown in Figure 16. It is evident that Figure 15 and Figure 16 behave similarly, with the changing water content being closer to the wetting than the drying curve. Furthermore, the changing water content matric suction values are demonstrated to be closer to the top than the capillary curve. It should be noted that the wetting top and the wetting capillary in the filter-paper method are more converged than the MP6 sensor wetting top, as shown in Figure 17.
15. Stresses in the Subgrade Layer
In order to examine the impact of load frequency on the stresses in the subgrade layer, a set of twenty-one figures was created, numbered 18 through 38. The average maximum pressures determined by a pressure cell placed on the subgrade layer surface—referred to as the “Surface” in this work—are displayed in Figure 18, Figure 19, Figure 20 and Figure 21. It is observed that the effect of load frequency on the stress values at the surface of the subgrade layer is limited at the subgrade degree of saturation (100%), with the exception of the case of a load amplitude of 15 kN and 35 kN, in which increasing the load frequency from 2 to 4 Hz led to a 7% rise in pressure. This means that the transmitted stress from the ballast layer to the subgrade layer was not affected by the increasing load frequency when the subgrade was fully saturated, as explained in Figure 18.
In fully saturated soil, the impact of loading frequency tends to decrease as the number of cycles increases and as the magnitude of the shear stress decreases. When examining cyclic behavior using a limited number of cycles, like in the case of earthquakes, the impact of cyclic frequency appears to be significant. This type of behavior was observed in both undisturbed and remolded samples. It appears that remolded samples are more resilient to cyclic shear loads [45,46,47].
The surface stresses value models created for Sr. 80% are shown in Figure 19. The results show that an increase in load frequency from 1 to 2, and up to 4, Hz causes an increase in surface pressure of approximately 11.5 and 16.5%, respectively, for a load amplitude of 15 kN. The surface pressure increased by 8% and 5%, respectively, at load amplitudes of 25 kN when the frequency was increased from 1 to 2 up to 4 Hz. The same frequency increments resulted in pressure increases of 8 and 10% at 35 kN load amplitude.
Regarding Sr. 70%, Figure 20 shows that, for a load amplitude of 15 kN, increasing the load frequency from 1 to 2 up to 4 Hz causes surface pressure to rise by roughly 14% with each increment. When the frequency was increased from 1 to 2 up to 4 Hz at a load amplitude of 25 kN, the corresponding increases in surface pressure were 10% and 14%. The same frequency increments resulted in pressure increases of 9.5 and 8.5% at a load amplitude of 35 kN. Furthermore, Figure 21’s data, which pertains to the degree of saturation of 60%, displays a similar tendency. In fact, with a 35 kN load amplitude, increasing the frequency from 1 to 2 up to 4 Hz causes a 9.5% rise in pressure with each step. The same frequency increment resulted in pressure increases of 13.5 and 14.0% for a load amplitude of 25 and 16 and 12.5% for a load amplitude of 15 kN, respectively.
The aforementioned values for 80, 70, and 60% unmistakably show that, for lower load amplitudes, the load frequency has a more notable impact on the surface-pressure value. This discovery was also made in the case of Sr. 100%, where the experimental observations showed that the influence of load frequency was larger than 25 and 35 kN at a load amplitude of 15 kN.
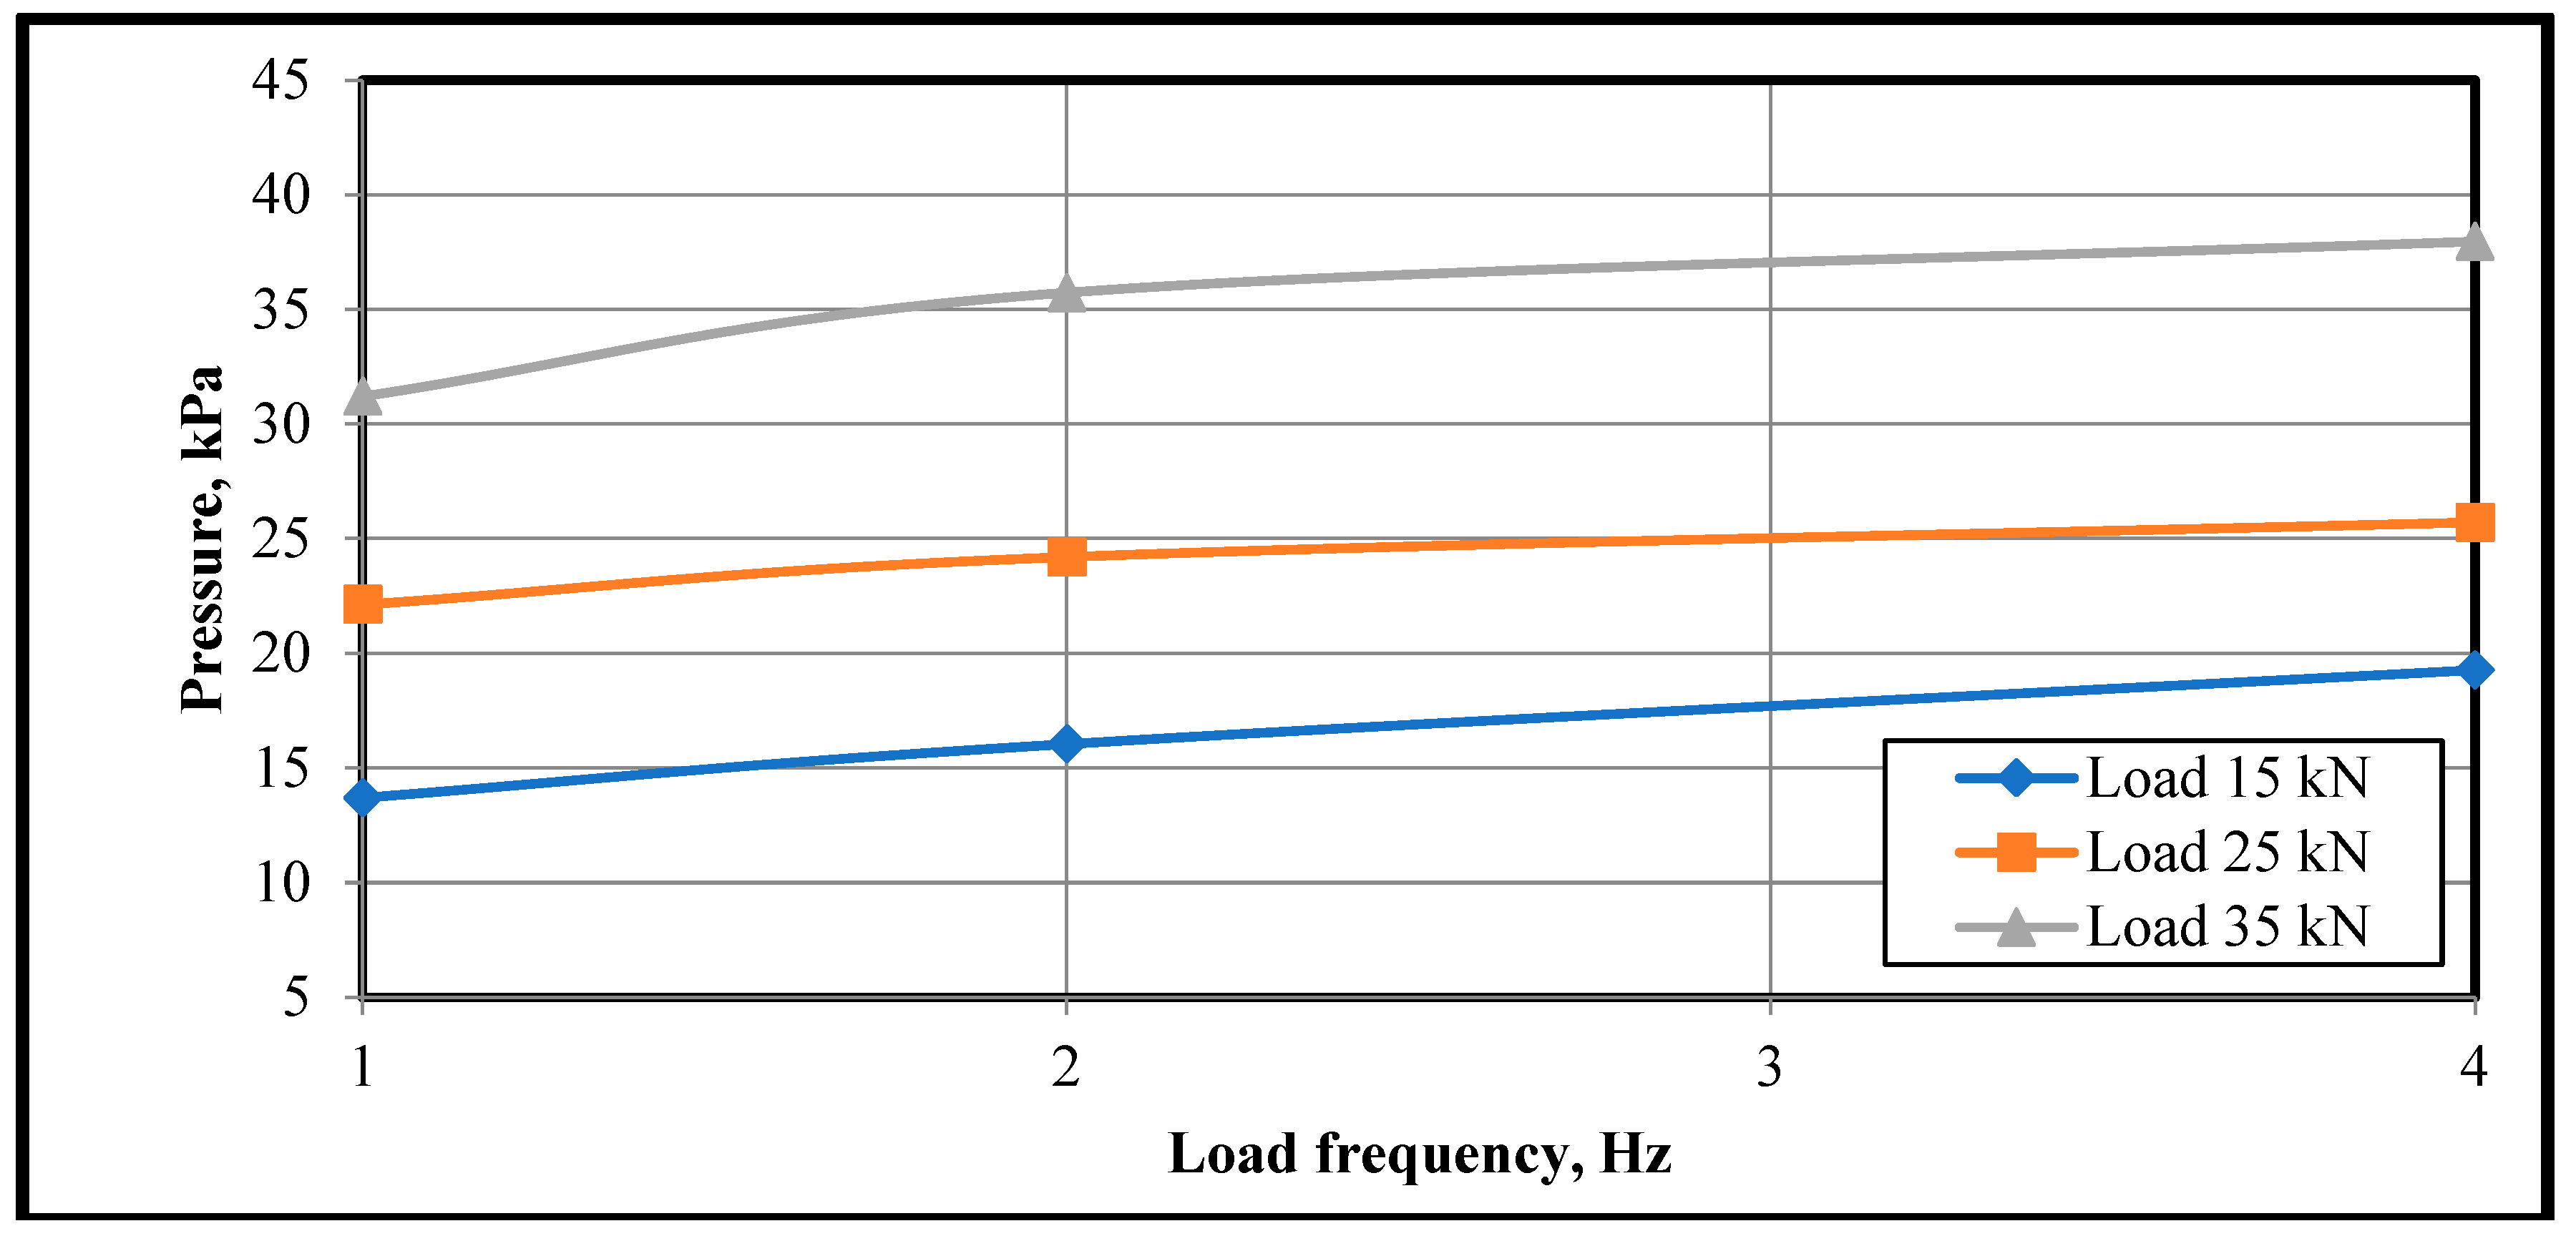
The effects of load frequency at a single load amplitude for varying Sr. % are displayed in Figure 22, Figure 23 and Figure 24. The findings unequivocally show that the frequency has a small impact on the surface pressure at Sr. 100% for a given load amplitude. Additionally, it is evident that, for load amplitudes of 15 kN and 35 kN, respectively, the surface-pressure values for frequency 1 Hz at Sr. 100 and 80% are in close proximity to one another. Figure 22 and Figure 23 illustrate these findings. Additionally, it should be mentioned that, for a 35 kN load, the surface pressure decreased when the frequency was increased from 1 to 2 Hz in the case of 100% Sr.
The average maximum pressure for various load amplitudes recorded by a pressure cell positioned in the center of the subgrade layer beneath the middle sleeper at the rail–sleeper intersection—dubbed “Deep” in this work—is displayed in Figure 25, Figure 26, Figure 27 and Figure 28.
Figure 25 for Sr. 100% illustrates how raising the load frequency from 1 to 2 Hz resulted in a very small and nearly insignificant change in the deep pressure value for load amplitudes of 25 and 35 kN. A 9.5% increase in pressure is achieved when the frequency rises from 1 to 2 Hz in the case of a modest load amplitude of 15 kN. At a load amplitude of 15 kN, an increase in frequency from 2 to 4 Hz barely and only slightly affected the pressure value (3%). However, the increase in frequency from 2 to 4 Hz resulted in 16 and 18.5% increases in pressure for load amplitudes of 25 and 35 kN, respectively.
As observed in Figure 26, in the case of Sr. 80%, an increase in frequency has an impact on the deep pressure of no more than 2% for a load amplitude of 25 kN. When the frequency is increased from 1 to 2 up to 4 Hz for load amplitudes of 15 and 35 kN, the resulting rise in deep pressure is approximately 25 and 13% for 15 kN and 23 and 10% for 35 kN.
Figure 27 illustrates how, for all load amplitudes, an increase in load frequency at Sr.70% resulted in an increase in deep pressure; 20% more pressure was observed at each frequency step from 1 to 2 up to 4 Hz with a load amplitude of 15 kN. It is shown that deep pressure increases of 7 and 11% are obtained for a load of 25 kN when the frequency is increased from 1 to 2 up to 4 Hz. On the other hand, deep pressure increases were 17 and 11% for the same frequency increment at a 35 kN load amplitude.
Figure 28 shows the senior 60%. According to the data shown in this figure, raising the load frequency from one to two leads to a good deep pressure rise of roughly 15% and 20% for load amplitudes of 15 and 35 kN, respectively. However, the pressure increased just slightly—roughly 5% and 7%, respectively—when the frequency went from 2 to 4 Hz.
The load amplitude of 25 kN shows the opposite behavior to the load amplitude between 15 and 35 kN. It can be noted that the increase of frequency from one to two caused a pressure increase of about 4%, and when the frequency increased from 2 to 4 Hz, pressure increases were about 33%.
The relationship between load frequency and deep pressure at a single load amplitude for models with various subgrade-layer saturations is depicted in Figure 29, Figure 30 and Figure 31. It is observed that increasing the frequency from two to four for a 35 kN load amplified the results in a higher pressure-rise rate for higher Sr% than lower ones. When the frequency is increased from 1 to 2 Hz, the trend is reversed, with more pressure increasing the rate for lower Sr% than for higher ones. Additionally, the results demonstrate that when the frequencies increased from 1 to 2 Hz were greater than the 2 to 4 Hz increases, and the rate of pressure increases for load amplitudes of 15 and 35 kN. The reverse of this behavior was noticed for load amplitude 25 kN, as shown in Figure 30.
For varying load amplitudes, Figure 32, Figure 33, Figure 34, Figure 35, Figure 36, Figure 37 and Figure 38 illustrate the relationship between load frequency and the lateral average maximum pressures inside the subgrade layer. A pressure cell that was installed in a lateral position in the center of the subgrade layer next to the deep pressure cell—dubbed “Lateral” in this work—was used to measure the lateral pressure.
For Sr. 100, Figure 32 is drawn. The lateral pressure value for load amplitudes of 15 and 25 kN is somewhat affected by increasing the frequency from 1 to 2 up to 4 Hz, as demonstrated by the experimental observations for a 35 kN load amplitude. It is observed that a lateral pressure rise of between 1 and 9.5% was caused by the frequency increase from 1 to 2 up to 4 Hz.
Figure 33 illustrates how raising the load frequency from 1 to 2 up to 4 Hz resulted in a 5 and 7% drop in lateral pressure for 25 kN at a subgrade degree of saturation of 80%. It is noteworthy that, at 15 kN of load, the frequency increase from 1 to 2 up to 4 Hz led to increases in lateral pressure of approximately 19 and 10%, respectively. On the other hand, deep pressure increases of roughly 19 and 3%, respectively, were caused by the frequency increase from 1 to 2 up to 4 Hz for a load amplitude of 35 kN.
Figure 34 displays the results for Sr 70%. It is evident that lateral pressure increases by roughly 17 and 20%, respectively, with increasing the frequency from 1 to 2 up to 4 Hz for a load amplitude of 15 kN. In contrast, raising the frequency from 1 to 2 up to 4 Hz resulted in increases in lateral pressure of 9 and 6%, respectively, when the load amplitude was 25 kN. When the frequency increased from 2 to 4 Hz, similar increases in load amplitude of 35 kN were seen, and a 14% rise in lateral pressure was produced when the frequency increased from 1 to 2 Hz.
As illustrated in Figure 35, it is evident that for Sr. 60%, the lateral pressure at load amplitudes of 15 and 35 kN is barely affected by the frequency increase from 2 to 4 Hz. Conversely, when the load frequency was increased from 1 to 2 up to 4 Hz in the case of 25 kN, the lateral pressure decreases by 7 and then increases by 28%. The increase in frequency from one to two resulted in lateral pressure increases of approximately 6 and 17% for load amplitudes of 15 and 35 kN, respectively.
The relationship between load frequency and lateral pressure at a single load amplitude for different subgrade-layer saturations is depicted in Figure 36, Figure 37 and Figure 38. The findings displayed in these figures unequivocally show that, for all degrees of saturation, the rate of rise in lateral pressure was greater when the frequency was increased from 1 to 2 Hz than when it was raised from 2 to 4 Hz. As seen in Figure 38, this behavior is more evident at load amplitudes of 35 kN than it is at 15 and 25 kN.
16. Conclusions
- The generated stresses of the subgrade-layer soil.
- Load amplitudes of 15, 25, and 35 kN showed that the more the load amplitude, the more stresses were on the surface, deep, and the lateral pressure cells;
- At 100% subgrade-layer saturation, the increased load frequency has little to no effect on the stresses at the surface, deep, and lateral pressure cells; however, the lateral stress responds more to the increase in frequency than the deep and surface pressure. In contrast, for Sr. 80, 70, and 60%, the higher load frequency causes the surface, deep, and lateral stresses to increase in magnitude, and this effect increases as Sr. decreases. Additionally, for all the Sr.% values of the subgrade layer, the rise in the lateral stress values was higher when the frequency increased from 1 to 2 Hz than from 2 to 4 Hz;
- The stress value generated in the surface, deep, and lateral pressure cells is larger when the saturation degree is lower. In comparison to the deep pressure cell and the lateral pressure cell, the rate of stress rise measured by the Sr% decreasing was larger at the surface-pressure cell. This tendency was also observed when comparing deep and lateral cells, where the deep cell increased at a faster pace than the lateral when the subgrade layer’s percentage was reduced.
- The increase in load frequency leads to an increase of subgrade-layer settlement for Sr. 80, 70, and 60% and this increase is higher for the lower degree of saturation. The load frequency has no effect on the subgrade-layer settlement rate of increase at Sr.100%;
- The load amplitude has a very small effect on the attenuation of stresses ((deep/surface) pressure cell measurement) through the subgrade layer. The maximum increase of (deep/surface) stresses according to load increase was at a 70% subgrade-layer degree of saturation. For all Sr% of the subgrade layer, the increase in load frequency generally results in an increase in (deep/surface) stresses. The decrease in the degree of saturation of the subgrade layer has a deep impact on the attenuation of stresses, especially when the Sr% decreases from 80 to 70 down to 60%;
- The track-panel settlement increases with the load amplitude for all load frequencies and degrees of saturation of the subgrade layer. This effect is higher with a higher degree of saturation and load frequency. The track-panel settlement increases with the subgrade-layer degree of saturation. The rate of settlement increase was at a lower rate when the Sr% increased from 60 to 70% than when it increased from 70 to 80 up to 100%. The effect of load frequency is small on the track panel, and the effect of the frequency on the settlement of the track panel is higher at a higher degree of saturation than lower one;
The asymptote value (The asymptote value can be defined as the number of cycles that the track-panel settlement reaches 80% from its final value) increased with load amplitude and frequency. Also, it increases with the decrease of the subgrade degree of saturation.
- 5.
- In load cases 15 and 25 kN, the rate of increase was at a high rate when the Sr. increased from 80 to 100%, whereas in the case of load amplitude 35 kN, the rate of increase was very low when the Sr. increased from 60 to 70% or from 70 to 80%. The subgrade layer settles in proportion to the degree of saturation. The rate of rise is larger for higher load frequencies and higher saturation degrees. The settlement increases with the load amplitude.
Author Contributions
Conceptualization, M.Y.F. and Q.G.M.; methodology, Q.G.M.; software, H.H.J.; validation, M.Y.F. and Q.G.M.; formal analysis, H.H.J.; investigation, Q.G.M.; resources, M.Y.F.; data curation, Q.G.M.; writing—original draft preparation, H.H.J.; supervision, Q.G.M.; project administration, M.Y.F.; funding acquisition, Q.G.M. All authors have read and agreed to the published version of the manuscript.
Funding
This research received no external funding.
Data Availability Statement
All data, models, and code generated or used during the study appear in the submitted article.
Conflicts of Interest
The authors declare no conflict of interest.
References
- Selig, E.T.; Waters, J.M. Track Geotechnology and Substructure Management; Thomas Telford: London, UK, 1994. [Google Scholar]
- Jin, M.S.; Lee, K.W.; Kovacs, W.D. Seasonal Variation of Resilient Modulus of Subgrade Soils. J. Transp. Eng. 1994, 120, 603–616. [Google Scholar] [CrossRef]
- McCartney, J.S.; Khosravi, A. Field-Monitoring System for Suction and Temperature Profiles under Pavements. J. Perform. Constr. Facil. 2013, 27, 818–825. [Google Scholar] [CrossRef]
- Tang, A.M.; Cui, Y.J.; Barnel, N. Thermo-mechanical Behavior of a Compacted Swelling Clay. Geotechnique 2008, 1, 45–54. [Google Scholar] [CrossRef]
- François, B.; Laloui, L. ACMEG-TS: A Constitutive Model for Unsaturated Soils under Non-Isothermal Conditions. Int. J. Numer. Anal. Methods Geomech. 2008, 16, 1955–1988. [Google Scholar] [CrossRef]
- Uchaipichat, A.; Khalili, N. Experimental Investigation of Thermo-hydro-mechanical Behavior of an Unsaturated Silt. Geotechnique 2009, 4, 339–353. [Google Scholar] [CrossRef]
- Gräbe, P.J. Resilient and Permanent Deformation of Railway Foundations under Principal Stress Rotation. Ph.D. Thesis, University of Southampton, Southampton, UK, 2002. [Google Scholar]
- Chao, Z. Experimental Study and Constitutive Modeling of Cyclic Behavior at Small Strains of Unsaturated Silt at Various Temperatures. Ph.D. Thesis, University of Science and Technology, Hong Kong, China, 2014. [Google Scholar]
- Otter, L. The Influence of Suction Changes on the Stiffness of Railway Formation. Ph.D. Thesis, School of Civil Engineering and the Environment, University of Southampton, Southampton, UK, 2011. [Google Scholar]
- Li, D.; Sussmann, T.; Hyslip, J.; Chrismer, S. Railway Geotechnics; Taylor and Francis Ltd.: Abingdon, UK, 2016. [Google Scholar]
- Burrow MP, N.; Bowness, D.; Ghataora, G.S. A comparison of Railway Track Foundation Design Methods. Pap. Present. Inst. Mech. Eng. Part F J. Rail Rapid Transit 2007, 221, 1–12. [Google Scholar] [CrossRef]
- Burrow, M.P.N.; Ghataora, G.S.; Evdorides, H. Railway Foundation Design Principles. J. Civ. Eng. Archit. 2011, 5, 224–232. [Google Scholar]
- Dareeju, B.S. Performance Evaluation of Unsaturated Rail Track Foundations under Cyclic Moving wheel Load. Ph.D. Thesis, Queensland University of Technology, Brisbane, Australia, 2017. [Google Scholar]
- Li, D.; Selig, E.T. Evaluation of Railway Subgrade Problems. Transp. Res. Board 1995, 1489, 17–25. [Google Scholar]
- Fredlund, D.G.; Morgenstern, N.R. Stress State Variables for Unsaturated Soils. J. Geotech. Eng. Div. ASCE (GT5) 1977, 103, 447–466. [Google Scholar] [CrossRef]
- Yang, S.R.; Lin, H.D.; Kung JH, S.; Huang, W.H. Suction-Controlled Laboratory Test on Resilient Modulus of Unsaturated Compacted Subgrade Soils. J. Geotech. Geoenviron. Eng. ASCE 2008, 134, 1375–1384. [Google Scholar] [CrossRef]
- Kwan, C.C.J. Geogrid Reinforcement of Railway Ballast. Ph.D. Thesis, University of Nottingham, Nottingham, UK, 2006. [Google Scholar]
- Fang, J.; Xiao, X.; Lu, L.; Jin, X. Influence of subway LIM train wheel polygonisation on the vibration and sound radiation characteristics of it. In Noise and Vibration Mitigation for Rail Transportation Systems (IWRN 2010), Notes on Numerical Fluid Mechanics and Multidisciplinary Design; Maeda, T., Gautier, P.E., Hanson, C.E., Hemsworth, B., Nelson, J.T., Schulte-Werning, B., Thompson, D., de Vos, P., Eds.; Springer: Heidelberg, Germany, 2010; pp. 117–124. [Google Scholar]
- Loh, R.B.H.; Nikraz, H. Effective Stress Method on Threshold Stress of Clay under High Rate Cyclic Loading. In Proceedings of the 5th Asia-Pacific Conference on Unsaturated Soils (AP-UNSAT 2011), Pattaya, Thailand, 14–16 November 2012. [Google Scholar]
- Leshchinsky, B.; Ling, H.I. Numerical Modeling of Behavior of Railway Ballasted Structure with Geocell Confinement. Geotext. Geomembr. 2013, 36, 33–43. [Google Scholar] [CrossRef]
- Chen, C. Discrete Element Modelling of Geogrid—Reinforced Railway Ballast and Track Transition Zones. Ph.D. Thesis, University of Nottingham, Nottingham, UK, 2013. [Google Scholar]
- Hayano, K.; Ishii, K.; Muramoto, K. Effects of Ballast Thickness and Tie-tamper Repair on Settlement Characteristics of Railway Ballasted Tracks. In Proceedings of the 18th International Conference on Soil Mechanics and Geotechnical Engineering, Paris, France, 2–6 September 2013; pp. 1275–1282. [Google Scholar]
- Chen, R.; Chen, J.; Zhao, X.; Bian, X.; Chen, Y. Cumulative Settlement of Srack Subgrade in High-Speed Railway under Varying Water Levels. Int. J. Rail Transp. 2014, 2, 205–220. [Google Scholar] [CrossRef]
- Xiao, J.; Wang, B.; Liu, C.; Yu, Z. Influences of Subgrade Form and Ground Stiffness on Dynamic responses of Railway Subgrade under Train Loading: Field Testing Case Study. In Proceedings of the 3rd International Conference on Transportation Geotechnics (ICTG 2016), Guimaraes, Portugal, 4–7 September 2016; Volume 143, pp. 1185–1192. [Google Scholar]
- Fattah, M.Y.; Mahmood, M.R.; Aswad, M.F. Experimental and Numerical Behavior of Railway Track over Geogrid Reinforced Ballast Underlain by Soft Clay. In Proceedings of the 1st GeoMEast International Congress and Exhibition, Egypt 2017 on Sustainable Civil Infrastructures, “Recent Developments in Railway Track and Transportation Engineering”, Sharm Al-Shaik, Egypt, 15–18 October 2017; Volume 14, pp. 1–26. [Google Scholar]
- Fattah, M.Y.; Mahmood, M.R.; Aswad, M.F. Stress Waves Transmission from Railway Track over Geogrid Reinforced Ballast underlain by Clay. Struct. Monit. Maint. 2022, 9, 1–27. [Google Scholar] [CrossRef]
- Sysyn, M.; Przybylowicz, M.; Nabochenko, O.; Liu, J. Mechanism of Sleeper–Ballast Dynamic Impact and Residual Settlements Accumulation in Zones with Unsupported Sleepers. Sustainability 2021, 13, 7740. [Google Scholar] [CrossRef]
- Fang, J. Impacts of high-speed rail on urban smog pollution in China: A spatial difference-in-difference approach. Sci. Total. Environ. 2021, 777, 146153. [Google Scholar] [CrossRef]
- Fang, J.; Zhao, C.; Shi, C.; Zhai, Z.; Cai, C. Dynamic impact of sleeper unsupported defects on the heavy haul locomotive-ballasted track coupling system. Soil Dyn. Earthq. Eng. 2024, 176, 108292. [Google Scholar] [CrossRef]
- ASTM D 2487-17; Standard Practice for Classification of Soils for Engineering Purposes (Unified Soil Classification System). American Society for Testing and Materials (ASTM): West Conshohocken, PA, USA, 2017.
- ASTM D 422-00; Standard Test Method for Particle Size Analysis of Soils. American Society for Testing and Materials (ASTM): West Conshohocken, PA, USA, 1972.
- ASTM D 854; Standard Test Method for Specific Gravity. American Society for Testing and Materials (ASTM): West Conshohocken, PA, USA, 2023.
- ASTM D 4318; Standard Test Method for Liquid Limit, Plastic Limit, and Plasticity Index of Soil. American Society for Testing and Materials (ASTM): West Conshohocken, PA, USA, 2017.
- ASTM D5298-10; Standard Test Method for Measurements of Soil Potential (Suction) by Filter Paper. American Society for Testing and Materials (ASTM): West Conshohocken, PA, USA, 2016.
- Fattah, M.Y.; Majeed, Q.G.; Joni, H.H. Comparison between methods of soil saturation on determination of the soil water characteristic curve of cohesive soils. Arab. J. Geosci. 2021, 14, 101. [Google Scholar] [CrossRef]
- Bulut, R.; Lytton, R.L.; Wray, W.K. Soil Suction Measurements by Filter Paper. In Proceedings of the Geo-Institute Shallow Foundation and Soil Properties Committee Sessions at the ASCE 2001 Civil Engineering Conference, Houston, TX, USA, 10–13 October 2001; Geotechnical Special Publication Number 115. pp. 243–261. [Google Scholar]
- Fattah, M.Y.; Yahya, A.Y.; Ahmed, B.A. Total and Matric Suction Measurement of Unsaturated Soils in Baghdad Region by Filter Paper Method. J. Eng. Coll. Eng. Univ. Baghdad 2012, 18, 611–620. [Google Scholar] [CrossRef]
- Awoleye, E.O.A. “Ballast type—Ballast Life Predictions”, Derby, British Rail Research LR CES 122. October 1993. [Google Scholar]
- Fattah, M.Y.; Mahmood, M.R.; Aswad, M.F. Stress distribution from railway track over geogrid reinforced ballast underlain by clay. Earthq. Eng. Eng. Vib. 2019, 18, 77–93. [Google Scholar] [CrossRef]
- ASTM D 2216-98; Standard Test Method for Laboratory Determination of Water (Moisture) Content of Soil and Rock by Mass. American Society for Testing and Materials (ASTM): West Conshohocken, PA, USA, 2019.
- ASTM D 4648-00; Standard Test Method for Laboratory Miniature Vane Shear Test for Saturated Fine-Grained Clayey Soil. American Society for Testing and Materials (ASTM): West Conshohocken, PA, USA, 2024.
- Tripathy, S.; Al-Khyat, S.; Cleall, P.J.; Baille, W.; Schanz, T. Soil Suction Measurement of Unsaturated Soils with a Sensor Using Fixed-Matrix Porous Ceramic Discs. Indian Geotech. J. 2016, 3, 252–260. [Google Scholar] [CrossRef]
- Look, B. Handbook of Geotechnical Investigation and Design Tables; Taylor & Francis: New York, NY, USA, 2007. [Google Scholar]
- Majeed, Q.G.; Fattah, M.Y.; Joni, H.H. Effect of Load Frequency on the Track Rail and Subgrade Layer Settlement. J. Eng. Appl. Sci. 2019, 14, 6723–6730. [Google Scholar] [CrossRef]
- Wichtmann, T.; Andersen, K.; Sjursen, M.; Berre, T. Cyclic tests on high-quality undisturbed block samples of soft marine Norwegian clay. Can. Geotech. J. 2013, 4, 400–412. [Google Scholar] [CrossRef]
- Ansal, A.M.; Erken, A. Undrained Behavior of Clay under Cyclic Shear Stresses. J. Geotech. Eng. ASCE 1989, 7, 968–983. [Google Scholar] [CrossRef]
- Majeed, Q.G.; Fattah, M.Y.; Joni, H.H. Effect of Load Frequency on the Subgrade Layer Stresses beneath Railways. Int. J. Civ. Eng. Technol. 2018, 9, 838–852. [Google Scholar]
Figure 1.
Clay material grain-size distribution curve.

Figure 2.
Geogrid reinforcement used in tests.

Figure 3.
The used apparatus loading system.

Figure 4.
Illustration of the steel frame used in the test loading system.

Figure 5.
Load-distributor beam.

Figure 6.
Track deflection measurement using a linear variable differential transformer (LVDT).

Figure 7.
Track panel.

Figure 8.
Section through the laboratory model.

Figure 9.
Undrained shear strength from vane shear test with time for the remolded clay specimens prepared at various saturation degrees.
Figure 9.
Undrained shear strength from vane shear test with time for the remolded clay specimens prepared at various saturation degrees.

Figure 10.
Variation of the undrained shear strength Cu with a degree of saturation Sr.% from the vane shear and unconfined compression tests.
Figure 10.
Variation of the undrained shear strength Cu with a degree of saturation Sr.% from the vane shear and unconfined compression tests.

Figure 11.
Ballast placement and tamping.

Figure 12.
SWCC for wetting top, dry top, and variable water content using Mp6 device measurement.

Figure 13.
SWCC for wetting capillary, dry capillary, and variable water content using Mp6 device measurement.
Figure 13.
SWCC for wetting capillary, dry capillary, and variable water content using Mp6 device measurement.

Figure 14.
SWCC for wetting top, wetting capillary, and variable water content using Mp6 device measurement.
Figure 14.
SWCC for wetting top, wetting capillary, and variable water content using Mp6 device measurement.

Figure 15.
SWCC for wetting top, dry top, and variable water content using the filter-paper measurement.
Figure 15.
SWCC for wetting top, dry top, and variable water content using the filter-paper measurement.

Figure 16.
SWCC for wetting capillary, dry capillary, and variable water content using the filter-paper measurement.
Figure 16.
SWCC for wetting capillary, dry capillary, and variable water content using the filter-paper measurement.

Figure 17.
SWCC for wetting top, wetting capillary, and variable water content using the filter-paper measurement.
Figure 17.
SWCC for wetting top, wetting capillary, and variable water content using the filter-paper measurement.

Figure 18.
Relation between frequency and pressure in the surface cell at 100% degree of saturation.
Figure 18.
Relation between frequency and pressure in the surface cell at 100% degree of saturation.

Figure 19.
Relation between frequency and pressure in the surface cell at 80% degree of saturation.

Figure 20.
Relation between frequency and pressure in the surface cell at 70% degree of saturation.

Figure 21.
Relation between frequency and pressure in the surface cell at 60% degree of saturation.

Figure 22.
Relation between frequency and pressure in the surface cell at 15 kN load amplitude.

Figure 23.
Relation between frequency and pressure in the surface cell at 25 kN load amplitude.

Figure 24.
Relation between frequency and pressure in the surface cell at 35 kN load amplitude.

Figure 25.
Relation between frequency and pressure in the deep cell at 100% degree of saturation.

Figure 26.
Relation between frequency and pressure in the deep cell at 80% degree of saturation.

Figure 27.
Relation between frequency and pressure in the deep cell at 70% degree of saturation.

Figure 28.
Relation between frequency and pressure in the deep cell at 60% degree of saturation.

Figure 29.
Relation between frequency and pressure in the deep cell under 15 kN load amplitude.

Figure 30.
Relation between frequency and pressure in the deep cell under 25 kN load amplitude.

Figure 31.
Relation between frequency and pressure in the deep cell under 35 kN load amplitude.

Figure 32.
Relation between frequency and pressure in the lateral cell at 100% degree of saturation.
Figure 32.
Relation between frequency and pressure in the lateral cell at 100% degree of saturation.

Figure 33.
Relation between frequency and pressure in the lateral cell at 80% degree of saturation.

Figure 34.
Relation between frequency and pressure in the lateral cell at 70% degree of saturation.

Figure 35.
Relation between frequency and pressure in the lateral cell at 60% degree of saturation.

Figure 36.
Relation between frequency and pressure in the lateral cell under 15 kN load amplitude.

Figure 37.
Relation between frequency and pressure in the lateral cell under 25 kN load amplitude.

Figure 38.
Relation between frequency and pressure in the lateral cell under 35 kN load amplitude.


Table 1.
The used clay physical characteristics.
| Test | Magnitude | Specification |
|---|---|---|
| Classification (USCS) | CL | ASTM D2487 [30] |
| Activity * | 0.41 | - |
| Clay %, <0.005 mm | 42.0 | ASTM D422 [31] |
| Silt %, 0.005–0.075 mm | 28.0 | ASTM D422 [31] |
| Sand %, 0.075–4.75 mm | 30.0 | ASTM D422 [31] |
| Gravel %, >4.75 mm | 0.0 | ASTM D422 [31] |
| Specific gravity (Gs) | 2.7 | ASTM D854 [32] |
| Liquid limit (LL) | 33% | ASTM D4318 [33] |
| Plastic limit (PL) | 18% | ASTM D4318 [33] |
| Plasticity index (PI) | 15% | ASTM D4318 [33] |
* Activity = (PI/{percent of clay < 0.002 mm}).
Table 2.
The properties of used ballast.
| Property | Magnitude |
|---|---|
| γdry minimum (kN/m3) | 15.43 |
| γdry maximum (kN/m3) | 19.17 |
| γused (kN/m3) | 18.21 |
| Relative density, R.D (%) | 78% |
| D60, mm | 22.62 |
| D30, mm | 20.43 |
| D10, mm | 17.52 |
| Uniformity coefficient, Cu | 1.29 |
| Curvature coefficient, Cc | 1.05 |
Disclaimer/Publisher’s Note: The statements, opinions and data contained in all publications are solely those of the individual author(s) and contributor(s) and not of MDPI and/or the editor(s). MDPI and/or the editor(s) disclaim responsibility for any injury to people or property resulting from any ideas, methods, instructions or products referred to in the content. |
© 2024 by the authors. Licensee MDPI, Basel, Switzerland. This article is an open access article distributed under the terms and conditions of the Creative Commons Attribution (CC BY) license (https://creativecommons.org/licenses/by/4.0/).
Share and Cite
MDPI and ACS Style
Fattah, M.Y.; Majeed, Q.G.; Joni, H.H. Stresses in Saturated and Unsaturated Subgrade Layer Induced by Railway Track Vibration. Infrastructures 2024, 9, 64. https://doi.org/10.3390/infrastructures9040064
AMA Style
Fattah MY, Majeed QG, Joni HH. Stresses in Saturated and Unsaturated Subgrade Layer Induced by Railway Track Vibration. Infrastructures. 2024; 9(4):64. https://doi.org/10.3390/infrastructures9040064
Chicago/Turabian StyleFattah, Mohammed Y., Qutaiba G. Majeed, and Hasan H. Joni. 2024. "Stresses in Saturated and Unsaturated Subgrade Layer Induced by Railway Track Vibration" Infrastructures 9, no. 4: 64. https://doi.org/10.3390/infrastructures9040064