Abstract
Using the unique combination of atomically resolved atom probe tomography (APT) and volume averaged neutron (resonance) spin echo (NRSE and NSE) experiments, the influence of nano-scaled clusters on the spin relaxation in spin glasses was studied. For this purpose, the phase transition from the paramagnetic phase to the spin glass phase in an Fe-Cr spin glass with a composition of FeCr was studied in detail by means of NRSE. The microstructure was characterised by APT measurements, which show local concentration fluctuations of Fe and Cr on a length scale of 2 to 5 nm, which lead (i) to the coexistence of ferro- and anti-ferromagnetic clusters and (ii) a change of the magnetic properties of the whole sample, even in the spin glass phase, where spins are supposed to be randomly frozen. We show that a generalized spin glass relaxation function, which was successfully used to describe the phase transition in diluted spin glasses, can also be used for fitting the spin dynamics in spin glasses with significant concentration fluctuations.
1. Introduction
Spin glasses possess no long-range magnetic order due to frustrated magnetic interactions and disorder, which leads to stochastically oriented magnetic moments. Typically, phase transitions in spin glasses occur at temperatures below 60 K. In spin glasses, the disorder in the system at high temperatures, which is typically paramagnetic, reappears at low temperatures in a frozen state. Due to the frustration of the magnetic states in the spin glass phase, slow decay processes on large time scales may be observable [1]. Inelastic and quasi-elastic neutron scattering capture an important part of these slow relaxation processes from the picosecond to the nanosecond regime [2,3]. Muon spin relaxation (SR) allows for extending the time scale to 1 s [4]. However, being a local probe SR does not allow for obtaining information on the spatial correlations of the relaxation processes.
Based on the neutron scattering data, Pickup et al. suggested a generalized spin glass relaxation process [5] by connecting the probabilistic Weron model [6] and a model that describes highly disordered systems on the basis of Lévy-stable distributions, firstly introduced by Tsallis [7]. Pickup used this model to describe successfully the relaxation processes in the diluted spin glass systems AuFe and CuMn [5]. In this way, it was shown that processes in spin glasses are similar to those in other complex disordered systems. In a few spin glass systems, the so-called cluster spin glasses, clusters of magnetic order coexist with the magnetic amorphous spin glass phase [8]. However, only little is known about the relaxation processes in these cluster spin glasses.
In this contribution, we study the relation between microstructure leading to magnetically ordered clusters and the averaged spin relaxation in an Fe-Cr sample, which shows a temperature driven phase transition to a cluster spin glass (SG) phase. For this purpose, we combine two complementary high resolution methods, namely the atomically resolved atom probe tomography (APT) [9,10,11] and the high resolution neutron (resonance) spin echo spectroscopy (N(R)SE). Additionally, magnetization measurements complete the characterization of the specimen.
Atom probe tomography (ATP) measurements show that nanometer sized Cr rich regions coexist next to Fe rich regions. These may result in magnetically ordered clusters even in the spin glass phase. The shown results support the assumption that the Weron model introduced by Pickup et al. [5] for diluted spin glasses like AuFe and CuMn still works for spin glasses with inhomogeneities in the microstructure, if some of the parameters are restricted; however, the physical interpretation of the results may differ. The model will be explained in detail below. It is shown that even small scale inhomogenities in the microstructure may change the overall relaxation processes of spin glasses significantly. The relaxation process is then governed by different contributions of hierarchically ordered cluster interactions and parallel spin interactions compared to diluted spin glasses.
2. Experimental Details
For this study, an Fe-Cr alloy with a nominal composition of and at.% was used. The sample was prepared from starting materials with a purity of 99.99%, arc melted, annealed for four days at 1100 C and quenched in water. To relax the occurring strains, the sample was annealed at 1000 C for one day. The cylindrical sample has a height of approximately 20 mm and a diameter of about 10 mm. Atom probe tomography revealed an averaged chemical composition of and at.%. The concentration of impurities from the production process is approximately 0.01 at.% and thus neglectable. The phase diagram of the Fe-Cr-system is given by Burke et al. [12]. Based on the found chemical composition and , the material is supposed to show no magnetic order and to transfer directly from the paramagnetic regime to the spin glass phase.
The alternating current (AC) susceptibility measurements were performed using a Quantum Design physical property measurement system (PPMS). An excitation amplitude of 1 mT with an excitation frequency between 10 Hz and 10 kHz was used.
The relaxation measurements were carried out on the neutron (resonance) spin echo spectrometers RESEDA (REsonance Spin Echo spectrometer for Diverse Applications) [13] and J-NSE (Jülich Neutron Spin Echo spectrometer) [14] at the neutron source FRM II (Forschungs-Reaktor München II). The wavelength chosen was 5.5 Å for RESEDA and 5 Å for J-NSE. At RESEDA, a range of spin echo times from approx. 0.05 ns to 1 ns was accessible. With J-NSE, the range could be extended to 10 ns. The -dependence of the polarization P of the neutrons was independent of the momentum transfer q. Thus, to improve measurement statistics, the experimental results are averaged for q values between Å Å. The intermediate scattering function was determined for temperatures 12.1, 14.5, 19.4, 25.1, 30.1 and 34.2 K. After correcting the data for depolarization by the sample and the spectrometer at the different temperatures, the data sets are normalized to the intermediate scattering function as measured at K, where the dynamics appear to be frozen on the time scales achieved by the spectrometers.
The atom probe tomography measurements were carried out with a Cameca LEAP 4000X HR system from Cameca (CAMECA, Madison, WI, USA) located at the Karlsruhe Nano Micro Facility (KNMF). The atom probe tips were prepared by means of a focused ion beam with a Strata 400 system (ThermoFisher Scientific, Hillsboro, OR, USA). The atom probe tips were measured in the voltage mode with a pulse rate of 200 kHz and a pulse fraction of 20% at a temperature of about 55.8 K. Analysis and reconstruction of the data was done with the IVAS 6.8.10 software package from Cameca [15].
3. Generalized Spin Glass Relaxation Model Based on Weron
In the Weron model [6] the fractal character of the spin glass is described by the exponent , whereas k is a measure for the contribution of hierarchical parallel and thus independent relaxation processes. Combined with the relaxation time , the generalized relaxation function based on the Weron model is given by
In the Tsallis model [7], the sum of the entropy of two independent processes is larger or smaller than the direct sum of their entropies. The difference is scaled with the non-extensivity parameter . Brouers and Sotolongo-Costa [16] showed that there is a direct relation between the Tsallis and the Weron model when k is replaced by . The application to spin glasses will be shortly described in the following and is explained in greater detail by Pickup et al. [5]. Generally, the dynamics in a system slows down with decreasing temperature. This statement also applies for spin glasses. Thus, the lifetime of relaxation processes, , must increase with decreasing temperature. For the temperature limit , must apply.
Above the spin glass transition temperature, , spin–spin interactions are dominant. In the Weron model, this fact is expressed by a relatively large value of (). Because the inter-cluster interactions are suppressed in the regime above , the value of k will be small. For high temperatures, where relaxation processes are dominated by thermal activation, and , i.e., the Weron model describes a pure exponential decay. For decreasing temperatures, the spins are slowed down (until they are frozen) and the contribution of parallel, independent relaxation processes increases: the value of k increases, while decreases. If all relaxation processes occur in single spin clusters, which do not interact with each other, k converges to infinity. In this limit, applies.
4. Results
The AC susceptibility measurements shown in Figure 1 demonstrate that the sample exhibits a temperature driven spin glass (SG) phase transition near K. This value is consistent with results shown by Burke et al. for an iron concentration of at.% [12]. As expected from the chemical composition, there is no clear phase transition from the paramagnetic (PM) to a magnetically ordered phase for temperatures between 50 and 200 K in the AC susceptibility measurements.
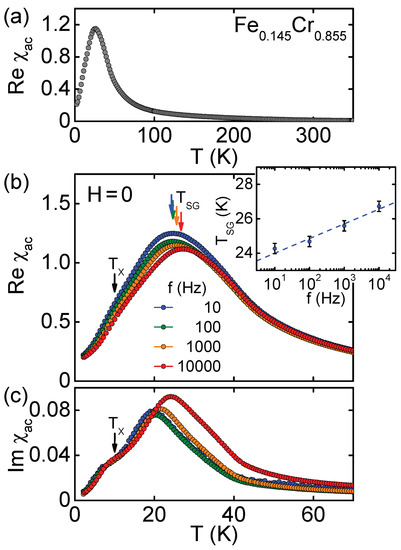
Figure 1.
Temperature dependence of the alternating current (AC) susceptibility of the studied sample. (a) real part of the AC susceptibility between 2 K and 350 K measured at 911 Hz. The absolute value is large, when compared with a typical antiferromagnetic compound; (b) real part of the AC susceptibility, Re , as measured at low temperatures for excitation frequencies between 10 Hz and 10 kHz. As depicted in the inset and characteristic for a spin glass, the position of the maximum at shifts clearly as a function of the excitation frequency; (c) imaginary part of the AC susceptibility, Im , at low temperatures. A change of slope at K in Re and, in particular, in Im suggests the presence of an additional transition, which is not captured in the neutron data and will not be considered further.
Figure 2a shows the reconstructed APT with the elements Fe and Cr. The black box represents the area ( nm, length × height) in which the 2D concentration maps of Fe and Cr are shown after integration of the concentration along the depth (2.5 mm) of the sample. The resulting 2D concentration maps of Cr, Fe and Cr + Fe, as analyzed by the software IVAS [15] are shown in Figure 2b–d). Impurities in the material, such as N and C from the production process and Ga from the FIB cut of the atom probe tip are locally far less than 0.05 at.%.
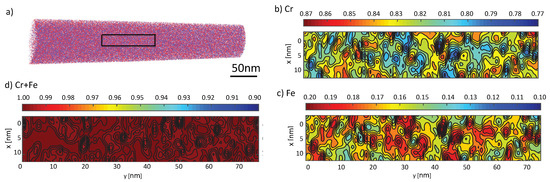
Figure 2.
(a) Atom probe reconstruction of the Fe-Cr alloy, measured at 50 K. The black box marks the area were the data for the 2D concentration maps (b,c) are taken from. Clearly visible are small clusters of Cr and Fe, respectively. The concentration distribution is integrated over a sample slice with a thickness of 2.5 nm; (d) shows the summation of (b,c), which should sum up to 100%. The small differences of less than 1% are caused by impurities such as P, N, and Ga.
Figure 3 shows the intermediate scattering function versus the relaxation time as measured at RESEDA and J-NSE together with fits to the Weron model given by Equation (1). It is clearly seen that the spin fluctuations freeze with decreasing temperature T. For the fitting procedure, the following two obvious assumptions were made: (i) . Of course, above in the paramagnetic (PM) phase. Therefore, can only decrease with decreasing T. (ii) has to monotonically increase with decreasing T due to freezing. If the parameter k was not restricted, it increased with decreasing T, as one would expect because more and more independent relaxation processes can contribute to the dynamics. However, decreased, which contradicts the physical intuition (dashed lines in Figure 4). Meaningful fits, i.e., a decreasing , was only obtained if k was constrained to a constant value for all . The exact value was hard to determine and was found to be . All values led to a physically meaningful decrease of with decreasing temperature.
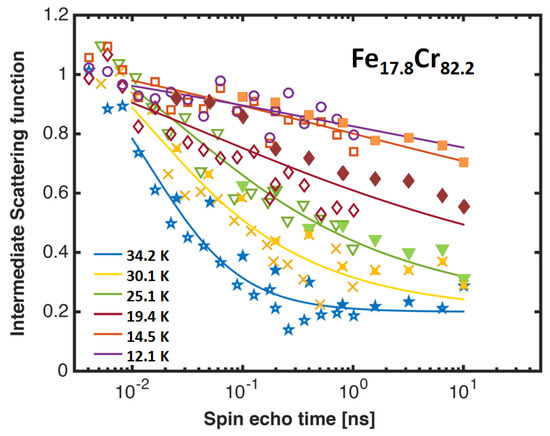
Figure 3.
Intermediate scattering function as measured by neutron (resonance) spin echo at RESEDA (open symbols) and at J-NSE (filled symbols) for Å. The solid lines show the restricted Weron model fitted to the experimental data (symbols) assuming for . The error bars of the individual data points are given in Table 1. The parameters of the fit are shown in Figure 4.
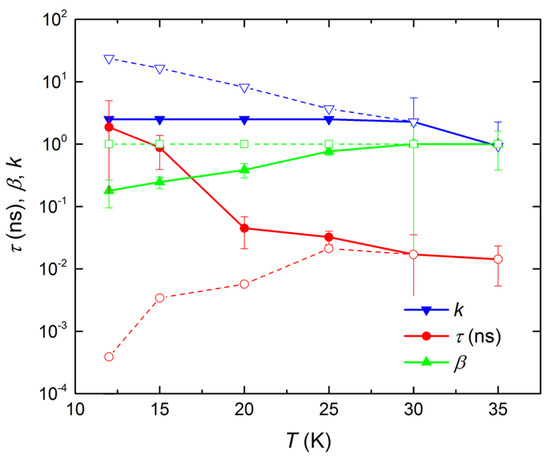
Figure 4.
Parameters , and k analysed by a fit of the Weron function to the intermediate scattering functions observed for different temperatures by neutron (resonance) spin echo spectroscopy (N(R)SE) measurements with no restrictions except (dashed lines and open symbols) and with restrictions (i) , (ii) constantly increasing with decreasing T and (iii) for K (solid lines and closed symbols). The error bars for the non-restricted fits (not shown) are very large because the parameters are strongly correlated.
Of course, the exact values of the fit parameters depend strongly on the chosen value of k, thus exact values of the fit parameters cannot be extracted. The following discussion is based on fit results obtained with a constant for K. Figure 4 shows the resulting temperature dependence for k, and with the restriction (solid lines and closed symbols) compared to fit results with no boundary conditions except (dashed lines with open symbols). Table 1 shows all values of the intermediate scattering function dependent on the spin echo times for all temperatures, so that the fit values might be reproduced by interested readers.

Table 1.
Spin echo time and values of the intermediate scattering function (/error) for all measured temperatures ( K). The data from RESEDA covers spin-echo times in the range ns (roman font). The data from J-NSE extends the spin-echo times to approximately 10 ns (slanted font). The data overlap between approximately 0.1 ns and 1 ns.
5. Discussion
The spin glass transition temperature K as measured by means of AC susceptibility and neutron scattering are consistent with each other. For N(R)SE, the transition might be identified due to the observation that the time dependence becomes more exponential with increasing temperature. K is also consistent with the value given by Burke et al. [12] for an iron concentration of at.%. The susceptibility measurements show that there is no other phase transition for , indicating that there is no magnetically ordered phase in the material (Figure 1). A change of slope at K in Re and, in particular in Im suggests the presence of an additional transition, which shows no signature in the neutron scattering data and will not be considered further.
The atom probe tomography studies clearly show that Fe rich regions coexist with Cr rich regions in the material (Figure 2). In those zones, the concentration of Fe may be high or low enough that ferromagnetic (FM) or antiferromagnetic (AFM) ordering will be observed. According to Burke et al. [12], an Fe concentration of about 19 at% for FM ordering and of 16 at% for AFM ordering is necessary for temperatures lower than ∼50 K. Figure 2 shows that those values are reached locally over a length scale of approximately 2–5 nm.
According to Burke et al. [12] and Fincher and Shapiro et al. [17,18], the Néel temperature for concentrations of of 14 at.% is supposed to be K. The Curie temperature for at.% is K. Thus, with decreasing T, a change in polarization and intensity of the neutron signal around Å is expected as follows: approaching from high temperatures will initiate the formation of ferromagnetic clusters, which reduces the polarization of the scattered neutrons. Decreasing T further towards leads to the formation of antiferromagnetic ordering in regions surrounding the ferromagnetically ordered regions. Thus, the size of the ferromagnetic clusters decreases, resulting in an increase in polarization. Lowering T further favors the spin glass phase, thus shrinking the regions of both ferromagnetic and antiferromagnetic phase further, thus leading to a continuing increase of intensity and polarization with decreasing T.
Indeed, these trends can be qualitatively observed in the neutron scattering data. Figure 5 shows the neutron polarization and the intensity of the neutrons at Å with decreasing T. The polarization decreases with decreasing T, reaches a minimum around 120 K and increases again. The deviation from the expected minimum around 80 K may be due to the volume averaging and q-weighting by the neutrons. Overall, an increase in neutron intensity is observed as expected.

Figure 5.
Temperature dependence of the intensity (blue) and the polarization (orange) as measured at Å at RESEDA. The data are recorded during the course of cooling down the sample. Data recorded during heating up the sample give similar results (not shown), thus hysteresis effects do not play a role.
To put our results in a more quantitative basis, we estimate the size of the ferromagnetic clusters using the expression for the polarization of the neutrons derived by Halpern and Holstein [19] in the limit of small fields and domains. P is a function of the gyromagnetic ratio kHz/Gauss, the magnetic field B, the domain size of the ferromagnetic clusters , the effective sample thickness for iron , and the velocity of the neutrons v. The velocity of neutrons with a wavelength of Å is m/s. For the magnetization of the Fe clusters, we assumed the bulk magnetization of Fe T [20]. With mm mm an approximate cluster size of ∼200 Å for temperatures between 250 K and 120 K is obtained. For the final polarization measured in our experiment (about 28%) at 8 K, this assumption corresponds to a size of the ferromagnetic clusters of Å. This is still considerably larger than the regions of high Fe concentrations in the APT analysis, which scale to 2–5 nm. However, the conclusion, which can be drawn from APT and N(R)SE is similar: in regions of high Fe concentration, the ferromagnetic order might still be present, even if those regions are surrounded by pure spin glass phase. The same holds true for the regions of high Cr concentration, where the antiferromagnetic ordering might still be present. Both phenomena lead to islands of magnetic ordering in the spin glass phase.
Based on the above discussion, the results of the N(R)SE experiments can be interpreted as follows: for the sample is magnetically ordered in locally restricted areas as indicated by the ATP-data, leading to a maximum value and a minimal value of k, as seen in Figure 4. Regions of magnetic fluctuations are present, but their parallel hierarchical relaxation processes have only a small weight when compared to the spin-fluctuations within the ordered clusters. With decreasing T, the volume fraction of the sample, where the spin fluctuations slow down increases and thus the contribution of the parallel relaxation processes increases due to the decreasing size of magnetically ordered clusters. The value of k increases, while decreases. In diluted spin glasses, k is supposed to diverge to infinity () because relaxation processes on all time scales occur. In our sample, however, the value of k converges to a constant value (Figure 4). The value of k is constrained because of the limited number of parallel processes due to the remaining clusters, which are directly observed by ATP and indicated by the finite polarization of the neutrons at low T.
Figure 6 shows a comparison of the results obtained from the diluted spin glass systems AuFe and CuMn as studied by Pickup [5] and the results of our work. The major difference between the two data sets below reflects the different mechanisms taking place during the spin freezing. Whereas in diluted spin glasses all spins are frozen in random orientations, in the Fe-Cr system ferromagnetic and antiferromagnetic clusters coexist within a sea of disordered spin glass phase. Therefore, the hierarchical order of relaxation processes changes from only parallel relaxation processes to spin-spin and parallel relaxation processes. Since our study already showed the complementation of scattering methods and atom probe tomography, the further investigations must concentrate on the study of the short range order of Fe-Cr alloys dependent on the found clusters. Here, special emphasis will be laid on the influence of the heat treatment of the material on both the phase transition and the short range order in the spin glass phase, because Fe-Cr alloys are known for their clustering and spinodal decomposition [21]. In addition, the phase transition at K needs further attention to be fully identified.
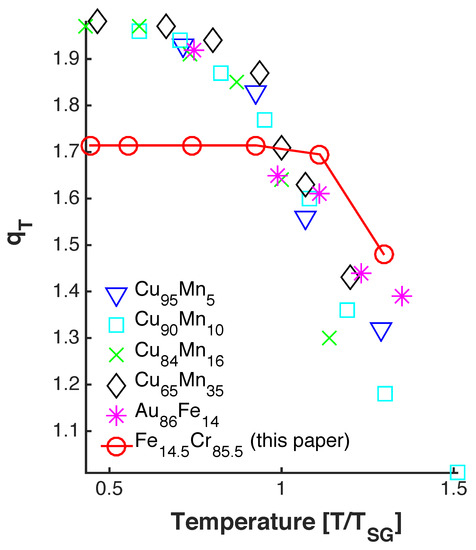
Figure 6.
Comparison between data published by Pickup [5] on diluted spin glasses AuFe and CuMn and the results observed in the present study on the cluster spin glass FeCr.
6. Conclusions
By combining atomically resolved (APT) with quasielastic neutron scattering using N(R)SE, we have characterized the evolution of the spin glass phase in the presence of ferro- and antiferromagnetic clusters in the cluster spin glass FeCr. The measured data can be interpreted in terms of the Weron model [6] that assumes the decay of spin fluctuations in parallel processes in the presence of magnetically ordered clusters. The finite value of the k-parameter indicates that the number of parallel processes in the cluster spin glass FeCr is limited. We speculate that cluster-type spin glasses may generally be classified based on the value of the parameter k that is a measure for the number of parallel processes at low T.
Author Contributions
J.N.W. was the leading scientist for experiments (neutrons and APT), analysis and interpretation of the data; W.H. and O.H. were responsible for RESEDA and N(R)SE, respectively, supported before, during and after the neutron experiments, discussed analysis and interpretation of the data; A.B. conducted the AC susceptibility measurements and interpreted them; S.M.S. provided the sample material; P.B. supported all steps of the experiment, the interpretation of the data and improved the paper. All authors reviewed the manuscript.
Funding
The work at Brookhaven was supported by the Office of Basic Energy Sciences, Division of Materials Science and Engineering, U.S. Department of Energy (DOE) under Contract No. DEAC02-98CH10886.
Acknowledgments
We thank the FRM II for providing beam time at the neutron resonance spin echo spectrometer RESEDA and the JCNS for providing beam time at the spectrometer J-NSE.
Conflicts of Interest
The authors declare no conflict of interest. The founding sponsors had no role in the design of the study; in the collection, analyses, or interpretation of data; in the writing of the manuscript, and in the decision to publish the results.
Abbreviations
The following abbreviations are used in this manuscript:
| APT | atom probe tomography |
| FRM II | Forschungs Reaktor München II (research neutron source Heinz Maier-Leibnitz) |
| FWHM | full width at half maximum |
| ISF | intermediate scattering function |
| J-NSE | Jülich Neutron Spin Echo spectrometer |
| KNMF | Karlsruhe Nano Micro Facility |
| N(R)SE | neutron (resonance) spin echo |
| NSE | neutron spin echo |
| PM | paramagnetic |
| PPMS | physical property measurement system |
| RESEDA | REsonance Spin Echo spectrometer for Diverse Applications |
| RF | radio frequency |
| SET | spin echo time |
| SG | spin glass |
References
- Ramirez, A.P. Strongly geometrically frustrated magnets. Annu. Rev. Mater. Sci. 1994, 24, 453–480. [Google Scholar] [CrossRef]
- Bao, W.; Raymond, S.; Shapiro, S.M.; Motoya, K.; Fåk, B.; Erwin, R.W. Unconventional Ferromagnetic and Spin-Glass States of the Reentrant Spin Glass Fe0.7Al0.3. Phys. Rev. Lett. 1999, 82, 4711–4714. [Google Scholar] [CrossRef]
- Murani, A.P.; Tholence, J.L. Spin Dynamics of a Binary Alloy (Spin Glass). Solid State Commun. 1977, 22, 25–28. [Google Scholar] [CrossRef]
- Uemura, Y.J.; Yamazaki, T.; Harshman, D.R.; Senba, M.; Ansaldo, E.J. Muon-spin relaxation in AuFe and CuMn spin glasses. Phys. Rev. B 1985, 31, 546–563. [Google Scholar] [CrossRef]
- Pickup, R.M.; Cywinski, R.; Pappas, C.; Farago, B.; Fouquet, P. Generalized Spin-Glass Relaxation. Phys. Rev. Lett. 2009, 102, 097202. [Google Scholar] [CrossRef] [PubMed]
- Weron, K. How to obtain the universal response law in the Jonscher screened hopping model for dielectric relaxation. J. Phys. Condens. Matter 1991, 3, 231–233. [Google Scholar] [CrossRef]
- Tsallis, C.; Levy, S.V.F.; Souza, A.M.C.; Maynard, R. Statistical-Mechanical Foundation of the Ubiquity of Lévy Distributions in Nature. Phys. Rev. Lett. 1995, 75, 3589–3593. [Google Scholar] [CrossRef] [PubMed]
- Gabay, M.; Toulouse, G. Coexistence of Spin-Glass and Ferromagnetic Orderings. Phys. Rev. Lett. 1981, 47, 201–204. [Google Scholar] [CrossRef]
- Gault, B.; Moody, M.P.; Cairney, J.M.; Ringer, S.P. Atom Probe Microscopy; Springer: New York, NY, USA, 2012; ISBN 978-1-4614-3436-8. [Google Scholar]
- Larson, D.J.; Prosa, T.J.; Ulfig, R.M.; Geiser, B.P.; Kelly, T.F. Local Electrode Atom Probe Tomography; Springer: New York, NY, USA, 2013; ISBN 978-1-4614-8721-0. [Google Scholar]
- Miller, M.K. Atom Probe Tomography; Springer: Boston, MA, USA, 2014; ISBN 978-1-4615-4281-0. [Google Scholar]
- Burke, S.K.; Cywinski, R.; Davis, J.R.; Rainford, B.D. The evolution of magnetic order in CrFe alloys. II. Onset of ferromagnetism. J. Phys. F 1983, 13, 451–470. [Google Scholar] [CrossRef]
- Häussler, W.; Böni, P.; Klein, M.; Schmidt, C.J.; Schmidt, U.; Groitl, F.; Kindervater, J. Detection of high frequency intensity oscillations at RESEDA using the CASCADE detector. Rev. Sci. Instrum. 2011, 82, 045101. [Google Scholar] [CrossRef]
- Holderer, O.; Monkenbusch, M.; Schätzler, R.; Kleines, H.; Westerhausen, W.; Richter, D. The JCNS neutron spin-echo spectrometer J-NSE at the FRM II. Meas. Sci. Technol. 2008, 19, 034022. [Google Scholar] [CrossRef]
- IVAS-Software. Available online: https://www.cameca.com/service/software/ivas (accessed on 20 November 2018).
- Brouers, F.; Sotolongo-Costa, O. Universal relaxation in nonextensive systems. Europhys. Lett. 2003, 62, 808–814. [Google Scholar] [CrossRef]
- Fincher, C.R., Jr.; Shapiro, S.M.; Palumbo, A.H.; Parks, R.D. Spin-Wave Evolution Crossing From the Ferromagnetic to Spin-Glass Regime of FexCr1−x. Phys. Rev. Lett. 1980, 45, 474–477. [Google Scholar] [CrossRef]
- Shapiro, S.M.; Fincher, C.R., Jr.; Palumbo, A.C.; Parks, R.D. Anomalous spin-wave behavior in the magnetic alloy FexCr1−x. Phys. Rev. B 1981, 24, 6661–6674. [Google Scholar] [CrossRef]
- Halpern, O.; Holstein, T. On the Passage of Neutrons Through Ferromagnets. Phys. Rev. 1941, 59, 960–981. [Google Scholar] [CrossRef]
- Kittel, C. Einführung in die Festkörperphysik; Oldenbourg Verlag: München, Germany, 2002. [Google Scholar]
- Miller, M.K.; Hyde, J.M.; Hetherington, M.G.; Cerezo, A.; Smith, G.D.W.; Elliott, C.M. Spinodal Decomposition in Fe-Cr Alloys: Experimental Study at the Atomic Level and Comparison with computer Models—I. Introduction and Methology. Acta Metall. Mater. 1995, 43, 3385–3401. [Google Scholar] [CrossRef]
© 2018 by the authors. Licensee MDPI, Basel, Switzerland. This article is an open access article distributed under the terms and conditions of the Creative Commons Attribution (CC BY) license (http://creativecommons.org/licenses/by/4.0/).