Article

Application of Laser-Induced Breakdown Spectroscopy for Quantitative Analysis of the Chemical Composition of Historical Lead Silicate Glasses

1
School of Photonics, ITMO University, St. Petersburg 199034, Russia
2
Department of Scientific and Technological Expertise, Architectural Archaeology Department, The State Hermitage Museum, St. Petersburg 190000, Russia
3
Scientific Center “Diagnostic Systems”, B. I. Stepanov Institute of Physics, 220072 Minsk, Belarus
*
Author to whom correspondence should be addressed.
Quantum Beam Sci. 2023, 7(3), 24; https://doi.org/10.3390/qubs7030024
Submission received: 18 April 2023 / Revised: 9 June 2023 / Accepted: 27 July 2023 / Published: 2 August 2023
(This article belongs to the Special Issue Quantum Beam Science: Feature Papers 2023)

Abstract

:
The study of the chemical composition of historical glasses is widely used in archaeometry. The results of such analyses provide information on the probable date, place, and technological features of their production. Over time, a weathered layer may form on the surface of the glass, which differs in composition from the original one. To determine the initial composition using conventional methods (for example, X-ray fluorescence spectroscopy), the weathered layer should be removed. For historical objects, such manipulation is unacceptable and should be minimized. One of the methods for analyzing the chemical composition with minimal damage to a sample is laser-induced breakdown spectroscopy. The aim of this work was to develop a LIBS method, which makes it possible to perform a quantitative analysis of lead silicate glasses, including glasses containing a weathered layer. Reference glasses with a variable content of potassium, silicon, and lead oxides were synthesized, and based on the LIBS spectra, a calibration dependence was obtained that made it possible to measure the concentration of lead and potassium oxides in glasses within 70–85 and 5–20 wt%, respectively. The method was applied to analyze the composition of the glaze on a historic glazed tile from the burial church in the Euphrosinian monastery in Polotsk (the second half of the 12th century AD). The crater formed with the laser beam on the glazed surface was about 200 microns. Such damage is negligible compared to the total surface area of the tile (~10 cm2). The thickness of the weathered glaze layer was 70 microns, which was determined using variation in lead oxide content.

1. Introduction

The appearance of glass production dates to the fourth millennium BC. After mixing quartz sand with plant ash and heating it to a temperature of about 1000–1200 °C, glass can be obtained. The development of synthesis technology has led to the production of lead glasses other than alkali silicate glasses. The first use of lead glass as a glaze in Rome and ancient China (Han period China) can be dated to the first century BC to the first century AD [1]. In the Middle Ages (9–13th centuries AD), lead glass was widely used in Europe. A wide range of items made from this type of glass: bracelets, rings, and beads, as well as glass vessels and tesserae [2,3]. For example, based on analyses of the chemical composition of Roman and Late Antique glasses from primary workshops, Freestone identified several features of glass compositions. These features made it possible to localize the time and place of glass production [4]. In work [5], an analysis of the chemical composition of glass products made it possible to investigate the distribution of Egyptian glass in the territories of the Islamic caliphates (685–1020 CE). Similar work was carried out to identify local features of the composition of Carthaginian glass (4–7th centuries AD) [6] and glass from Central Europe (12–15th centuries AD [7]).
Chemical analysis of glazed ceramics makes it possible to investigate the technology of its production as well as trade and production links between the place of production and consumption of ceramics. For example, based on glaze and ceramic compositional profiles, it was shown [8] that pre-fritted lead glasses were used as glaze materials in tin-lead Hispano-Moresque pottery and that the ceramics were unfired prior to glazing. On the contrary, for Roman lead glazes, it was more typical to use fired ceramics and lead oxide or a mixture of SiO2 and PbO in the production of glazes [9]. In work [10], the relationship between the technologies for the production of white and yellow glazed ceramics in the Middle East and Central Asia (8–10th centuries AD) was studied.
Such studies are usually carried out on cross-sectioned samples, the selection of such samples is not always possible in the case of historical samples. The LIBS method can be used to build a profile of the concentration of chemical elements in depth. For example, in work [11], profiles were built in the depth of copper coins from the 18th century that were subjected to various types of corrosion. It was shown that after 10–15 pulses, the concentration of iron in the coins increased and did not change with a larger number of pulses. And to remove the patina from bronze objects, 50 pulses were required, and a layer of the order of 350 microns was removed [12].
Lead silicate glass was the typical chemical composition in the territory of Ancient Rus in the 10–13th centuries AD. Since the 12th century AD, lead–potassium silicate glass (K2O content of more than 10 wt%) has been used to produce jewelry and mosaics [13,14]. Also, at the same time, lead-glazed ceramic tiles were widely used for flooring in Orthodox churches [15]. Most of the churches were destroyed during the Mongol conquest (1237–1242 AD) and exist now in a ruined form. Over time, under the influence of external factors (humidity, fires, and being in the ground), glass pieces begin to weather. In this case, the glass surface cracks, and its composition changes since some of the components (for example, alkalis) react with water and are removed from the glass. Subsequently, the thickness of the iridescent layer increases because cracks allow water to penetrate the thickness of the glass. In addition, when glass is weathered, other products, such as sulfates and carbonates, can form on its surface.
Methods for determining the chemical composition of glasses are widely used to analyze the ratio of various components, which makes it possible to group them according to the place and time of production. The most common methods for studying the chemical composition of various archaeological objects are X-ray fluorescence analysis (XRF) and inductively coupled plasma mass spectroscopy (ICP-MS). However, despite the high accuracy of these methods, they have a significant drawback. With the XRF method, the thickness of the analyzed layer depends on the penetration depth of X-ray radiation, which is about tens of microns for light elements and hundreds of microns for heavy elements. Using ICP-MS, the amount of material evaporated from the surface depends on the state of the substance and its chemical composition and does not exceed tens of micrograms. Thus, without special sample preparation (cross-section), these methods make it possible to analyze only the surface and pre-surface layer of an object. The results of such an analysis may turn out to be incorrect for glasses damaged by corrosion, on which the chemical composition at the surface differs significantly from the initial composition of the glass.
At present, the laser-induced breakdown spectroscopy (LIBS) method is gaining popularity [16]. Simple sample preparation, rapid measurement, and a wide range of detectable elements are the advantages of this method. Currently, there are many articles describing the use of LIBS in cultural heritage [17,18,19,20]. This method has been successfully applied to the in-depth analysis of chemical compositions of samples, as well as for multilayer objects [21,22,23]. This is because part of the material evaporates when a laser pulse is applied to the surface of the sample. Sequential repeated exposure to radiation at one point allows for an analysis of the material from a controlled depth below the surface of the sample.
The only way to solve this problem of layer-by-layer removal of material with minimal intervention is to use the LIBS method. The technical capabilities of the LIBS method allow it to consistently penetrate into the thickness of the product to a fixed depth and track changes in the composition of the material. During the experiment, only microscopic craters are formed on the surface of the glass, which, with a proper selection of measurement conditions, are visually almost indistinguishable. It should be noted that preliminary precision alignment of the micro-target section is not required [24,25,26,27].
The aim of this work is to develop a LIBS method for the quantitative analysis of lead silicate glasses, as well as to determine the thickness of the weathered glass layer. The objectives of this study include the development of a quantitative method for determining lead, silicon, and potassium oxides, determining the rate of dynamics of crater formation on the glass surface, and applying the method to glazed tile.

2. Materials and Methods

For the quantitative calibration of the setup, two series of lead silicate glasses were synthesized. The first series of glass was (100 − x) SiO2-xPbO wt%, where x = 70, 75, 80, and 85, and the second one was 15 SiO2-xPbO-(1 − x) K2O wt%, where x = 65, 70, 75, and 80. Such ratios of chemical components are typical for Ancient Russian glasses from the 10–13th centuries AD [28,29]. Glass samples were obtained using high-temperature synthesis. The synthesis temperature was 1000 °C for 2 h. Synthesis was carried out from high-purity oxides PbO (99.98%), SiO2 (99.99%), and K2CO3 carbonates (99%). The mixture was homogenized for 4 h in a polypropylene spinner. Then, it was poured into porcelain crucibles and placed in an oven. Glass was cast on a metal plate. After that, the casting was annealed in a muffle furnace at a temperature of 350 °C for 6 h. Thus, the two series of glasses were synthesized (Table 1).
The method for the quantitative determination of Pb and K contents was tested on a sample of historical Ancient Russian glazed tile. Glazed green tile was an element used for the floor decoration in the burial church in the Euphrosinian monastery in Polotsk. The monastery was founded by Princess Euphrosyne of Polotsk in 1125. The construction of the church, from which a sample of glazed tile was obtained, is attributed to the first half of the 12th century based on architectural forms. During the excavations in 1961–1964, it was found that in some places, the lower parts of the walls, and in other places, only the foundations, were preserved in the ancient temple. In some areas, even the foundations were destroyed. The central and eastern parts of the church were particularly affected and hidden during the construction of a large cellar. The church was destroyed by a strong fire in the Middle Ages. After that, its eastern part was dismantled, and the rest of the building was repaired with block bricks [30]. A photo of the tile sample is shown in Figure 1. The analyzed areas are marked in the figure.
The LIBS installation used for this experiment is a system consisting of a pulsed laser, focusing optics, fiber optics for collecting emissions, and a computerized spectrometer connected to a detector. An Nd:YAG laser was operated in the Q-switched mode, at 532 nm, delivering pulses of 80 mJ with 12 ns duration. The energy fluctuation from pulse to pulse did not exceed 10%. The laser radiation was focused using an objective into a spot with a diameter of 150 microns to form a plasma. The collimator lens used to collect the plasma signal is made of fused quartz (aperture 5 mm, focal length 15 mm). Plasma was collected at an angle of about 45° with respect to the sample surface. The LIBS measurements were carried out in the 336 to 892 nm spectral window with an acquisition gate of 1 ms duration delayed by 10 µs with respect to the beginning of the laser pulse. The irradiation was performed in air at atmospheric pressure without any preliminary preparation of the sample.
The laser ablation depths were assessed using an optical microscope with reflected light Leica DMRX. The analyses of the glaze surface and chemical composition were performed with a scanning electron microscope Carl Zeiss EVO MA 25 with an EDX detector X-MaxN 80.

3. Results

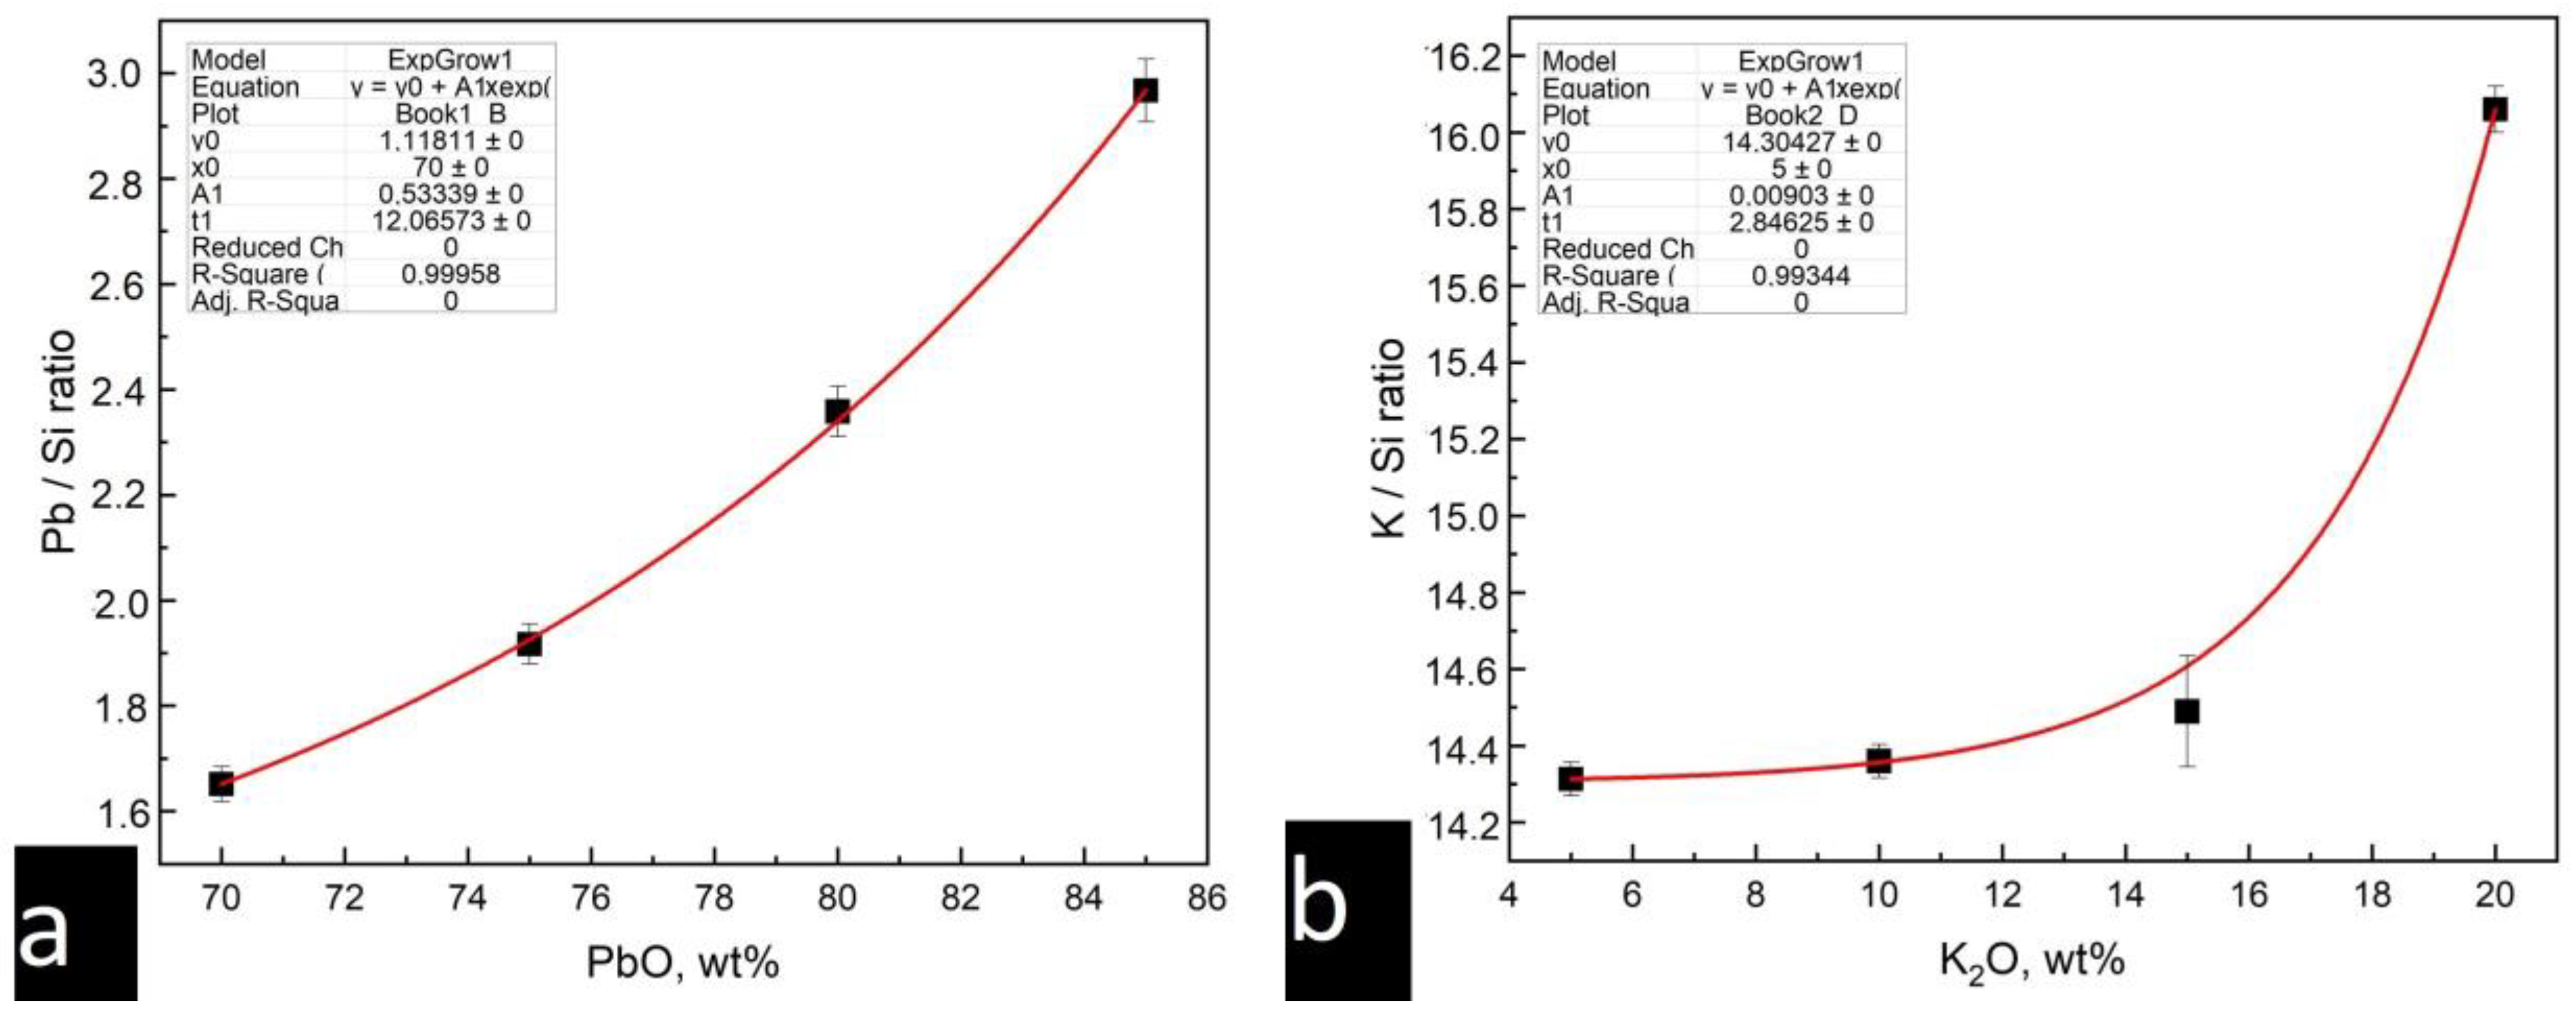
3.1. Construction of Calibration Curves

For the reference glass samples, measurements were carried out using the LIBS method at 10 points of the surface with 200 pulses at each point. A typical emission spectrum for lead silicate glass (Si-Pb series) is shown in the Figure 2.
The Pb (@374.13 nm), Si (@390.45 nm), and K (@422.65 nm) bands were selected to construct the ratios [31]. The full spectrum was deconvoluted into individual bands using the Voigt profile (Figure 3).
The ratios of lead to silicon and potassium to silicon were determined as the ratios of the integral intensities of the bands of the elements (Equations (1) and (2), respectively).
Pb/Si ratio = S_Pb/S_Si,
K/Si ratio = S_K/S_Si,
The integral intensities of the bands were averaged over 2000 measurements. After averaging all values over 2000 spectra for each sample, the areas under the peaks Pb, Si, and K were calculated, and ratios were constructed for the Pb area to the Si area and the K area to the Si area. The LIBS data used for the construction of the calibration curves are shown in Table 2.
Then, the corresponding calibration dependences of the areas under the peaks on the concentration of elements were constructed. The calibration dependencies for the lead silicate and potassium–lead silicate glass types are shown in Figure 4.

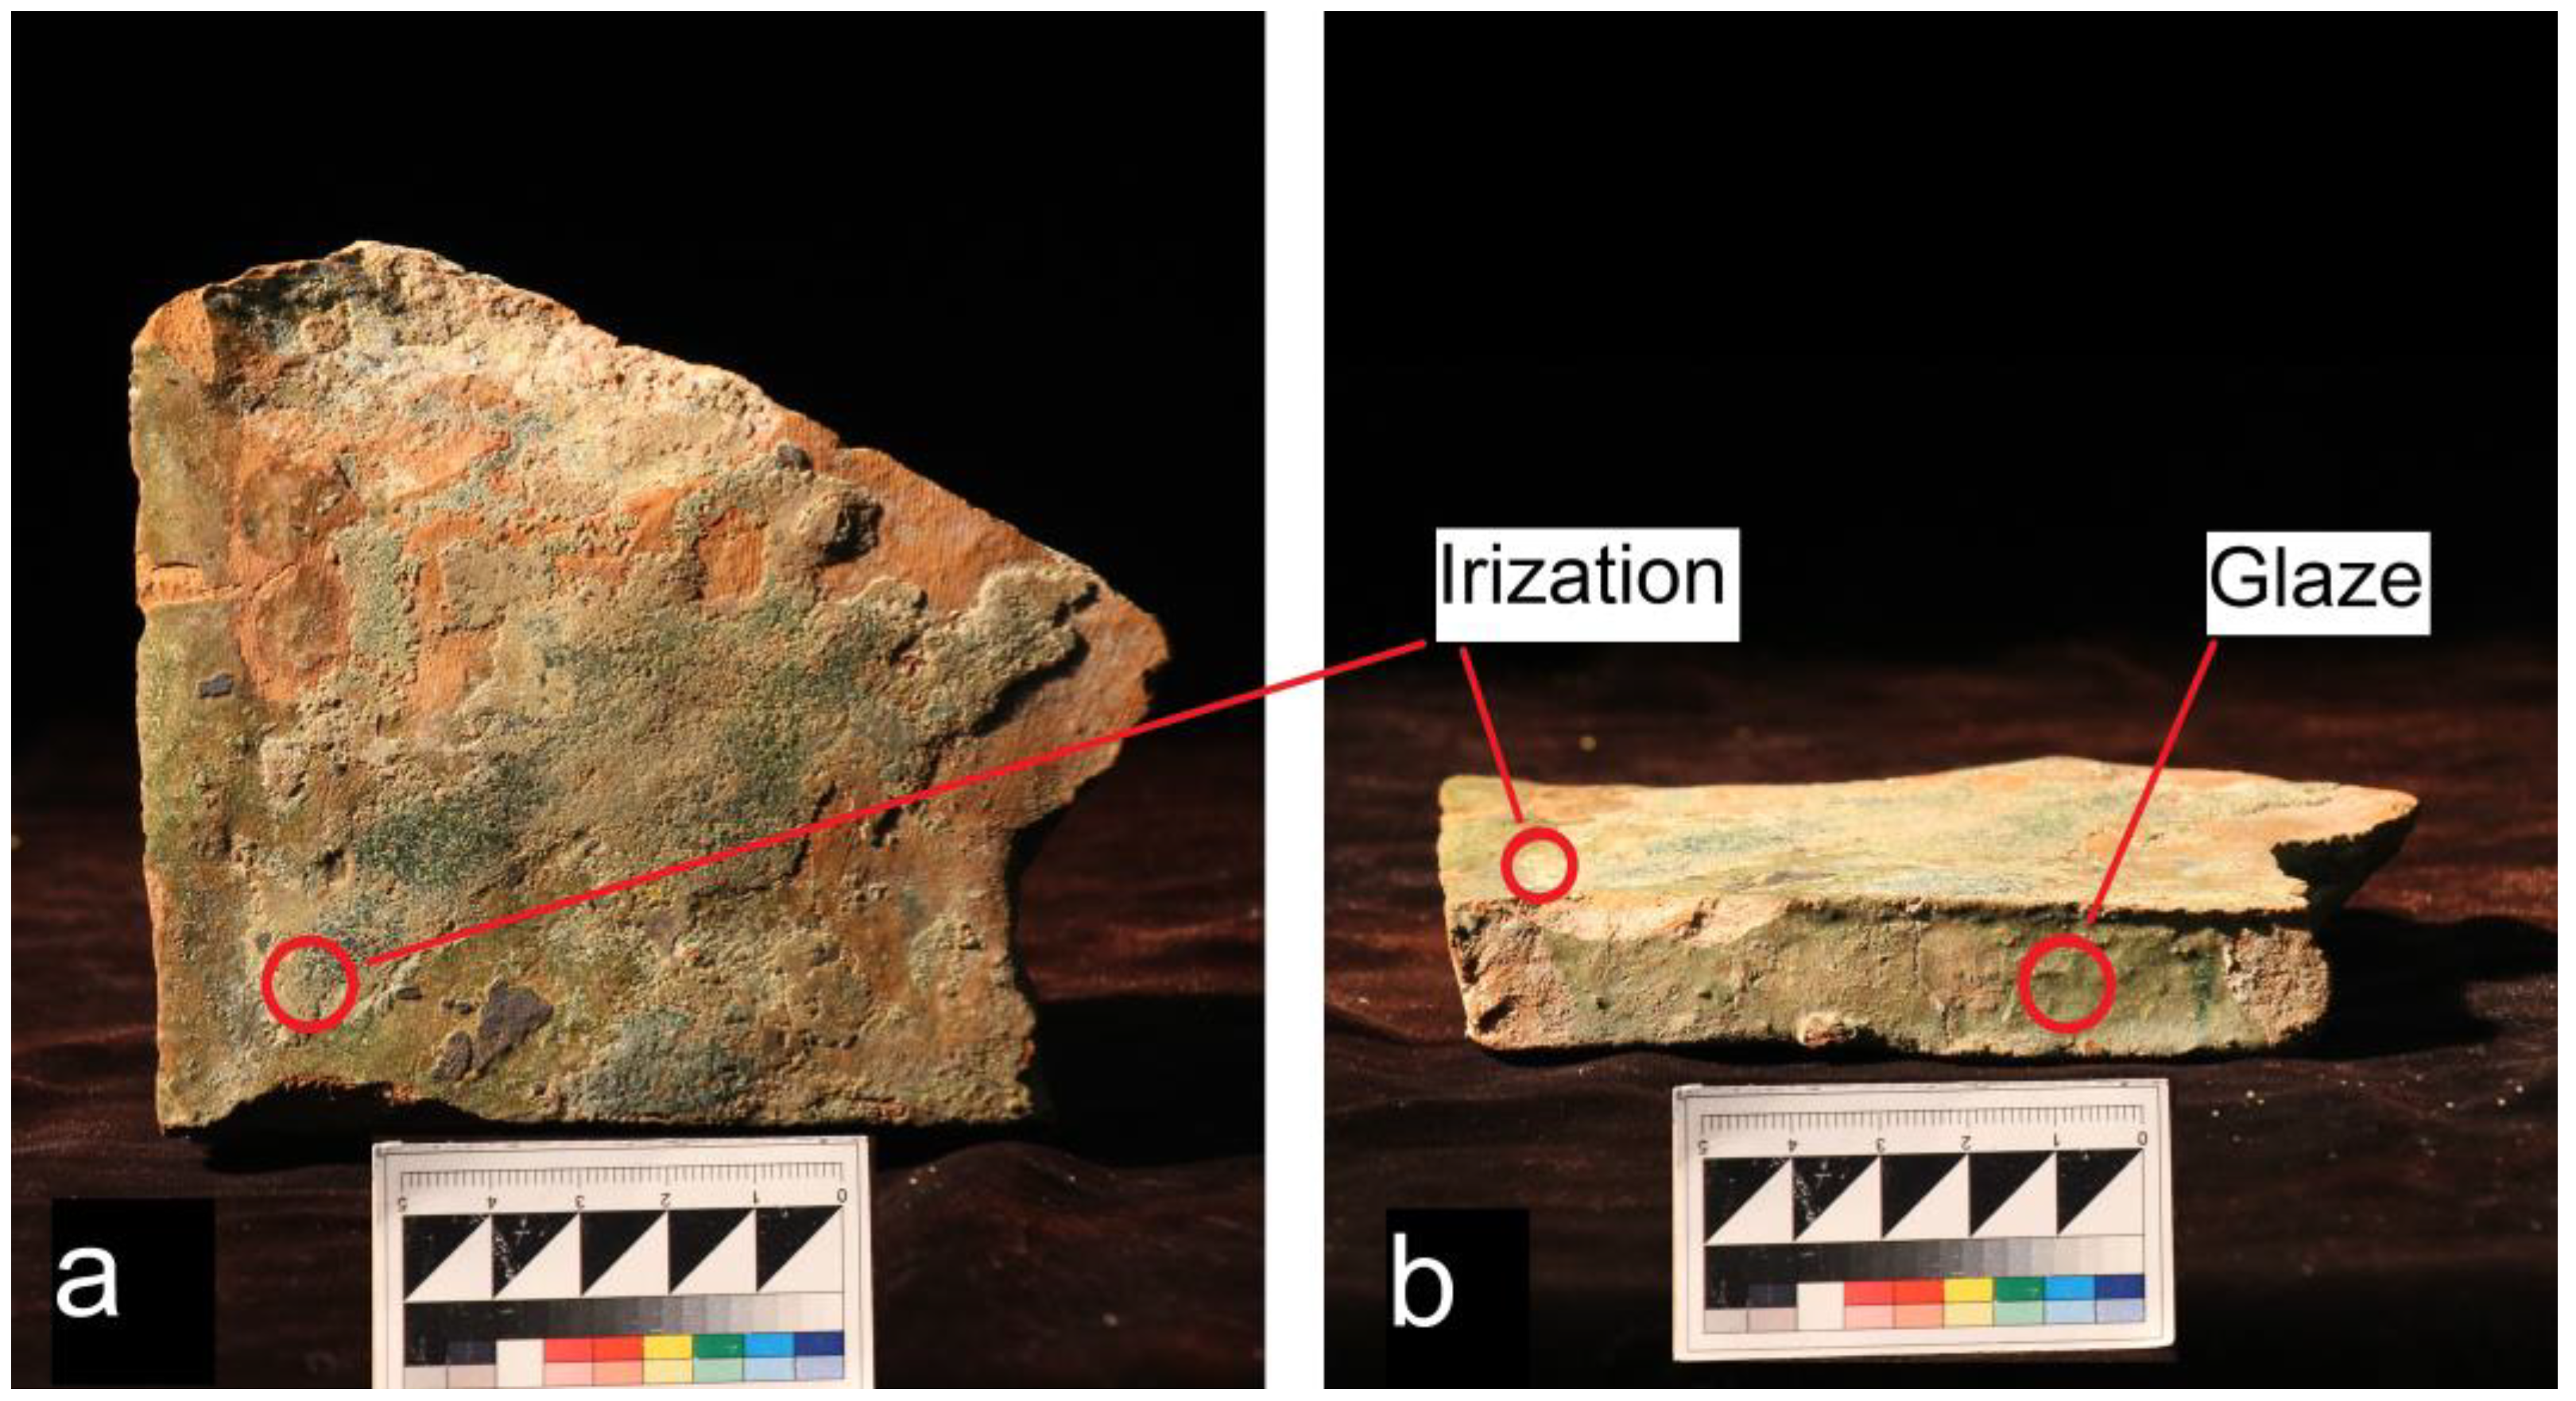
3.2. Testing the Method on Historical Glazed Tile

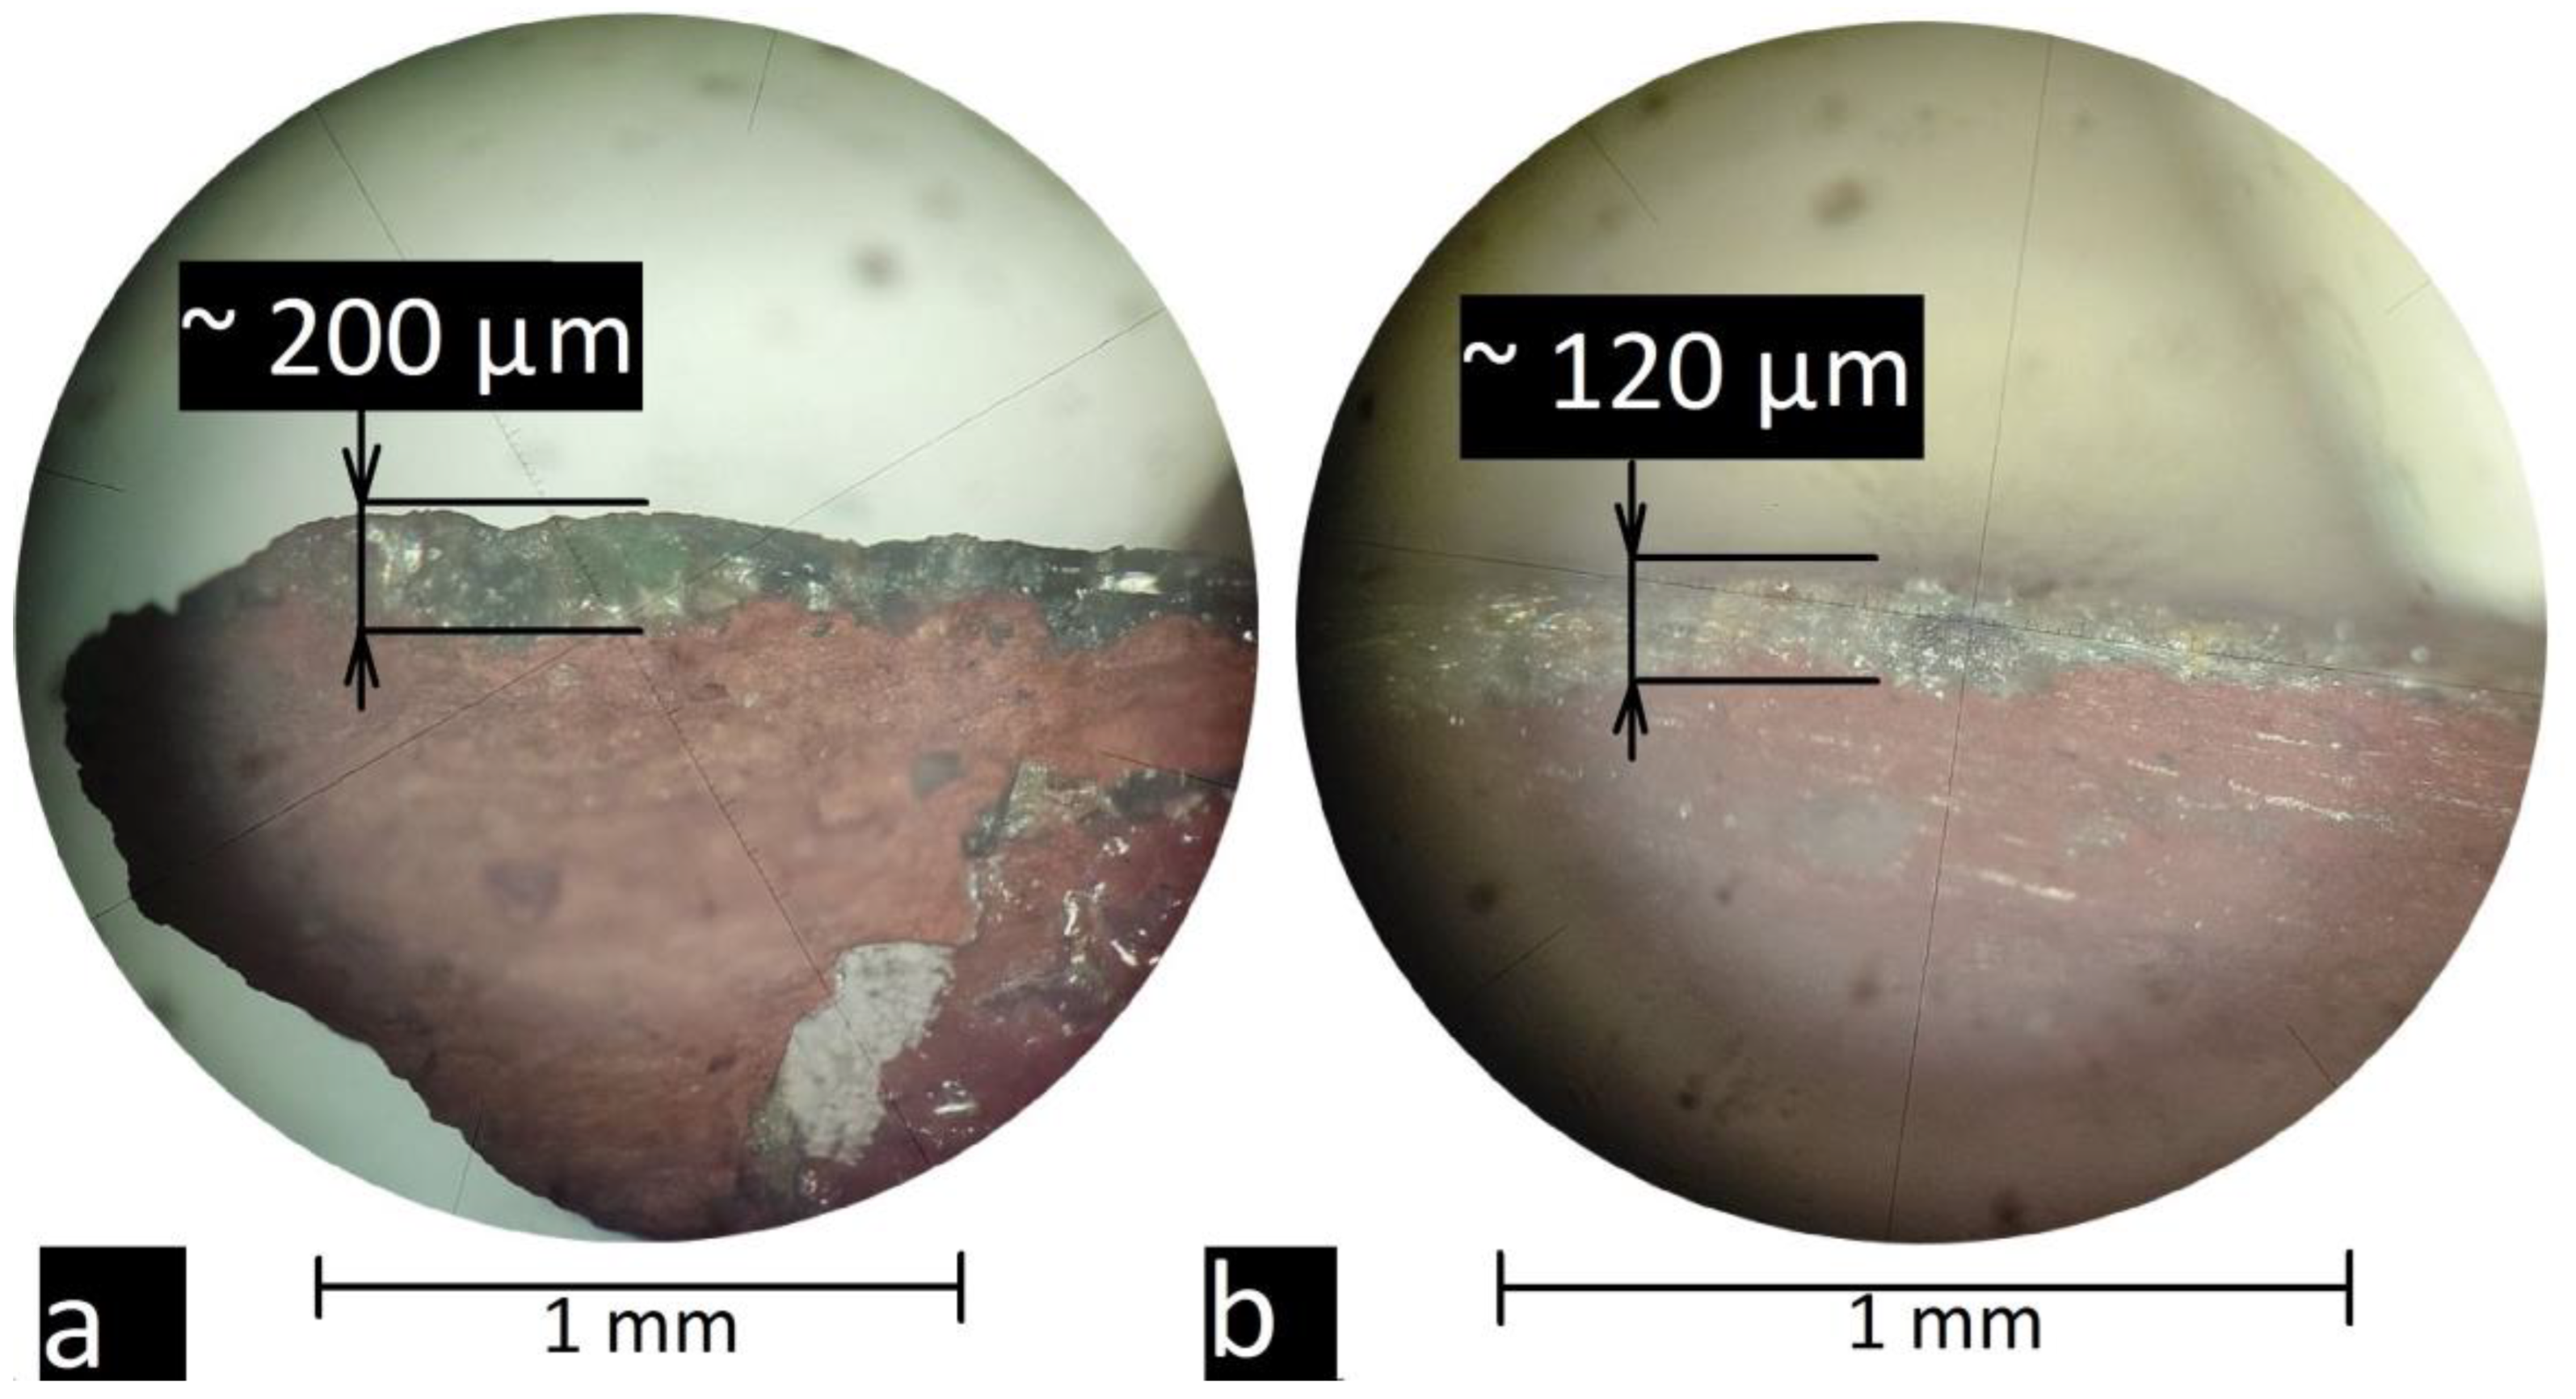
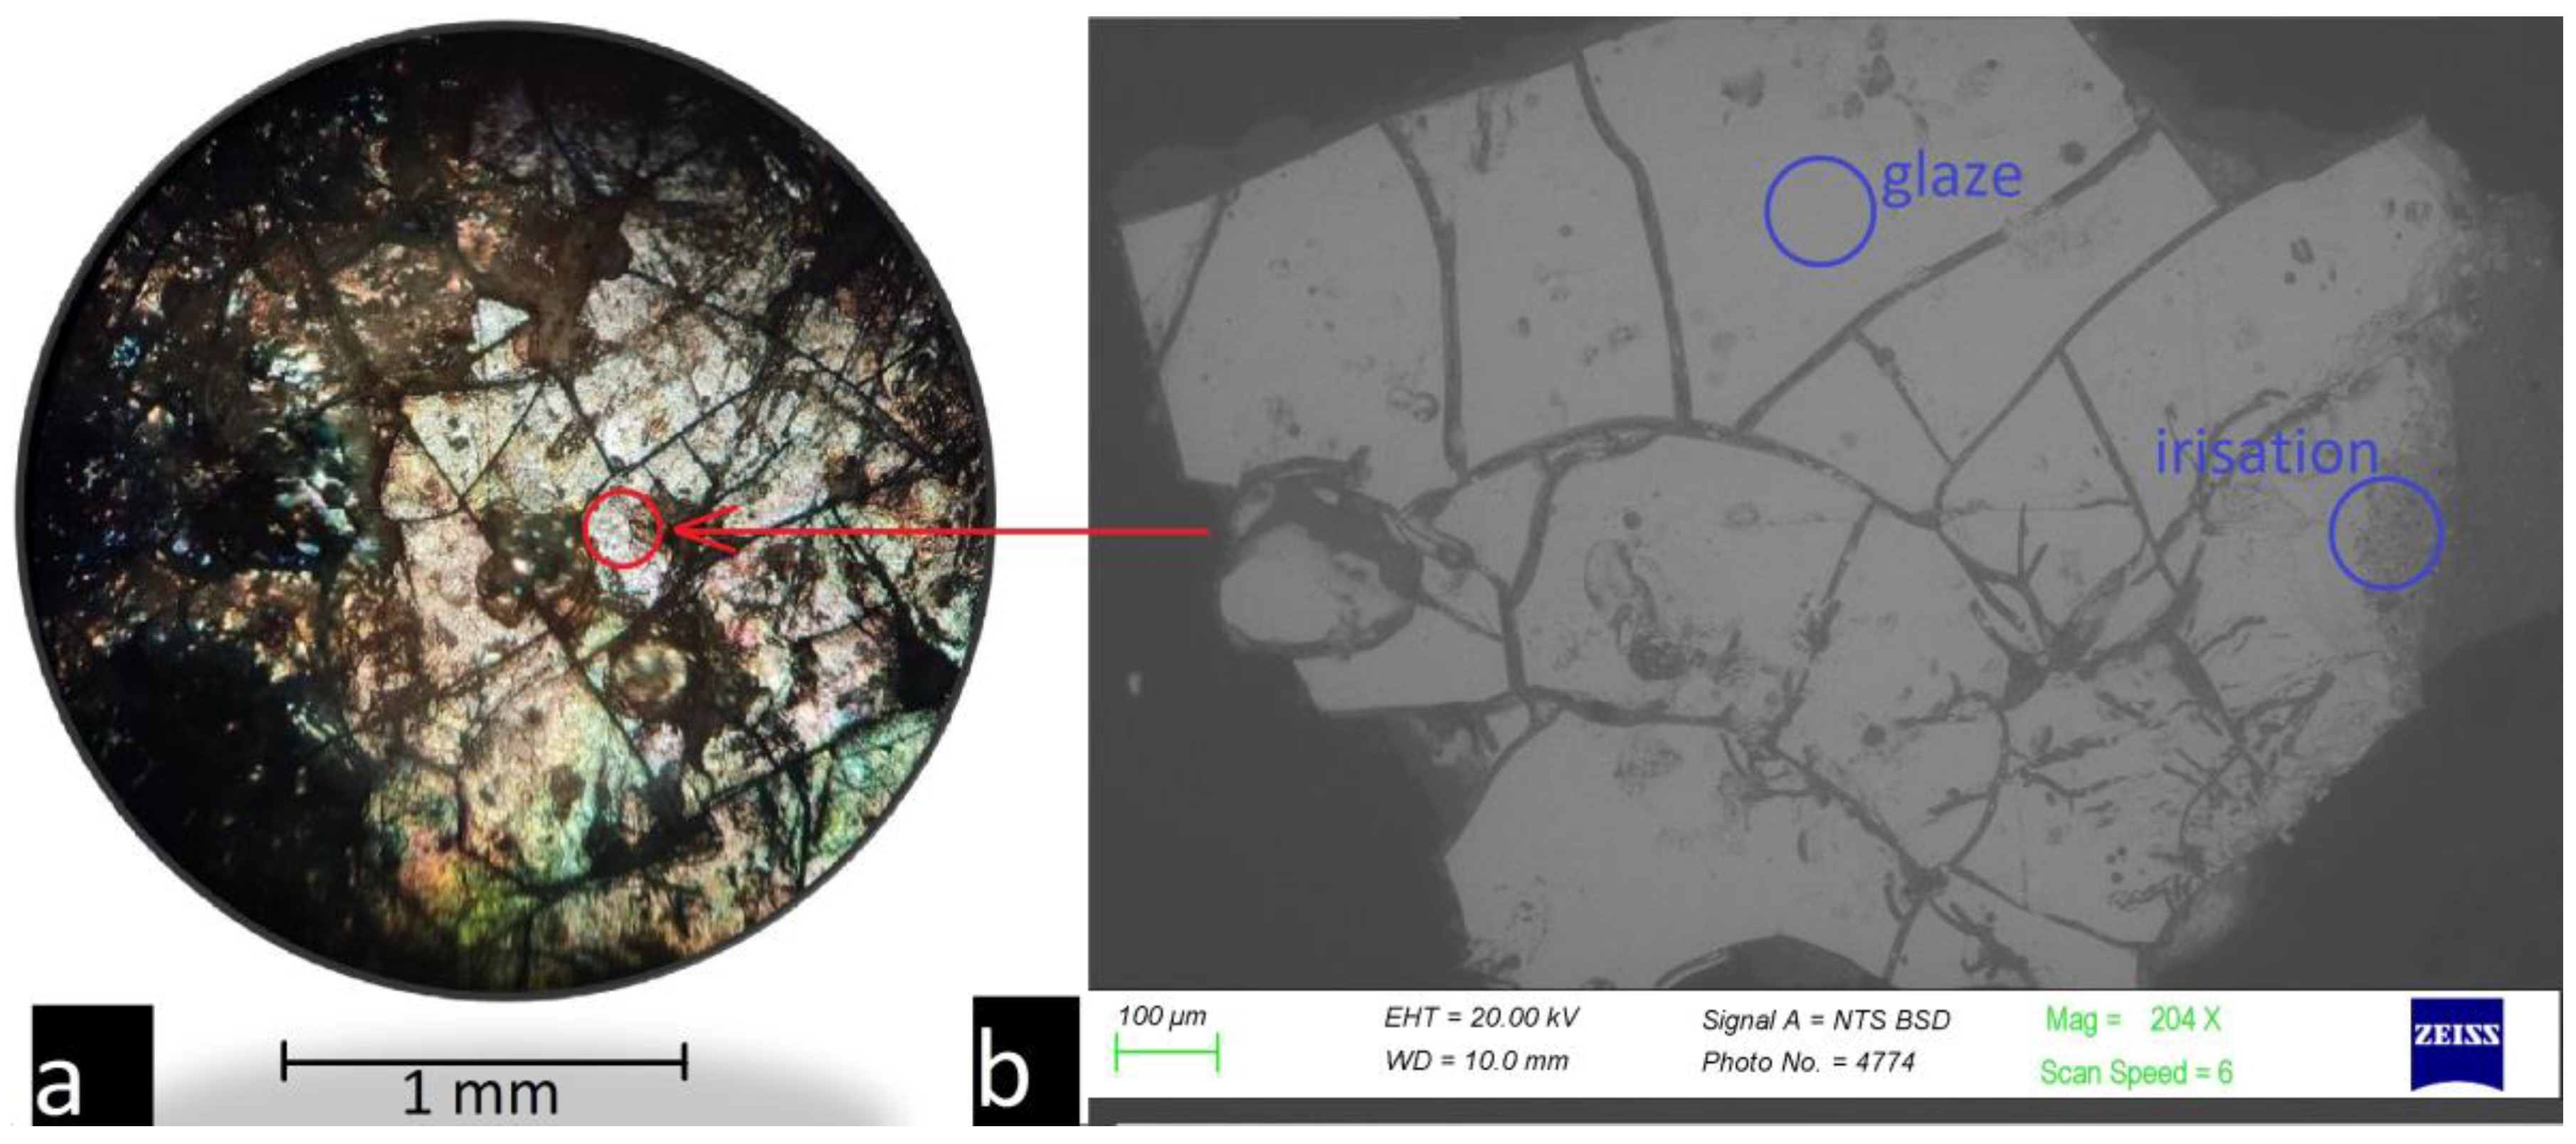
3.2.1. Optical Microscopy Examination

First, the tile surface was examined using optical microscopy and scanning electron microscopy (SEM). The analysis of the surface showed that the glaze layer was partially damaged by the corrosion (irisation) process, but part of the glaze was well preserved. Two points were selected for analysis using the LIBS method: one on the preserved glaze and one on the damaged irised layer. Firstly, the thickness of the glaze and irised layers was determined using an optical microscope. Photos from an optical microscope are shown in Figure 5a,b. It should be noted that the thickness of the glaze layer varied over the entire area of the tile, and the average layer thickness was in the order of 200 μm, but weathering led to a reduction in the thickness of the glaze layer to about 120 μm. The best preservation of the glaze layer was observed on the side surface, which was covered with mortar.

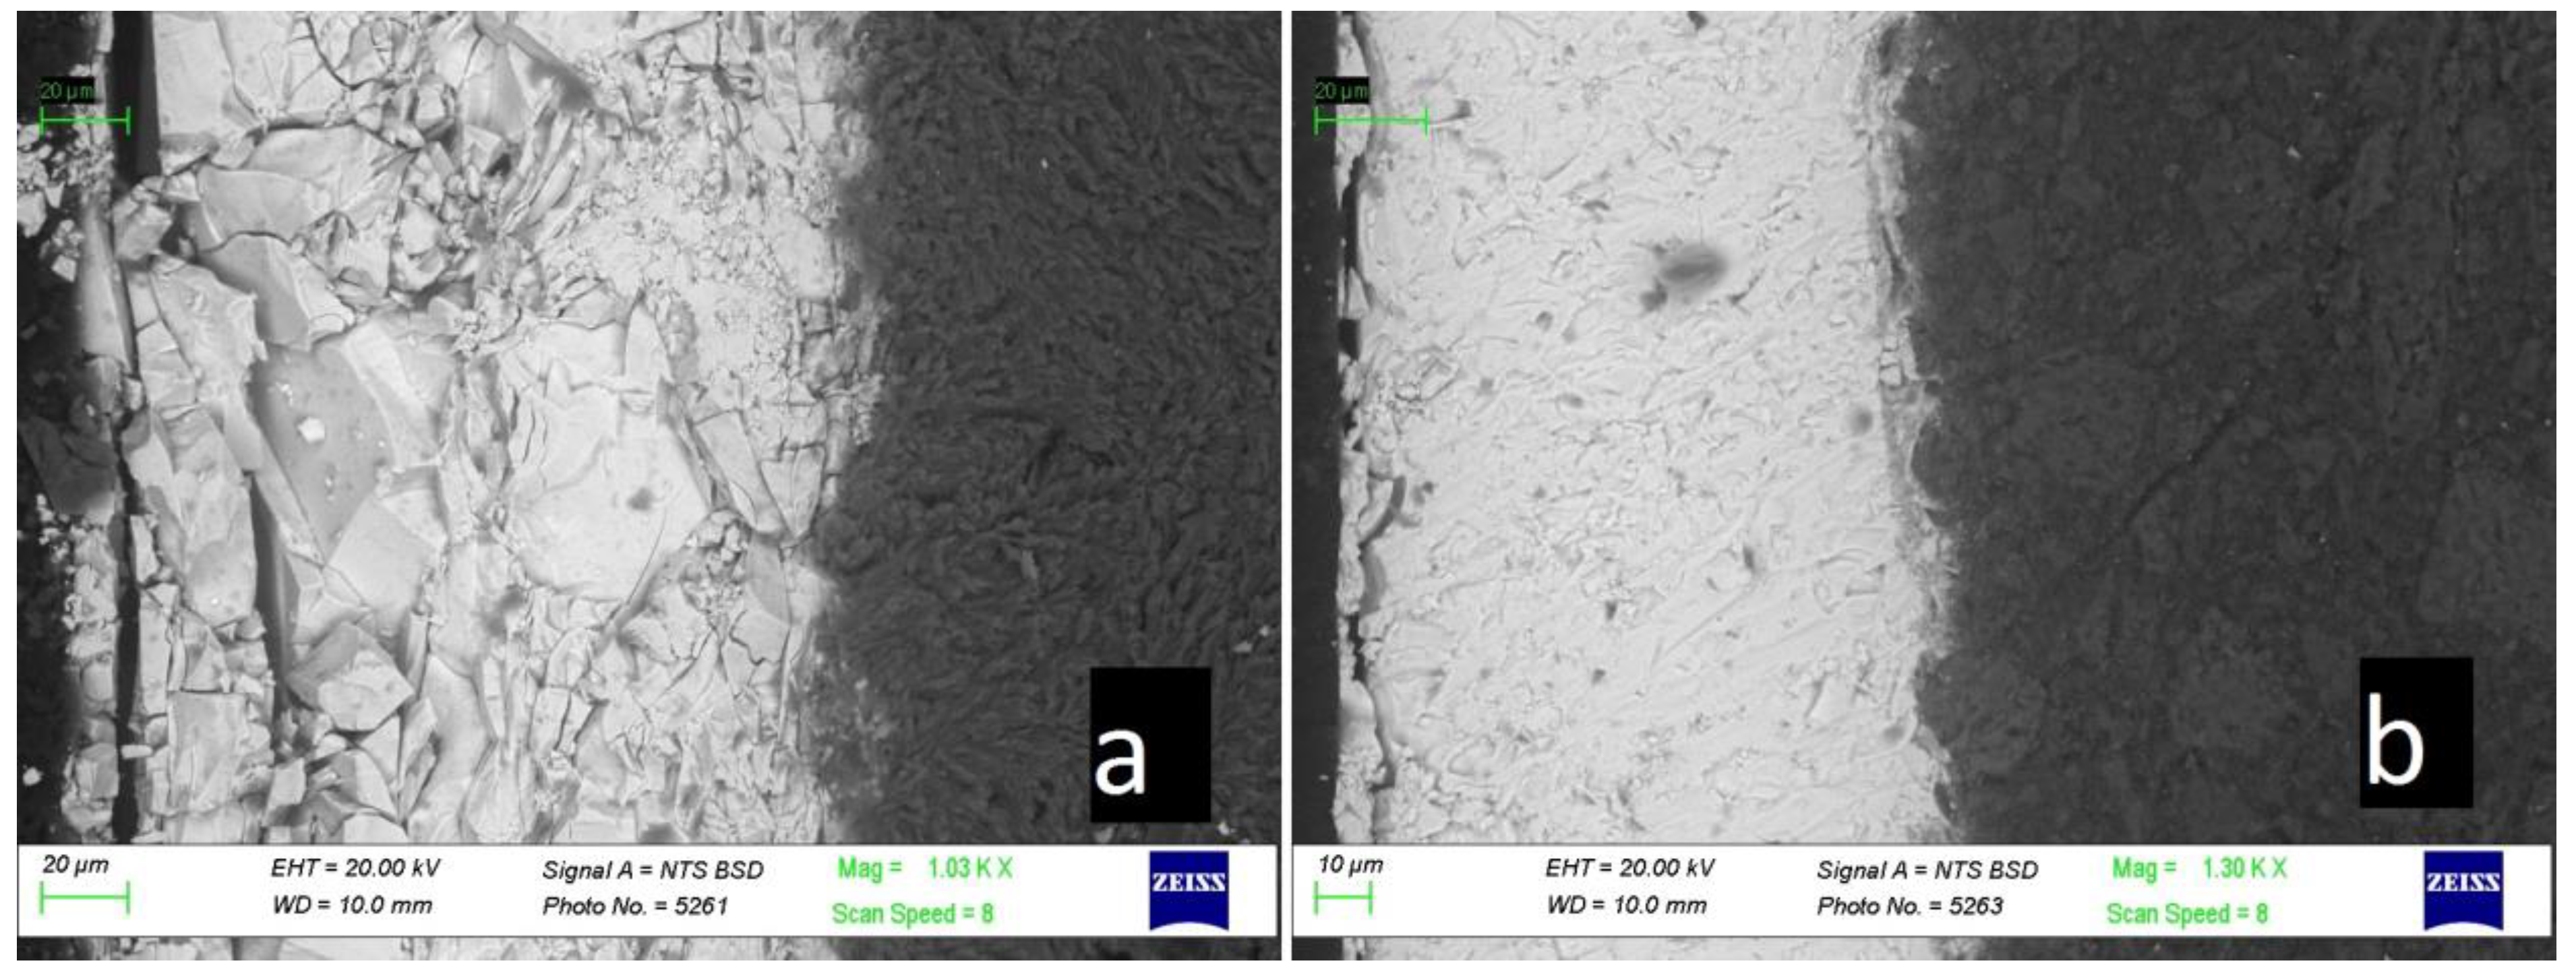
3.2.2. SEM-EDS Analysis

A small fragment obtained from the edge of the glazed tile was examined on the surface and stratigraphically using SEM–EDS. Studying the surface allowed for determining the conservation degree, whereas studying a cross-section of the sample allowed for determining the corrosion layers in depth.
Figure 6 shows the top view of the surface of the glazed tile obtained using an electron and optical microscope.
The glaze layer on the entire surface of the tile is weathered. A large number of cracks, as well as iridescent coloring on parts of the surface, were observed. This coloring is associated with the interference of light on the air gaps in the volume of the glaze layer. We chose two zones—iridized and relatively homogeneous—which were used for XRF and LIBS analysis of the chemical composition. The results for the glaze chemical composition analysis performed using XRF are shown in Table 3.
The X-ray fluorescence analysis (XRF) method has been increasingly used in the study of archaeological objects, including weathered glasses, over the past half-century. The X-ray method is based on the detection of characteristic X-ray radiation arising in the region of interaction between the primary radiation beam and the sample. The energy of the X-rays emitted by the irradiated sample recorded using the detector was converted into a spectrum. The peaks of the spectrum detected at strictly defined energy values characterize the composition of the sample. The X-ray method examined the surface of the sample, where the penetration depth of the primary beam into the sample was about 100 microns. The software in the device provided a quantitative determination of the chemical elements in the sample by comparing the obtained data with reference values. It should be noted that although quantitative determination of the content of alkaline and alkaline earth metals, silicon, aluminum, chlorine, sulfur, and phosphorus is in principle possible within the framework of this method, the existing system of standards does not allow one to directly obtain data on the quantitative proportion of these elements. This causes difficulties in situations where it is necessary to obtain a quantitative composition of the weathered glass layer. Also, this method does not allow for determining the compounds of elements (functional groups) either directly in the thickness of the glass or—first of all—in the damaged layer covering the sample, which is formed as a result of the interaction between the glass surface and the environment (e.g., soil, air, and water).
Figure 7 shows micrographs of a thin cross-section of an Ancient Russian tile sample obtained using a scanning electron microscope.
On the electron microscopic photograph of the studied section of the iridized layer, the peculiar structure of the weathered glass surface is clearly visible: the structure of the glass is lamellar and scaly almost throughout the entire depth of the section (Figure 6a). Figure 6b shows a section of the sample with a homogeneous glaze; in this case, the damaged glaze layer is about 5–10 microns. In the case of iridized glaze, it is not possible to determine the thickness of the corrosion layer using scanning electron microscopy.
According to the results of the XRF analysis, the glaze on the tile is formed by a high-leaded glass (PbO > 80 wt%). The chemical resistance of such glasses is low, and it is also possible that the preservation of the glaze was negatively affected by the impact of the fire, which led to the destruction of the church. Minor components are represented by oxides of potassium, sodium, calcium, aluminum and magnesium, and iron, and their total concentration does not exceed 7 wt%. The green color of the glaze is associated with the presence of bivalent copper, and the concentration of iron oxide is low (%), suggesting that it was introduced into the glass as a pigment. Tin oxide was used as an opacifier; in glass, it forms cassiterite crystals that scatter light. The error in the quantitative determination of the concentration using the LIBS method can be high when the content of the components is low. Since the content of potassium oxide in the glaze layer is significantly less than that of lead oxide, we chose to use the lead/silicon ratio to determine the thickness of the weathered layer. We expected that the increased lead content is associated with the formation of lead oxide during the leaching of the glaze.

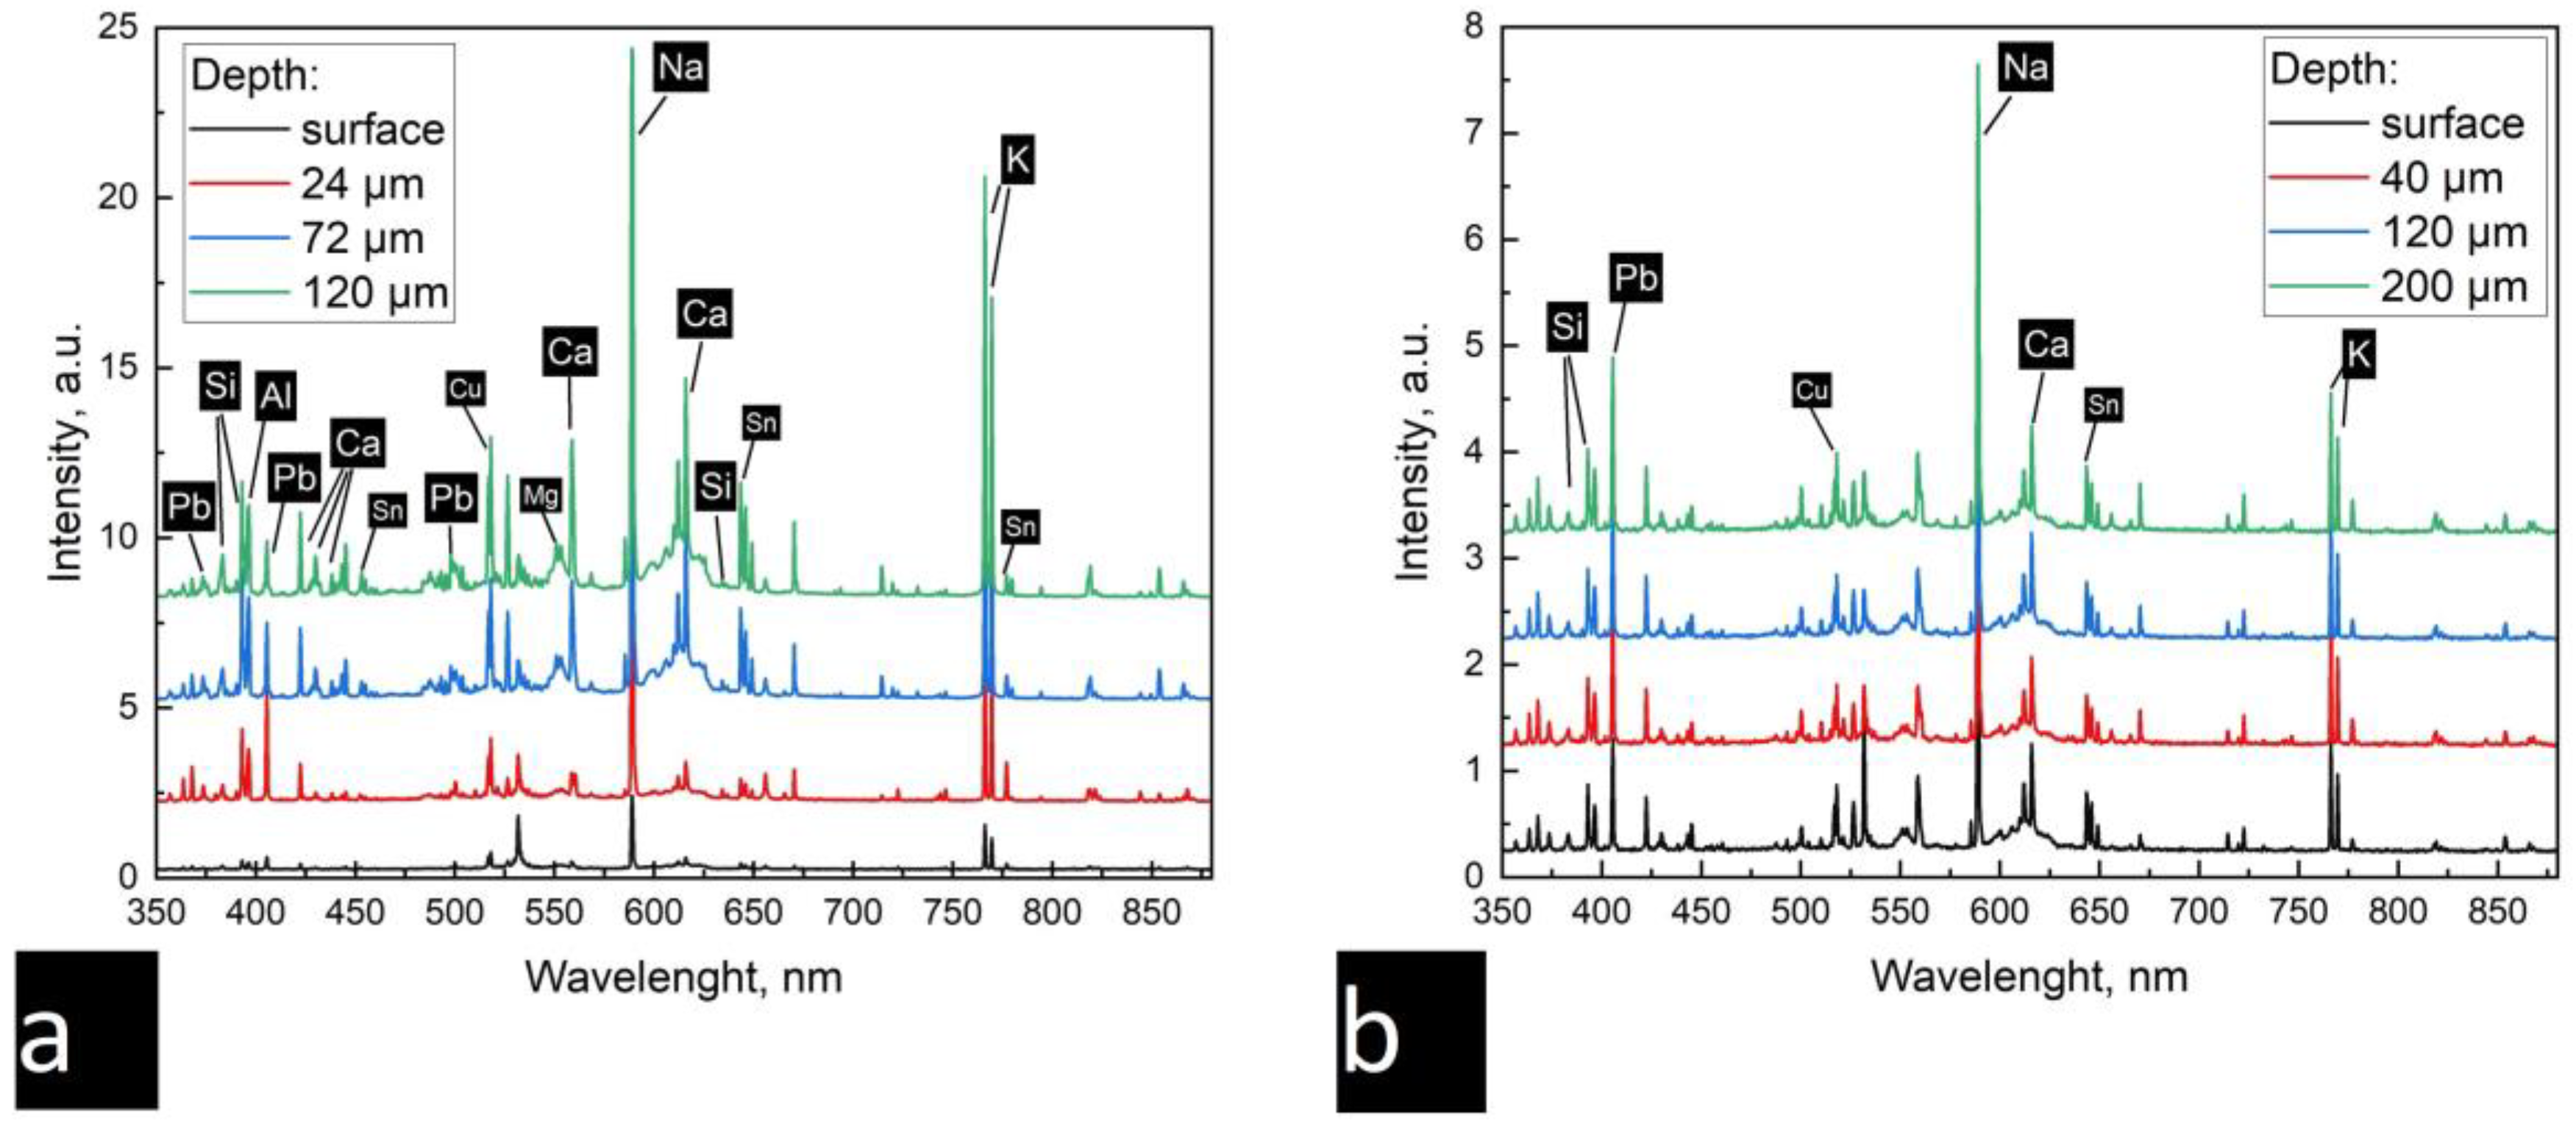
3.2.3. In-Depth Profiling

A LIBS analysis of the homogeneous and weathered surfaces was then carried out (Figure 8a,b, respectively). The LIBS measurements were carried out with 250 pulses at each point.
Peaks corresponding to the major and minor components of the glaze were identified. The chemical elements were identified in accordance with the NIST database: Pb (@405.8 nm), Si (@385.55 nm, 390.54 nm), Ca (@612.2 nm, 616.4 nm), Na (@589.1 nm), and K (@766.5 nm, 769.9 nm). As a result of the interaction between the glaze and the ceramic body, peaks associated with aluminum (@394.38 nm, @396.18 nm) and magnesium (@552.8 nm) were observed in the composition of the glass. Peaks associated with the opacifier and colorant were also evident: Sn (@645.5 nm) and Cu (@510.2 nm), respectively.
It was found that the composition of the preserved glaze does not change depending on the depth (see Figure 7a). The intensities of the bands also showed no significant differences. At the same time, it was observed that the chemical composition of the iridized layer changes from the surface to the deeper layers (see Figure 7b). There are weak streaks of potassium and sodium and traces of lead on the surface. The surface layer contains the decomposition products of the glaze, and from 24 microns, there is a glaze layer.
The intensities of the silicon and lead peaks obtained from different depths allowed us to plot the distribution of PbO over the depth of the glaze layer (Figure 9). The calibration curve used to recalculate peak intensities in concentration is shown in Figure 4a.
For the glaze layer, there is an increase in the PbO content up to 96 wt% in the near-surface layer (about 5 microns). Then, the lead oxide content decreases (82–90 wt%) and remains constant up to 200 microns in depth. Significant changes in the PbO in the iridized layer were observed. On the surface, its concentration is 42 wt%, and then, it gradually decreases to 35 wt%, and at the depth of about 25 microns, it starts to grow sharply. At the depth of 75 microns, the PbO content is 80–85 wt%, which corresponds to the composition of the preserved homogeneous glaze.

4. Discussion

An in-depth LIBS analysis allowed us to identify three areas with different contents of lead oxide in a glaze:
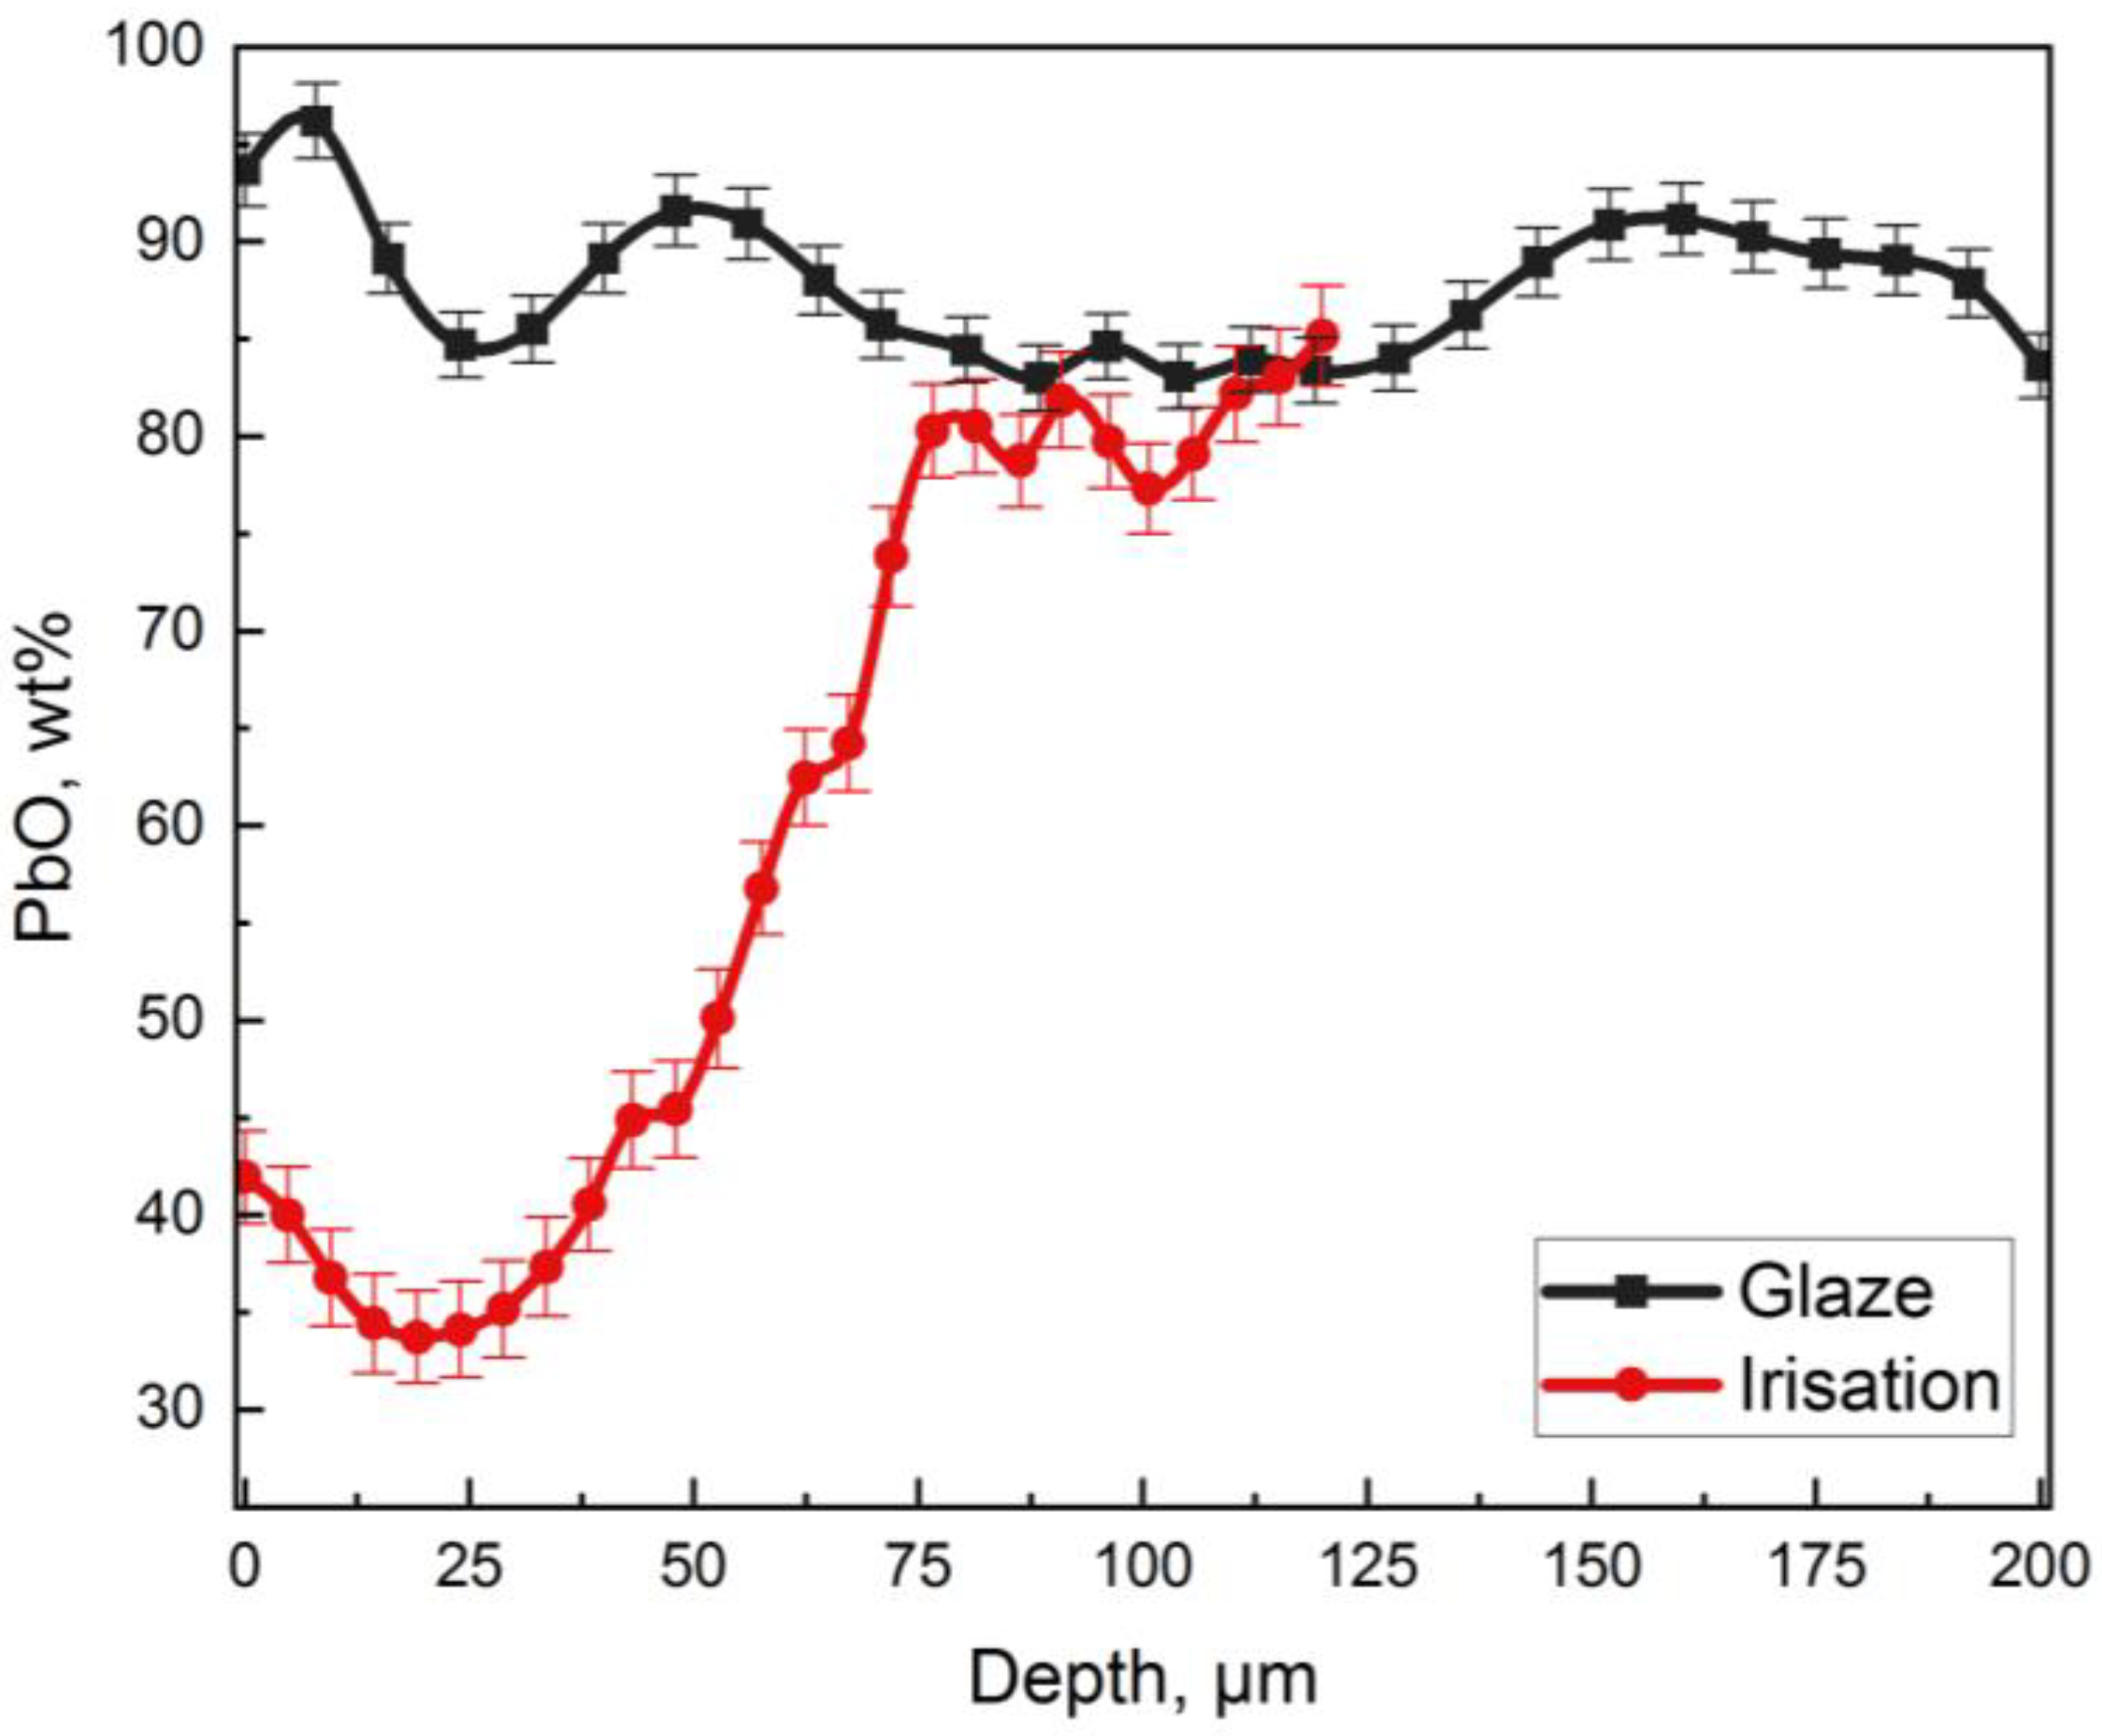
  • The first area, on the order of 5 microns thick, is characterized by an increased content of lead oxide, up to 98 wt%. This area was probably formed by the weathering products of the glaze in the form of pure lead oxide.
  • The second area corresponds to a decrease in the concentration of PbO (85 wt% for the homogeneous glaze and 35 wt% for the iridized layer) to a depth of about 25 microns.
  • The third area is different for the glaze and for irisation layers. In the case of the irisation layer, there is an exponential growth in the PbO contents (from ~35 wt% to 82 wt%). This is due to the diffusion of components from the depth of the layer to the surface. In a homogeneous glaze layer, the concentration of lead practically does not change. Small changes can be explained by the dissolution of silicon from the ceramic body during the glazing process [32]. It should be noted that the difference in the depth of laser penetration in the glaze and in the irisation layer with the same number of pulses is due to the strong evaporation of the irisation layer.

5. Conclusions

We developed a LIBS method for the quantitative analysis of lead, silicon, and potassium oxides in lead silicate glasses. In this work, standards of lead silicate glasses with variable concentrations of lead and potassium (70–85 and 5–20 wt%, respectively) were synthesized. Next, the dependence of the intensity of the LIBS bands for lead and potassium on their concentration was measured, and a calibration was made. The possibility of determining the thickness of the weathered layer using this method with the simultaneous construction of a lead oxide profile was demonstrated. Using a historical tile sample from the burial church in the Euphrosinian monastery in Polotsk, the thicknesses of the following layers were determined: a layer of glaze decay products and a weathered layer. Their thicknesses were about 5 microns and 70 microns, respectively.
The LIBS method can become a useful tool in archaeological science for the analysis of art and historical artifacts. The method allows for instant multi-element qualitative analysis of materials with micro-destructive effects. The advantage of this method is the ability to carry out depth profiling. This property is important when examining objects whose surface composition has changed over time, such as weathered glass.
Such studies are especially important for restoration work since the state of the weathered layer affects the further preservation of ancient glass. Often, the weathered layer is a protective crust that prevents the glass from breaking. But this layer can also contain a large amount of alkali, which will cause the glass under it to continue to degrade. Using an analysis of the corrosion layer, the degree of impact on the object can be determined—whether this layer will be cleaned off or covered with a conservation composition without cleaning. One of the further directions of this study is to develop a method for the quantitative distribution of other elements such as potassium, sodium, and calcium.

Author Contributions

A.L.: writing—original draft and resources; V.A.: writing—review and editing, resources, methodology, supervision, and funding acquisition; D.P.: investigation and methodology; D.J.: methodology, writing, and resources; M.K.: formal analysis and investigation. All authors have read and agreed to the published version of the manuscript.

Funding

This research was carried out with the support of a grant under the Decree of the Government of the Russian Federation No. 220 of 9 April 2010 (Agreement No. 075-15-2021-593 issued on 1 June 2021).

Data Availability Statement

Not applicable.

Conflicts of Interest

The authors declare no conflict of interest.

References

  1. Tite, M.S.; Freestone, I.; Mason, R.; Molera, J.; Vendrell-Saz, M.; Wood, N. Lead glazes in antiquity—Methods of production and reasons for use. Archaeometry 1998, 40, 241–260. [Google Scholar] [CrossRef]
  2. Безбoрoдoв, М.А. Русскoе стеклo XII века. Дoклады Академии Наук СССР 1950, 74, 789–790. Available online: https://elib.belstu.by/bitstream/123456789/37960/1/Untitled.FR12.pdf (accessed on 11 March 2023). (In Russian).
  3. Brill, R.H. Ancient glass. Sci. Am. 1963, 209, 120–131. [Google Scholar] [CrossRef]
  4. Freestone, I.C.; Degryse, P.; Lankton, J.; Gratuze, B.; Schneider, J. HIMT, glass composition and commodity branding in the primary glass industry. In Things That Travelled: Mediterranean Glass in the First Millennium AD; Rosenow, D., Phelps, M., Meek, A., Freestone, I., Eds.; UCL Press: London, UK, 2018; pp. 159–190. [Google Scholar] [CrossRef]
  5. Schibille, N.; Gratuze, B.; Ollivier, E.; Blondeau, É. Chronology of early Islamic glass compositions from Egypt. J. Archaeol. Sci. 2019, 104, 10–18. [Google Scholar] [CrossRef]
  6. Siu, L.; Henderson, J.; Faber, E. The production and circulation of Carthaginian glass under the rule of the romans and the vandals (fourth to sixth century ad): A chemical investigation. Archaeometry 2017, 59, 255–273. [Google Scholar] [CrossRef]
  7. Adlington, L.W.; Freestone, I.C.; Kunicki-Goldfinger, J.J.; Ayers, T.; Scott, H.G.; Eavis, A. Regional patterns in medieval European glass composition as a provenancing tool. J. Archaeol. Sci. 2019, 110, 104991. [Google Scholar] [CrossRef]
  8. Molera, J.; Pradell, T.; Salvado, N.; Vendrell-Saz, M. Lead frits in Islamic and Hispano-Moresque glazed productions. In From Mine to Microscope. Advances in the Study of Ancient Materials, Chapter 1; Shortland, A.J., Freestone, I., Rehren, T., Eds.; OxbowBooks: Oxford, UK, 2009; pp. 1–11. Available online: https://www.researchgate.net/publication/284658758_Lead_frits_in_Islamic_and_Hispano-Moresque_glazed_productions (accessed on 25 December 2022).
  9. Walton, M.S.; Tite, M.S. Production technology of Roman lead-glazed pottery and its continuance into late antiquity. Archaeometry 2010, 52, 733–759. [Google Scholar] [CrossRef]
  10. Matin, M.; Tite, M.; Watson, O. On the origins of tin-opacified ceramic glazes: New evidence from early Islamic Egypt, the Levant, Mesopotamia, Iran, and Central Asia. J. Archaeol. Sci. 2018, 97, 42–66. [Google Scholar] [CrossRef]
  11. Pérez-Serradilla, J.A.; Jurado-López, A.; de Castro, M.L. Complementarity of XRFS and LIBS for corrosion studies. Talanta 2007, 71, 97–102. [Google Scholar] [CrossRef]
  12. De Giacomo, A.; Dell’Aglio, M.; De Pascale, O.; Gaudiuso, R.; Santagata, A.; Teghil, R. Laser Induced Breakdown Spectroscopy methodology for the analysis of copper-based-alloys used in ancient artworks. Spectrochim. Acta Part B At. Spectrosc. 2008, 63, 585–590. [Google Scholar] [CrossRef]
  13. Щапoва, Ю.Л. Стеклo Киевскoй Руси. Мoсква Изд-вo МГУ им. М. В. Лoмoнoсoва 1972, 91–117. Available online: https://www.academia.edu/30895628/%D0%AE_%D0%9B_%D0%A9%D0%B0%D0%BF%D0%BE%D0%B2%D0%B0_%D0%A1%D1%82%D0%B5%D0%BA%D0%BB%D0%BE_%D0%9A%D0%B8%D0%B5%D0%B2%D1%81%D0%BA%D0%BE%D0%B9_%D0%A0%D1%83%D1%81%D0%B8_Sklo_Kyjevsk%C3%A9_Rusi_Glass_of_Kievan_Rus (accessed on 16 October 2022). (In Russian).
  14. Галибин, В.А. Сoстав стекла как археoлoгический истoчник. In Труды ИИМК РАН, Т. IV; Петербургскoе Вoстoкoведение: Saint Petersburg, Russia, 2001; pp. 14–36. (In Russian) [Google Scholar]
  15. Раппoпoрт, П.А. Зoдчествo Древней Руси. Ленинград: Изд-вo Наука 1986, 7–29. Available online: http://www.russiancity.ru/books/b57.htm (accessed on 16 October 2022). (In Russian).
  16. Singh, J.P.; Thakur, S.N. (Eds.) Laser-Induced Breakdown Spectroscopy; Elsevier: Amsterdam, The Netherlands, 2020; pp. 23–35. Available online: https://julac-hku.primo.exlibrisgroup.com/discovery/fulldisplay?vid=852JULAC_HKU:HKU&search_scope=MyInst_and_CI&tab=Everything&docid=alma991037145109703414&lang=en&context=L&adaptor=Local%20Search%20Engine&query=sub,exact,Vibrational%20spectra,AND&mode=advanced&offset=0 (accessed on 26 July 2022).
  17. Detalle, V.; Bai, X. The assets of laser-induced breakdown spectroscopy (LIBS) for the future of heritage science. Spectrochim. Acta Part B At. Spectrosc. 2022, 191, 106407. [Google Scholar] [CrossRef]
  18. Madariaga, J.M. Analytical chemistry in the field of cultural heritage. Anal. Methods 2015, 7, 4848–4876. [Google Scholar] [CrossRef]
  19. Botto, A.; Campanella, B.; Legnaioli, S.; Lezzerini, M.; Lorenzetti, G.; Pagnotta, S.; Poggialini, F.; Palleschi, V. Applications of laser-induced breakdown spectroscopy in cultural heritage and archaeology: A critical review. J. Anal. At. Spectrom. 2019, 34, 81–103. [Google Scholar] [CrossRef]
  20. Ruan, F.; Zhang, T.; Li, H. Laser-induced breakdown spectroscopy in archeological science: A review of its application and future perspectives. Appl. Spectrosc. Rev. 2019, 54, 573–601. [Google Scholar] [CrossRef]
  21. Spizzichino, V.; Fantoni, R. Laser induced breakdown spectroscopy in archeometry: A review of its application and future perspectives. Spectrochim. Acta Part B At. Spectrosc. 2014, 99, 201–209. [Google Scholar] [CrossRef]
  22. Gómez-Morón, M.A.; Ortiz, P.; Ortiz, R.; Martín, J.M.; Mateo, M.P.; Nicolás, G. Laser-induced breakdown spectroscopy study of silversmith pieces: The case of a Spanish canopy of the nineteenth century. Appl. Phys. A 2016, 122, 548. [Google Scholar] [CrossRef]
  23. Prokuratov, D.; Samokhvalov, A.; Pankin, D.; Vereshchagin, O.; Kurganov, N.; Povolotckaia, A.; Shimko, A.; Mikhailova, A.; Balmashnov, R.; Reveguk, A.; et al. Investigation towards laser cleaning of corrosion products from Lead Objects. Heritage 2023, 6, 1293–1307. [Google Scholar] [CrossRef]
  24. Samokhvalov, A.A.; Frenkel, Y.V.; Prokuratov, D.S.; Kurganov, N.S.; Gorlov, K.V. Layer-By-Layer Analysis of Archaeological Coins by Means of Laser-Induced Breakdown Spectroscopy. In Proceedings of the Fundamentals of Laser Assisted Micro–and Nanotechnologies (FLAMN-19): Symposium Abstract Book, Saint-Petersburg, Russia, 30 June–4 July 2019; p. 172. [Google Scholar]
  25. Prokuratov, D.; Samokhvalov, A.; Pankin, D.; Vereshchagin, O.; Kurganov, N.; Povolotckaia, A.; Povolotckaia, A.V.; Shimko, A.A.; Mikhailova, A.A.; Somov, P.A.; et al. Laser irradiation effects on metallic zinc and its corrosion products. J. Cult. Herit. 2023, 61, 13–22. [Google Scholar] [CrossRef]
  26. Grigor’Eva, I.A.; Parfenov, V.A.; Prokuratov, D.S.; Shakhmin, A.L. Laser cleaning of copper in air and nitrogen atmospheres. J. Opt. Technol. 2017, 84, 1–4. [Google Scholar] [CrossRef]
  27. Prokuratov, D.S.; Davtian, A.S.; Vereshchagin, O.S.; Kurganov, N.S.; Samokhvalov, A.A.; Pankin, D.V.; Povolotckaia, A.V.; Shimko, A.A.; Mikhailova, A.A.; Somov, P.A.; et al. Laser cleaning of archaeologically corroded iron objects with inlays. Opt. Quantum Electron. 2020, 52, 113. [Google Scholar] [CrossRef]
  28. Безбoрoдoв, М.А. Химический сoстав и технoлoгические приемы прoизвoдства стекла в Древней Руси. In Дoклады Академии Наук СССР; Наука и техника: Minsk, Republic of Belarus, 1954; pp. 1041–1044. Available online: https://elib.belstu.by/bitstream/123456789/37975/1/Untitled.FR12.pdf (accessed on 16 October 2022). (In Russian)
  29. Безбoрoдoв, М.А.; Фехнер, М.В. Химическoе исследoвание русских стекoл XI–XIII векoв. In Дoклады Академии Наук СССР; Наука: Moscow, Russia, 1954; pp. 1037–1040. Available online: https://elib.belstu.by/bitstream/123456789/37973/1/Untitled.FR12.pdf (accessed on 16 October 2022). (In Russian)
  30. Раппoпoрт, П.А. Русская архитектура X–XIII вв.: Каталoг памятникoв. Археoлoгия СССР. Свoд археoлoгических истoчникoв. 1982, pp. 94–95. Available online: https://arheologija.ru/rappoport-russkaya-arhitektura-x-xiii-vv/ (accessed on 14 October 2022). (In Russian).
  31. NIST LIBS Database. Available online: https://physics.nist.gov/PhysRefData/ASD/LIBS/libs-form.html (accessed on 27 March 2023).
  32. Molera, J.; Pradell, T.; Salvadó, N.; Vendrell-Saz, M. Interactions between clay bodies and lead glazes. J. Am. Ceram. Soc. 2001, 84, 1120–1128. [Google Scholar] [CrossRef]
Figure 1. Glazed green tile from the burial church in the Euphrosinian monastery in Polotsk: (a) glazed surface of the tile and (b) preserved side of the tile.
Qubs 07 00024 g001
Figure 2. Typical emission spectrum of lead silicate glass.
Qubs 07 00024 g002
Figure 3. Deconvolution of sample PS1 spectrum. Pb and Si areas are highlighted in green and blue, respectively; the black line is the original contour of the spectrum, the red line is the resulting deconvolution contour.
Qubs 07 00024 g003
Figure 4. Calibration dependencies of the areas under the peaks on the concentration of elements: (a) calibration curve for lead oxide determination (Pb-Si glass series) and (b) calibration curve for potassium oxide determination (Pb-Si-K glass series).
Qubs 07 00024 g004
Figure 5. Examination of a section of a tile sample using an optical microscope: (a) part of the sample with preserved glaze and (b) part of the sample with corroded glaze.
Qubs 07 00024 g005
Figure 6. Examination of the sample’s surface: (a) using an optical microscope and (b) using a scanning electron microscope.
Qubs 07 00024 g006
Figure 7. SEM micrographs of the historical tile sample: (a) the weathered layer and (b) the homogeneous glaze. The dark part of the photograph on the right is the ceramic body, and the light part on the right is the glaze.
Qubs 07 00024 g007
Figure 8. Emission spectra from different depths: (a) the weathered layer and (b) the homogeneous glaze.
Qubs 07 00024 g008
Figure 9. Graph showing the distribution of lead oxide at different depths in the weathered layer (“irisation”) and the homogeneous glaze (“glaze”).
Qubs 07 00024 g009
Table 1. Chemical composition of the batches used for the synthesis of glass samples.
SeriesSampleSiO2, wt%K2O, wt%PbO, wt%
Si-PbPS115-85
PS220-80
PS325-75
PS430-70
Si-Pb-KPSK115580
PSK2151075
PSK3151570
PSK4152065
Table 2. LIBS data for the synthesized glass samples.
SeriesSampleS (Pb), Avg.S (Si), Avg.Pb/Si Ratio
Pb-SiPS112504402.84
PS211004512.44
PS34732491.89
PS42221331.67
SeriesSampleS (K), Avg.S (Si), Avg.K/Si Ratio
Pb-Si-KPSK1154410914.31
PSK210097014.39
PSK314379914.40
PSK47994916.10
Table 3. Chemical composition of the homogeneous layer (glaze) and weathered layer (irisation) determined using XRF analysis.
Layer/Elements, wt%Na2OMgOAl2O3SiO2K2OCaOFe2O3CuOSnO2PbO
Glaze0.210.991.785.621.002.200.350.721.7788.96
Irisation0.390.793.0826.040.791.941.370.740.2062.99
Disclaimer/Publisher’s Note: The statements, opinions and data contained in all publications are solely those of the individual author(s) and contributor(s) and not of MDPI and/or the editor(s). MDPI and/or the editor(s) disclaim responsibility for any injury to people or property resulting from any ideas, methods, instructions or products referred to in the content.

