1. Introduction
Filtering and manipulating the neutron spin of scattering instrument beams provides the ability to reveal unique information about the properties of condensed matter samples [
1,
2], and while the application to studies of magnetism is quite apparent, it also allows the separation of spin-incoherent scattering from other scattering processes and is thus relevant to a wide variety of non-magnetic samples. In the quasielastic neutron scattering (QENS) regime, where precise measurements of molecular-scale diffusion modes can be carried out [
3], there are often several overlapping contributions to the spectra which are difficult to decompose. In this case, the ability to distinguish the coherent nuclear, magnetic, and spin-incoherent components using neutron polarisation analysis can be crucial [
4]. Neutron spin-echo instruments can also investigate dynamics with fine energy resolution and over length scales including the QENS regime [
5] using spin-polarised neutrons; however, this requires demanding instrumentation, which is not so widely available and is unable to access some of the higher energy and shorter length scales possible for other types of neutron spectrometers.
Polarised QENS for soft matter is especially important because complex nanostructures manifest themselves over a wide range of length scales, implying arbitrary modulations in diffuse, coherent scattering [
6,
7,
8]. Conversely, even when fully substituting hydrogen with deuterium to mitigate the strong incoherent scattering signal of the former, the assumption that scattering is predominantly coherent is not valid at all scattering vectors
, as well illustrated in recent studies on heavy water [
9,
10].
Triple-axis spectrometers have been some of most versatile neutron scattering instruments for many areas of neutron science. With cold neutrons, triple-axis spectrometers can investigate physical phenomena with high energy and momentum resolution. Previous studies, such as that undertaken at the Institut Laue–Langevin, have taken advantage of the ability of a polarised cold triple-axis spectrometer to separate coherent and single-particle scattering for molten potassium in the QENS regime [
11]. The cold-neutron triple-axis spectrometer Sika at the Australian Centre for Neutron Scattering (ACNS) excels in measuring well-defined regions of
with a very low background, allowing for parametric studies (e.g., varying temperature or magnetic field) to be conducted efficiently in both inelastic and elastic scattering experiments [
12,
13]. The instrument was also recently modified with the installation of motors to control the distance from the monochromator to the sample, and also from the sample to the analyser, which allows the instrument to be extended more easily to accommodate the addition of the
He polarisation setup (see
Figure 1).
The spin polarisation of neutron beams at ACNS is primarily achieved using a combination of supermirrors and helium-3 spin-filter cells [
14], the latter employing the metastable-exchange optical pumping (MEOP) technique which allows the versatility of filling cells of a variety of geometries to a desired pressure of spin-polarised helium-3 gas. However, the spin of the helium-3 gas relaxes over time and, thus, the cells must be refilled and replaced periodically, which also necessitates the careful correction of the measured data to compensate for the change in spin-filter behaviour.
In this work, we present the first implementation at ACNS of neutron polarisation analysis on Sika in support of QENS experiments. The QENS data had been collected using the high-resolution backscattering spectrometer Emu [
15], which does not presently have neutron polarisation analysis capabilities. We followed an established approach [
16] consisting of the polarisation analysis of (partially) energy-transfer-integrated dynamic structure factors from Sika, and compared this with the energy-transfer-resolved dynamic structure factors from Emu. The relation to polarised QENS experiments is also discussed.
2. Materials and Methods
2.1. Instrumentation
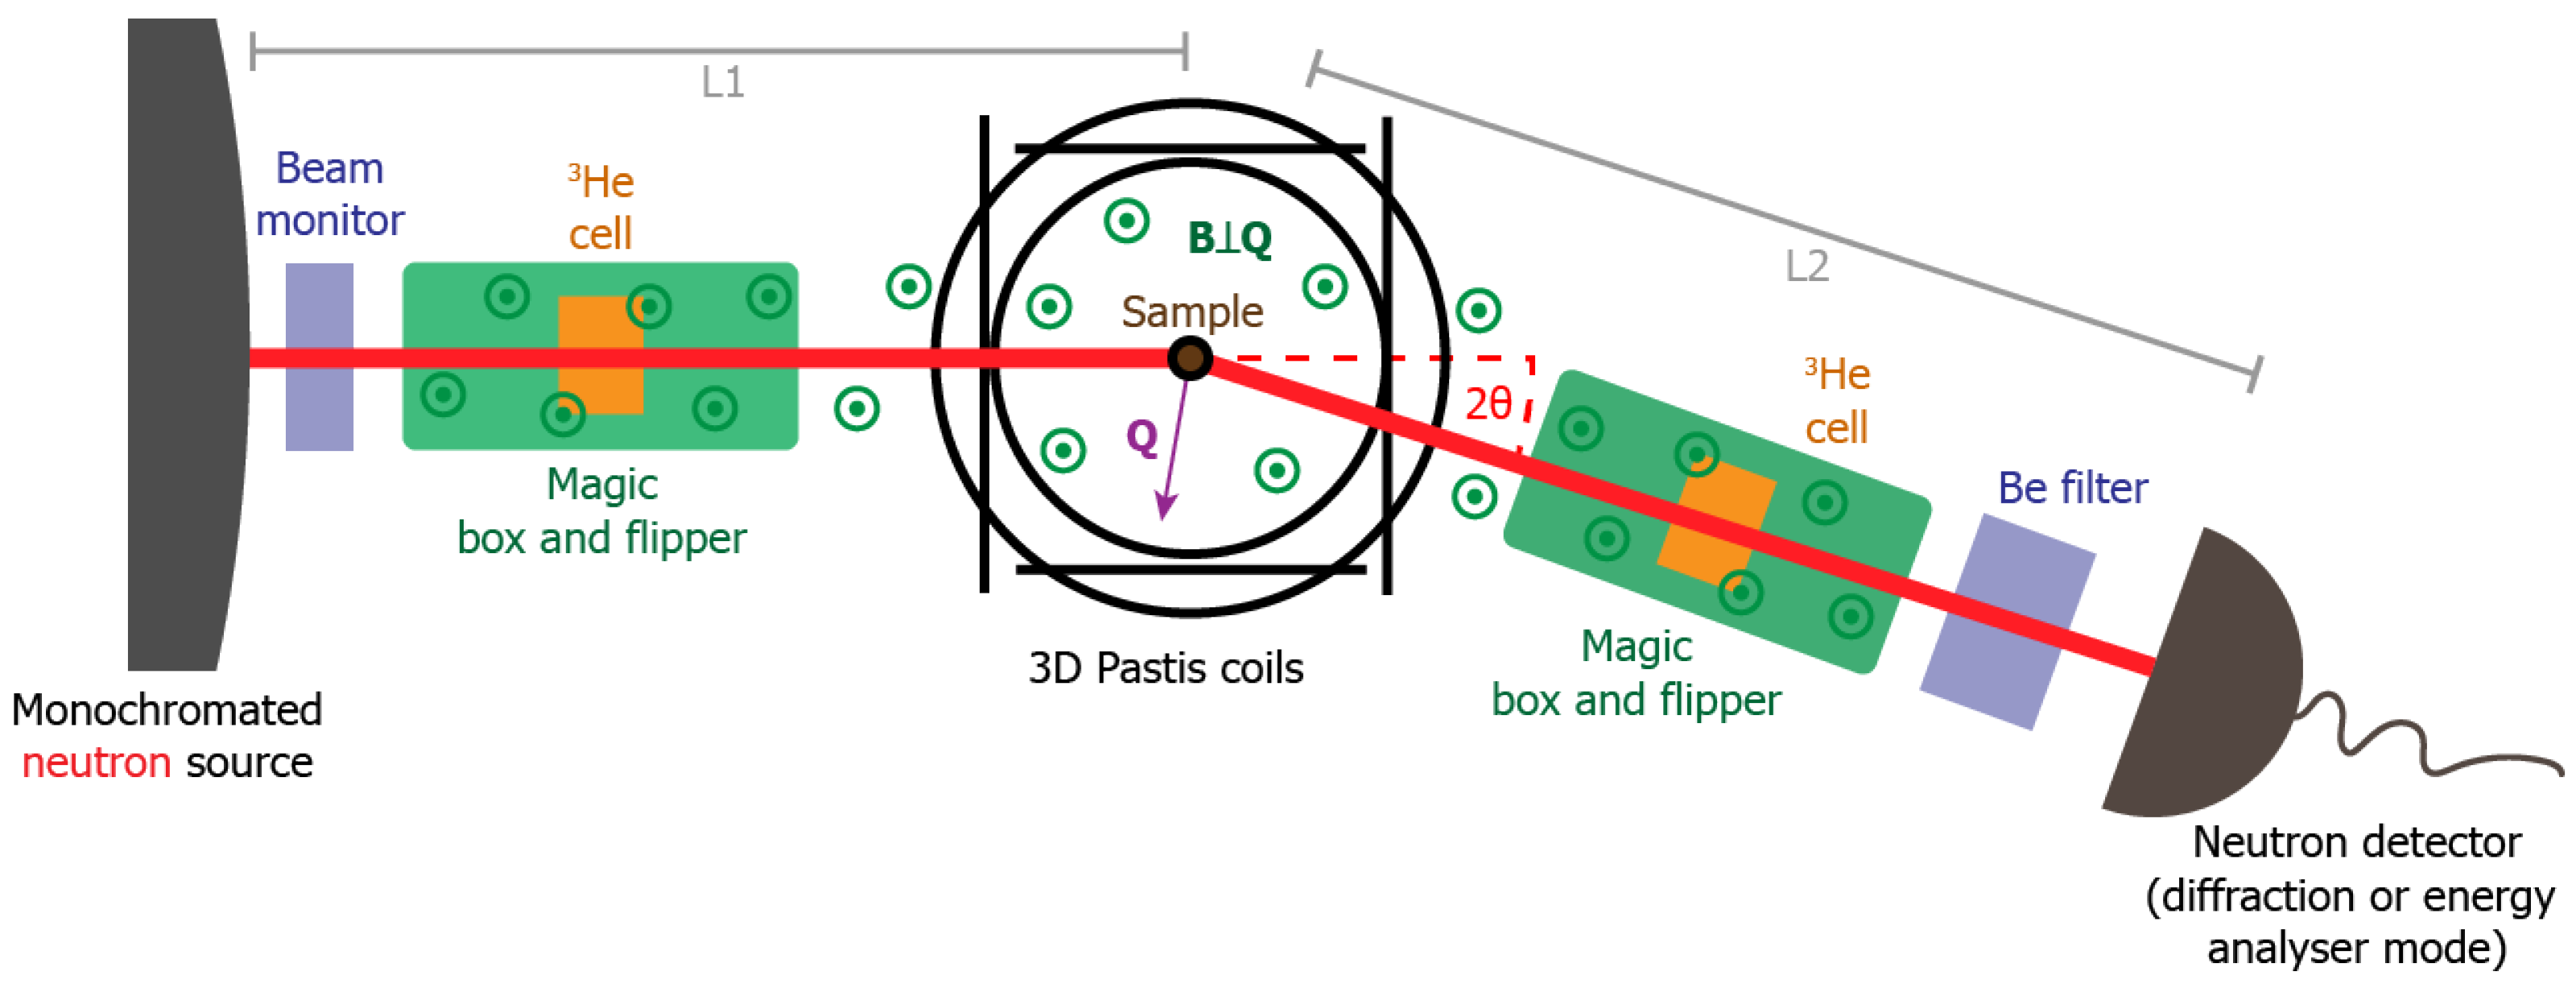
The configuration of the cold triple-axis spectrometer (TAS) Sika for polarisation analysis is shown in
Figure 1. Compared to a typical unpolarised TAS experiment, the “arms” of the instrument, both between the monochromator and sample (L1), and the sample and analyser/detector (L2), have been elongated to accommodate the two magic boxes [
17]. These boxes provide both a uniform magnetic field in which to store the silicon-windowed Pyrex helium-3 spin filter cells [
18], and the ability to apply a pulse of RF radiation to the helium-3 gas to efficiently ‘flip’ it to the opposite spin state, thus inverting the effective orientation of the spin filter. These cylindrical cells have an internal path length of 100 mm, a diameter of approximately 130 mm, and an internal volume of 1.33 L and, in this experiment, they were filled to a pressure of 0.5 bar absolute using the MEOP station located in the Neutron Guide Hall at ACNS. This pressure was chosen in order to achieve a good balance between spin polarisation and transmission for the neutron beam. The cells have a polarisation lifetime
of typically 50 to 100 h when installed on a neutron instrument, and therefore are replaced every 24 h to maximise data acquisition efficiency. Boron nitride masks were placed between each cell and the sample to eliminate some of the background scattering introduced by adding the cells and magic boxes.
A set of Pastis coils [
19] was installed around the sample position, where it provides a homogeneous magnetic field which can be oriented in any arbitrary direction in three-dimensional space, in addition to a guide field to ensure the efficient transport of the neutron spin as it passes between the two spin-filter cells. In this case, because the applied magnetic field
at the sample position simply needs to be orthogonal to the scattering vector
, we set the field to be vertical and hence orthogonal to
for all possible configurations of the TAS instrument. The magic boxes were also installed in an orientation which sets their uniform magnetic field in the same direction, in order to further simplify spin transport.
Sika can be used to measure either diffraction or energy-selected neutron scattering, depending on the position of the diffraction-mode detector [
12]. If this detector is placed between the pre-analyser collimator and the analyser, then a diffraction measurement without the energy selection of the scattered neutrons can be taken with a shorter sample-to-detector distance. Otherwise, if this detector is removed, then the neutron beam will pass through the pre-analyser collimator onto the analyser, which will select the desired neutron energy range to then be counted using a different tube detector. Removing the analyser to achieve a diffraction measurement results in a higher neutron count rate, but also a more significant background where the dynamic structure factor is effectively integrated in energy along a
trajectory. With the energy analyser in use, the count rate and background are reduced due to the selection of a final energy band, the collimating effects of the longer flight path, and the additional borated polyester and cadmium shielding protecting the detector.
In the present work, energy-selected scattering was configured to accept the same energy as that selected by the monochromator, and so rigorously elastic scattering measurements were performed at an energy transfer resolution defined by the initial and final energy resolutions. In relation to QENS spectra that are typically measurable on dedicated spectrometers, such as backscattering instruments, such elastic-mode measurements using cold triple-axis spectrometers are possible with energy-transfer resolutions that range anywhere from a few to several tens of eV. That flexibility is of substantial interest in combination with neutron polarisation, since it allows for quantifying the spin-incoherent scattering contribution to the dynamic structure factor, measured over corresponding energy transfer ranges using spectrometers which may have no polarised neutron capabilities.
The data presented in this work were collected using Sika with the collimators set to the open-60-60-open configuration. An incident energy of 3.0 meV equivalent to a wavelength of 5.22 Å yielded an elastic energy resolution of approximately 40 eV full width at half maximum. A cooled beryllium filter was placed on the scattered side of the instrument to remove higher-order wavelength contamination. The instrument was elongated to L1 = 2540 mm and L2 = 2150 mm to accommodate the helium-3 polarisation setup.
2.2. Samples
Two different samples were measured at an ambient temperature of approximately 295 K in this experiment. The first sample was a vanadium cylinder of outer diameter 22 mm and wall thickness 0.5 mm, commonly used as a calibrant given that its scattering is almost exclusively (spin) incoherent. Vanadium can also be used to easily verify separation of coherent and incoherent scattering resulting from our setup [
1].
The second sample was an aqueous polyelectrolyte coacervate, for which polyelectrolyte segmental diffusion is of interest, and was investigated previously using Emu [
20]. The coacervate was prepared by mixing ammonium- and sulfonate-functionalised polyelectrolytes in deuterated water, followed by centrifugation to separate the coacervate phase from the supernatant phase. The coacervate phase was then loaded in an aluminium container so as to achieve a ten-percent scattering annular geometry. In that previous study on similar samples, we had assigned the resolution-limited elastic scattering to small-angle scattering, on the basis of its
Q-dependence and requiring internal consistency in the QENS data analysis.
2.3. Data Acquisition
The data presented in this article was collected over three runs, each of approximately 22 to 23 h duration, followed by a brief pause to exchange the spin-filter cells. Each run began and ended with the measurement of the (
) = (102) reflection of the alumina (Al
O
) rod at
Å
, which was used to calibrate the performance of the spin-filter cells. Because alumina is a relatively strong, coherent, and purely nuclear scatterer of neutrons, by measuring the scattering rate of a particular nuclear Bragg peak as a function of time, we could determine the neutron transmission through the spin-filter cells and, hence, infer the spin polarisation of the helium-3 gas [
2] during the measurement. A further measurement of the scattering rate after deliberately depolarising the cells provides confirmation of their opacity, which depends on the pressure of helium-3 gas and path length of the cell, and neutron wavelength. With this, the performance of the spin filters can be corrected for the relaxation of the helium-3 gas spin polarisation over the course of each run.
Measurements were taken for the polyelectrolyte sample, an empty aluminium container, and the vanadium calibrant. Additional scans were performed without any sample or sample mount to measure the instrument background; however, these scans produced almost no signal and were thus discarded.
Each measurement consisted of a scan of the TAS detector through a range of ‘’ scattering angles for various configurations of the spin filter cells, which are denoted spin-up and spin-down, respectively, according to which neutron spin orientation is transmitted through each filter. The filter spin configurations are then changed for each scan such that counts for both non-spin-flip (spin up or spin down for both filters) and spin-flip (the two filters with opposing spin directions) scattering processes are acquired, and the scans are then repeated in the opposite order to ensure that a similar quality of statistics are obtained for each configuration. For these non-magnetic samples, there is no distinction between the two pairs of spin-flip or non-spin-flip configurations.
The measurements above were performed using Sika in either diffraction or elastic mode, to compare the relative merits of the two approaches. Again, each experimental run was performed with the instrument periodically swapping between these two operational modes, to obtain similar counting times for both and thus allow a direct comparison to be made.
2.4. Data Analysis
The data correction method used was based on that of Wildes [
21] and Nambu et al. [
22], using the aforementioned alumina calibration data. This allowed the measured non-spin-flip
and spin-flip
spectra to be first corrected for the spin-filter cell performance
and
, and then converted to coherent
and spin-incoherent
scattering according to the well-known relationships [
1]
Note that the isotope incoherent contribution, which would be included in the term, has been neglected as the atomic species of interest in this study (primarily hydrogen, which dominates the neutron scattering from the polyelectrolyte sample) and aluminium and vanadium for calibration are each at least % isotopically pure in their natural states.
Spectra for the samples were obtained by subtracting the corrected spin-flip and non-spin-flip data for the empty aluminium container, representing the instrument background, from that of the polyelectrolyte loaded in the aluminium container and the vanadium calibrant. This entire process was repeated independently for both the diffraction and elastic data sets, with only the alumina calibration of the spin-filter cells being common to each.
3. Results
The polyelectrolyte coacervate results obtained from the previous Emu measurements [
20] were also compared to the Sika measurements in both diffraction and elastic modes, to demonstrate the complementarity of the backscattering and TAS experiments. The model used to analyse the Emu data included a stable distribution in the dynamic structure factor to describe polymer dynamics, taking the following form:
where
represents the elastic scattering amplitude for the Dirac delta distribution
;
the amplitude for the stable distribution, the latter being written as the Fourier transform of a Kohlrausch–Williams–Watts function with
stretching exponent and
characteristic relaxation time; and
B a background term accounting for processes too fast to resolve. The Emu measurement determined that
was most suitable, and obtained values for
,
,
, and
for scattering vectors
Q between 0.34 and 1.82 Å
.
may tentatively be related to the coherent and incoherent dynamic structure factors as follows:
Here, it is assumed that the elastic component from incoherent scattering is negligible.
To test this hypothesis with the current Sika measurement, the values for each coefficient as a function of
Q are fitted to appropriate forms [
20], to allow for evaluation at the different values of
Q of the Sika measurement:
These fitted forms were then used to model the intensities for coherent and incoherent scattering as measured on Sika by integrating over the appropriate energy range
, where
This gives the comparable forms for diffraction ( meV) and elastic (eV) measurement mode data, which differ only with the integration range of the stable distribution.
Finally, these Emu-derived model forms,
,
, and
, are simultaneously fitted to the measured data
,
, and
from Sika for the three fit parameters
,
, and
where
By finding suitable values of for both the diffraction and elastic data sets, as measured using Sika, the interpretation of the dynamic structure factor from the Emu data analysis may be verified, namely whether the and components indeed correspond to coherent and incoherent scattering from the polyelectrolyte coacervate sample. is a scale factor with no physical meaning. It is noted that there is no free fitting parameter adjusting the ratio of coherent to incoherent scattering aside from the small contributions to the background which are weighted by and .
3.1. Diffraction-Mode Measurements
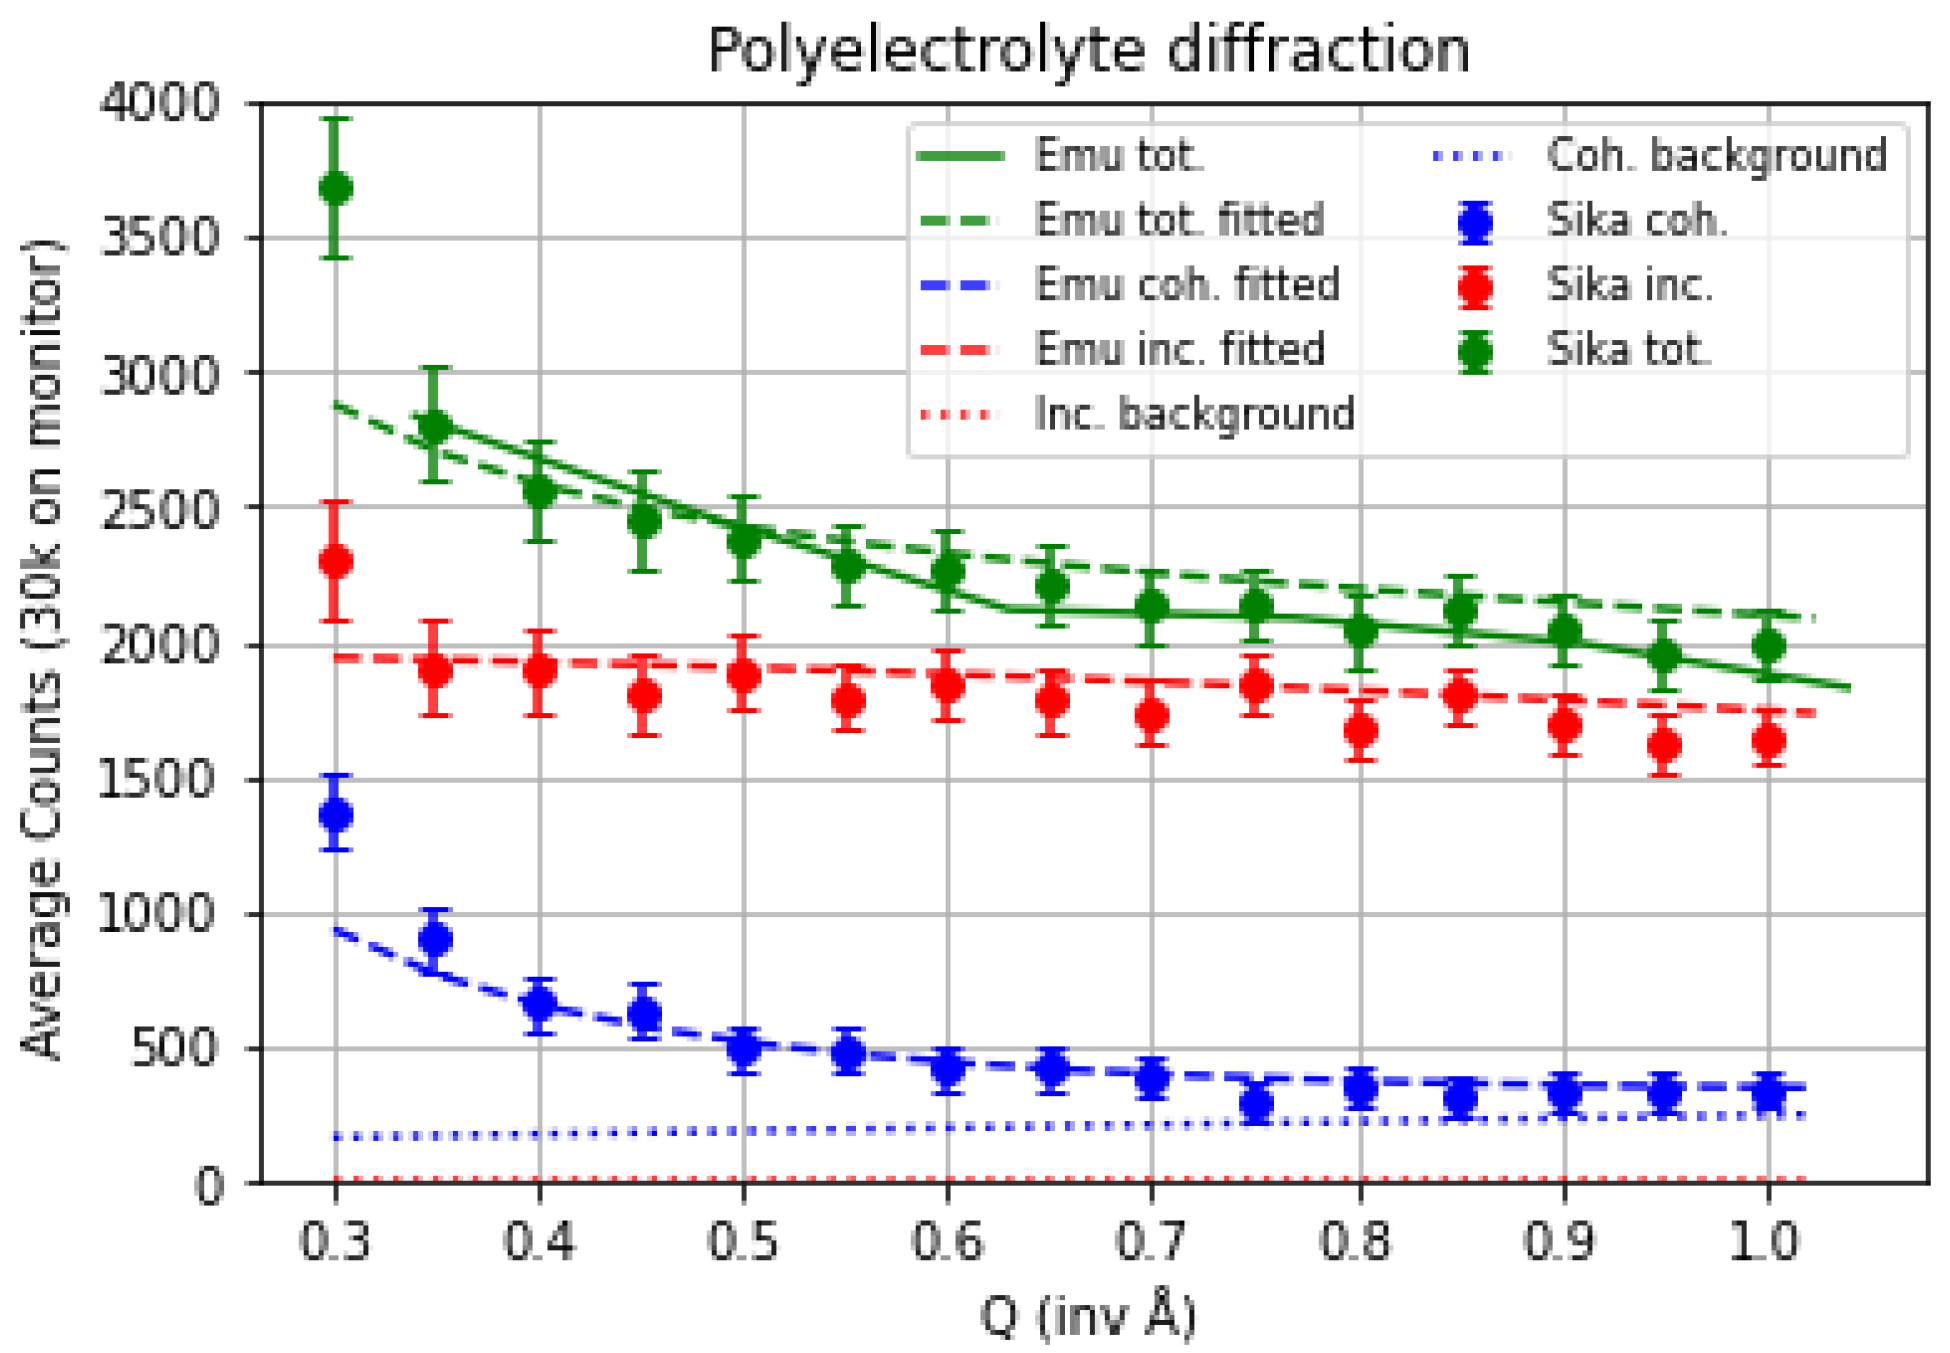
Using the procedure described above, the Sika diffraction measurement for the polyelectrolyte coacervate sample after subtraction of the empty aluminium can background has been fitted to the forms derived from the Emu experiment, as shown in
Figure 2. Here, we can see that the signal at larger scattering vectors
Q is dominated by incoherent scattering, as expected from sample composition and structure, while the coherent component makes a more pronounced contribution at lower
Q. The data point at
Å
is not well described using the Emu model, and is likely a type of background signal specific to the Sika instrument. The values for the fitted coefficients
are given in
Table 1. For comparison, the Emu fit results from the original study [
20] are also plotted after
scaling and
integration, as a solid green line in
Figure 2.
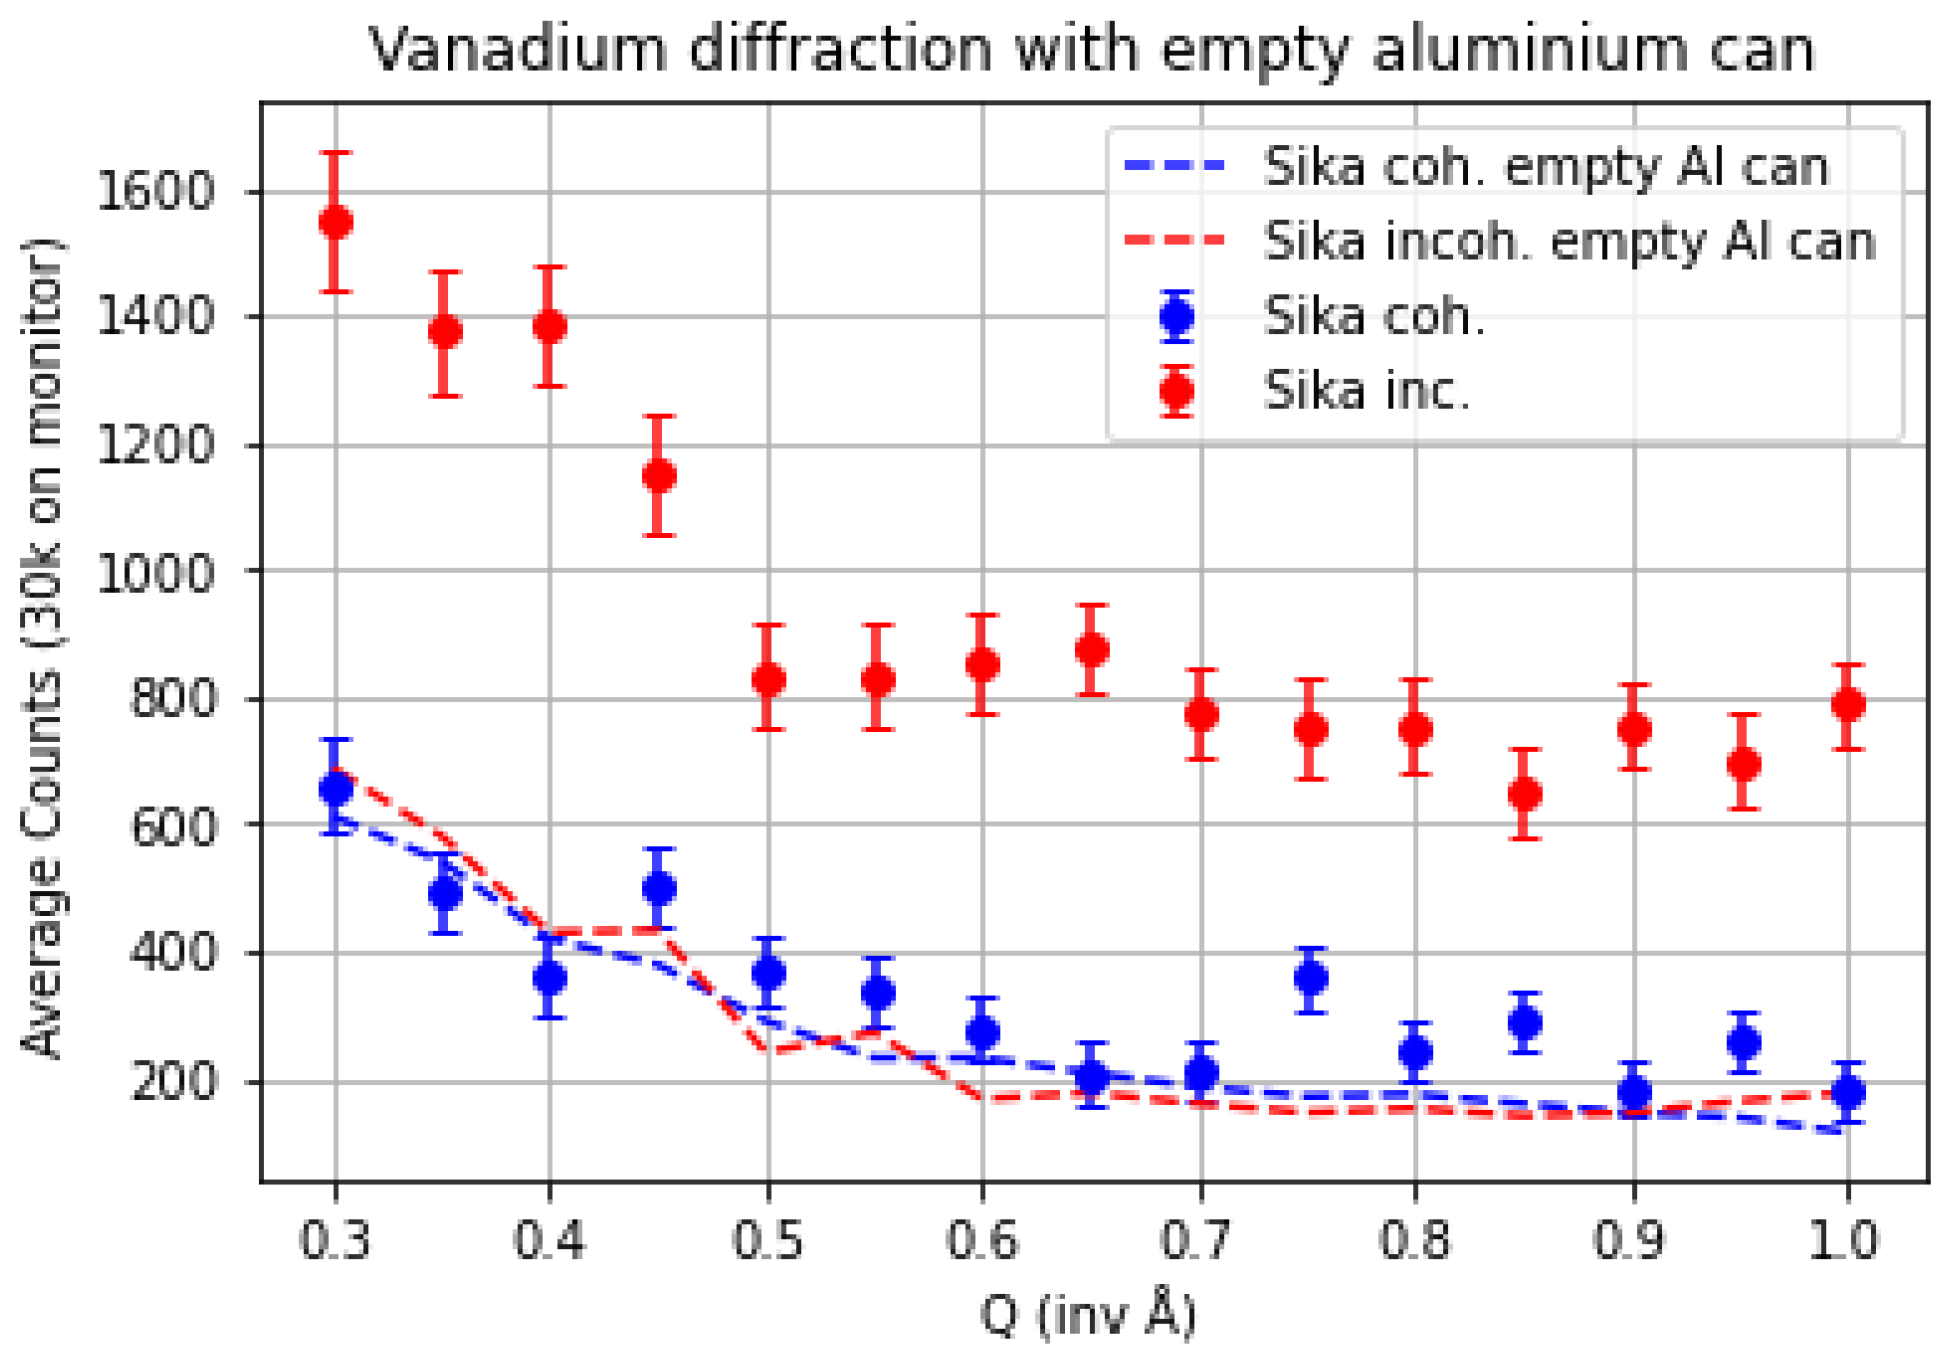
The analysis of the vanadium calibrant (
Figure 3) shows that the incoherent scattering dominates as expected, while the coherent scattering matches well to the signal obtained from an empty aluminium can without the need for any scaling factors. A correction for the annular shape of the vanadium cylinder was found to adjust the scattering rate at
Å
to change by approximately eight percent compared to
Å
[
23]. This implies that the coherent scattering seen in this measurement is some kind of background signal which was not present when the sample mount and vanadium sample were removed, and thus suggests that the sample mount is likely responsible.
3.2. Elastic-Mode Measurements
The analysis for the elastic scattering measurements follows the same process as the diffraction measurements, aside from the energy range included in the dynamic scattering function being restricted to the resolution of Sika when using the energy analyser. For the background-corrected polyelectrolyte sample (
Figure 4), we reproduce similar spectra to the diffraction case (
Figure 2), albeit with a different ratio of coherent and incoherent scattering in the high-
Q section of the data and a more pronounced slope to the high-
Q portion of the spectra.
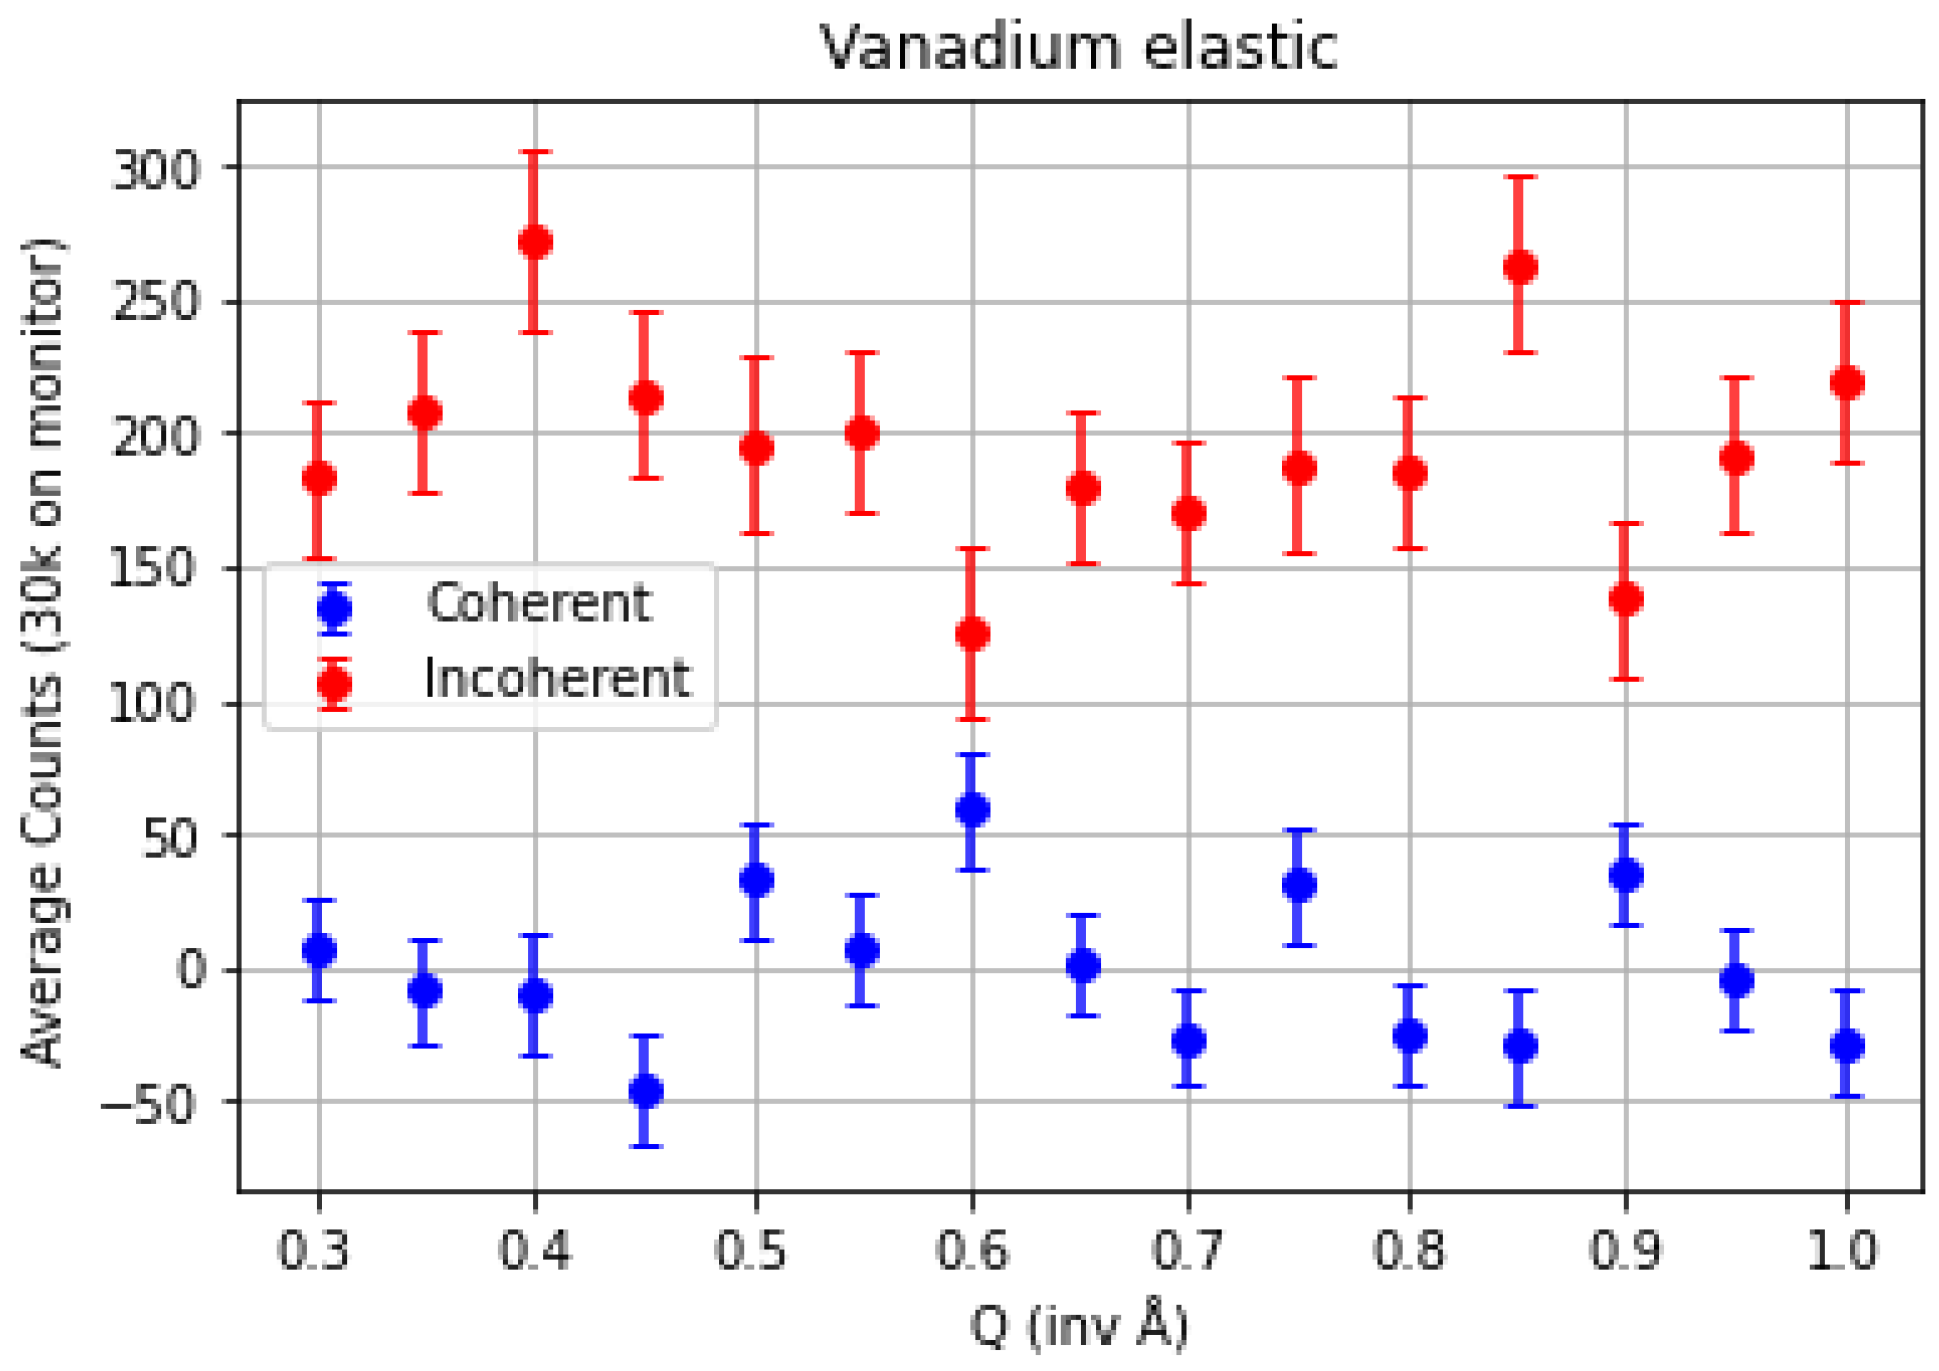
The vanadium calibrant (
Figure 5) intensities show no significant
Q dependence and are compatible with vanadium scattering cross sections, with no apparent influence of background scattering.
4. Discussion
Given there are no free parameters in the spin-polarisation correction procedure, the negligible coherent scattering from vanadium in the elastic measurement (
Figure 5) validates the method and elastic-mode measurement, based on consistency with known scattering cross sections, albeit at the cost of a significantly reduced data acquisition rate compared to the diffraction-mode measurement. Therefore, the separation of coherent and incoherent scattering for the polyelectrolyte coacervate sample verifies that, while incoherent scattering dominates as
Q increases, the low
Q upturn is indeed of coherent origin, as inferred from previous unpolarised SANS measurements and QENS analysis [
20]. Furthermore, the relatively high coefficients of determination shown in
Table 1 for the elastic-mode fits is consistent with the Emu model being appropriate for this analysis, while the background term allowed in the Emu model is found to be a relatively minor contribution to both coherent and incoherent scattering on the Emu time scale.
The diffraction-mode scattering pattern of the vanadium calibrant shown in
Figure 3 is also consistent with the expected result, although it appears somewhat more susceptible to background signal, especially at low
. Future studies will measure the background scattering for this calibrant more carefully as, while the scattering from the instrument without a sample, sample can or sample mount was negligible, the coherent component of the vanadium scattering matches the coherent and incoherent diffraction from an empty aluminium can, which suggests that the sample mount was primarily responsible, given that aluminium is known to have a very low incoherent scattering cross section. The fit parameters shown in
Table 1 for the polyelectrolyte coacervate diffraction-mode data show that the Emu-derived model is less suitable in accounting for scattering over a wide energy range. This limitation is, in fact, anticipated from QENS models, which typically do not attempt to account for low-energy vibrations [
3].
The advantage of taking a diffraction measurement is clearly the significantly increased data acquisition rate, and has long proven a useful approach for less detailed analyses. Quantitative analysis in that mode is also certainly possible if the dynamic structure factors are at least partly known over an extended energy transfer range. For soft matter and liquids, where coherent scattering is mostly diffuse, Sika diffraction-mode measurements demand careful background subtraction. Conversely, a good agreement with the Emu-derived dynamic structure factor is found for the elastic measurements on the polyelectrolyte coacervate sample, and while count rate is considerably reduced compared to diffraction measurements, the effective reduction in background resulting from the associated Sika configuration makes such measurements quite straightforward and the close match of the energy range to the Emu measurement ensures a quantitative result.
In the present work, the QENS dynamic structure factor derived from measurements over the maximum energy transfer range of Emu ( eV) could be validated using the Sika elastic measurements, and the corresponding Emu background term apportioned to coherent and incoherent contributions from processes too fast to resolve on that spectrometer. More significantly, spin-polarised (elastic)-mode measurements quantitatively determine the ratio of the -integrated (QENS) spin-incoherent to coherent dynamic structure factors in a particular region. As exemplified in this work, provided that the -integration range matches that of an unpolarised, finer-energy transfer resolution (QENS) measurement, the determined incoherent-to-coherent ratio is then a potentially valuable, model-free constraint on the data analysis of the unpolarised measurement.
A consequence of the use of the Pastis coil set for such an experiment is the “shadowing” of the neutron beam at several positions in the scattering plane due to the coil windings which provide field components in the horizontal plane. This required each measurement to be taken twice, with the coil set rotated to reposition the “shadow” cast by the windings, and then a composite scattering pattern to be formed from the two measurements. Future experiments will make use of a recently designed set of coils in the tetra configuration [
24], which is only capable of creating a vertical magnetic field but avoids obstructing the beam in the scattering plane, and may also lead to superior field uniformity and thus more efficient neutron spin transport across the instrument. Such a setup would also be a natural approach for implementing polarisation analysis on a backscattering instrument, such as Emu or other similar spectrometers, and, in particular, for QENS from non-magnetic samples, as has been used on, for example, the cold multi-chopper spectrometer LET at ISIS [
10].
5. Conclusions
We have demonstrated that a cold triple-axis spectrometer instrument can be used to perform polarisation analysis around zero energy transfer to complement unpolarised QENS data acquired using a backscattering spectrometer, to help identify segmental dynamics in a complex polyelectrolyte coacervate. In comparing diffraction (summed over a wide range of energies) and elastic scattering (in a narrow energy band) for the same samples, we see that the elastic scattering in particular yields quantitative results, while the diffraction scattering is more sensitive to imperfections in the instrument but substantially quicker for qualitative results. This approach allows us to take advantage of the relative strengths of each instrument to deliver some polarisation analysis of QENS data, which can be directly compared to data acquired using an unpolarised backscattering instrument, and, in particular, highlights the versatility of Sika at ACNS. This method will also be useful in future efforts towards implementing polarisation analysis using other spectrometers at ACNS.

 ,
, 


