
Helical Electron Beam Status Online Evaluation for Magnetron Injection Gun
by
 , , ,
, , ,
Wei Jiang
1,*,
Chaoxuan Lu
1,
Binyang Han
1,
Boxin Dai
1,
Qiang Zheng
1,
Guo Liu
1,
Jianxun Wang
1 and
Yong Luo
1,2 1
School of Electronic Science and Engineering, University of Electronic Science and Technology of China, Chengdu 610054, China
2
Laboratory of Electromagnetic Space Cognition and Intelligent Control, Beijing 100089, China
*
Author to whom correspondence should be addressed.
Quantum Beam Sci. 2024, 8(1), 3; https://doi.org/10.3390/qubs8010003
Submission received: 23 November 2023
/
Revised: 21 December 2023
/
Accepted: 27 December 2023
/
Published: 29 December 2023
(This article belongs to the Special Issue New Challenges in Electron Beams)
Abstract
:The magnetron injection gun (MIG) is an essential component of the gyrotron traveling wave tube (gyro-TWT). Although the electron beam status influences the performance of the device, it cannot be measured directly in the experiment. An online evaluation module (OEM) for the experiment is developed to calculate the instant beam parameters of MIG. The OEM, by reconstructing the geometry of the MIG and related magnetic field distribution, can obtain the electron beam status under the operating parameters through the online simulation. The beam velocity spread of thermal emission with instant temperature and surface roughness are also considered. The validation is done in a W-band gyro-TWT, and the beam performance is evaluated in the experiment. With a pitch factor of 1.06 electron beam, the velocity spread affected by the electric-magnetic mismatch, thermal emission, and roughness is 1.00%, 0.56%, and 0.43%, respectively. The other beam parameters are also presented in the developed module. The OEM could guide and accelerate the testing process and ensure the safe and stable operation of the device.
1. Introduction
The gyro-devices are the primary high-power source in the millimeter-wave band. It is widely used in plasma heating, high-resolution imaging radar, 5G/6G communication, and advanced spectroscopic techniques [1,2,3,4].
The MIG is the crucial component of the gyro-devices, which provides the helical electron beam for the beam-wave interaction. The various types of MIG are investigated by many research institutes. At Karlsruhe Institution of Technology (KIT), series triode MIGs are utilized in the 170 GHz, 2 MW coaxial cavity gyrotron [5,6,7,8]. At the Institute of Applied Physics, Russian Academy of Sciences (IAP-RAS), the cusp gun is applied in the Ka-band [9] and W-band [10] helically corrugated waveguide gyro-TWT. A W-band gyro-TWT with a continuous-wave power of 3 kW, a gain of 54 dB, and a bandwidth of 2.5 GHz were reported. The University of California Davis (UC Davis) has developed the gyro-TWTs with the single or double anode MIG cover X-band [11], Ku-band [12], and W-band [13]. The preliminary test of the W-band gyro-TWT obtained an output power of 140 kW, a gain of 60 dB, an efficiency of 22%, and a bandwidth of 2.2 GHz. The Communication Power Industries (CPI) has developed a W-band gyro-TWT with a double anode MIG that demonstrates a peak power of 2 kW at 40% duty cycle and bandwidth of 6.5 GHz [14,15]. At Beijing Vacuum Electronics Research Institute (BVERI), a W-band TE02 mode gyro-TWT with a triode MIG achieved a peak power of 60 kW, a bandwidth of 8 GHz, and a saturated gain of 32 dB under the 1% duty cycle [16]. At the University of Electronic Science and Technology of China (UESTC), triode and diode MIGs are developed and applied to the gyro-TWTs covering X [17], Ku [18], Ka [19], Q [20], W [21,22], and G bands [23]. A W-band gyro-TWT with a high duty cycle of 40% and a long pulse width of 2 ms, measured a maximum average power of 20.1 kW. The bandwidth over 10 kW is from 94 GHz to 98 GHz except at the point of 96.5 GHz.
Numerous articles have also reported experimental measurements pertaining to beam characteristics such as the beam pitch factor α, transverse velocity spread Δβ⊥, stability, and concentricity. UC Davis has introduced an axial energy beam analyzer to test α and axial velocity spread in the gyro-TWT [24]. At IAP-RAS, investigations into the velocity spread and the oscillatory energy of trapped electrons have been conducted, with results indicating a significant impact on beam parameters [25]. Trapped electron mechanisms and emission inhomogeneity are studied at KIT, where experimental results suggest a correlation between gyrotron performance and the presence of trapped electrons [26,27,28]. Massachusetts Institute of Technology (MIT) explored low-frequency oscillation in a 1.5 MW, 110 GHz gyrotron, measuring oscillations in the range of 165–180 MHz with a capacitive probe [29]. At Huazhong University of Science and Technology (HUST), an 800 GHz gyrotron prototype with a sapphire window was developed to examine the correlation between misalignment and beam trajectory. The blue-violet spot resulting from the beam bombardment on the sapphire serves allows measurement of the beam’s tilt angle and displacement distance [30]. To the authors’ knowledge, there are presently no reports on real-time online evaluation systems for beam status due to the complex operating environment of the gyro-devices, characterized by high vacuum, high voltage, and high magnetic fields. The currently reported methods for measuring beam performance are all based on experimental data obtained in prototype tubes, and the associated devices are relatively expensive and time-consuming.
Due to gyro-TWT processing and assembly errors, the MIG operates under inappropriate parameters, causing the beam state in the experiments to deviate from the simulation. The discrepancy can significantly impact device performance. (1) In high-frequency gyro-TWTs, especially those in the W-band and above, undesirable magnetic field distributions can induce substantial changes in beam pitch factor, velocity spread, and beam guide radius R0. (2) Given the thermal cathode structure adopted by the gyro-TWT, an irrational temperature distribution leads to the generation of ionized or sideband-emitted electrons. (3) Excessive cathode surface roughness contributes to an increased velocity spread. Moreover, operating parameters are scanned to identify optimal conditions in previous experiments.
In our group of UESTC, a previously developed automatic test system (ATS) for gyro-TWT [31,32], has proven effective in accomplishing automatic data acquisition during high average/continuous-wave power operation experiments. To enhance the performance and testing efficiency of the gyro-TWT, a beam status online evaluation module (OEM) technology is built upon the ATS. (1) A comprehensive discussion on the impact of electric-magnetic field mismatch, thermal emission spread, and surface roughness emission spread on beam status is conducted, aligning the simulation data more consistently with experimental results. (2) The MIG is remodeled with actual conditions, enabling real-time acquisition of beam status information through the OEM. Utilizing feedback on beam state, external factors affecting beam quality, such as compensation magnetic field, SCM concentricity, and gyro-TWT position, are further adjusted to quickly reach the best performance. (3) A visualization interface is proposed based on the analysis. The OEM technology is validated in a W-band gyro-TWT, and experimental results indicate that the device operates stably for a long time under high power conditions. In comparison with existing testing methods, the proposed OEM technique can calculate the beam quality of the gyro-TWT under various operating conditions in real-time. Furthermore, the OEM technique is universally applicable to all dielectric-loaded gyro-TWTs developed by our group and has undergone experimental verification across the X-band to G-band [17,18,19,20,21,22,23].
2. Building of Online Evaluated Module
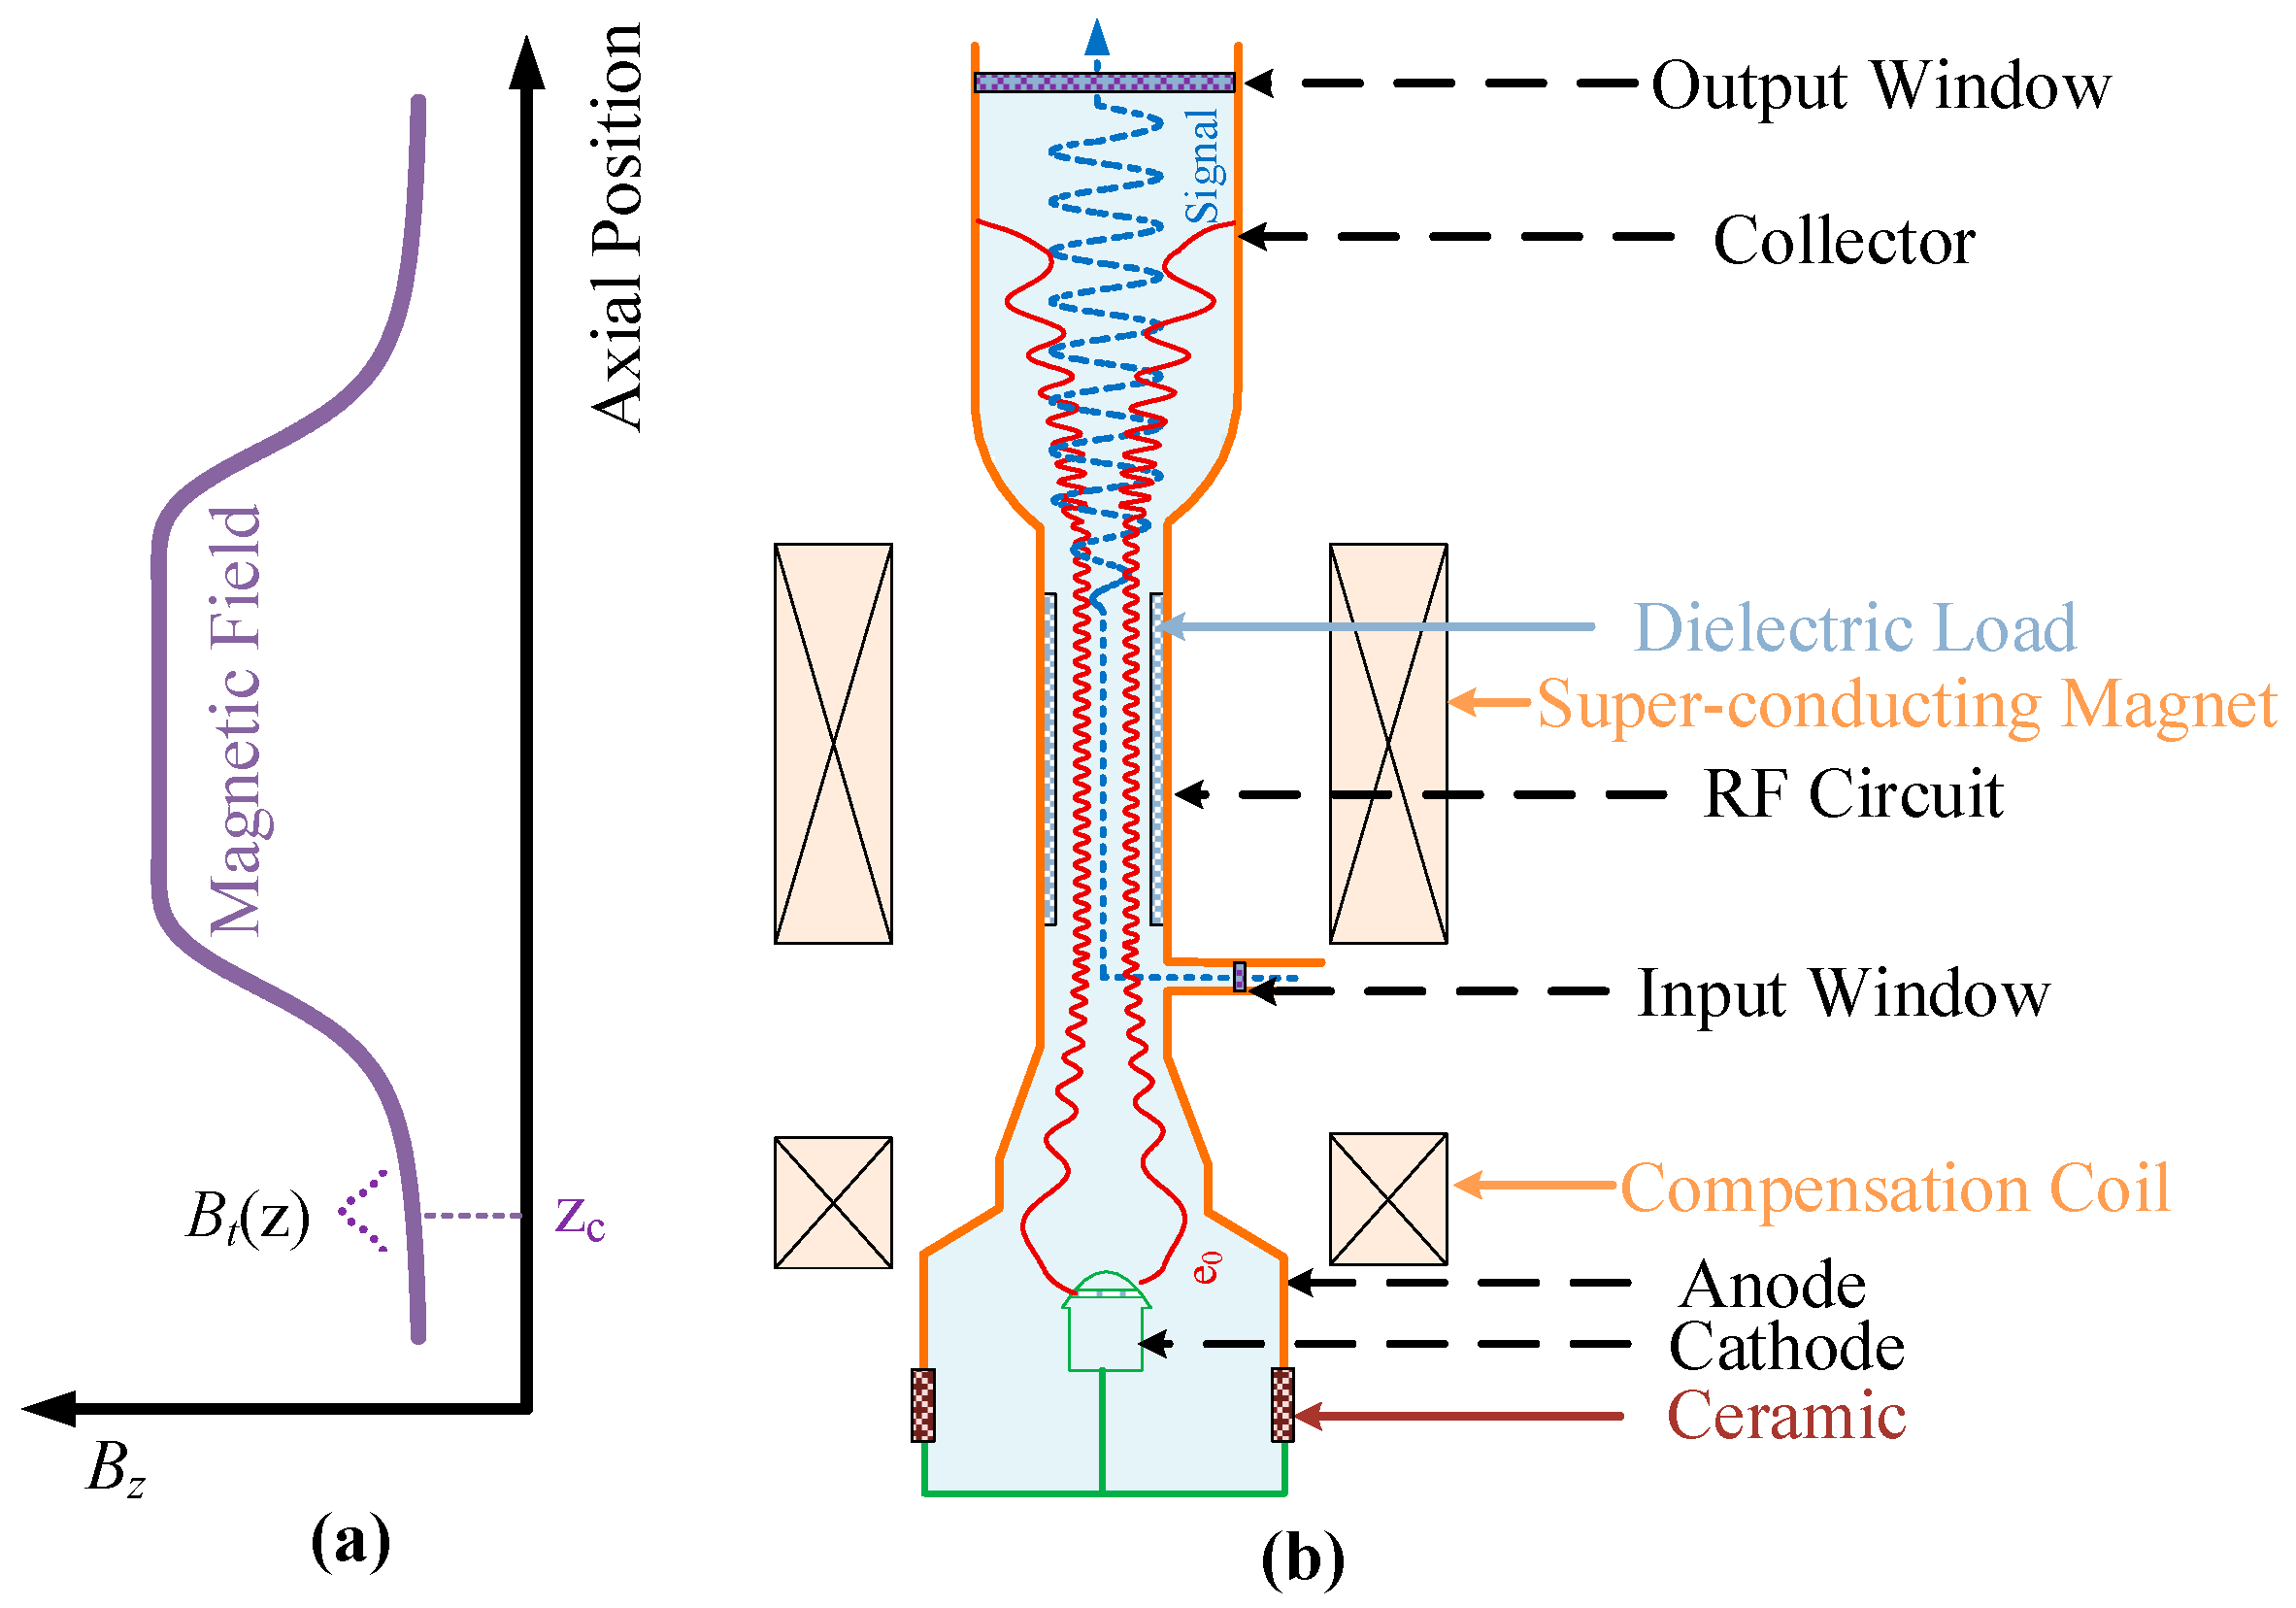
The schematic of the dielectric-loaded gyro-TWT with a single anode MIG is shown in Figure 1. The gyro-TWT mainly consists of the MIG, RF circuit, collector, input and output system. The magnetic field consisting of a super-conducting magnet (SCM) and compensation coil (CC) guides the helical electron movement. The helical beam is emitted from the cathode and passes through the acceleration and adiabatic compression ranges in the MIG. Then, the beam is transmitted to the RF circuit to interact with the microwave and finally recovered by the collector. The compensation coil is applied to adjust the magnetic field at the cathode to control the final α.
The transverse velocity of the electron at the interaction region β⊥ can be roughly estimated by Equation (1) [33].
Here γ is the relativistic factor, θc is the emission angle, which is determined by the distribution of the electric and magnetic fields. Fm is the magnetic compression ratio. Ec and Bc are the electric and magnetic fields at the emitter, respectively. The detailed status and trajectory of the beam can be calculated by electron optics software EGUN V3.799.
The factors influencing the velocity spread in the experiment can be classified into three types which are static electric and magnetic field mismatch (Δβ⊥)mis, surface roughness (Δβ⊥)rough, and thermal emission spread (Δβ⊥)thermal. The total transverse spread Δβ⊥ can be evaluated by Equation (2) [33].
The (Δβ⊥)mis is caused by the Ec and Bc distribution on the cathode and could be calculated by Equation (3). Here n is the number of electrons. The lower (Δβ⊥)mis can be guaranteed by adjusting the Ec and Bc at the emitter, which could be optimized in the electron optics design.
However, the other two mechanisms are not considered during the electron trajectory analysis. They can be evaluated by Equations (4) and (5) [34].
Here e and m0 are the electron charge and mass. Tc is the emitter temperature, and k is the Boltzmann constant. Ra is the radius hemispherical bump on the cathode surface.
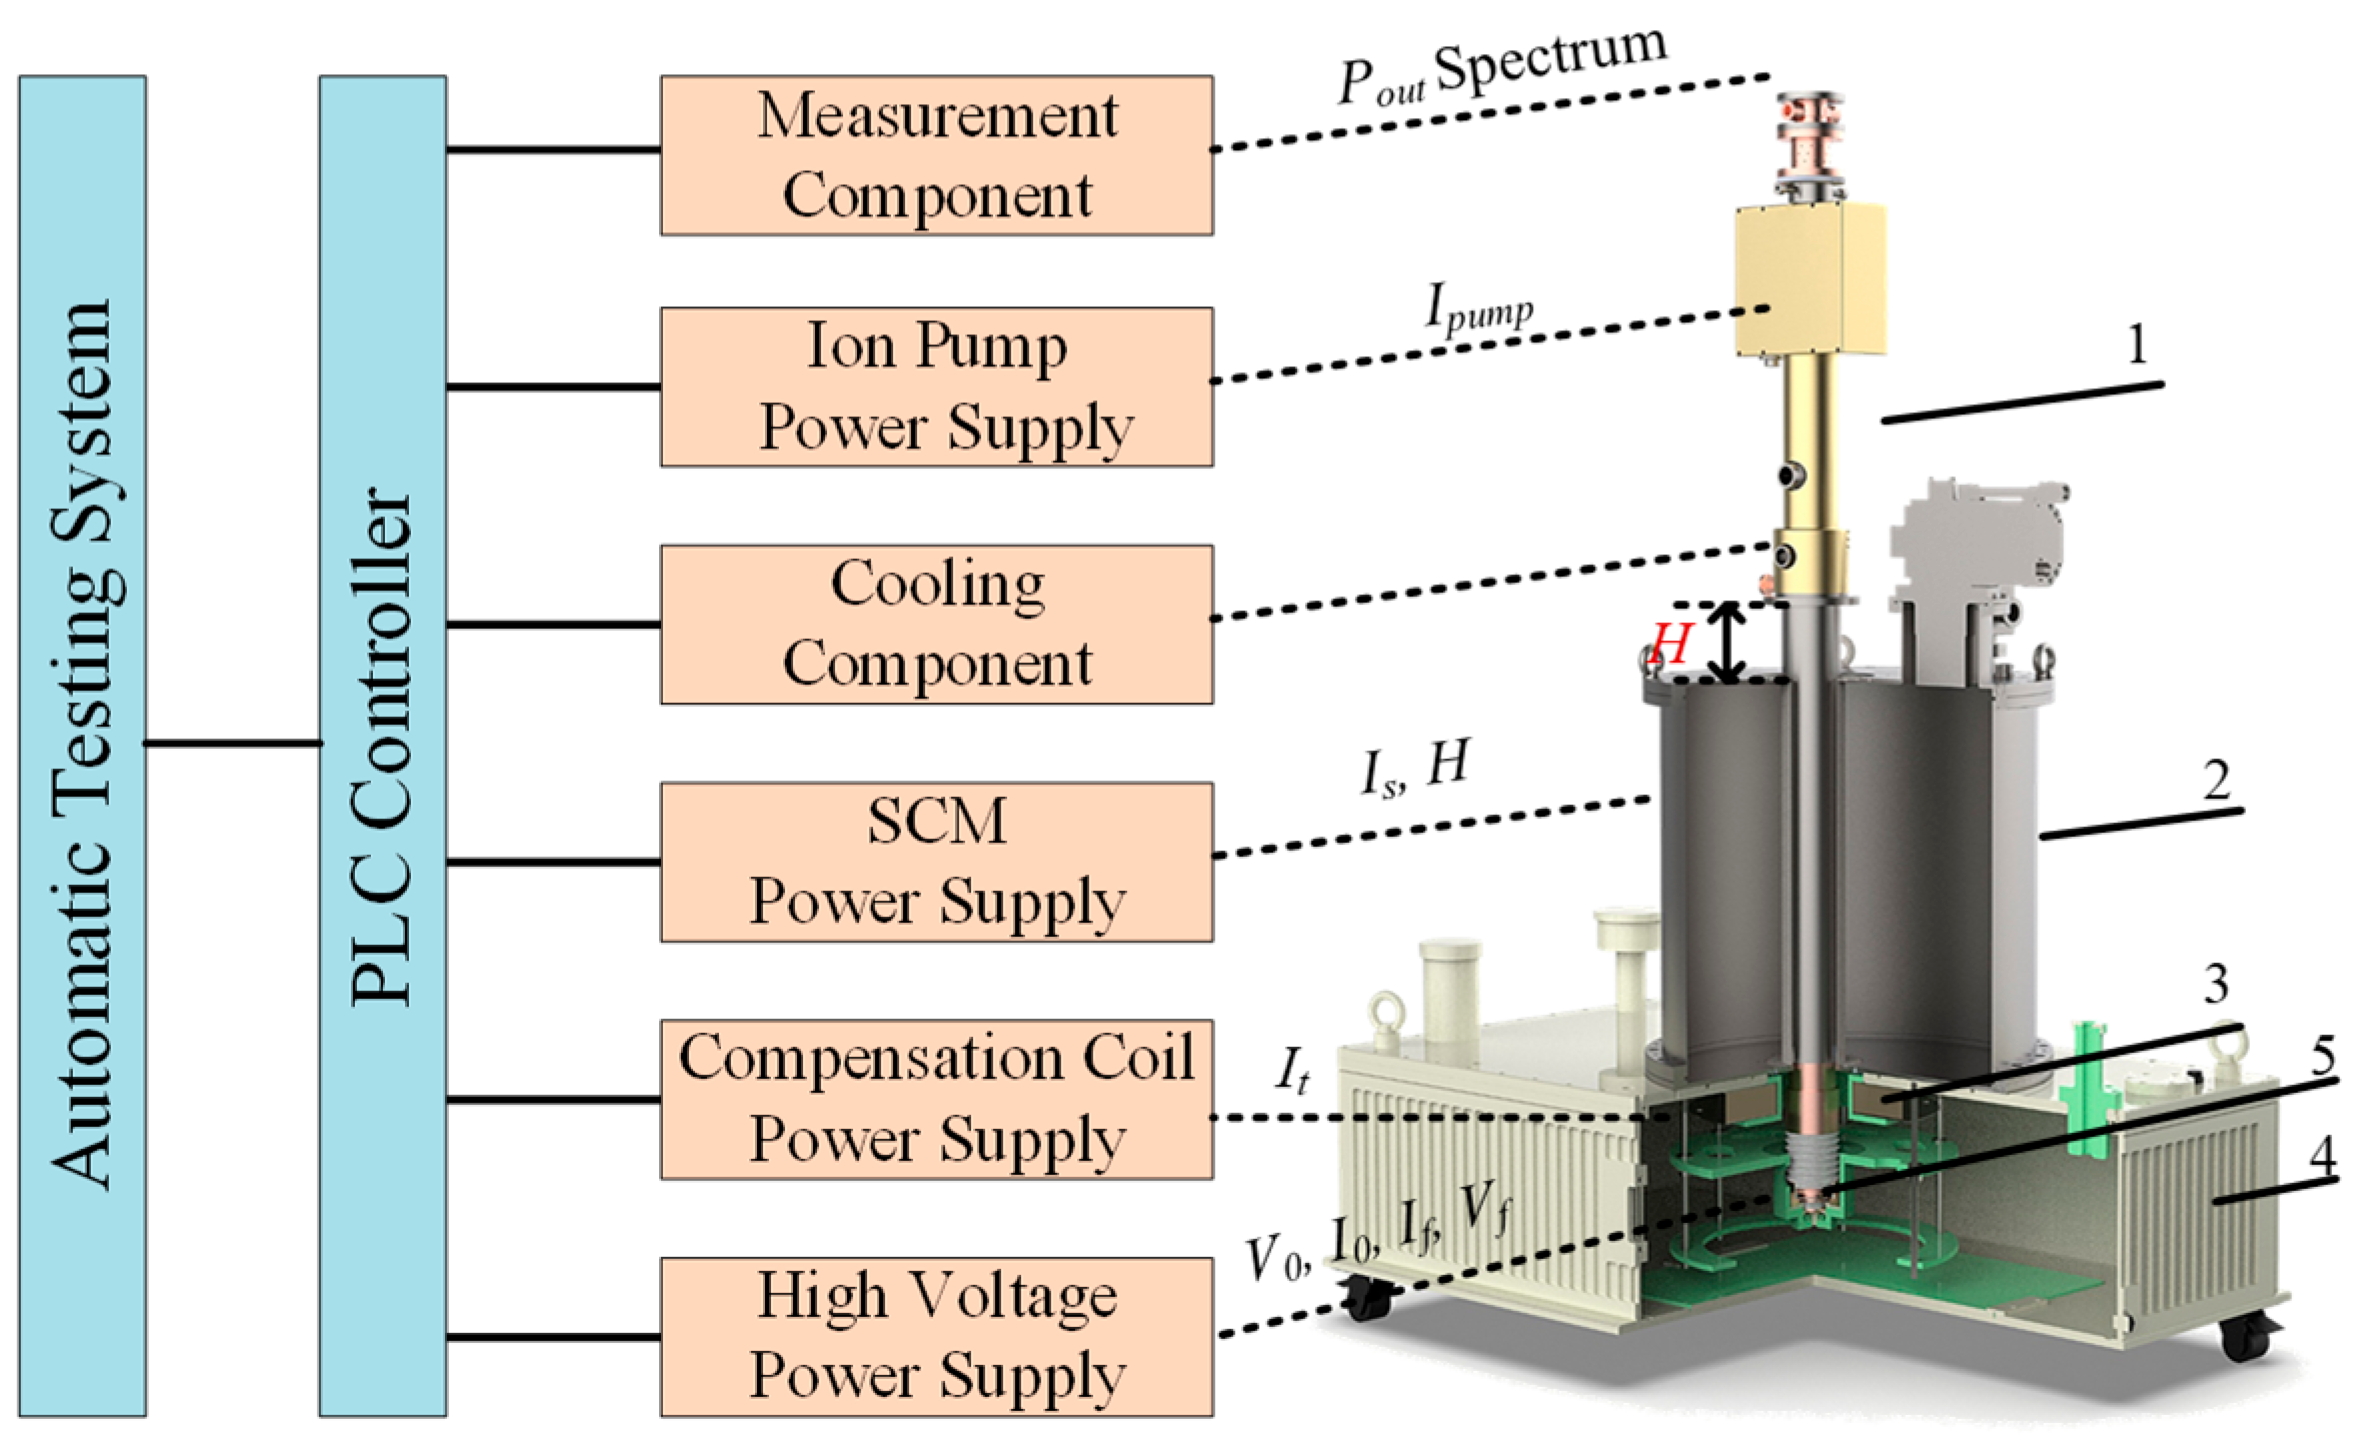
The experimental test system setup of gyro-TWT is shown in Figure 2. The testing process and parameters related to MIG are discussed here. The ATS controls the test instruments through the programmable logic controller (PLC). (1) The power supply provides the filament voltage (Vf) and filament current (If), which could heat the cathode. (2) The voltage on the cathode is V0, then the beam current I0 is emitted. (3) The magnetic field amplitude is determined by the SCM current (Is) and CC current (It). The relative axial position between gyro-TWT and SCM (H) is adjusted to change the relative magnetic ratio for the RF circuit and MIG. (4) The beam obtains a special α at the entrance of the RF circuit, then interacts with the microwave. The water load is a crucial component of the power detection device. By monitoring the liquid temperature, the output power of the gyro-TWT can be calculated. The frequency was measured by the spectrometer. The optimal output status of the gyro-TWT will be achieved by sweeping parameters like H, V0, I0, and Bz.
The deviated parameter from the MIG design can lead to an unknown beam status. So, the beam status is necessary to be evaluated to guide the test. In the experiment, the gyro-TWT is tested under the control of ATS, the experimental data such as beam voltage, beam current, and magnetic field are automatically acquired by the ATS and stored in the database. Then, combined with the data, such as temperature, and fabrication size of MIG, measured before assembly, the beam status of MIG is calculated by OEM. The specific implementation details of OEM technology are discussed below.
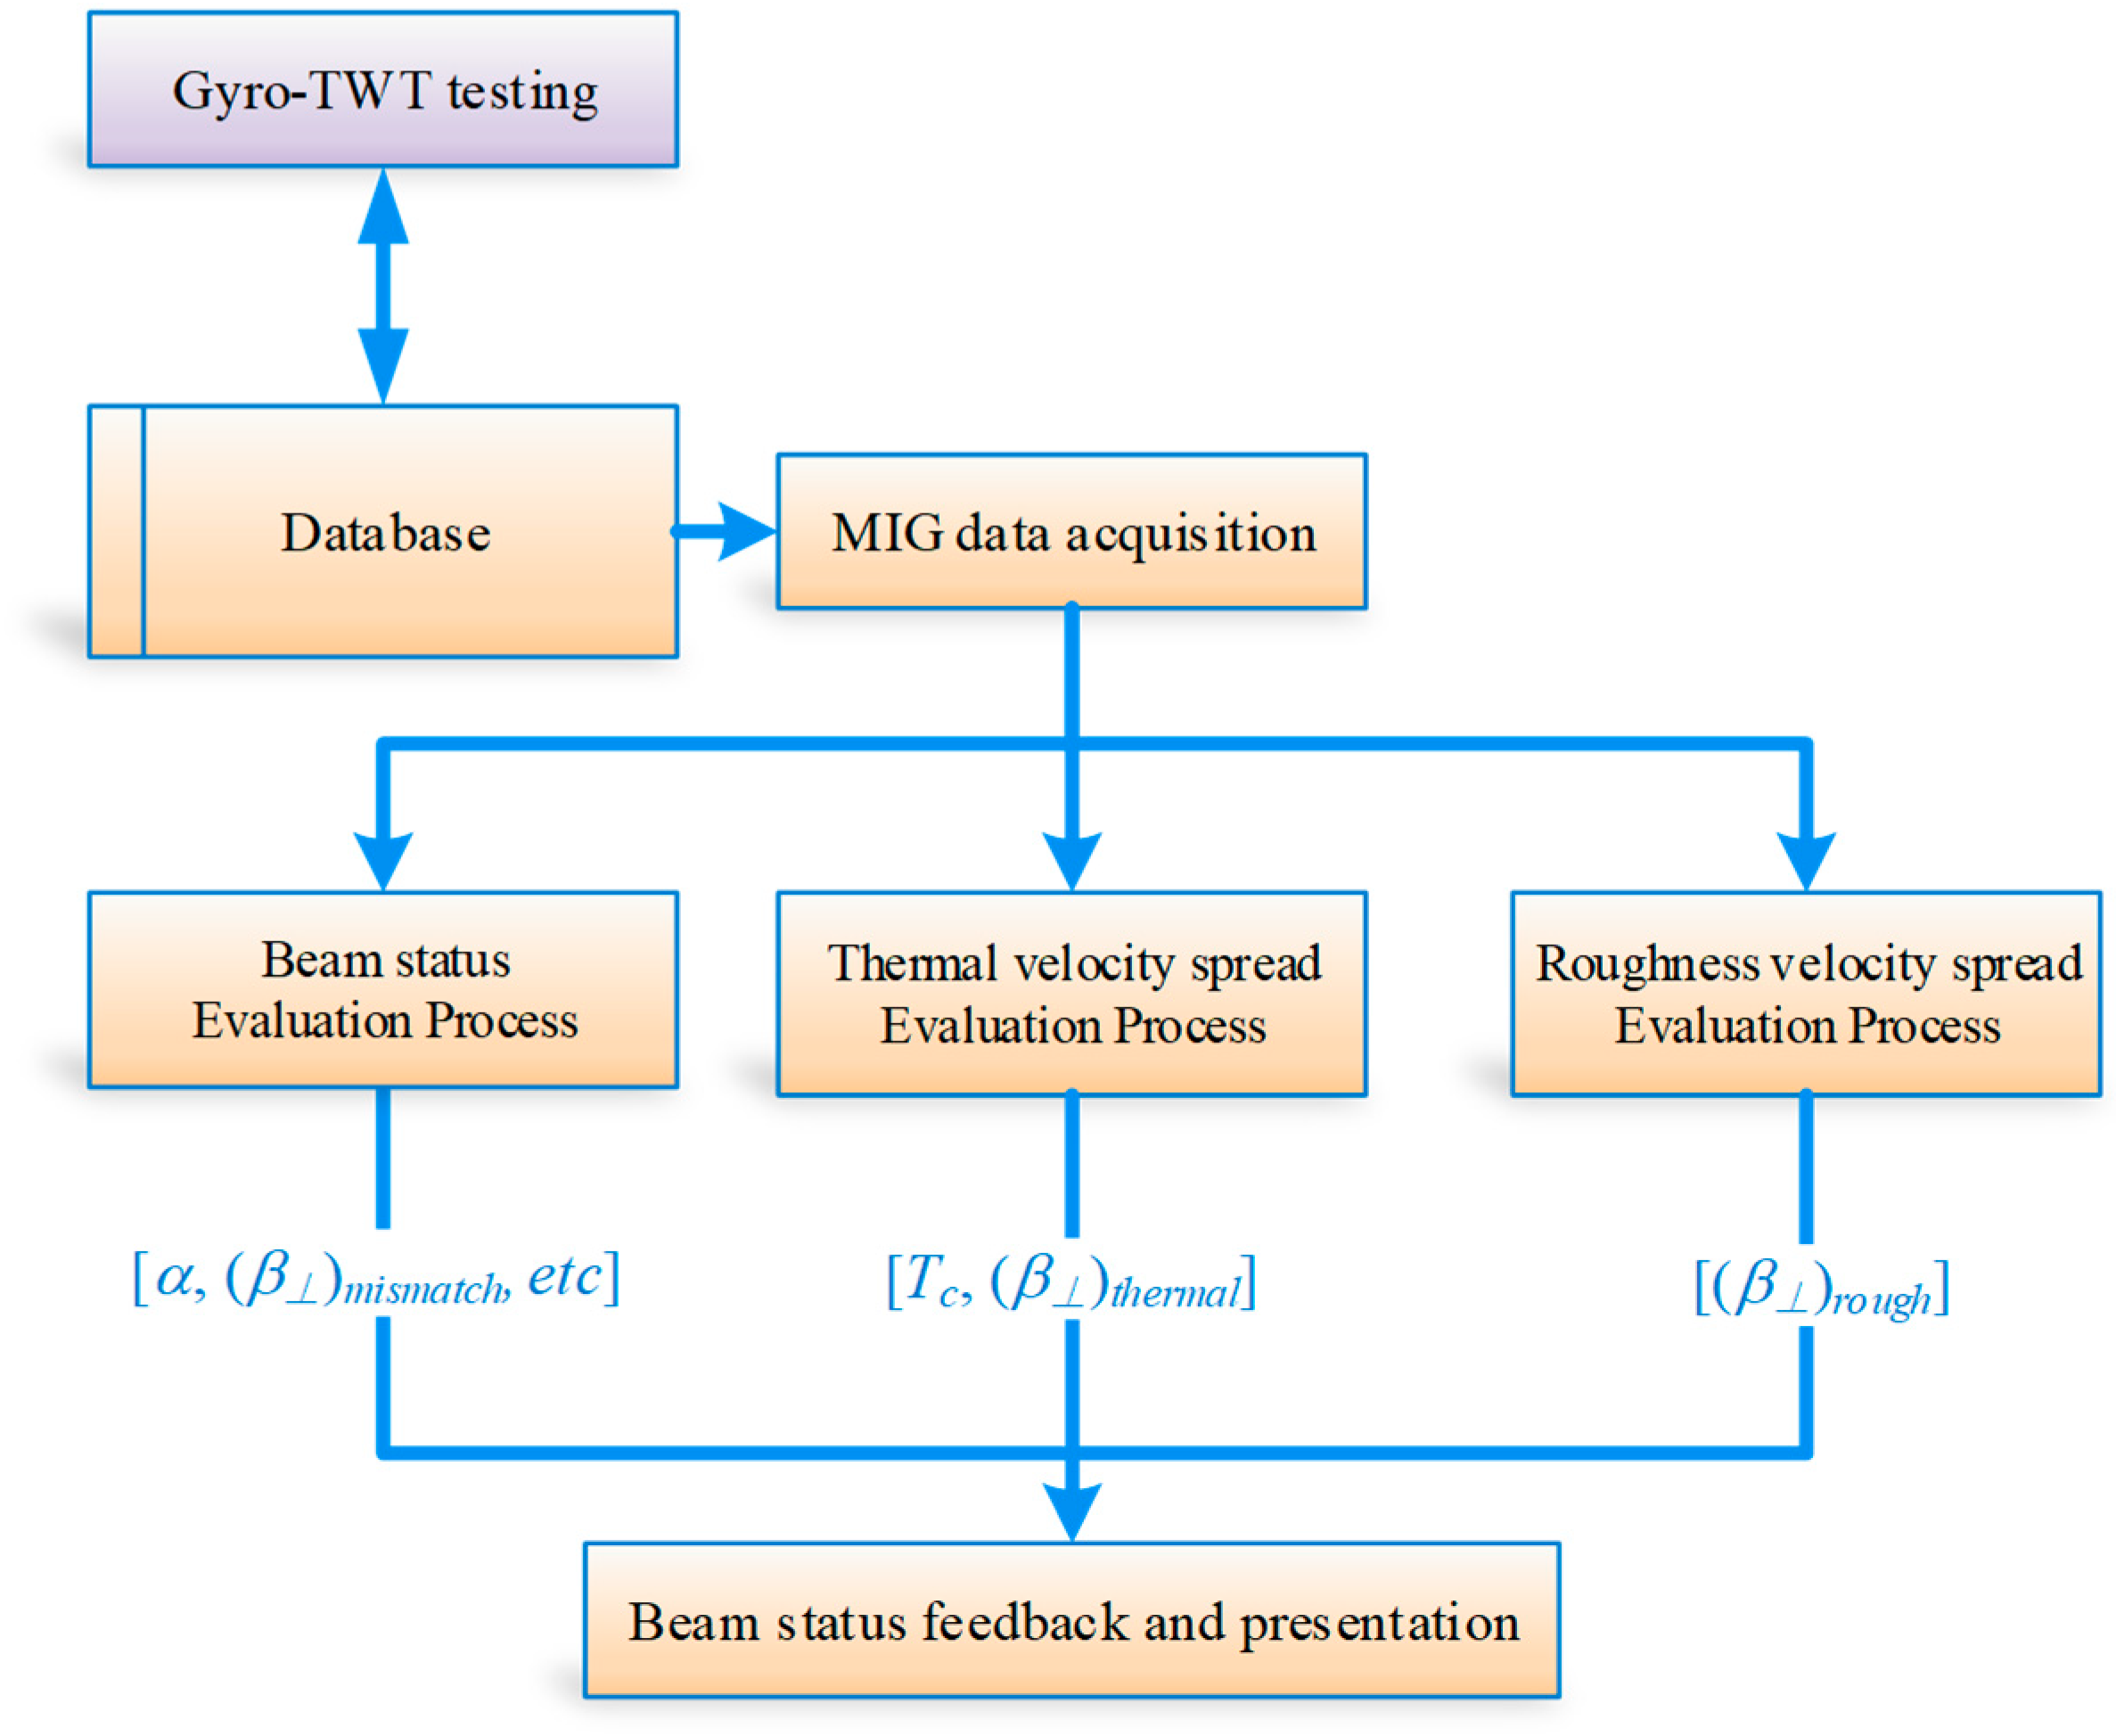
As shown in Figure 3, when the testing status changes, the OEM reads the operating parameters and then simulates and calculates the new beam status. (1) The electric and magnetic fields for the operating MIG are rebuilt according to instant operating parameters. Then, the trajectory is quickly simulated by the electron optics software. The beam status, such as α, (Δβ⊥)mis, R0, is evaluated. (2) The instant Tc is evaluated, and (Δβ⊥)thermal is calculated. (3) Read the roughness data and calculate (Δβ⊥)rough. Finally, the beam status is online feedback and presented to the tester. The results calculated by OEM can represent the actual beam status in the experiment. With reference to the assessed beam quality, adjustments to input parameters, such as H, V0, I0, and Bz, are made to further enhance the device’s performance while ensuring safe operation.
Due to the requirement for quick feedback, some complex experimental statuses are simplified in OEM. (1) The 2D electric optics software is utilized. The axisymmetric misalignment induced by installation between gyro-TWT and SCM is ignored. (2) The trapped electron from magnetic adiabatic compression is considered, but those from ionization and secondary electrons are neglected. Although the above effects on electron performance are not considered, it has little effect on the status of the main electron beam. The evaluation could also support the optimal status searching of gyro-TWT in the experiment. The detailed process is discussed below.
2.1. Online Trajectory Simulation and Evaluation
The online electron trajectory simulation is realized based on the electron optics software EGUN. The trajectory simulation needs the MIG geometry, operating electric parameters, and magnetic field distribution. The OEM communicates with the testing system and instantly achieves related data, such as the fabrication data, V0, I0, Is, It, and H.
The detailed online simulation and evaluation process of the beam status is shown in Figure 4. First, the MIG geometry is updated based on the fabrication error of each part and axial deviation in the assembly. Then, it is transferred to the simulation input files.
Second, the actual operating V0 and I0 fluctuate over time. The instantaneous values of those parameters are applied in the online simulation.
Third, the magnetic field distribution is determined by the SCM and CC, as shown in Figure 1a. Is and It is the current of SCM and CC. The operating distribution is the linear combination of these two coils and could be calculated by Equation (6). Here Bs(z) and Bt(z) are the normalized magnetic distribution of SCM and CC.
Then, we need to confirm the Bc of MIG. The magnet plant is set as the base point. The gyro-TWT will axially displace to adjust the magnetic field of the RF circuit or MIG. The cathode position in the magnetic field also varies. The cathode coordinate zc could be calculated by Equation (7).
Δz is the distance from the beam emitting strip of the cathode to the gyro-TWT reference point. And the magnetic compression ratio Fm could be calculated by Equation (8). Then, the cathode coordinate is confirmed in the magnetic field.
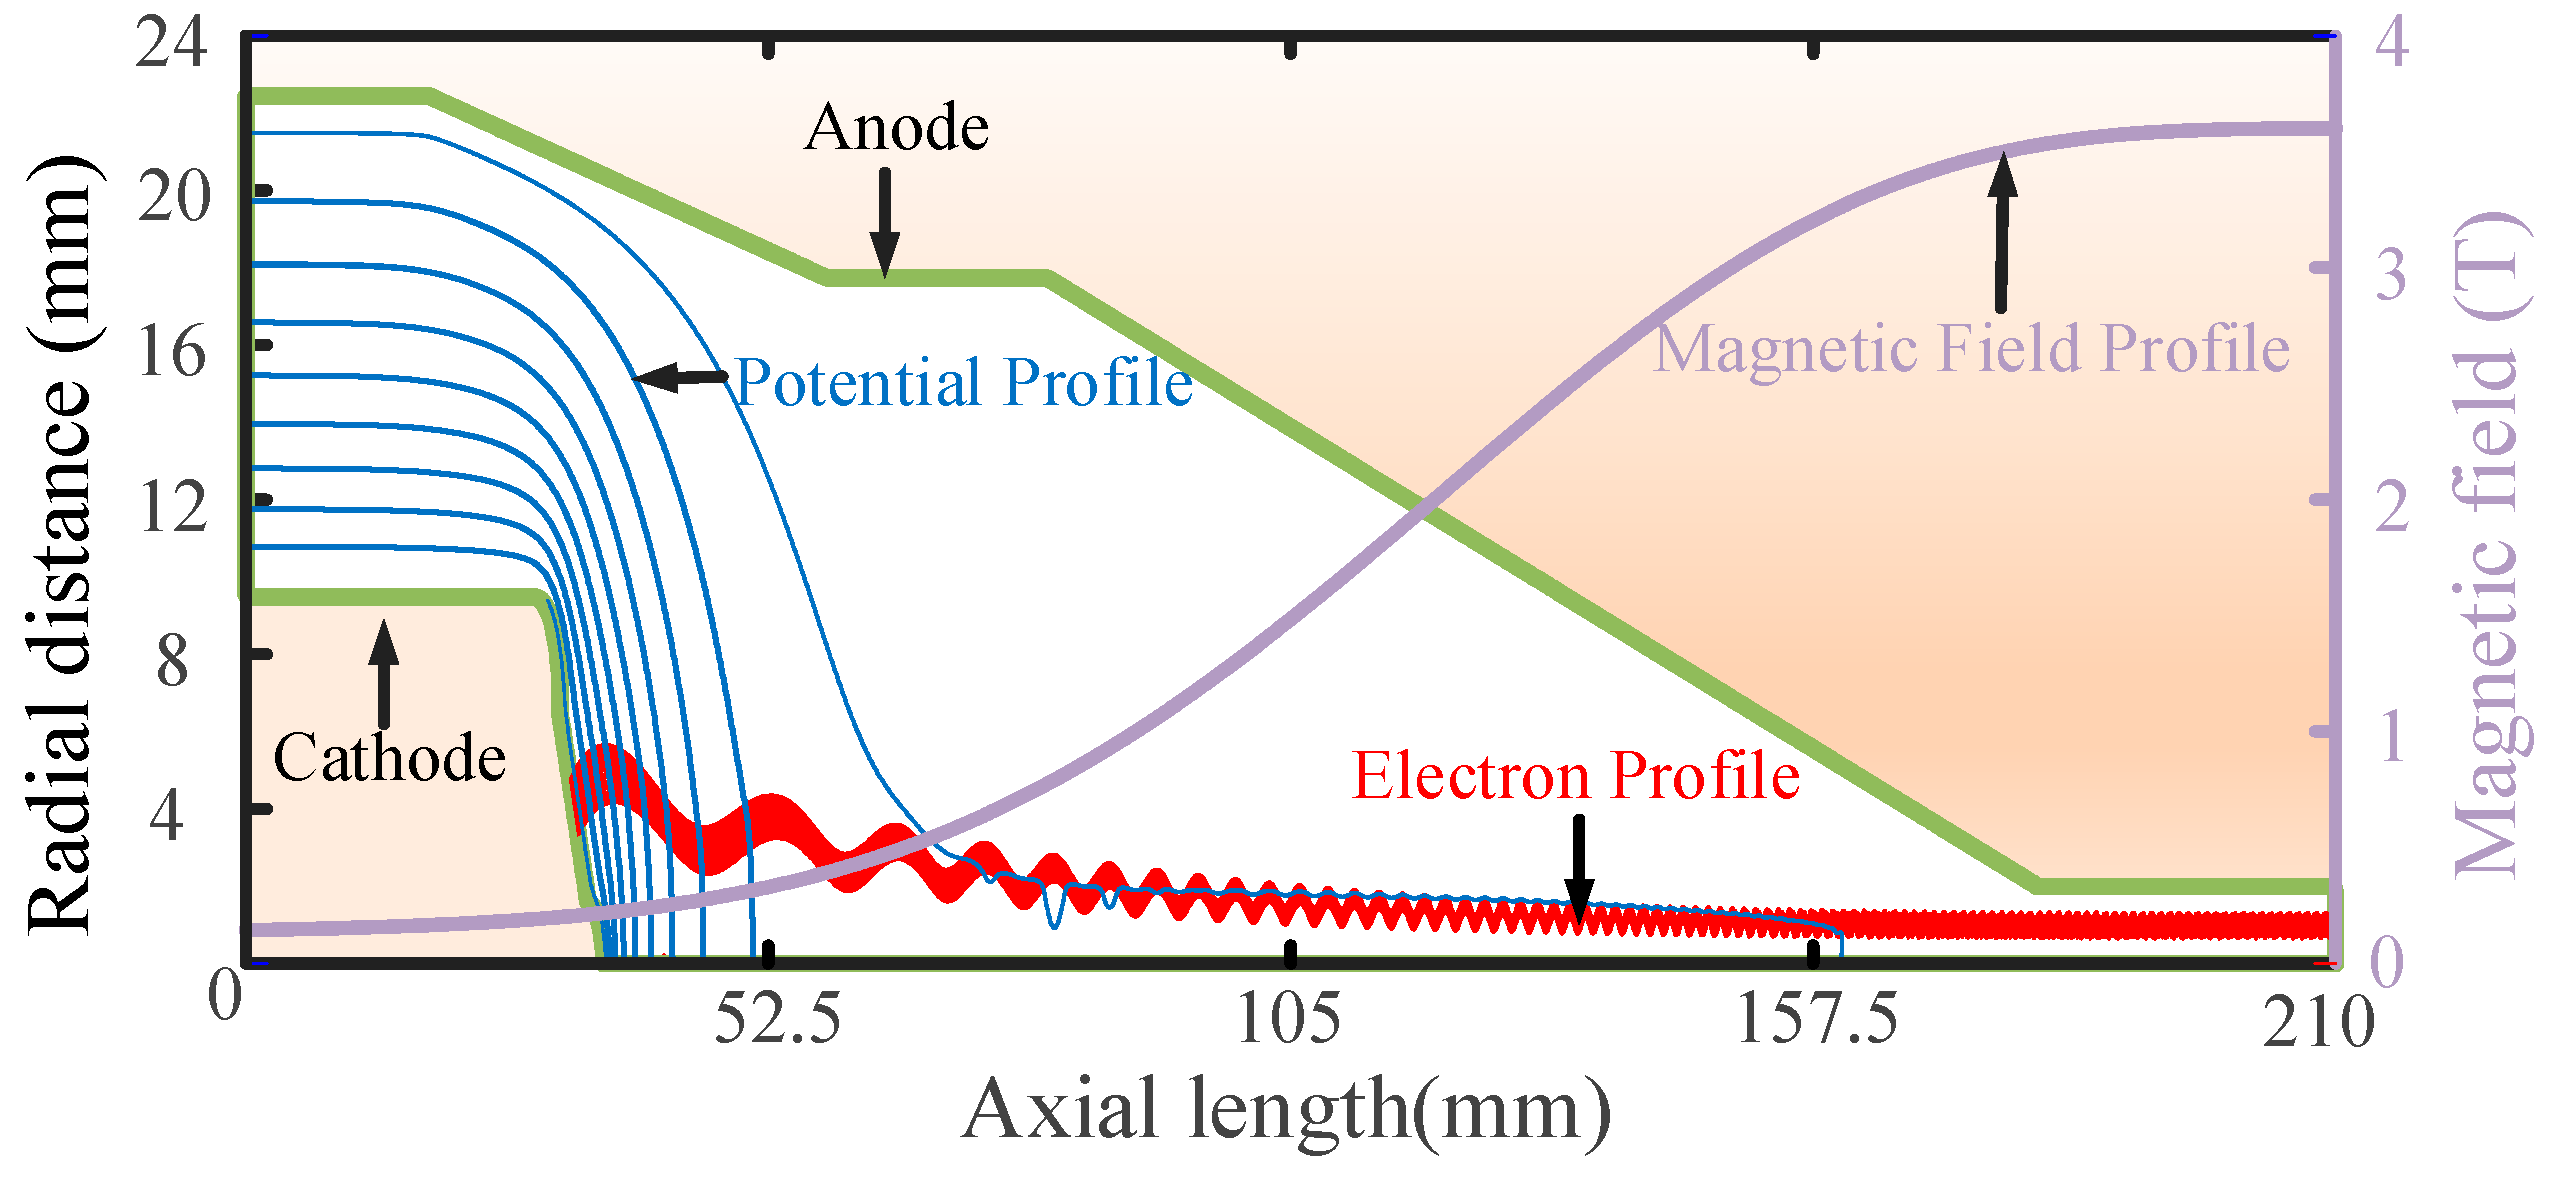
After all of the above data is written to the input files, the trajectory simulation automatically runs. After several seconds, the electron trajectory is given, as shown in Figure 5. The instant beam parameters such as α, (Δβ⊥)mis, R0, and Larmor radius (RL) can be calculated.
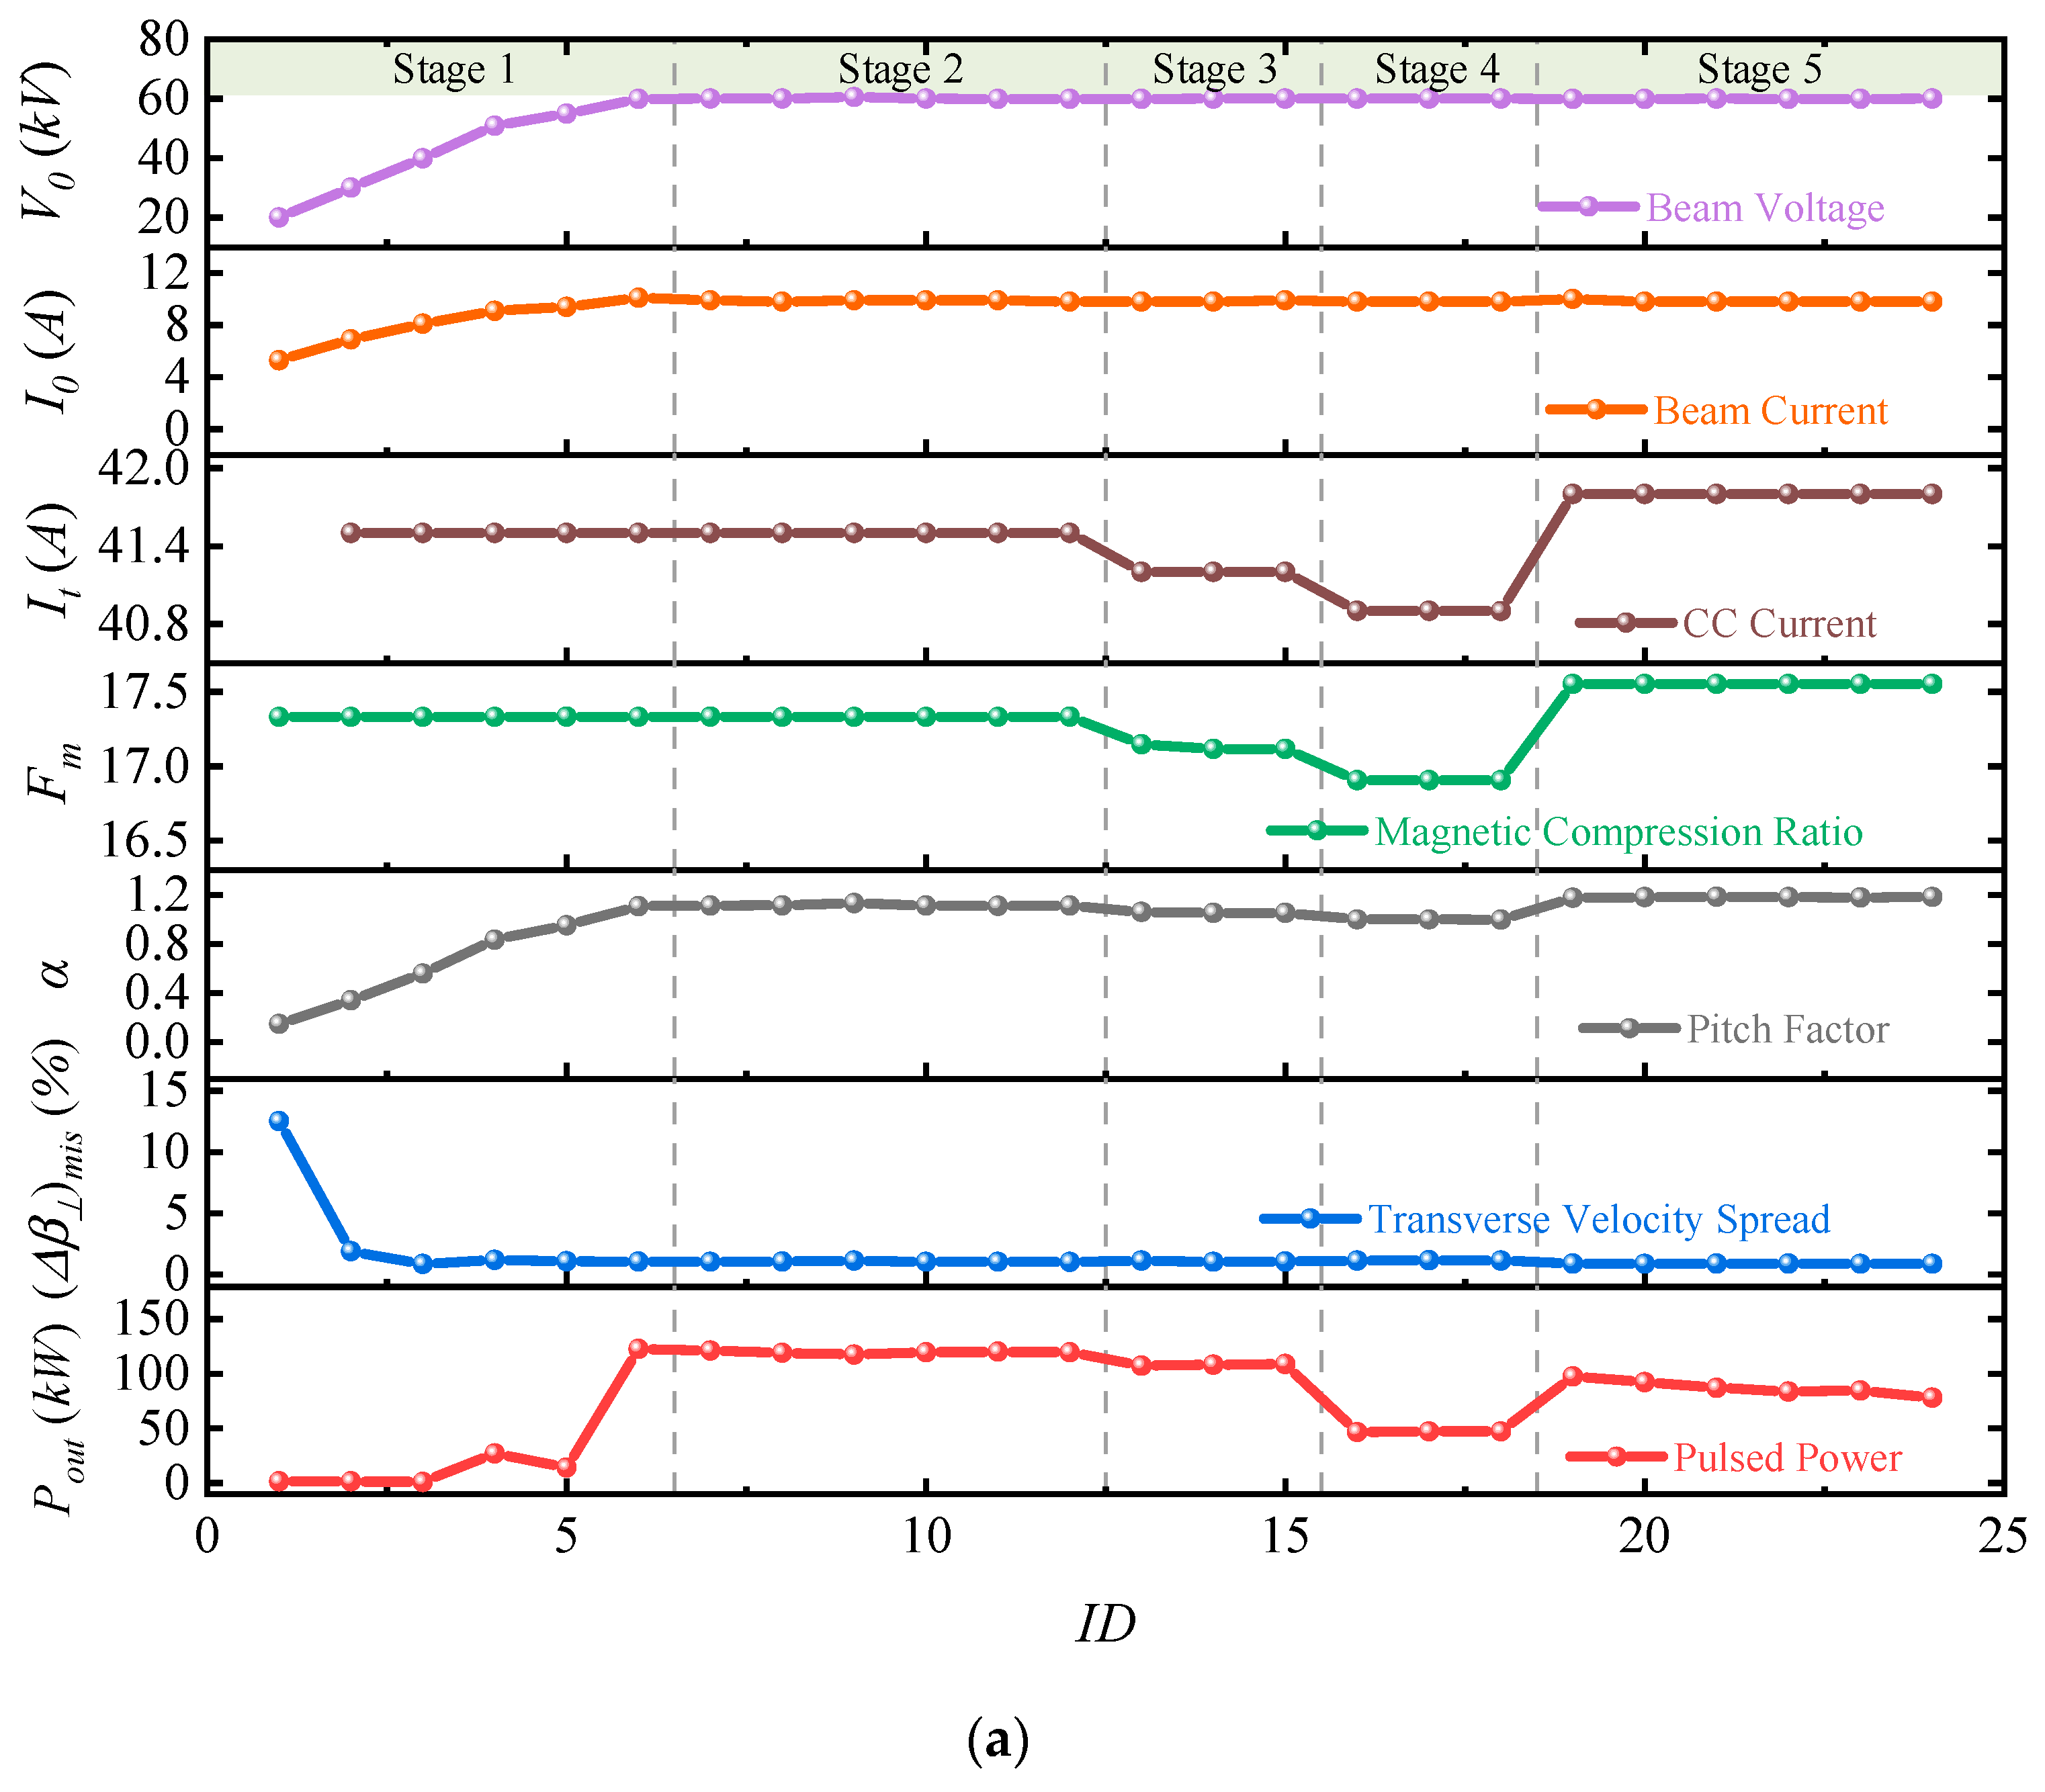
The developed online evaluation process was utilized and validated in a W-band gyro-TWT experiment. Figure 6a gives the beam status variation in testing by online simulation. The changing of V0, I0, It, Fm, α, (Δβ⊥)mis, and peak output power (Pout) are presented. V0, I0, and It were read from the testing system instantly. Pout and spectrum were measured by a high-power water load and spectrometer, respectively. Fm, α, (Δβ⊥)mis are calculated by the OEM.
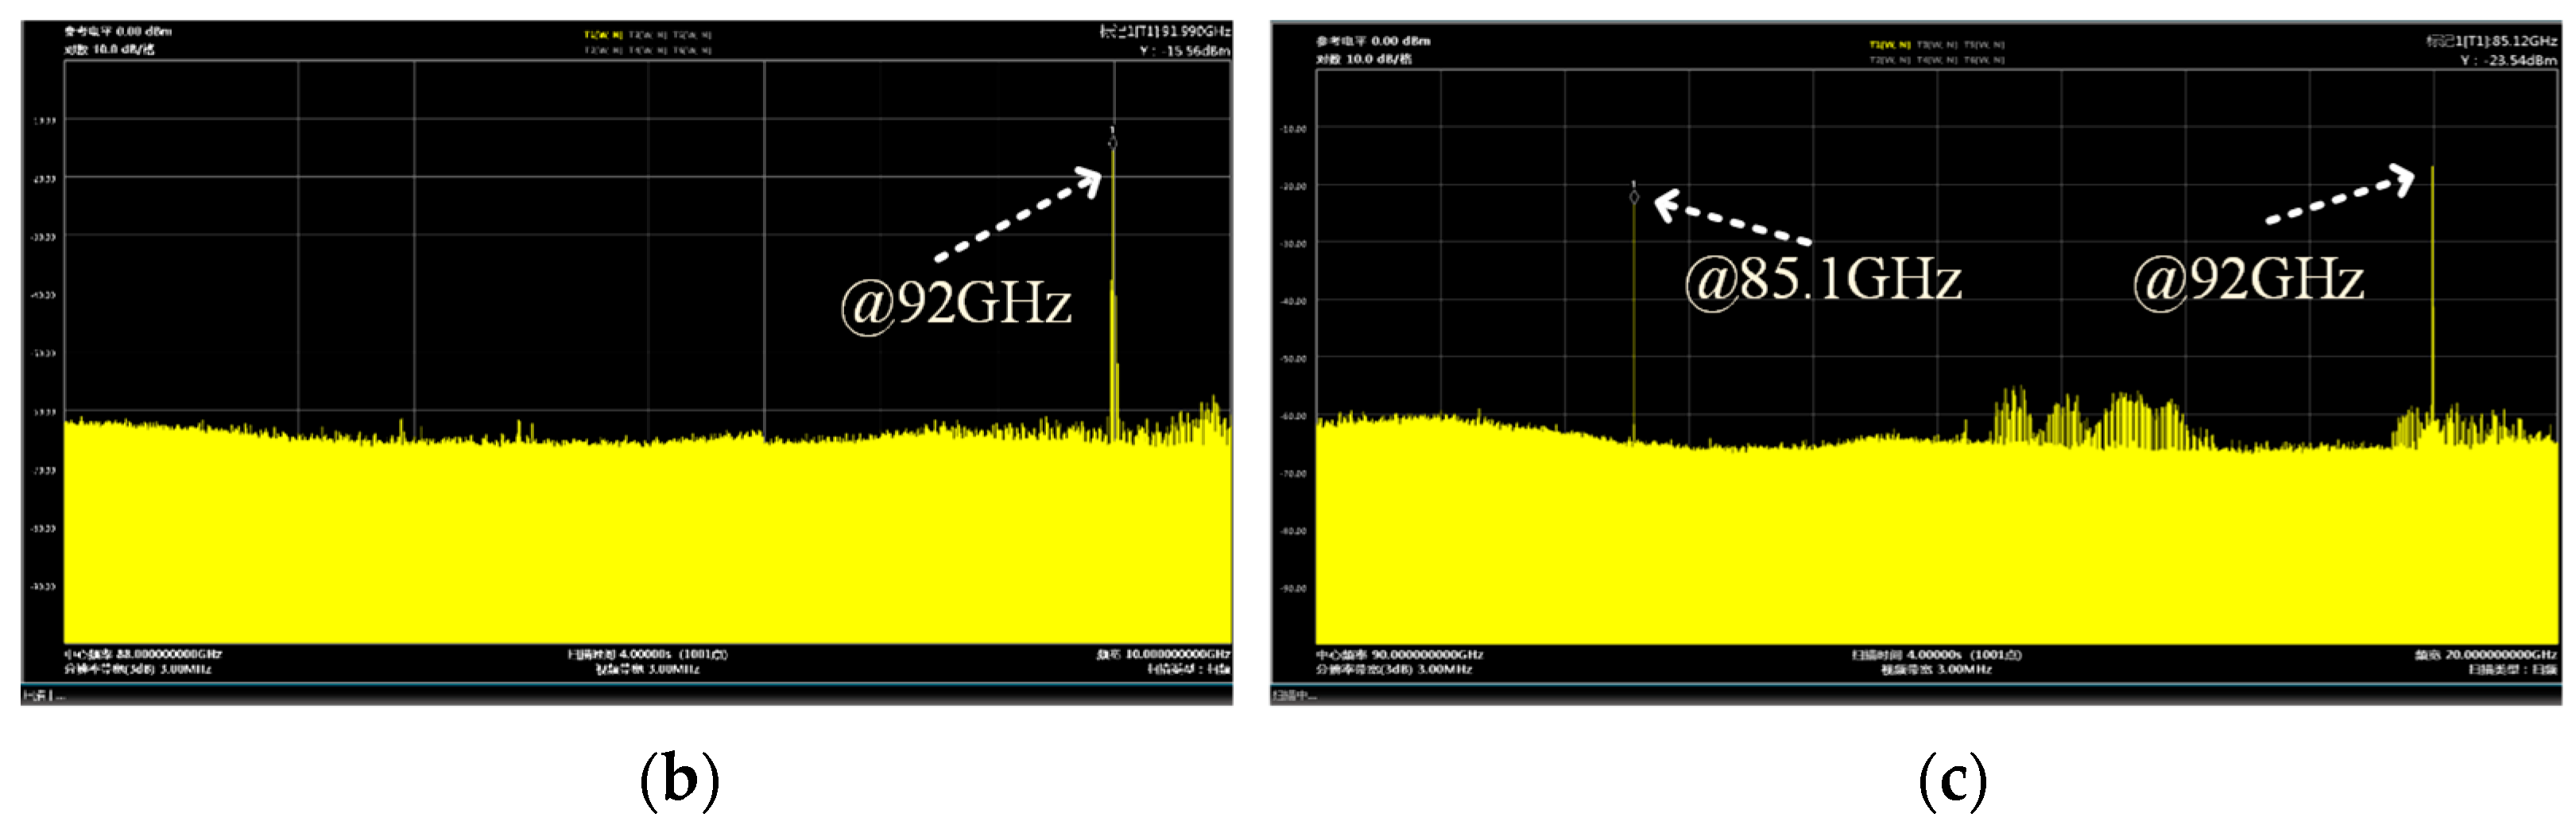
At Stage 1, V0 was applied gradually to the MIG, leading to a concurrent increase in both I0 and α. Upon reaching Stage 2, V0 and I0 attained the designated working values, with an evaluated α of about 1.11 and a measured Pout of 122 kW. The gyro-TWT operated stably, and the spectrum of the output signal was pure, as depicted in Figure 6b. Moving to Stage 3 involves adjusting It to modify Fm, causing a reduction in α to 1.05. Correspondingly, Pout decreased to 108 kW. At stage 4, α was further diminished to 1.0, leading to a rapid reduction in Pout to 47 kW. However, at stage 5, due to the increase in compensation current, the beam pitch factor increases, resulting in oscillations and power degradation. The corresponding oscillation frequency was noted to be at 85.1 GHz, as shown in Figure 6c. The realization of online beam status evaluation in the experiment enhances the transparency and safety of the testing process. It should be noted that the beam–wave interaction status of the gyro-TWT is not at the optimal frequency point for testing the evaluation module.
2.2. Thermal Emission Spread Evaluation
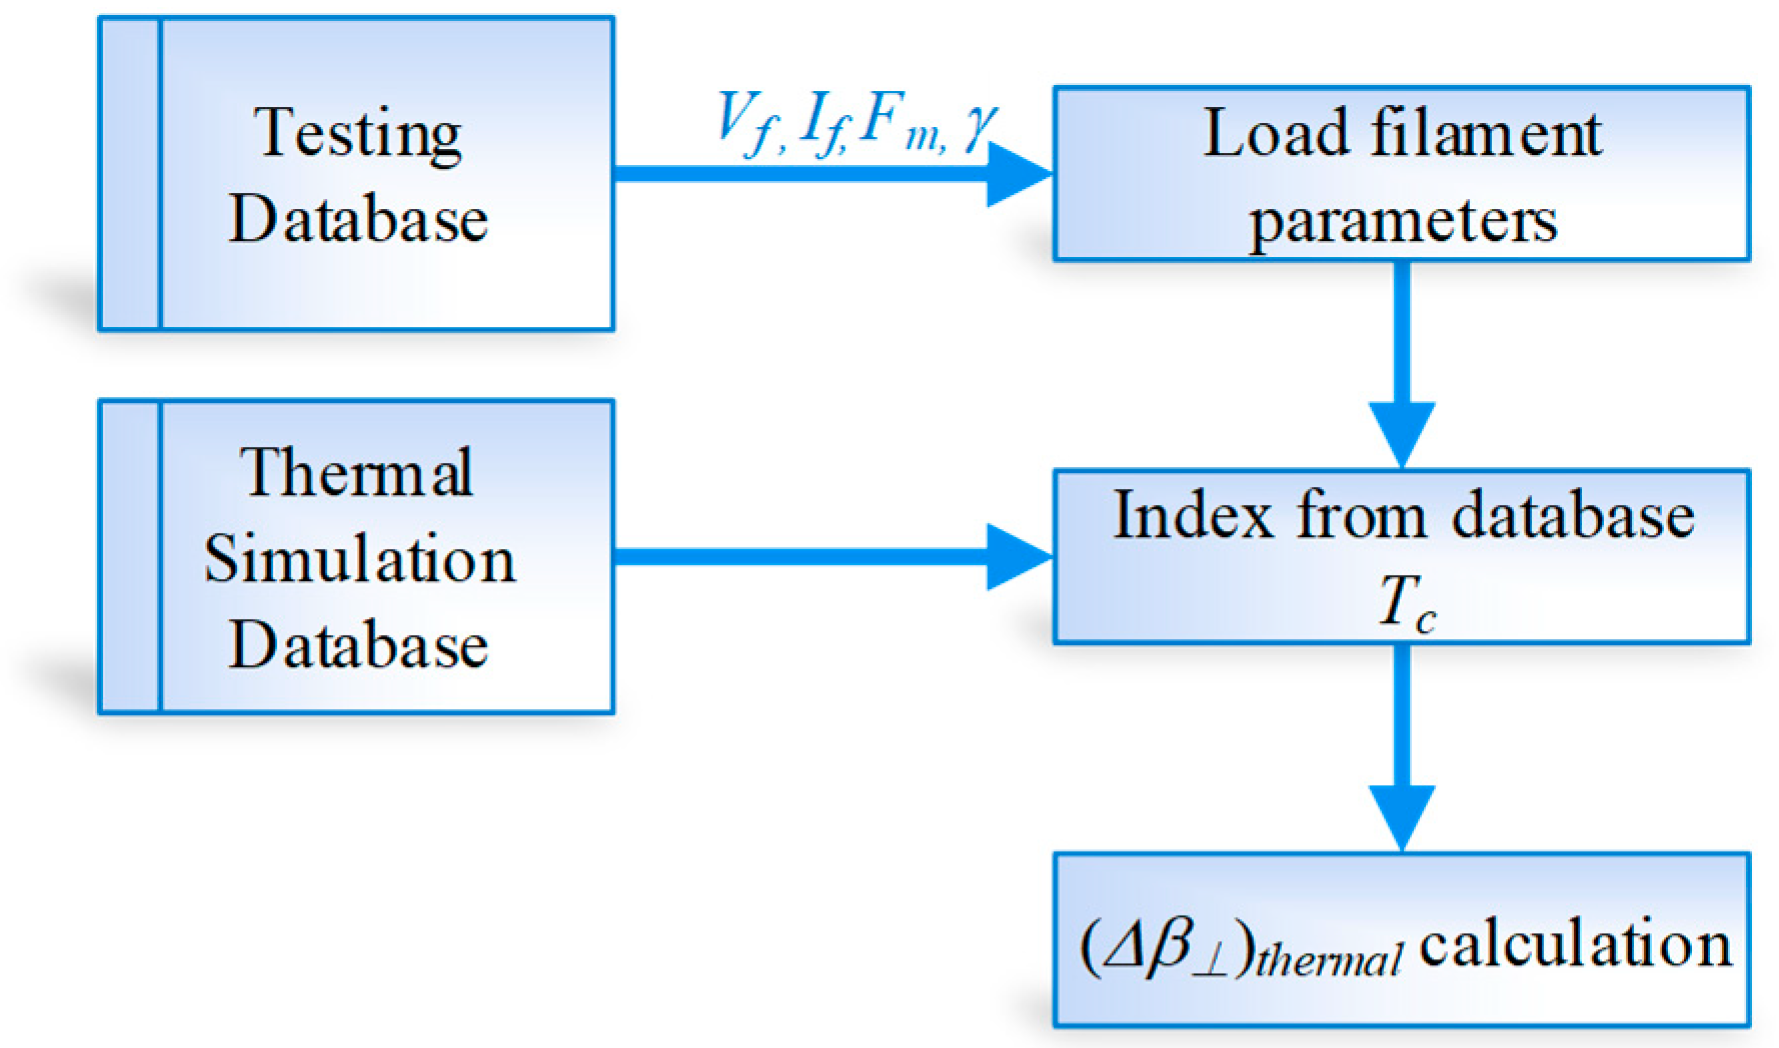
A thermal cathode structure is employed in the gyro-TWT, and the beam quality was influenced by the temperature distribution of the cathode, as mentioned in Equation (4). An inhomogeneous temperature distribution on the cathode surface can give rise to phenomena such as sideband electron emission, making the device unable to operate stably. The emitter operating temperature Tc is about 1050 °C. However, the actual Tc was hard to detect because of the vacuum environment and high voltage in an enclosure MIG. The temperature evaluation method by heating power (Pheat) is utilized. The detailed process flow is shown in Figure 7. The relationship between Tc and Pheat was simulated and stored in the database. Then, according to the instant Vf and If, Tc was evaluated. Finally, the (Δβ⊥)thermal was calculated.
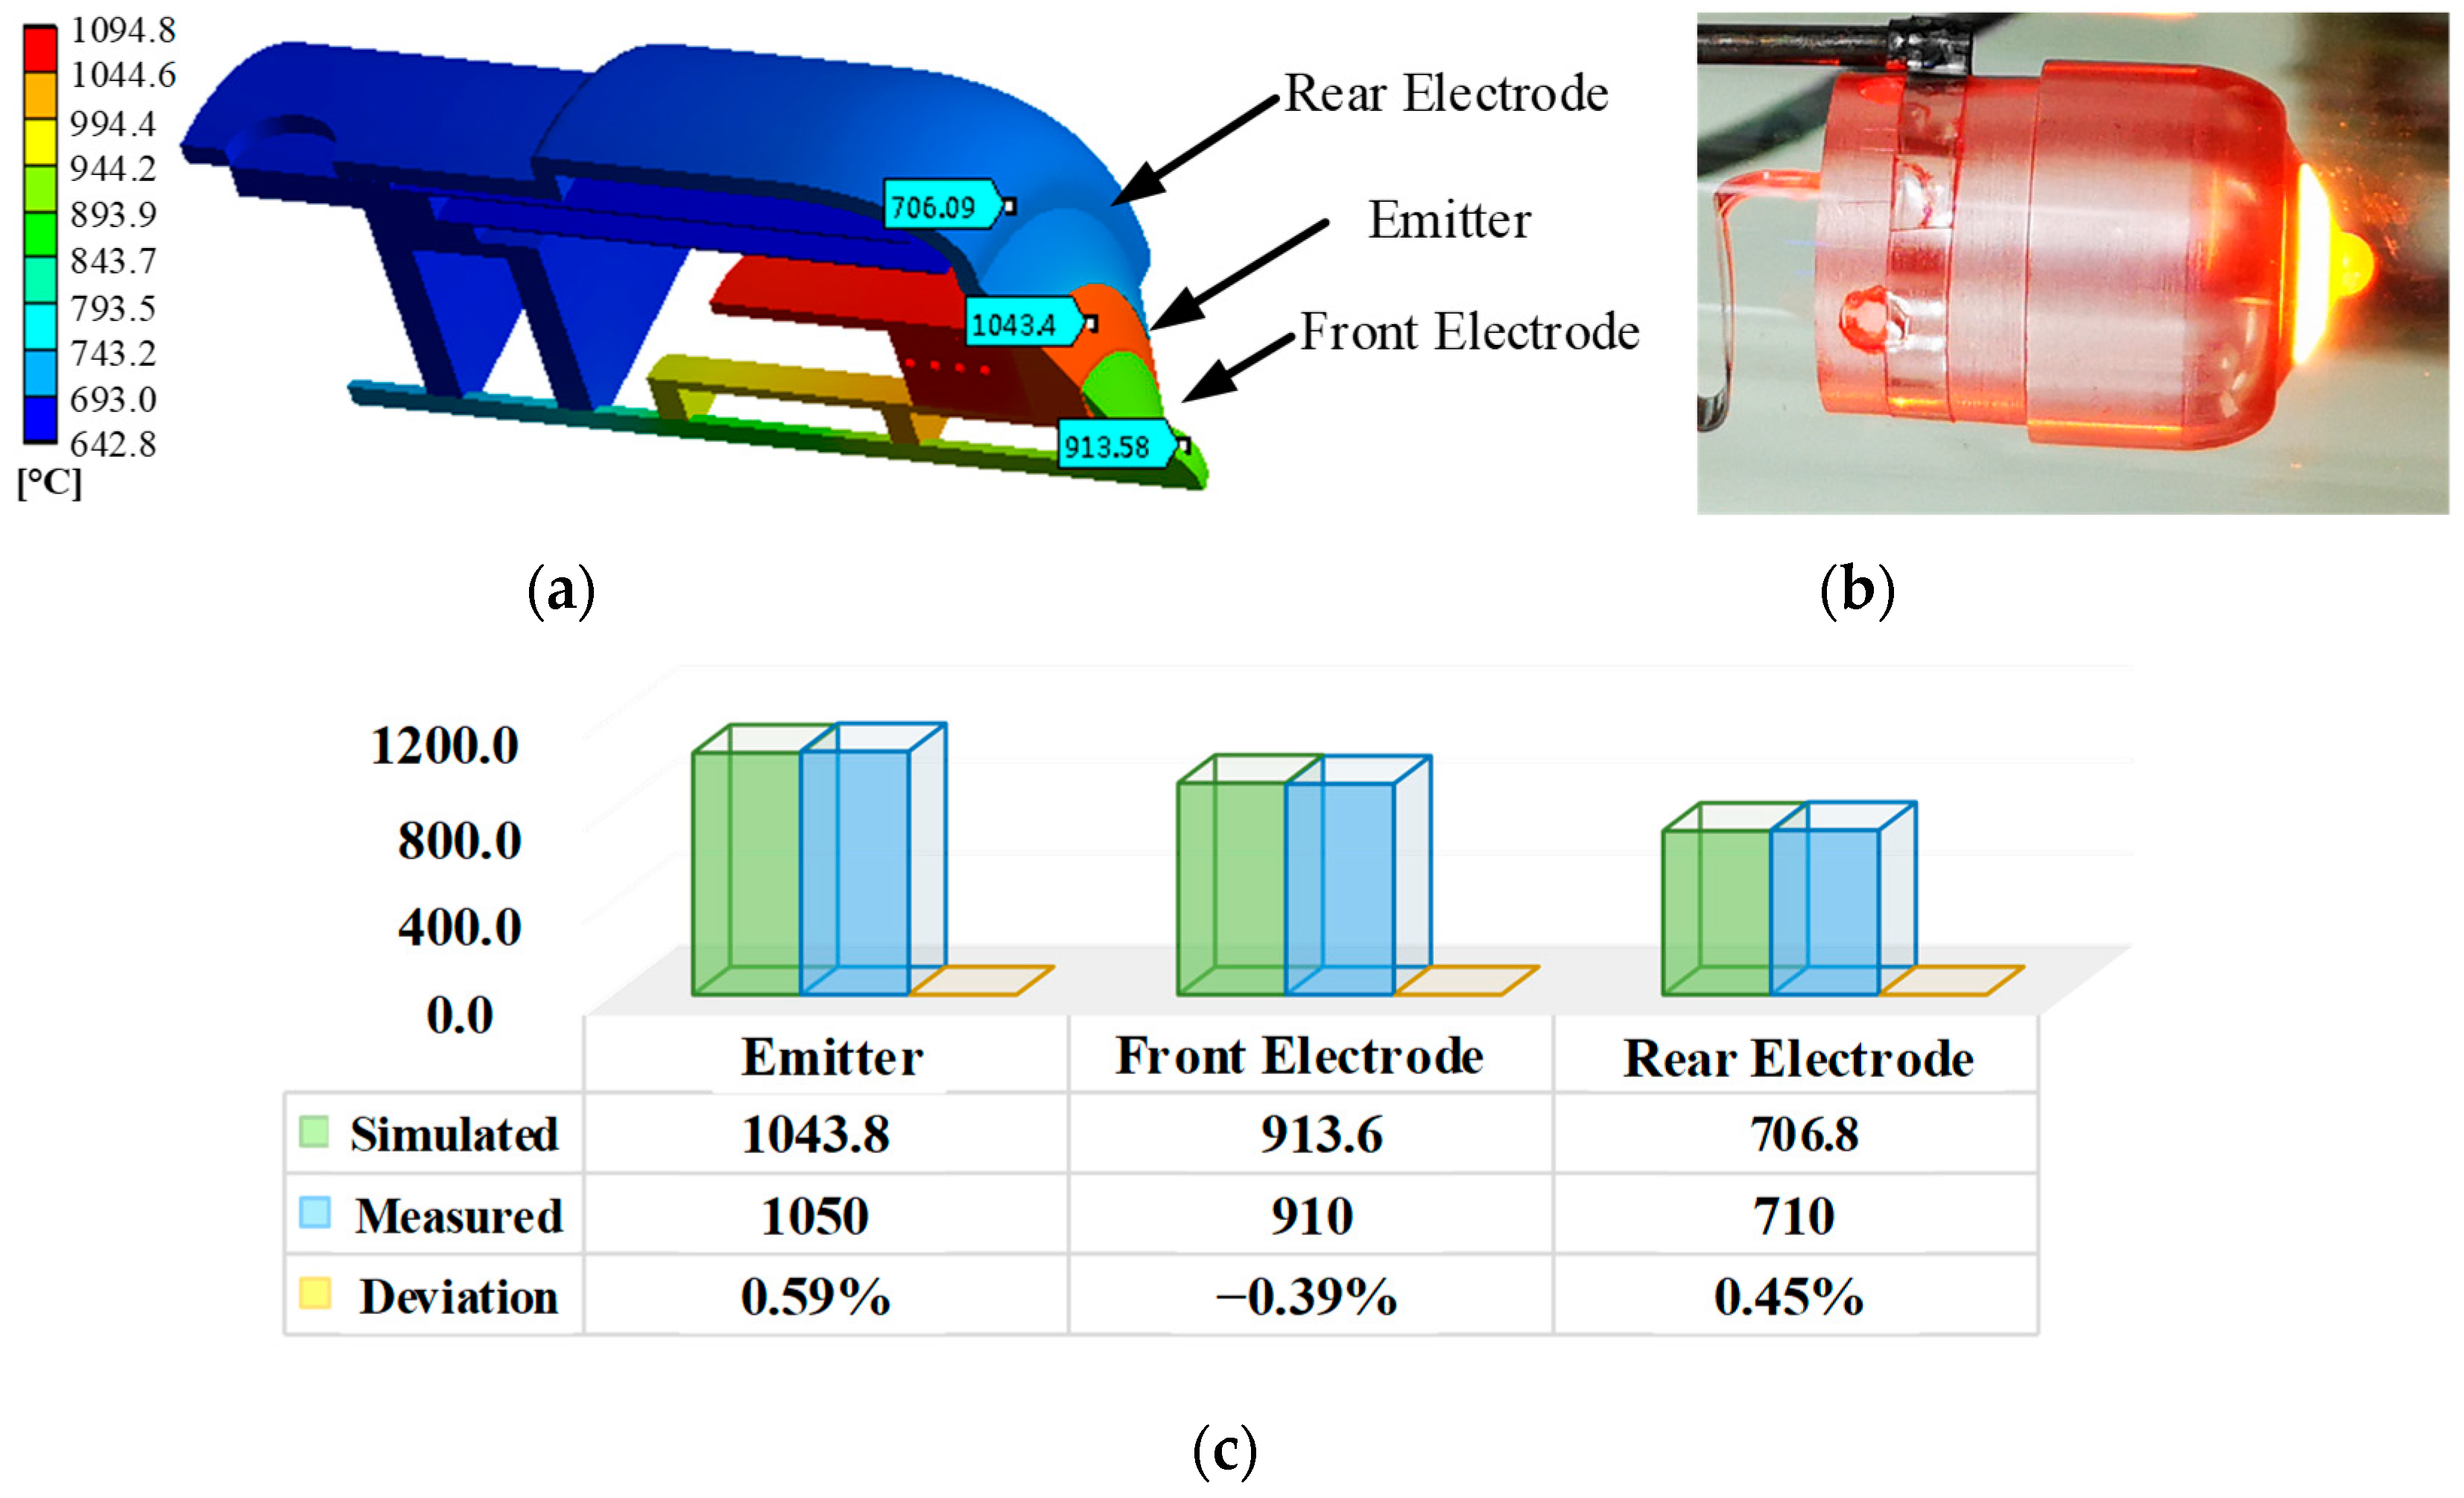
Before the assembly of the MIG into the gyro-TWT, thermal analysis and temperature distribution tests are conducted on the cathode, as shown in Figure 8. Utilizing a reasonable filament winding method, an obvious temperature gradient was established between the emitter and the rear and front electrodes. Tc reaches 1043 °C when Pheat is 22.5 W in the simulation. The temperature difference between the front and rear electrodes is 130 °C and 337 °C, respectively. The fabricated cathode was enveloped in the glass shield and heated, as shown in Figure 8b. The temperature was measured using an infrared thermometer, and the simulated and measured temperature deviations are shown in Figure 8c. The results indicate that the temperature deviation at each point is less than 0.6%.
The relationship between Tc and Pheat is shown in Figure 9. Tc higher than 850 °C is recorded in the experiment because of the measuring range of the infrared thermometer. The measurement result matches well with the simulation, and the maximum deviation is about 5% at 1200 °C. The Tc–Pheat curve is stored in the database and employed to evaluate the operating Tc in testing.
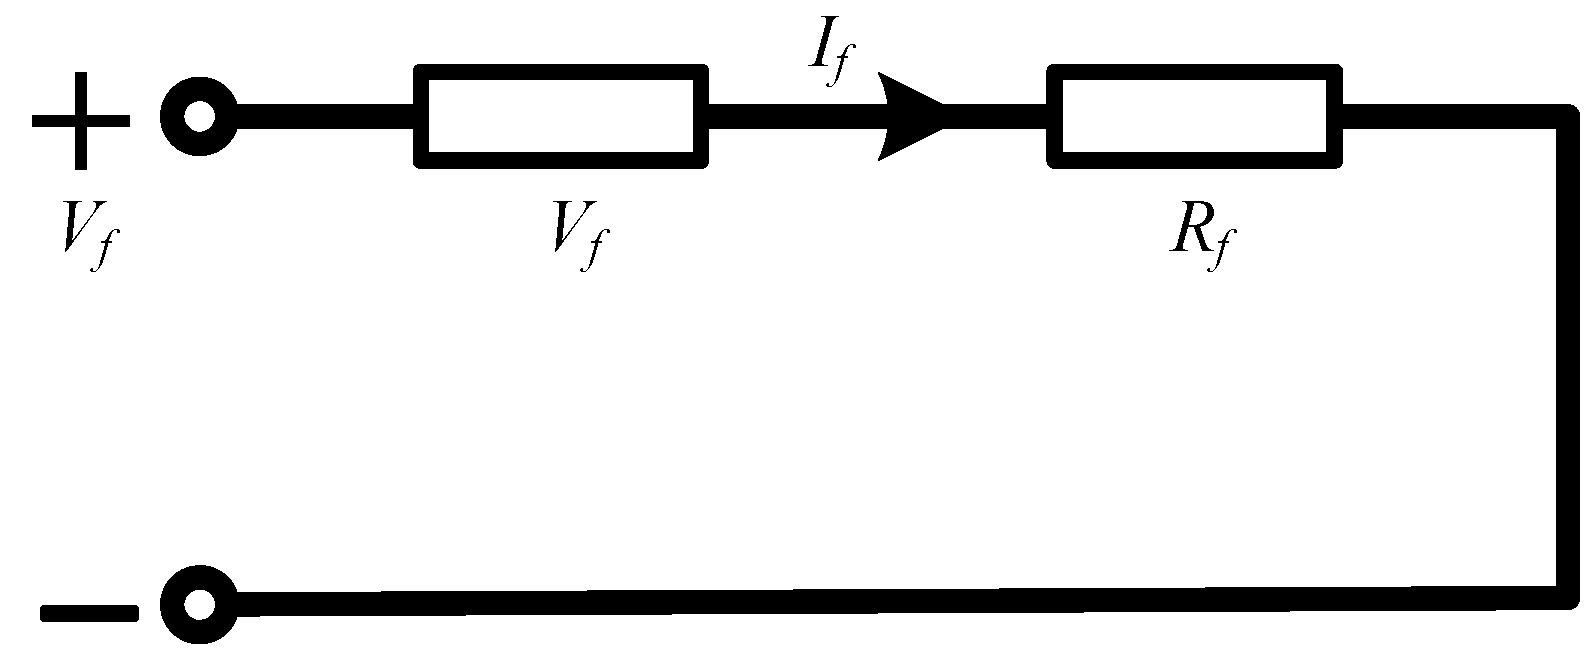
The fundamental principle of filament heating is shown in Figure 10. Here, Rf represents the filament resistance, which is influenced by Tc. R1 denotes the contact resistance induced by the assembly and is measured before testing. During MIG operation, Vf and If are loaded, and the effective Pheat can be estimated by Equation (9). Subsequently, the operating Tc can be evaluated through the Tc–Pheat curve. Through a synergistic approach involving both experimentation and simulation, the emitter temperature was estimated quickly based on the filament heating power.
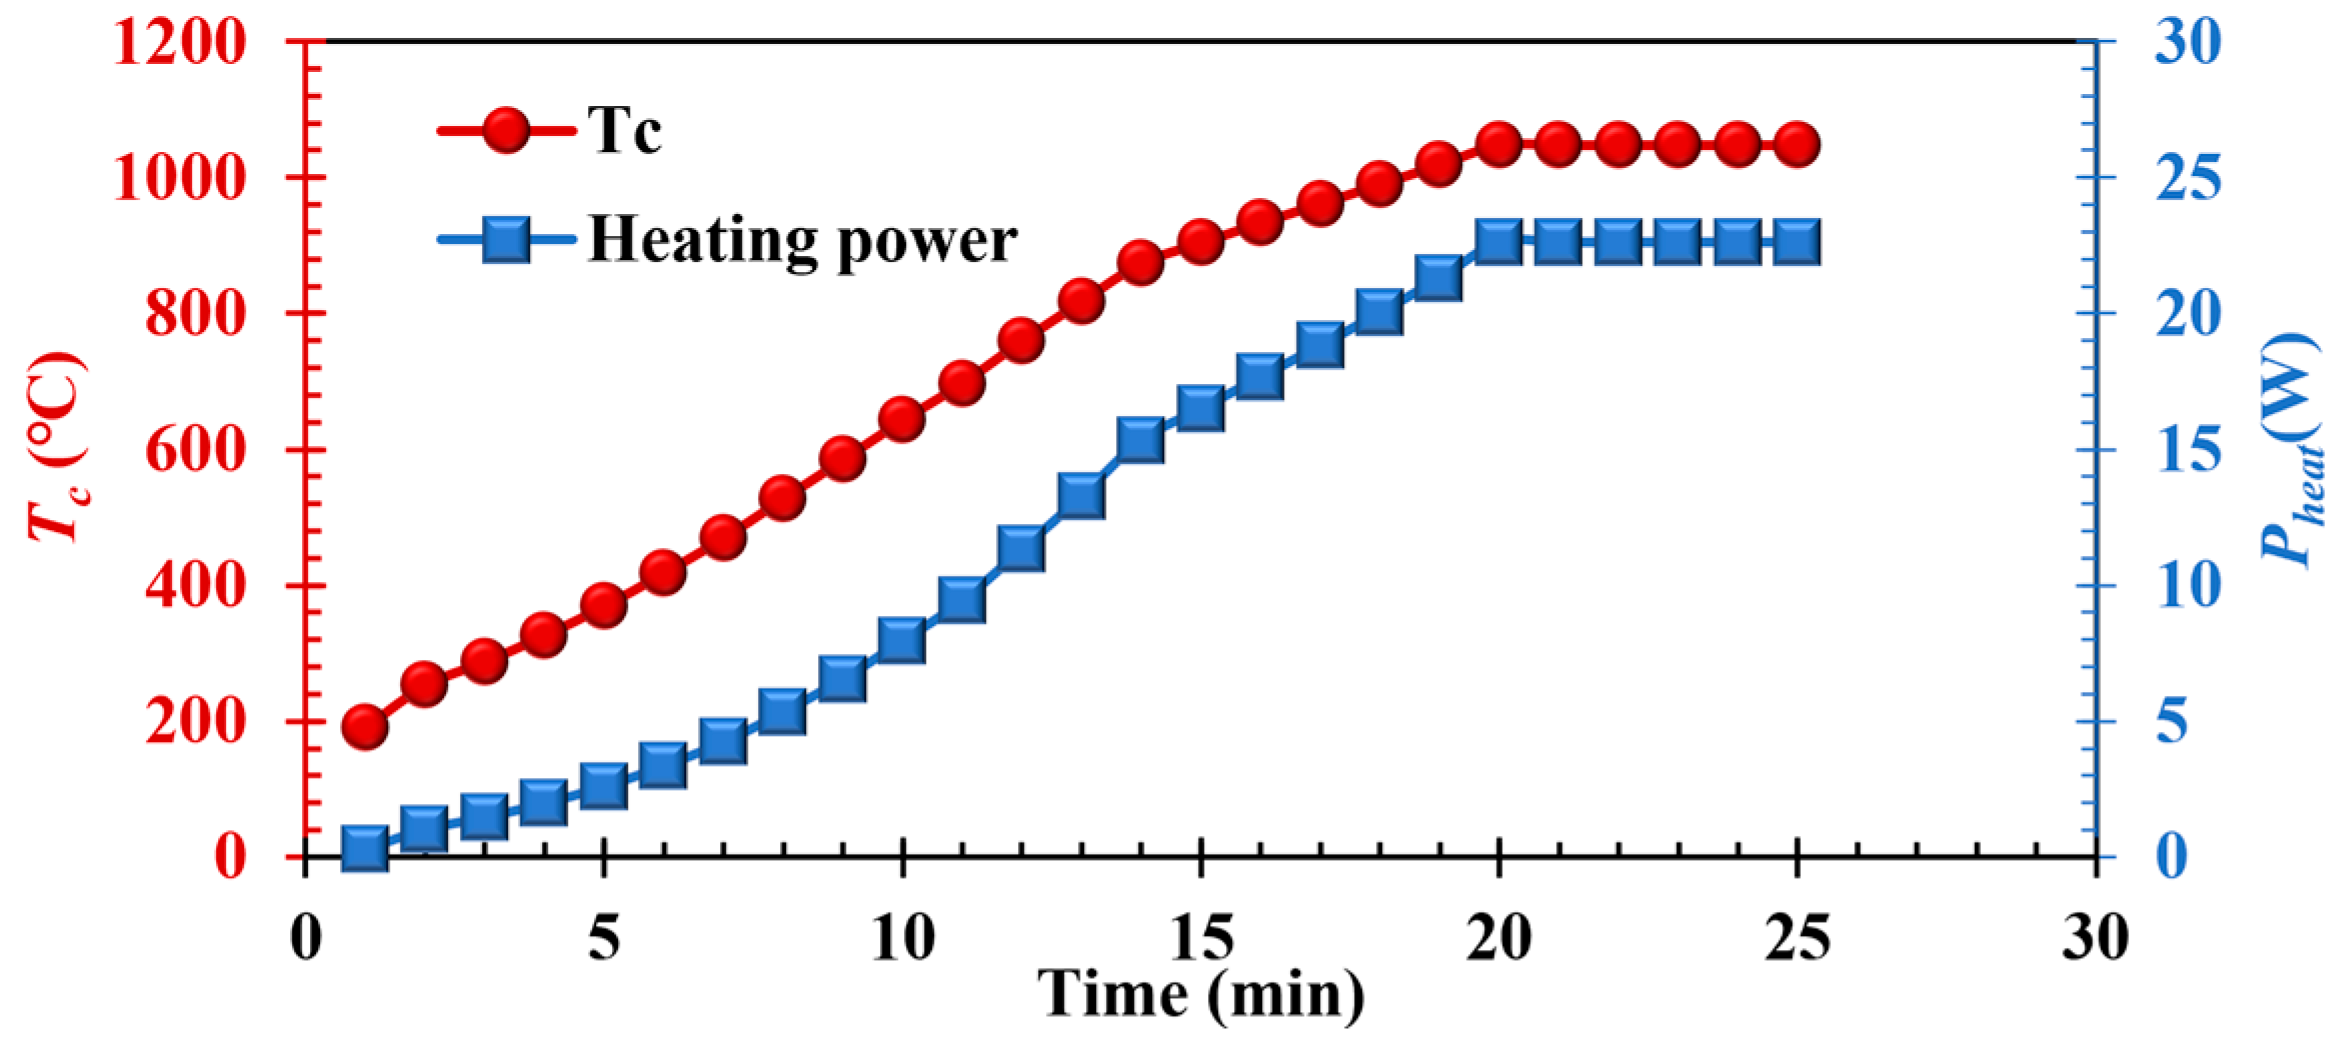
Tc evaluation is validated in the W-band MIG. The measured R1 is about 0.03 Ω. In Figure 11, the instant Tc is calculated as the heating power increases. When Pheat is 22.6 W, Tc reaches 1047 °C. Then, the instant (Δβ⊥)thermal could be calculated using 4. Here, Fm, γ and β⊥ are read from the synchronized trajectory simulation.
2.3. Roughness Spread Evaluation
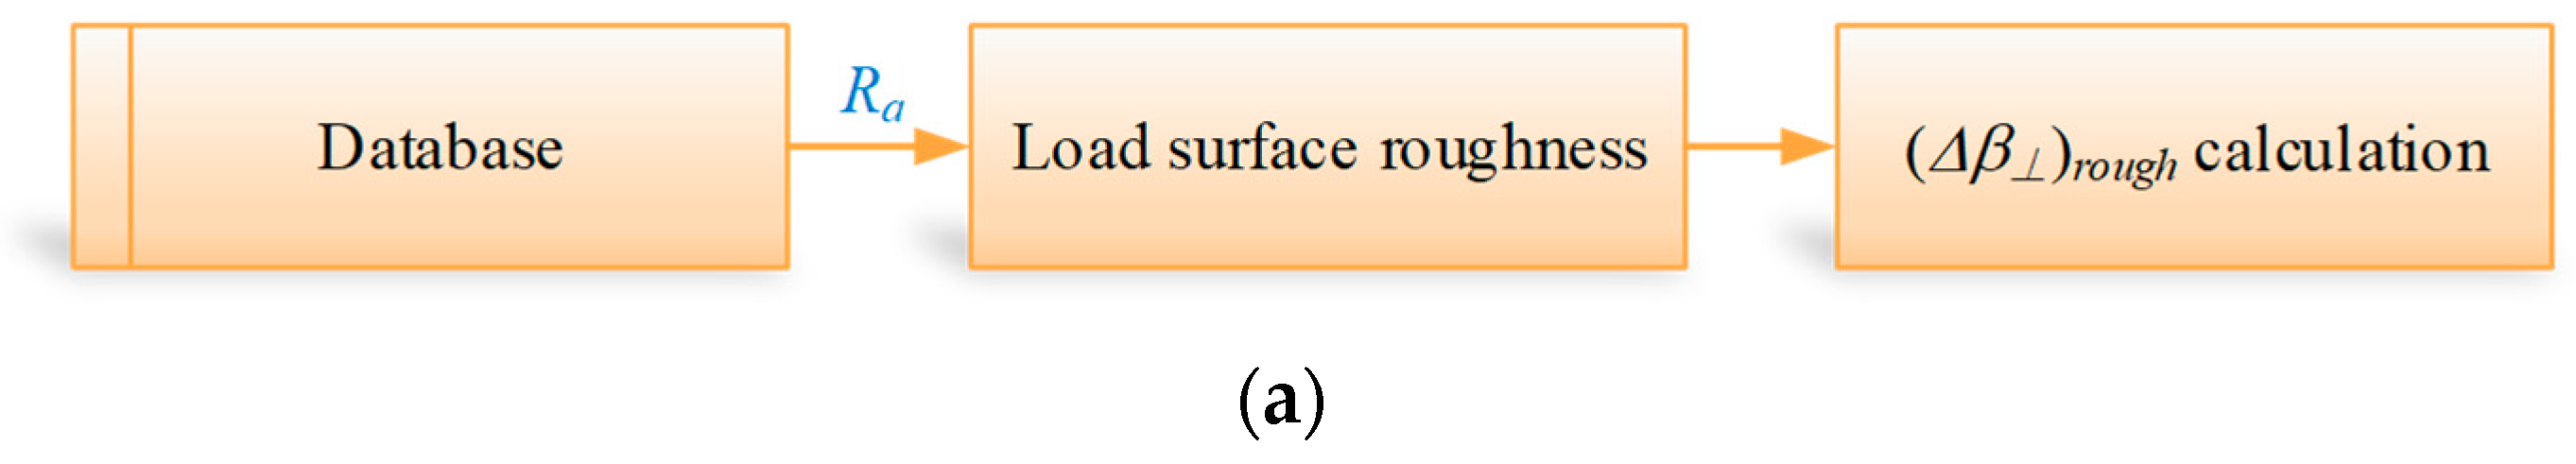
(Δβ⊥)rough depends on the surface roughness Ra in the fabrication process, and the evaluation process is shown in Figure 12a. The surface roughness of various cathodes has been measured prior to assembly and stored in the database. An emitter sample was measured by an Atomic Force Microscope (AFM), as shown in Figure 12b. Ra was about 23 nm for this cathode type under the current fabrication process. Ra is stored in the OEM, and the instant (Δβ⊥)rough is calculated using 5. The rest of the parameters are also read from the synchronized trajectory simulation.
Finally, the total beam velocity spread Δβ⊥ was calculated using 2. After the entire electron beam parameters are evaluated, the results are fed back and presented to the user interface. It could guide the optimal testing process and make it more scientific.
3. Evaluation of Experiment
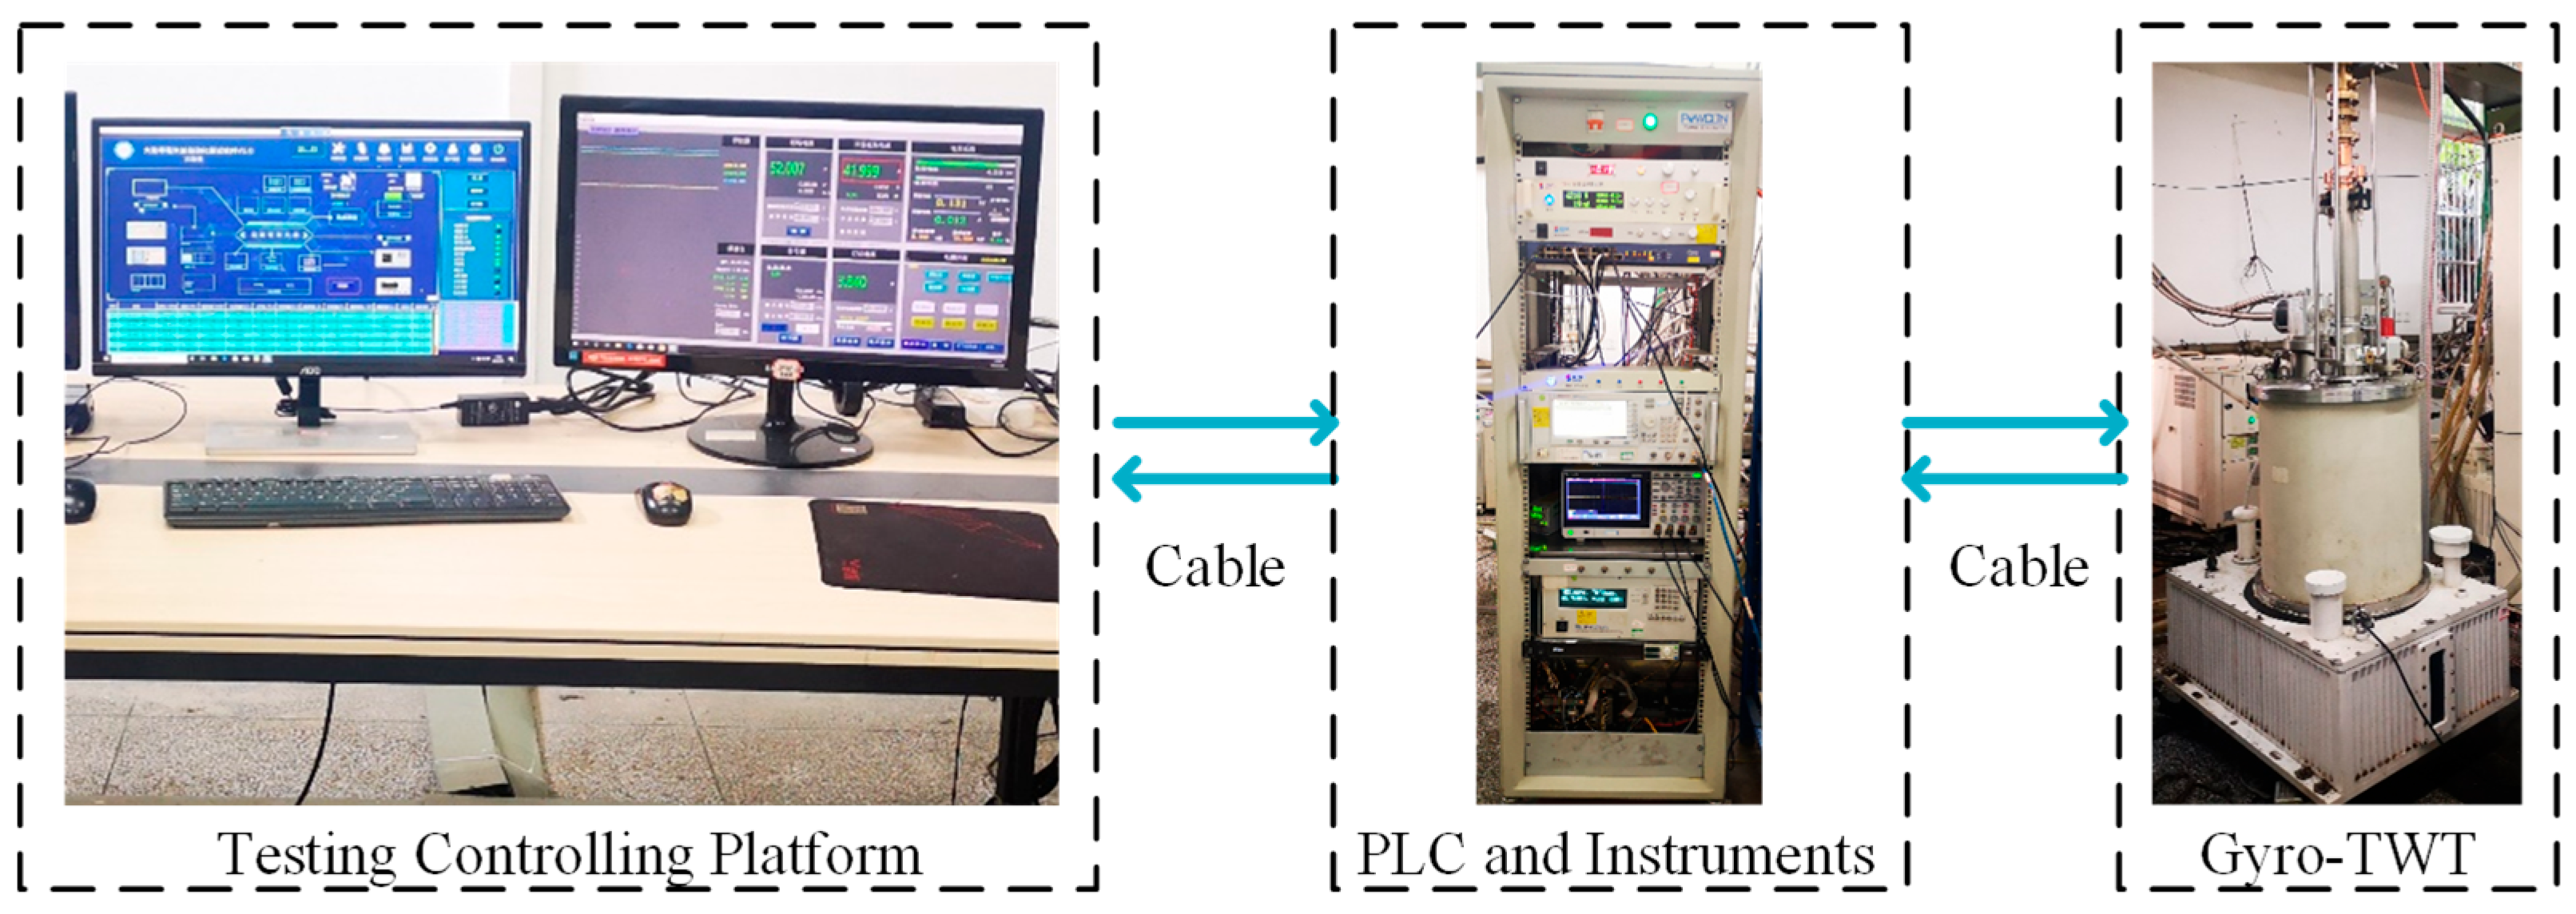
To validate the feasibility of the OEM technology in the context of the W-band gyro-TWT, a test platform is established, and the OEM is integrated into the system, as shown in Figure 13. The system consists of the testing controlling platform, PLC, testing instruments, and gyro-TWT. The controlling platform sends the test order to the instruments through PLC. Then, the electric parameters and input signal are applied to the gyro-TWT. The OEM is deployed on the testing controlling platform.
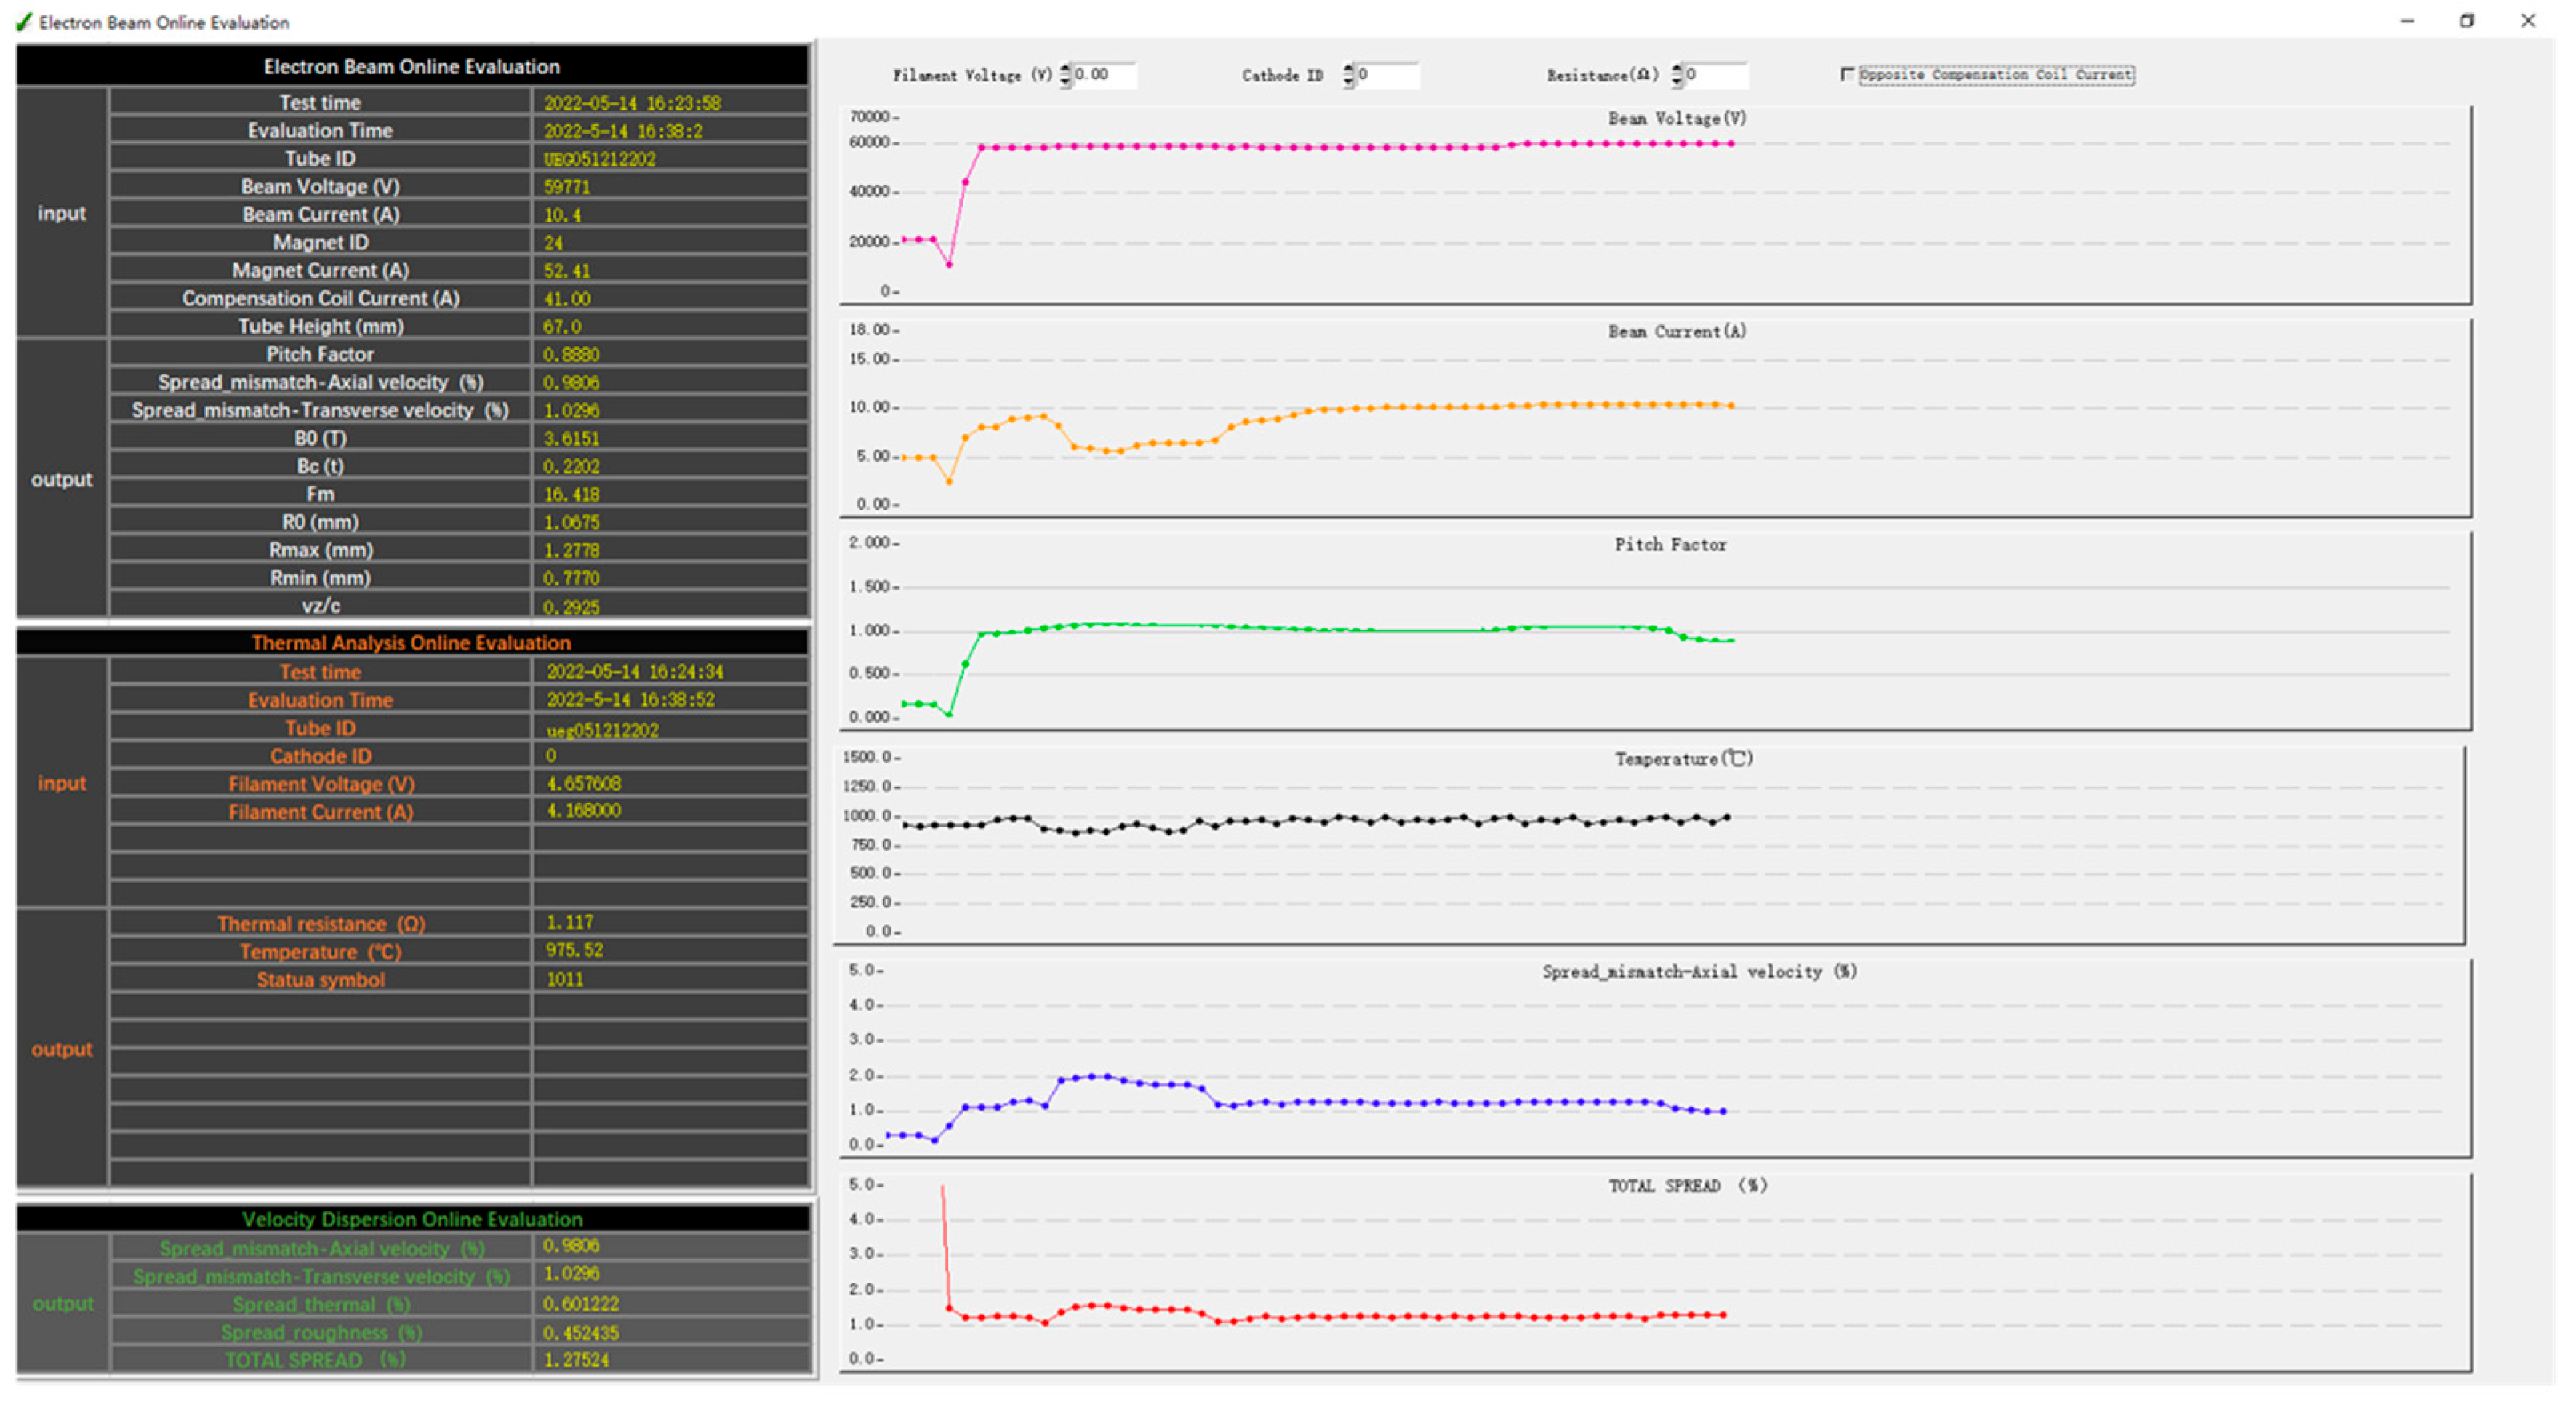
After considering the impact of electric-magnetic field mismatch, thermal emission spread, and surface roughness emission spread on the beam status, a visualization interface for gyro-TWTs testing is proposed, as shown in Figure 14. The operating parameters of MIG are obtained from the testing system. Subsequently, online evaluation is conducted, and the results are presented in the left area. The test duration for gyro-TWTs in our group typically exceeds one hour, and the evaluation results experience only a minimal delay of about 8 s due to trajectory simulation. This delay is acceptable for real-time results. The W-band gyro-TWT is driven by a 59.8 kV-10.4 A electron beam with a B0 of 3.61 T and an Fm of 17.1. The operating Tc is ~965 °C. The corresponding α is 1.06, with velocity spread of (Δβ⊥)mis, (Δβ⊥)thermal, and (Δβ⊥)rough at 1.00%, 0.56%, and 0.43%, respectively. The total Δβ⊥ is 1.23%. The guide center radius R0 is about 1.00 mm, while the maximum beam radius is 1.29 mm. The beam status varies with the time presented in the right area. It indicates the beam status could be instantly evaluated when adjusting the MIG parameters such as Fm, and I0, α.
The accuracy of OEM technology can be further improved by taking into account the influence of other factors. First, (1) the axial misalignment from fabrication and assembly is ignored due to the 2D trajectory simulation. Then, (2) the emission inhomogeneity and side-band emission are also neglected. The actual velocity spread and the maximum beam radius are larger than the evaluated result. Next, (3) if the low-frequency oscillation occurs, the backstream bombardment electron heats the cathode. The evaluated temperature is inaccurate. A novel method of measuring filament resistance by varying temperatures will be considered in the future to improve accuracy. Finally, (4) the surface roughness of the emitter will deteriorate after a long operation due to the ionization and backstream electron bombarding the cathode. The estimated roughness spread is smaller than the actual value.
Despite the above limitations, the OEM technology also provides useful instant electron beam information in operation, which guides the testing of the gyro-TWTs. First, the gyro-TWT is often designed to operate in an extensive range of voltage (45~60 kV) and current (3~10 A) for different applications. A significant margin adjustment may lead to an unwanted velocity ratio or electron trapping. The OEM presents the instant beam status, which could ensure the MIG operates in a reasonable scope. Second, the instant information on the velocity ratio and radial distance between the electron position and the center of the waveguide could help investigate the interaction oscillation and accelerate the testing process. Third, the OEM could compare the MIG status for different gyro-TWTs in different testing systems. This technology supports the testing of high-performance gyro-TWTs in several frequency bands [18,20,22].
4. Conclusions
An online evaluation module for helical electron beam status is developed. The instant operating parameters for MIG are achieved from the testing system. The geometry and magnetic field are rebuilt and connected according to the corresponding parameters to realize the online trajectory simulation. The electron beam status is calculated after the online trajectory simulation. The velocity spread considering thermal emission and surface roughness is also evaluated. The OEM has been validated in a W-band gyro-TWT experiment. The evaluated α is 1.08, R0 is 1.00 mm, three-velocity-spread of (Δβ⊥)mis, (Δβ⊥)thermal, and (Δβ⊥)rough is 1.00%, 0.56%, and 0.43%, respectively. And the calculated total Δβ⊥ is 1.23%. Instant electron status evaluation could guide and accelerate the testing process. And the OEM is already utilized in a series of gyro-TWTs testing.
Author Contributions
Conceptualization, W.J.; methodology, C.L., B.H., B.D., Q.Z., G.L., J.W. and Y.L.; writing—original draft, W.J. and C.L.; writing—review and editing, W.J. and Y.L. All authors have read and agreed to the published version of the manuscript.
Funding
This research was funded by the Sichuan Science and Technology Program under Grant 2022YFSY0063.
Data Availability Statement
All data included in this study are available upon request by contacting with the corresponding author.
Conflicts of Interest
The authors declare no conflicts of interest.
References
- Thumm, M. State-of-the-Art of High-Power Gyro-Devices. Update of Experimental Results 2021; KIT Scientific Reports: Baden-Württemberg, Germany, 2021. [Google Scholar]
- Valusis, G.; Lisauskas, A.; Yuan, H.; Knap, W.; Roskos, H.G. Roadmap of terahertz imaging 2021. Sensors 2021, 21, 4092. [Google Scholar] [CrossRef] [PubMed]
- Dhillon, S.S.; Vitiello, M.S.; Linfield, E.H.; Davies, A.G.; Hoffmann, M.C.; Booske, J.; Paoloni, C.; Gensch, M.; Weightman, P.; Williams, G.P.; et al. The 2017 terahertz science and technology roadmap. J. Phys. D Appl. Phys. 2017, 50, 043001. [Google Scholar] [CrossRef]
- Sabchevski, S.; Glyavin, M.; Mitsudo, S.; Tatematsu, Y.; Idehara, T. Novel and emerging applications of the gyrotrons worldwide: Current status and prospects. J. Infrared Millim. Terahertz Waves 2021, 42, 715–741. [Google Scholar] [CrossRef]
- Pagonakis, I.; Avramidis, K.A.; Gantenbein, G.; Illy, S.; Ioannidis, Z.C.; Jin, J.; Kalaria, P.; Piosczyk, B.; Ruess, S.; Ruess, T.; et al. Triode magnetron injection gun for the KIT 2 MW 170 GHz coaxial cavity gyrotron. Phys. Plasmas 2020, 27, 023105. [Google Scholar] [CrossRef]
- Gantenbein, G.; Avramidis, K.; Illy, S.; Ioannidis, Z.; Jin, J.; Jelonnek, J.; Kalaria, P.; Pagonakis, I.; Ruess, S.; Ruess, T.; et al. New trends of gyrotron development at KIT: An overview on recent investigations. Fusion Eng. Des. 2019, 146, 341–344. [Google Scholar] [CrossRef]
- Gantenbein, G.; Avramidis, K.; Chelisa, I.; Ell, B.; Illy, S.; Ioannidis, Z.C.; Jelonnek, J.; Jin, J.; Laqua, H.P.; Marsen, S.; et al. High power gyrotron development for advanced fusion devices. In Proceedings of the 28th IAEA Fusion Energy Conference, Virtual, 10–15 May 2021; p. 1. [Google Scholar] [CrossRef]
- Ruess, S.; Pagonakis, I.G.; Gantenbein, G.; Illy, S.; Kobarg, T.; Rzesnicki, T.; Thumm, M.; Weggen, J.; Jelonnek, J. An inverse magnetron injection gun for the KIT 2-MW coaxial-cavity gyrotron. IEEE Trans. Electron Devices 2016, 63, 2104–2109. [Google Scholar] [CrossRef]
- Samsonov, S.V.; Levitan, B.A.; Murzin, V.N.; Gachev, I.G.; Denisov, G.G.; Bogdashov, A.A.; Mishakin, S.V.; Fiks, A.S.; Soluyanova, E.A.; Tai, E.M.; et al. Ka-band gyrotron traveling-wave tubes with the highest continuous-wave and Average Power. IEEE Trans. Electron Devices 2014, 61, 4264–4267. [Google Scholar] [CrossRef]
- Samsonov, S.V.; Denisov, G.G.; Gachev, I.G.; Bogdashov, A.A. CW operation of a W-band high-gain helical-waveguide gyrotron traveling-wave tube. IEEE Electron Device Lett. 2020, 41, 773–776. [Google Scholar] [CrossRef]
- Choi, J.J.; Park, G.S.; Park, S.Y.; Armstrong, C.M.; Kyser, R.H.; Ganguly, A.K. Experimental investigation of a broadband two-stage tapered gyro-TWT amplifier. In Proceedings of the 1992 International Technical Digest on Electron Devices Meeting, San Francisco, CA, USA, 13–16 December 1992; pp. 195–197. [Google Scholar] [CrossRef]
- Wang, Q.S.; McDermott, D.B.; Luhmann, N.C. Operation of a stable 200-kW second-harmonic gyro-TWT amplifier. IEEE Trans. Plasma Sci. 1996, 24, 700–706. [Google Scholar] [CrossRef]
- Barnett, L.R.; Luhmann, N.C.; Chiu, C.C.; Chu, K.R.; Ying, C.Y. Advances in W-band TE01 gyro-TWT amplifier design. In Proceedings of the 2007 IEEE International Vacuum Electronics Conference, Kitakyushu, Japan, 15–17 May 2007; pp. 233–234. [Google Scholar] [CrossRef]
- Macdonald, M.E.; Anderson, J.P.; Lee, R.K.; Gordon, D.A.; Mcgrew, G.N. The HUSIR W-Band Transmitter. Lincoln Lab. J. 2014, 21, 106–114. [Google Scholar]
- Blank, M.; Borchard, P.; Cauffman, S.; Felch, K. Design and demonstration of W-band gyrotron amplifiers for radar applications. In Proceedings of the 2007 Joint 32nd International Conference on Infrared and Millimeter Waves and the 15th International Conference on Terahertz Electronics, Cardiff, UK, 2–9 September 2007; pp. 364–366. [Google Scholar]
- Zeng, X.; Du, C.H.; Li, A.; Gao, S.; Wang, Z.Y.; Zhang, Y.C.; Zi, Z.X.; Feng, J.J. Design and preliminary experiment of W-band broadband TE02 mode gyro-TWT. Electronics 2021, 10, 1950. [Google Scholar] [CrossRef]
- Lu, C.; Jiang, W.; Liu, Y.; Liu, G.; Wang, J.; Pu, Y.; Xu, J.; Luo, Y. Design and experiment of a compact magnetron injection gun for a coil magnet X-band gyro-TWT. IEEE Trans. Electron Devices 2023, 70, 4443–4449. [Google Scholar] [CrossRef]
- Jiang, W.; Lu, C.; Dai, B.; Guo, L.; Wang, J.; Pu, Y.; Wu, Z.; Luo, Y. Experiment and power capacity investigation for a Ku-band continuous-wave gyro-TWT. Electron Devices 2022, 69, 7039–7045. [Google Scholar] [CrossRef]
- Lu, C.; Jiang, W.; Liu, G.; Liu, Y.; Wang, J.; Pu, Y.; Wu, Z.; Luo, Y. Design and experiment of a dielectric-loaded gyro-TWT with a single depressed collector. IEEE Trans. Electron Devices 2022, 69, 3920–3925. [Google Scholar] [CrossRef]
- Jiang, W.; Lu, C.; Han, B.; Liu, G.; Wang, J.; Pu, Y.; Luo, Y. Experiment and power capacity investigation of collector in the 50-kW-Average-Power Q-band gyro-TWT. IEEE Trans. Electron Devices 2023, 70, 4372–4378. [Google Scholar] [CrossRef]
- Liu, G.; Jiang, W.; Yao, Y.; Wang, Y.; Wang, W.; Cao, Y.; Wang, J.; Luo, Y. High average power test of a W-band broadband gyrotron traveling wave tube. IEEE Electron Device Lett. 2022, 43, 950–953. [Google Scholar] [CrossRef]
- Liu, G.; Jiang, W.; Yao, Y.; Wang, Y.; Cao, Y.; Wang, J.; Luo, Y. Long pulse and high duty operation of a W-band gyrotron traveling wave tube. IEEE Electron Device Lett. 2023, 44, 829–832. [Google Scholar] [CrossRef]
- Jiang, W.; Dai, B.; Lu, C.; Wang, J.; Liu, G.; Pu, Y.; Wu, Z.; Luo, Y. Electron transportation experiment and analysis for a G-band magnetron injection gun. IEEE Trans. Electron Devices 2022, 69, 6362–6368. [Google Scholar] [CrossRef]
- Barnett, L.R.; Luhmann, N.C.; Chiu, C.C.; Chu, K.R. Relativistic performance analysis of a high current density magnetron injection gun. Phys. Plasmas 2009, 16, 093111. [Google Scholar] [CrossRef]
- Tsimring, S.E.; Zapevalov, V.E. Experimental study of intense helical electron beams with trapped electrons. Int. J. Electron. 1996, 81, 199–205. [Google Scholar] [CrossRef]
- Ruess, S. Pushing the KIT 2 MW Coaxial-Cavity Short-Pulse Gyrotron towards a DEMO Relevant Design; KIT Scientific Publishing: Baden-Württemberg, Germany, 2021. [Google Scholar] [CrossRef]
- Pagonakis, I.G.; Piosczyk, B.; Zhang, J.; Illy, S.; Rzesnicki, T.; Hogge, J.-P.; Avramidis, K.; Gantenbein, G.; Thumm, M.; Jelonnek, J. Electron trapping mechanisms in magnetron injection guns. Phys. Plasmas 2016, 23, 023105. [Google Scholar] [CrossRef]
- Zhang, J. Influence of Emitter Surface Roughness and Emission Inhomogeneity on Efficiency and Stability of High Power Fusion Gyrotron; KIT Scientific Publishing: Karlsruhe, Germany, 2016; Volume 9. [Google Scholar]
- Cerfon, A.J.; Choi, E.; Marchewka, C.D.; Mastovsky, I.; Shapiro, M.A.; Sirigiri, J.R.; Temkin, R.J. Observation and study of low-frequency oscillations in a 1.5-MW 110-GHz gyrotron. IEEE Trans. Plasma Sci. 2009, 37, 1219–1224. [Google Scholar] [CrossRef]
- Xiao, H.; Deng, Z.; Chen, X.; Wang, P.; He, Z.; Zhu, G.; Liu, L.; Ding, T.; Han, X. Influence of Misalignment on the Behavior of Electron Beam of an 800 GHz Gyrotron. IEEE Electron Device Lett. 2021, 42, 1662–1665. [Google Scholar] [CrossRef]
- Liu, G.; Wang, Z.; Zhao, G.; Yan, R.; Xu, Y.; Wang, J.; Pu, Y.; Jiang, W. Automatic hot test of gyrotron-traveling wave tubes by adaptive PID feedback control. IEEE Trans. Electron Devices 2017, 64, 1310–1314. [Google Scholar] [CrossRef]
- Yan, R.; Yao, Y.; Liu, G.; Wang, J.; Xu, Y.; Pu, Y.; Jiang, W.; Luo, Y. Automatic hot-test system for high average/continuous-wave power gyro-TWTs. IEEE Trans. Electron Devices 2018, 65, 1139–1145. [Google Scholar] [CrossRef]
- Baird, J.M.; Lawson, W. Magnetron injection gun (MIG) design for gyrotron applications. Int. J. Electron. 1986, 61, 953–967. [Google Scholar] [CrossRef]
- Yuan, C.P.; Chang, T.H.; Chen, N.C.; Yeh, Y.S. Magnetron injection gun design for broadband gyrotron backward-wave oscillator. In Proceedings of the 2009 34th International Conference on Infrared, Millimeter, and Terahertz Waves, Busan, Republic of Korea, 21–25 September 2009; Volume 073109, pp. 1–6. [Google Scholar] [CrossRef]
Figure 1.
(a) Magnetic field distribution consists of SCM and CC. (b) Schematic configuration of the dielectric-loaded gyro-TWT.
Figure 1.
(a) Magnetic field distribution consists of SCM and CC. (b) Schematic configuration of the dielectric-loaded gyro-TWT.

Figure 2.
The experimental testing system. 1—Gyro-TWT; 2—Super-conducting magnet; 3—Compensation coil; 4—Fuel tank of power supply and 5—MIG.
Figure 2.
The experimental testing system. 1—Gyro-TWT; 2—Super-conducting magnet; 3—Compensation coil; 4—Fuel tank of power supply and 5—MIG.

Figure 3.
Schematic of beam performance OEM.

Figure 4.
Process of electron beam status online simulation and evaluation.

Figure 5.
Online simulation for beam trajectory.

Figure 6.
(a) Evaluation of beam status through online simulation. (b) Spectrum corresponding to the output signal of stage 2. (c) Spectrum corresponding to the output signal of stage 5 in the experiment.
Figure 6.
(a) Evaluation of beam status through online simulation. (b) Spectrum corresponding to the output signal of stage 2. (c) Spectrum corresponding to the output signal of stage 5 in the experiment.


Figure 7.
Process of (Δβ⊥)thermal evaluation.

Figure 8.
(a) Thermal analysis in the simulation. (b) Heated cathode. (c) Temperature deviation.

Figure 9.
Tc varies with heat power.

Figure 10.
Equivalent thermal circuit of cathode heating.

Figure 11.
Temperature evaluation in the experiment.

Figure 12.
(a) Process of (Δβ⊥)rough evaluation. (b) Emitter sample. (c) Roughness measurement by AFM.
Figure 12.
(a) Process of (Δβ⊥)rough evaluation. (b) Emitter sample. (c) Roughness measurement by AFM.


Figure 13.
OEM validation experiment setup.

Figure 14.
The W-band gyro-TWT evaluation results in the OEM interface.

Disclaimer/Publisher’s Note: The statements, opinions and data contained in all publications are solely those of the individual author(s) and contributor(s) and not of MDPI and/or the editor(s). MDPI and/or the editor(s) disclaim responsibility for any injury to people or property resulting from any ideas, methods, instructions or products referred to in the content. |
© 2023 by the authors. Licensee MDPI, Basel, Switzerland. This article is an open access article distributed under the terms and conditions of the Creative Commons Attribution (CC BY) license (https://creativecommons.org/licenses/by/4.0/).
Share and Cite
MDPI and ACS Style
Jiang, W.; Lu, C.; Han, B.; Dai, B.; Zheng, Q.; Liu, G.; Wang, J.; Luo, Y. Helical Electron Beam Status Online Evaluation for Magnetron Injection Gun. Quantum Beam Sci. 2024, 8, 3. https://doi.org/10.3390/qubs8010003
AMA Style
Jiang W, Lu C, Han B, Dai B, Zheng Q, Liu G, Wang J, Luo Y. Helical Electron Beam Status Online Evaluation for Magnetron Injection Gun. Quantum Beam Science. 2024; 8(1):3. https://doi.org/10.3390/qubs8010003
Chicago/Turabian StyleJiang, Wei, Chaoxuan Lu, Binyang Han, Boxin Dai, Qiang Zheng, Guo Liu, Jianxun Wang, and Yong Luo. 2024. "Helical Electron Beam Status Online Evaluation for Magnetron Injection Gun" Quantum Beam Science 8, no. 1: 3. https://doi.org/10.3390/qubs8010003