Article

The Impact of Compact and Mixed Development on Land Value: A Case Study of Richmond, Virginia

by
I-Shian (Ivan) Suen
L. Douglas Wilder School of Government and Public Affairs, Virginia Commonwealth University, Richmond, VA 23284-2028, USA
Urban Sci. 2018, 2(2), 47; https://doi.org/10.3390/urbansci2020047
Submission received: 22 April 2018 / Revised: 29 May 2018 / Accepted: 5 June 2018 / Published: 7 June 2018

Abstract

:
Sustainable development entails various development patterns commonly associated with compact and mixed development that usually leads to reduced driving, more public transportation utilization, lower energy consumption, better walkability, and improved public health. To examine if the benefits of compact and mixed development are reflected in land value, this study sets forth to measure development compactness and land use mix and assesses the impacts of such patterns on land value. Impacts of accessibility to jobs, retail stores, and public transportation on land value are also investigated and compared to the impacts from development patterns. The study finds that: (1) accessibility has greater impacts than development pattern on land value; (2) compact development and mixed land use influence land value differently depending on the nature of existing land uses and land values; (3) accessibility to jobs and retail stores always contributes to the increase of land value; and (4) accessibility to public transportation helps but it does not influence land value in a consistent fashion. The results suggest that areas with higher residential property values, good proximity to the city center, less industrial land uses, and good access to jobs and retail stores have greater potential to realize an increase of land value resulted from compact and mixed development in Richmond, Virginia.

1. Introduction

Over the past two decades sustainable development has emerged to become one of the viable ways to combat the negative consequences of urban sprawl. Many scholars have argued that compact urban form and mixed development are more sustainable than sprawl [1,2,3,4,5,6,7,8]. The advantages and benefits of compact and mixed development patterns are many. Frank and Pivo [9] suggested that mixed use and density would reduce driving and increase public transportation utilization and walking, which in turn would lead to less traffic, lower energy consumption and air pollution [10,11,12,13,14]. In addition, compact and mixed development patterns have greater potential for promoting social equity [15] and offering more physical activity opportunities (e.g., walking, jogging, and bicycling) that are beneficial to public health [16,17].
If the benefits of compact and mixed development are welcome and appreciated by many, their monetary value may be reflected in real estate valuation of places that possess such development characteristics. Indeed, prior research has demonstrated such development patterns and accessibility influence property values in various ways. Song and Knapp [18] found that, in neighborhoods with mixed land uses, housing prices tend to increase with proximity to neighborhood commercial land uses. Sohn and Moudon [19] observed an increase of office property values when office development intensity becomes higher in King County, Washington while Gluszak and Zygmunt [20] reported that development density has a positive impact on land prices in Krakow, Poland. Accessibility (to jobs, retail shopping, and other amenities, etc.) also plays a significant role in real estate valuation. While there are studies that evaluate accessibility and land values based on distance to the urban center or sub-centers [21,22] in general, many focus on access to jobs in the context of the interaction between land use and transportation and find that good access is commonly associated with higher property values [23,24,25,26,27]. Research findings of the relationship between access to public transportation (which improves accessibility) and land value are mixed. Cervero and Duncan [28] found commercial land values benefit from the proximity to light and commuter rail services in Santa Clara County, California. Du and Mulley [29,30] observed various effects (a mix of positive, none, and negative) of transport accessibility on land value from place to place in the United Kingdom. Other studies have shown that the increase of property values does not benefit much from the proximity to public transportation but rather the property’s characteristics and its neighborhood features [31,32,33].
When it comes to property values, a property can be separated into its land and improvement which are assessed separately but sold together as one property in the market. Most studies use either the total assessed values [18,19] or the sale prices [20,21,22,27,29,30] to capture property values. While residential properties are studied by most [18,21,22,27,29,30], office properties [19], commercial properties [28], and undeveloped land sales [20] are also examined by others. In real estate valuation, a property’s land and improvement are influenced by different factors [34,35,36]. Due to the unique nature of land being stationary and limited in quantity, land value generally reflects its current use and development potential, which is influenced by its location and external factors like accessibility and surrounding land uses. Improvement value, on the other hand, is mainly tied to its construction costs [35] and does not react to external factors like land value does. Therefore, I choose to use land value in this study as the dependent variable, a proxy variable representing a property’s land use potential.

1.1. Study Aim and Scope

The literature on urban form, accessibility, and property value is rich and diverse. However, prior studies fall short in two areas: (1) they tend to focus more on residential properties than others and (2) they often examine the relationship between property value and urban form or accessibility rather than altogether. I intend to take a more comprehensive approach by investigating the impacts of development patterns and accessibility on land value. For land value, I took into consideration all developed parcels (defined in this study as parcels that have improvements on them) of different land uses, aggregated their assessed land value to the Census Block Group [37] level, and calculated the average assessed land value, on a per square foot basis, for every Census Block Group in the City of Richmond, Virginia. As to development patterns, I constructed two measures—development compactness and land use mix. While most compactness measures are viewed as density [2,9,10,11,38,39,40], this study demonstrates the use of standard distance [41], based on the physical distances among developed parcels, to measure development compactness of Census Block Groups. The reason standard distance is chosen over density is illustrated in Figure 1. For example, density of two hypothetical areas is identical if their size and the number of elements in them are the same. However, when the spatial arrangement of elements becomes different while density remains the same, the standard distance measure can detect and capture such differences. In that sense, standard distance is better suited to measure development compactness intended in this study.
However, compact development does not necessary address the diversity of land uses [16] or land use mix. For example, two areas may have similar development compactness but their land use composition or mix may be very different. To assess land use mix, I used the Shannon’s Diversity Index [42] to measure land use mix in the Census Block Groups. On the other hand, accessibility is measured by network distance [43] from a Census Block Group’s centroid to jobs, retail stores, and bus stops in the City. I also employed an Inverse Distance Weighted function [44] in the calculations of accessibility so that nearby amenities contribute more to the accessibility measure than amenities that are farther away.

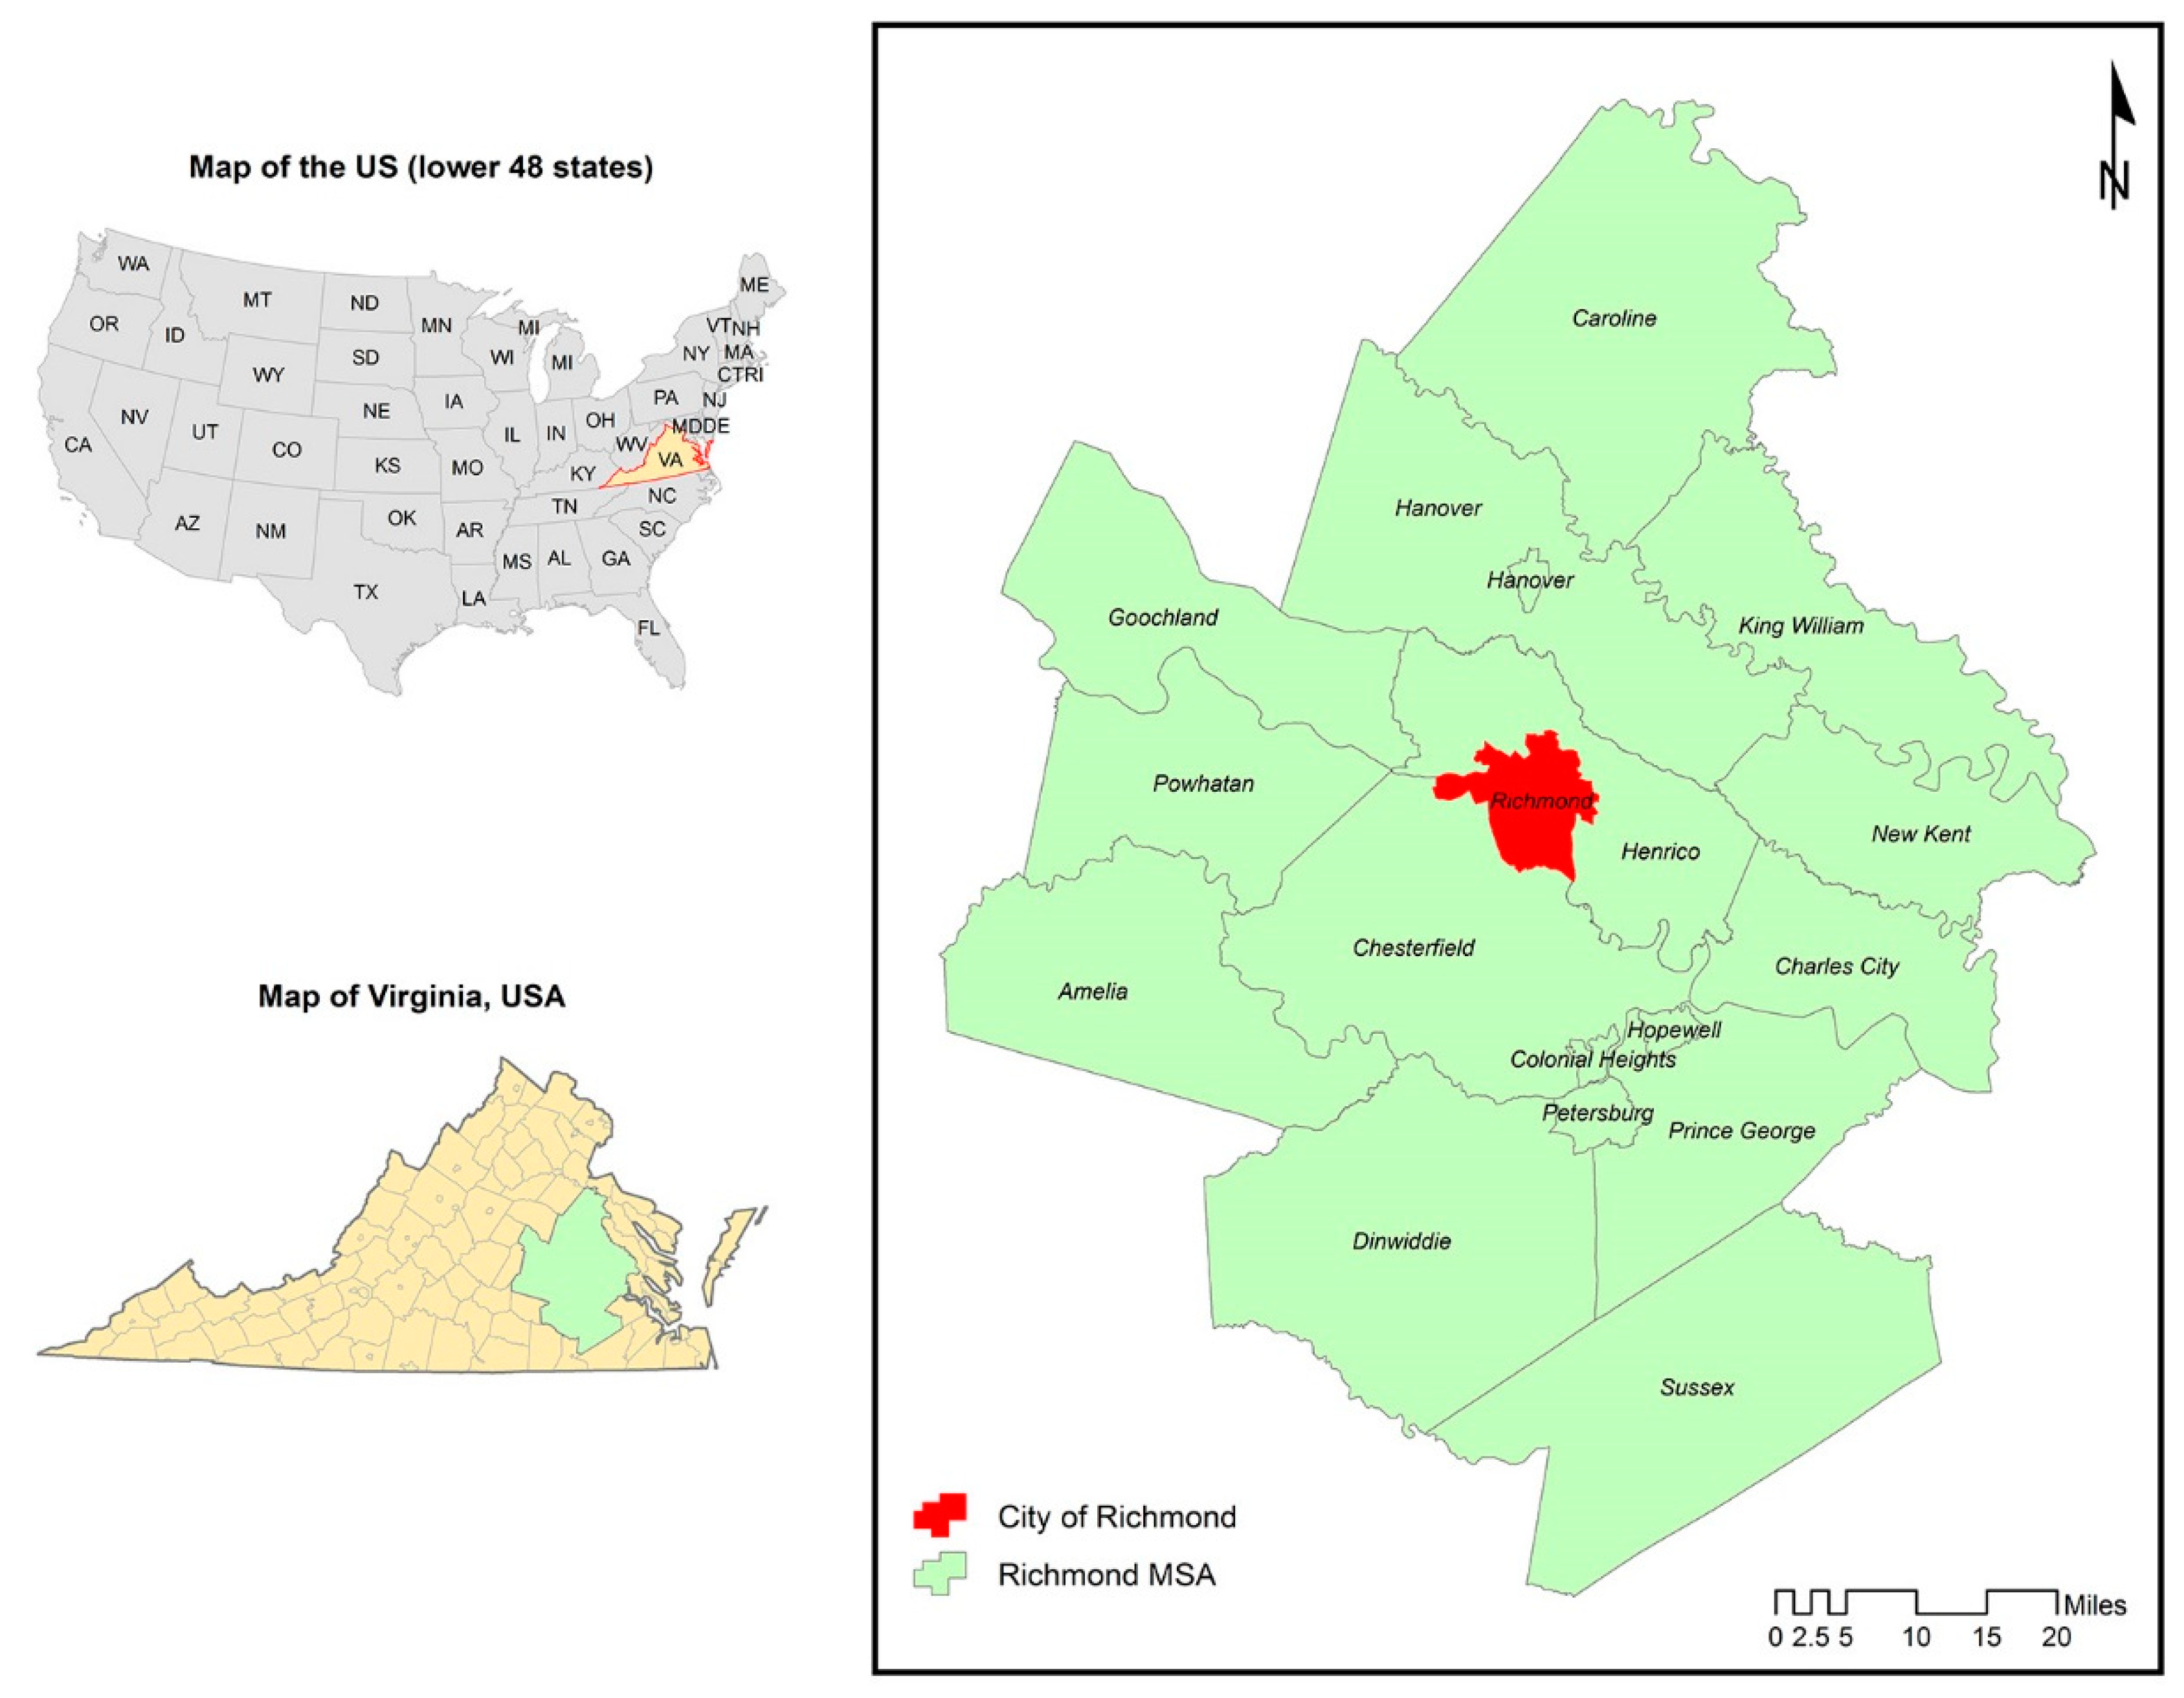
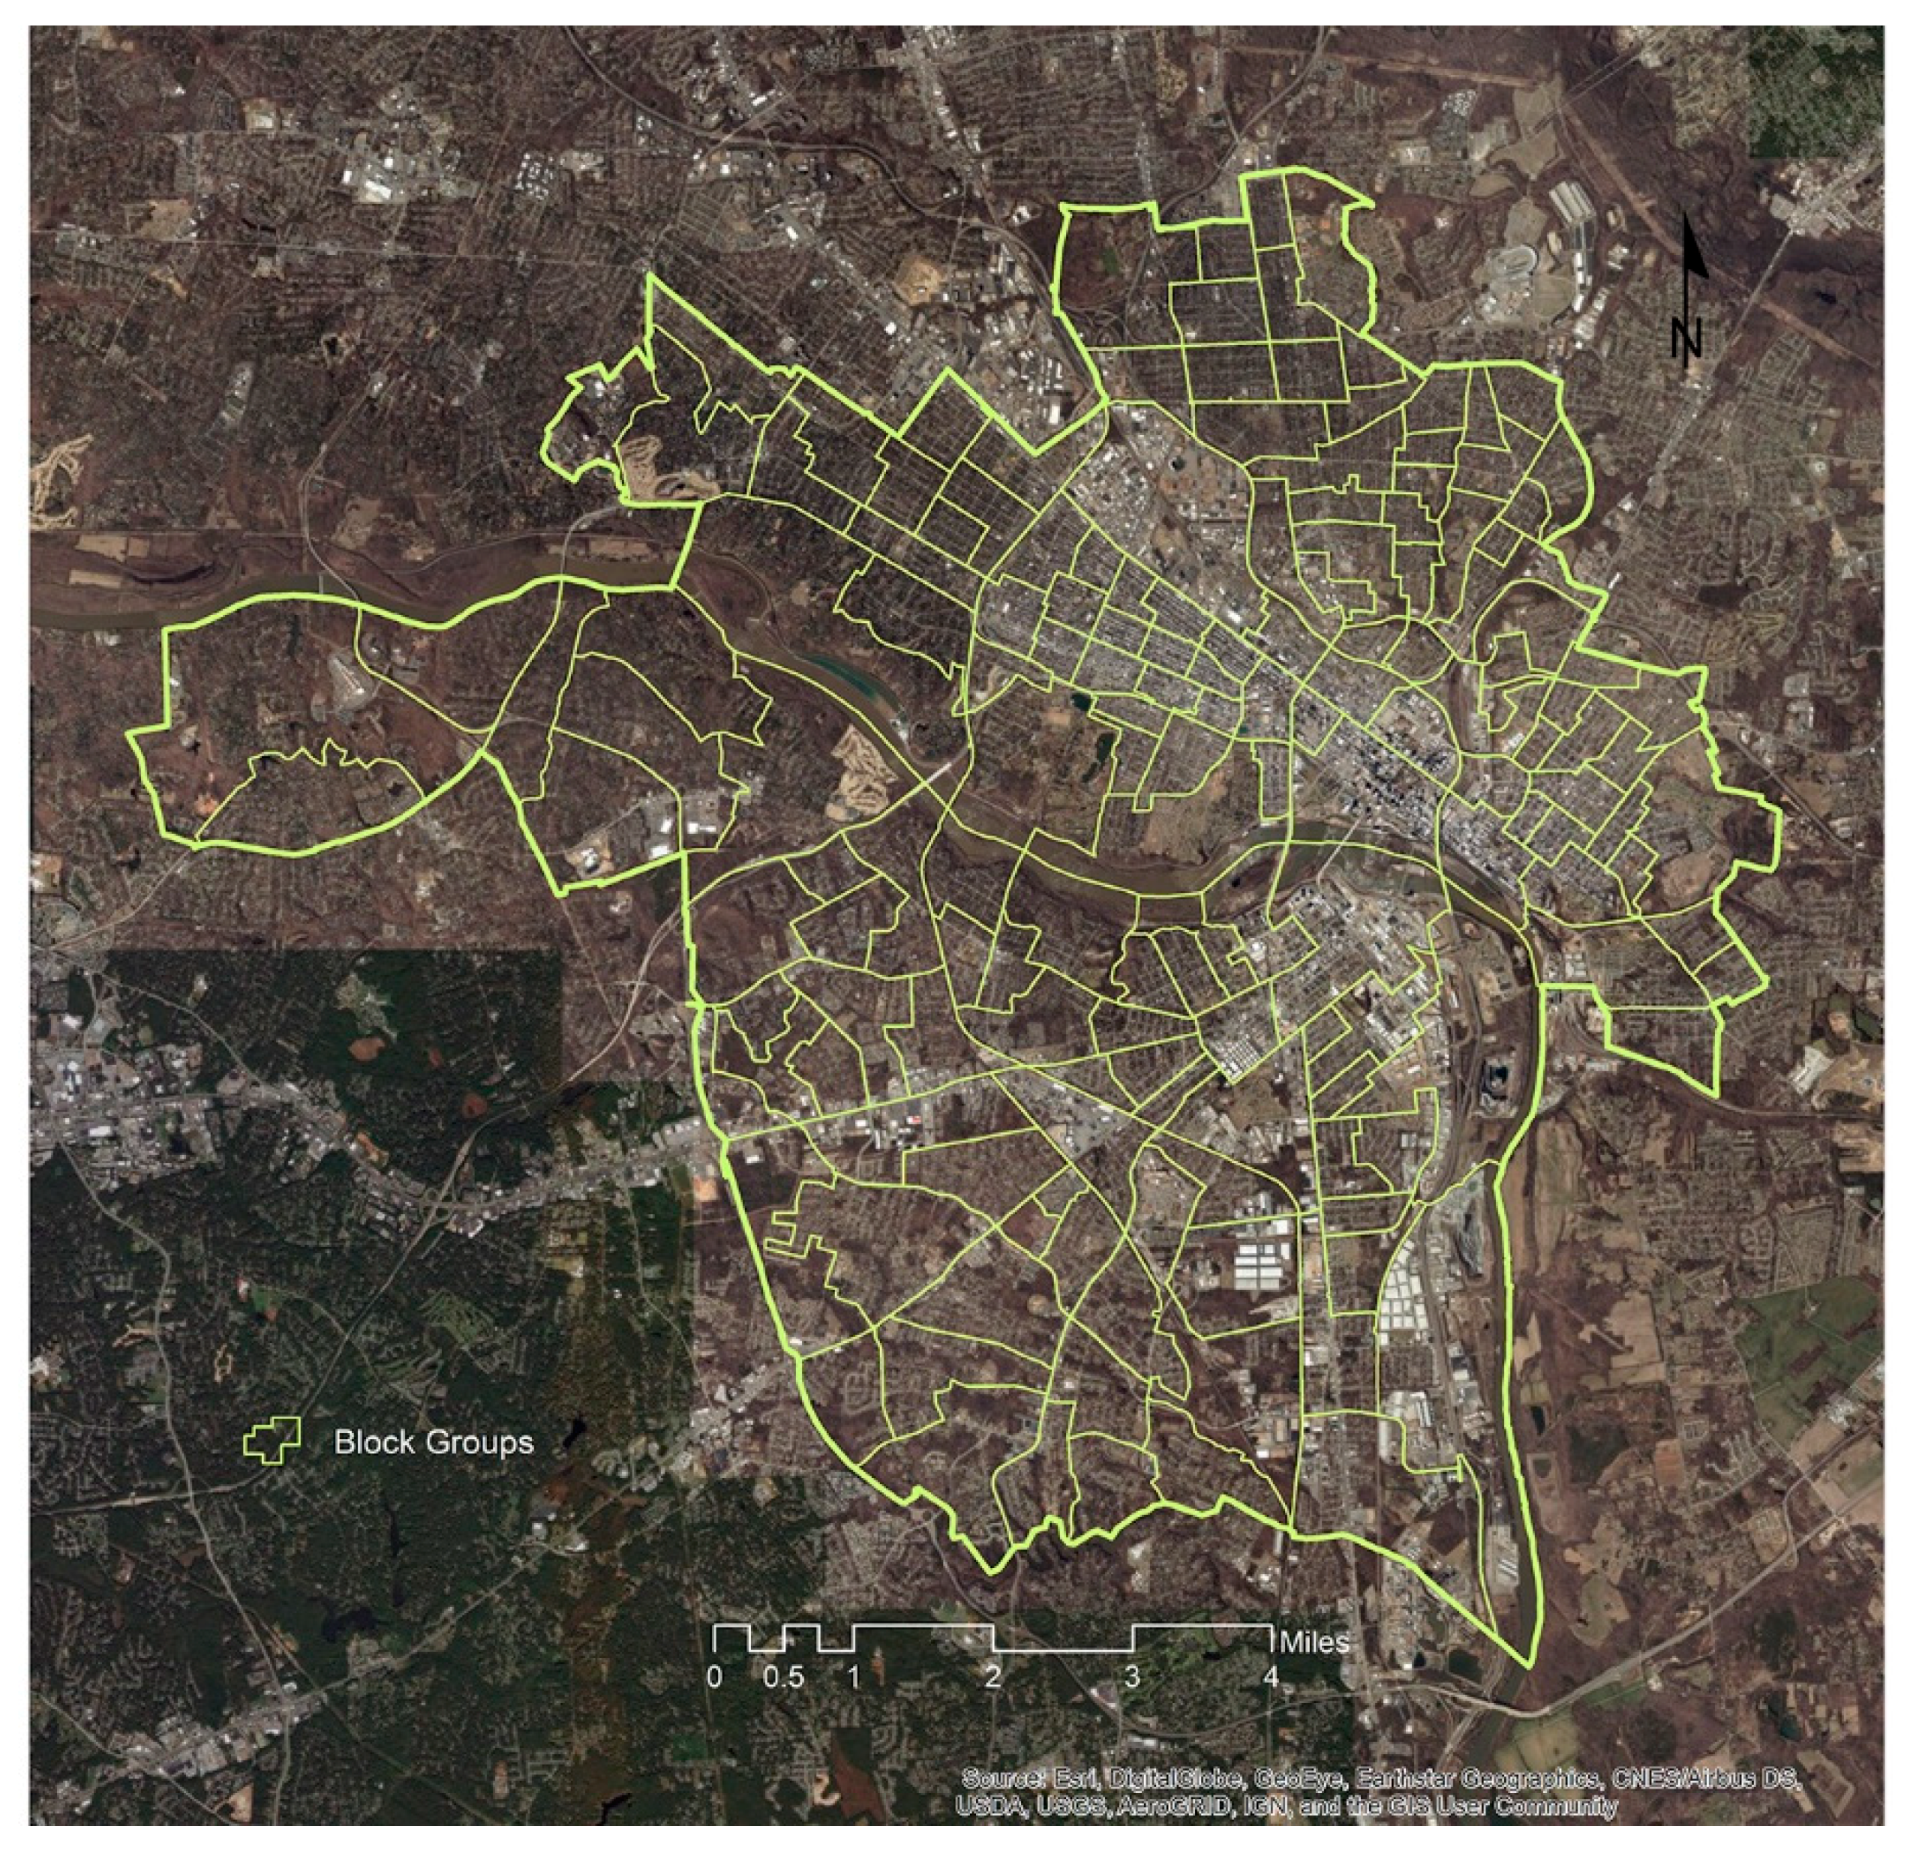
1.2. Study Area and Geographic Unit of Analysis

The City of Richmond, Virginia is selected as the study area (see Figure 2). It is Virginia’s capital located at the core of the Richmond Metropolitan Statistical Area (MSA) and about 100 miles south of the U.S. capital Washington, D.C. According to the 2012–2016 American Community Survey 5-Year Estimates [45], Richmond has a population of 216,773, or 17.23% of the Richmond MSA population of 1,258,158.
The most granular geographic unit of the study is a parcel. In specific, I used the 2014 assessor’s database of the City of Richmond [46] to determine a parcel’s location and its use. Each parcel has two assessed values—land and improvement, and only parcels that have improvement assessment values are considered and they are referred in this study as developed parcels. I chose to use developed parcels to capture parcels that are already developed according to their land use designations. Parcels zoned for certain land uses but yet to be developed (i.e., without improvements) are excluded from the calculations of land value, development compactness, and land use mix. As shown in Table 1, Richmond has a total of 69,787 parcels among them 62,474 are developed parcels which are classified into four land use categories. The majority of developed parcels are residential (89.12%), followed by business (7.05%), industrial (1.86%), and public (1.97%). Figure 3 shows the spatial distribution of development parcels in the City of Richmond.
According to the U.S. Census Bureau, the City of Richmond has 66 Census Tracts [47] subdivided into 161 Census Block Groups [37] which are further divided into 5213 Census Blocks [48]. The number of Census Blocks ranges from 5 to 193 in the Census Block Groups, an average of 32.34 Census Blocks per Census Block Group.
While any of the Census geographic units can be used as the unit of analysis, the Census Blocks are deemed too small to provide meaningful variations when it comes to the measurements of development compactness and land use mix. On the other hand, considering the size of the study area being a medium-sized city, the Census Tracts are deemed too coarse for the purpose of the study. For these reasons, I chose to use the Census Block Group as the geographic unit of analysis in this study. All dependent and independent variable values are calculated at or aggregated to the Census Block Group level. In other words, the 161 Census Block Groups (see Figure 4) serve as individual cases that are analyzed to derive research findings.

2. Materials and Methods

This study considers land value as the dependent variable while independent variables include development compactness, land use mix, accessibility to jobs, retail stores, and public transportation. The classification of observed variable values is based on their similarities. Dent [49] (pp. 147–149) describes this classification method as “Natural Breaks” which is commonly done by (1) visually inspecting the graphic array of observed values and manually selecting the break values or (2) employing an optimization method like the Jenks Optimization [50,51] to form classes that optimize internal homogeneity within classes and external heterogeneity among classes [52]. In this study, I adopted both techniques to classify observed variable values. The classification process begins with sorting observed values in ascending order and plotting them on a Cartesian plane where the x-axis corresponds to the ordinal positions of the Census Block Groups while the y-axis corresponds to the observed variable values associated with the respective Census Block Groups. The plots are visually inspected to determine the number of classes based on subjective judgment. Using ArcGIS, the Jenks Optimization method [53] is employed to establish the break values based on the pre-determined number of classes. The resulting plots and break values are shown beside the maps in the following sections that describe the variables investigated in this study.

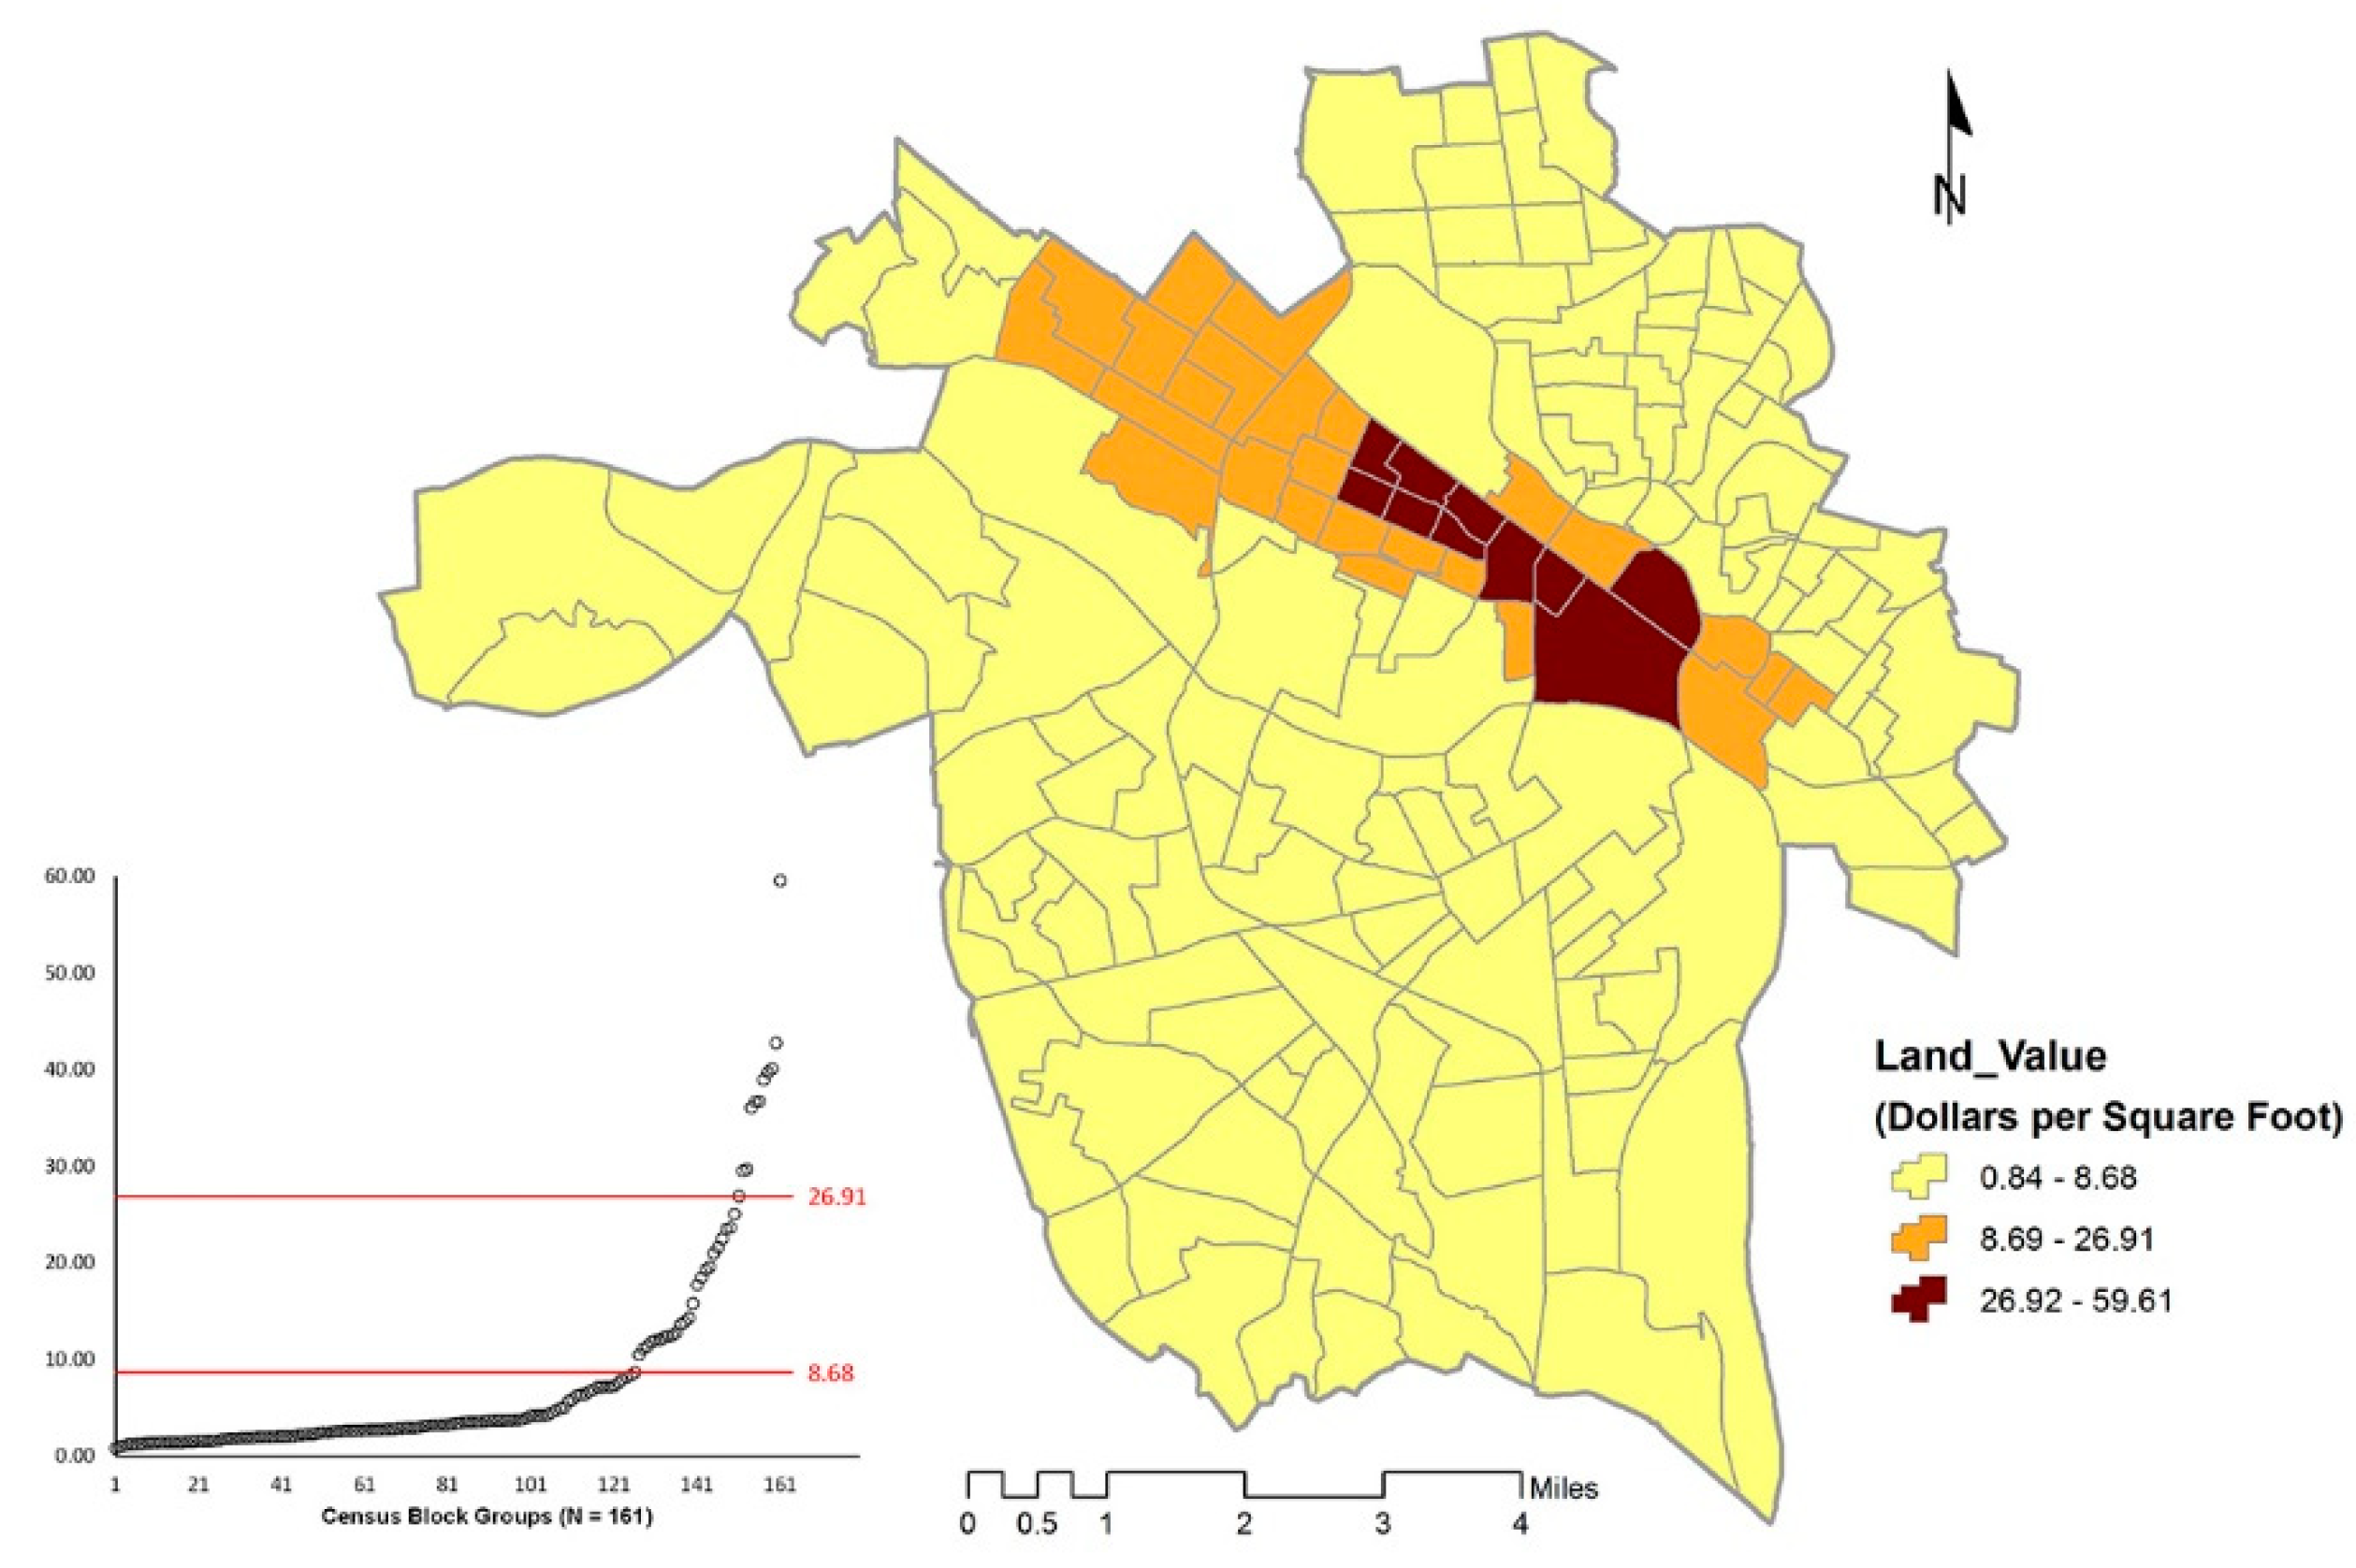
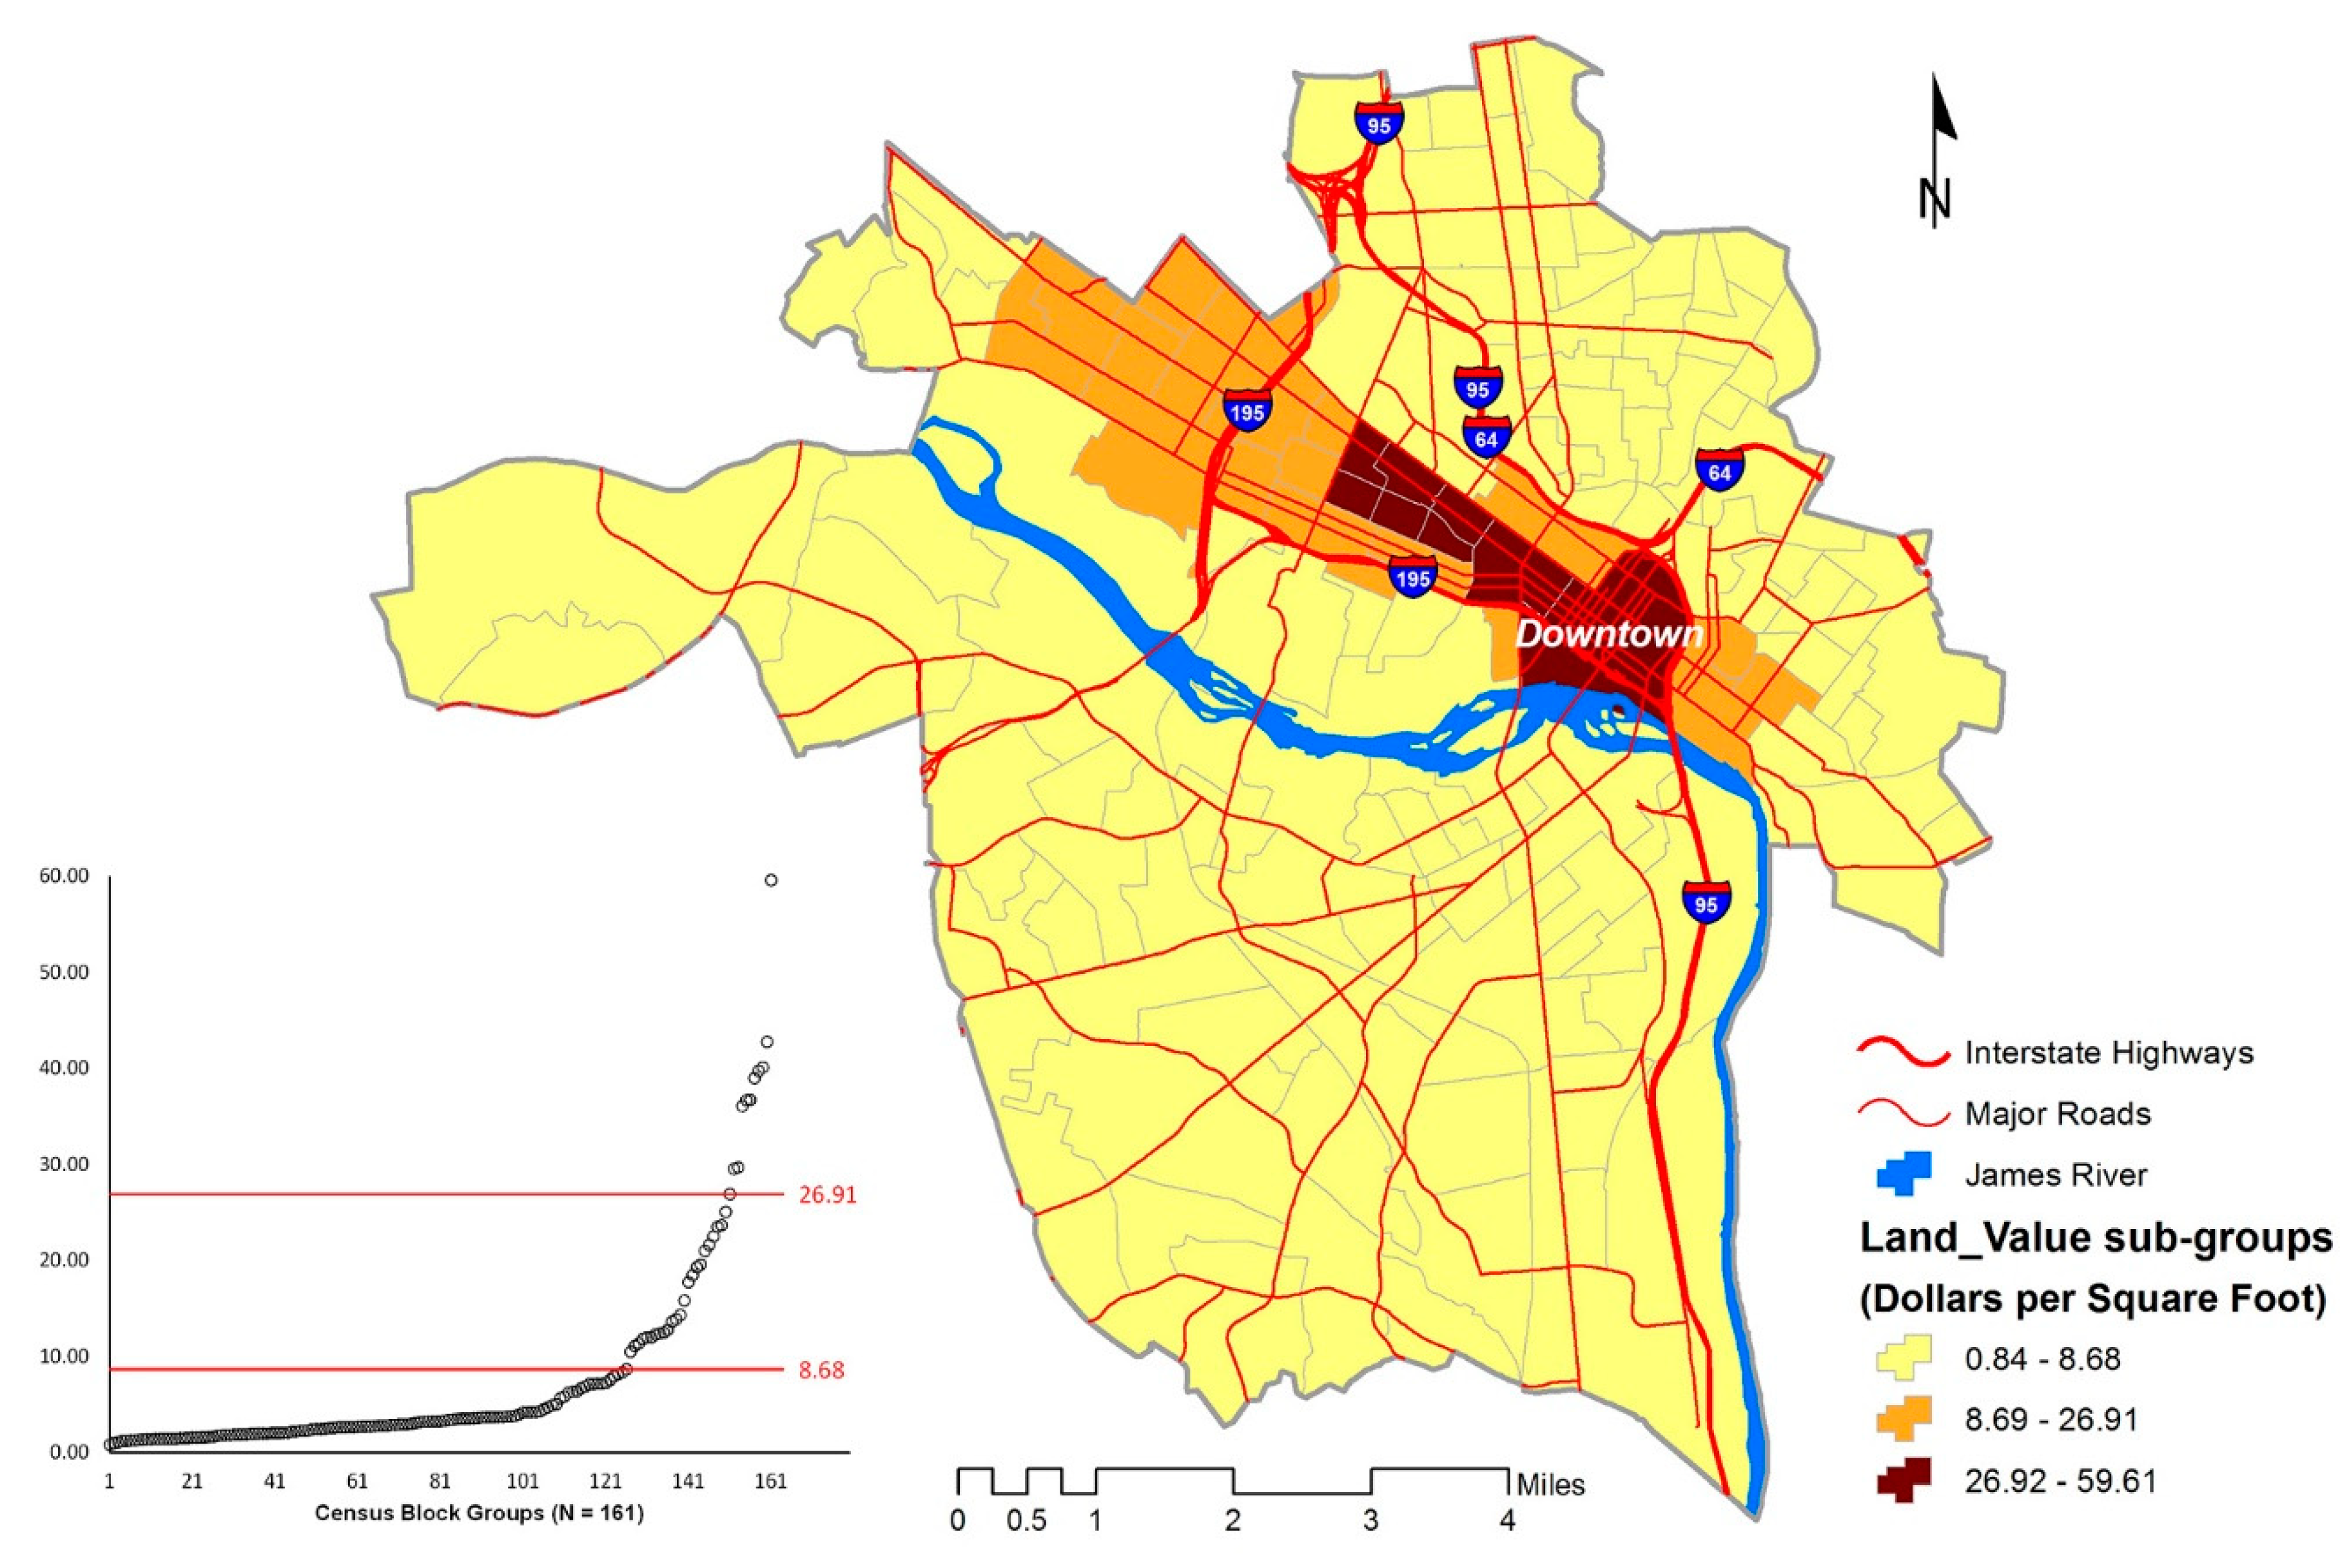
2.1. Land Value—The Dependent Varialbe

To conduct the analyses, I built a parcel-based GIS database and carried out variable measurements at the Census Block Group level. First, the dependent variable is land value which is derived from the 2014 assessed land value of developed parcels in the City of Richmond. For each Census Block Group i, the calculation of its land value is based on Equation (1), where ALVj is the assessed land value of a developed parcel j, and Aj is the area measurement of parcel j in square feet.
L a n d _ V a l u e i =   j = 1 n A L V j j = 1 n A j
It should be noted that I intentionally classified the Census Block Groups into three sub-groups of low, medium, and high land values. In the later analyses and discussion, I examined how Land_Value is influenced by the independent variables in the sub-groups. As shown in Figure 5, Census Block Groups with higher land values (shaded in dark brown color) are clustered around downtown and the more affluent areas along the Broad Street corridor (an artery traversing Richmond’s central business district and proceeding westward). Land values tend to diminish as distance to the downtown cluster increases.
Moving on to the independent variables, I considered two types of independent variables in this study, development pattern and accessibility, and accessed their relationships with and impacts on land value. Development pattern is characterized by two variables—development compactness and land use mix, while accessibility-related variables include accessibility to jobs, retail stores, and public transportation. I operationalized development compactness as an adjacency function of land uses, and the land use mix a diversity function of land uses within each Census Block Group. As to the accessibility to jobs, retail stores, and public transportation. I geocoded their locations and calculated the network distance [43] between their locations and the Census Block Group centroids using an Inverse Distance Weighted function [12] to derive the accessibility measures. The operationalization of independent variables as well as the spatial distribution and variation of their values are presented in Section 2.2, Section 2.3, Section 2.4, Section 2.5 and Section 2.6 below.

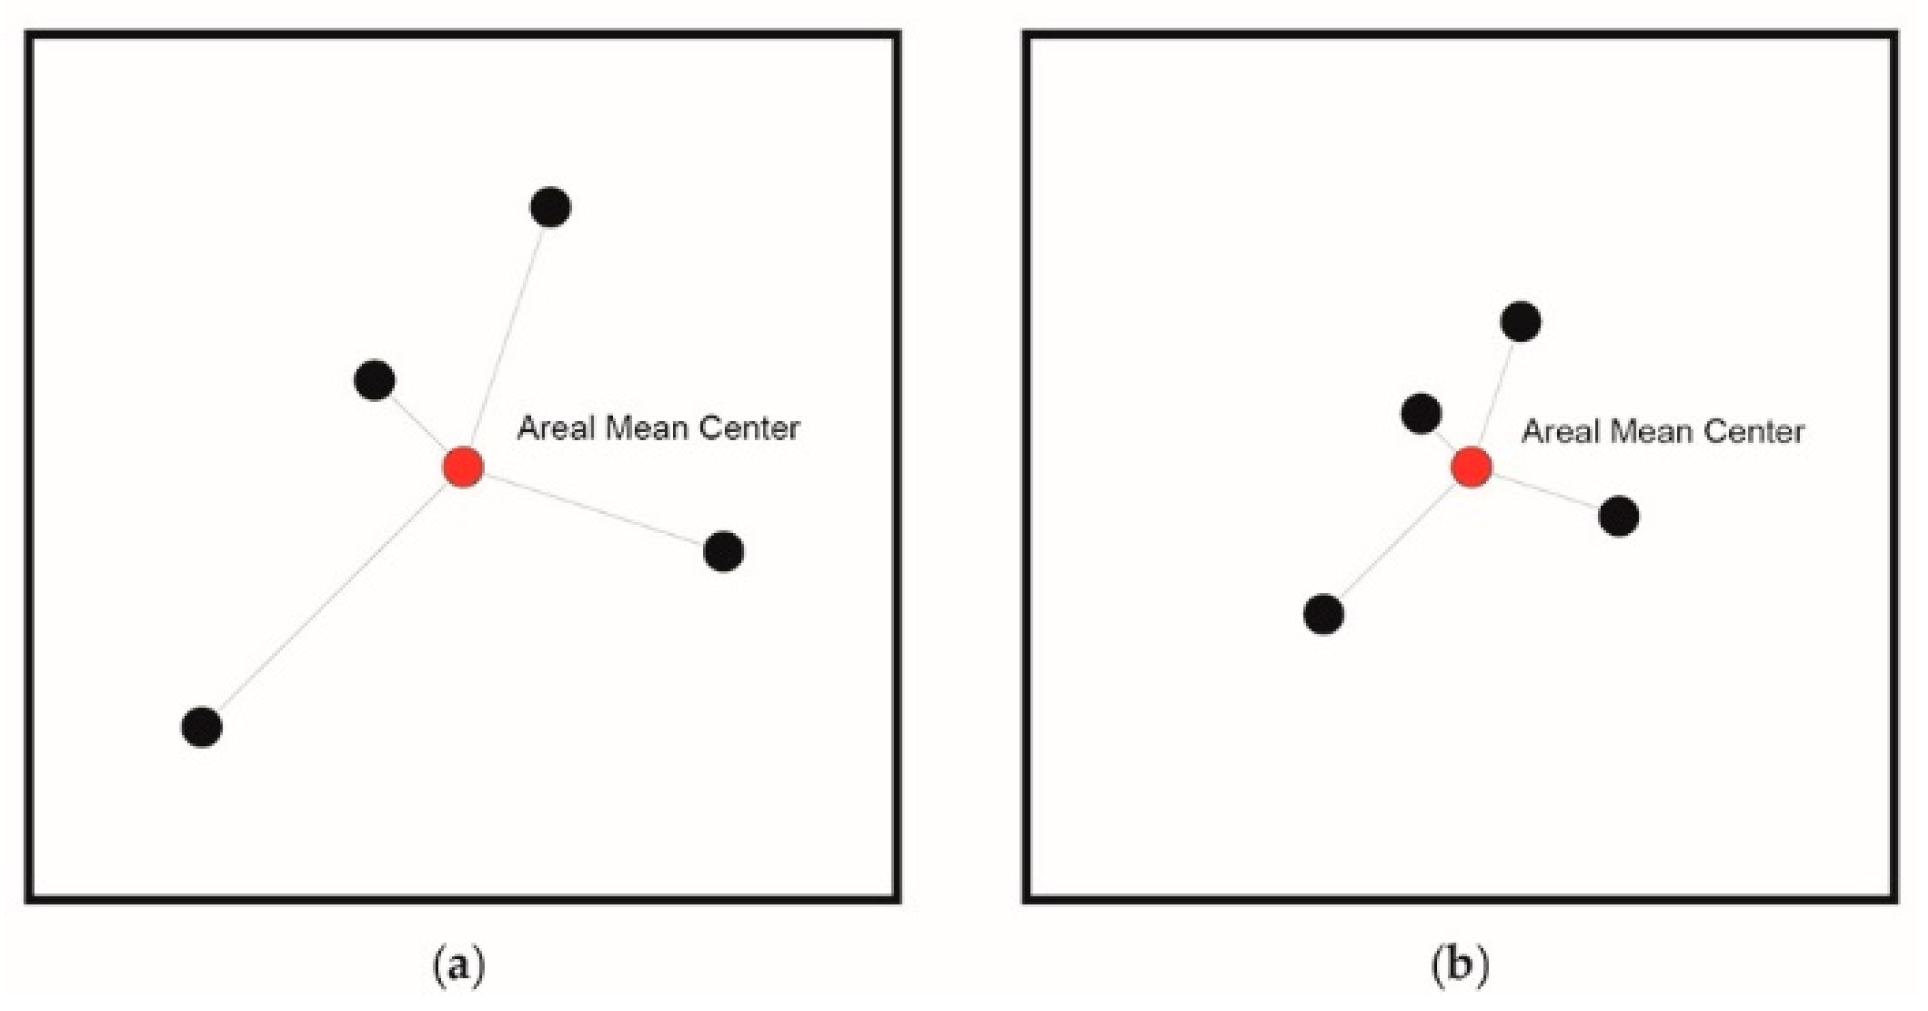
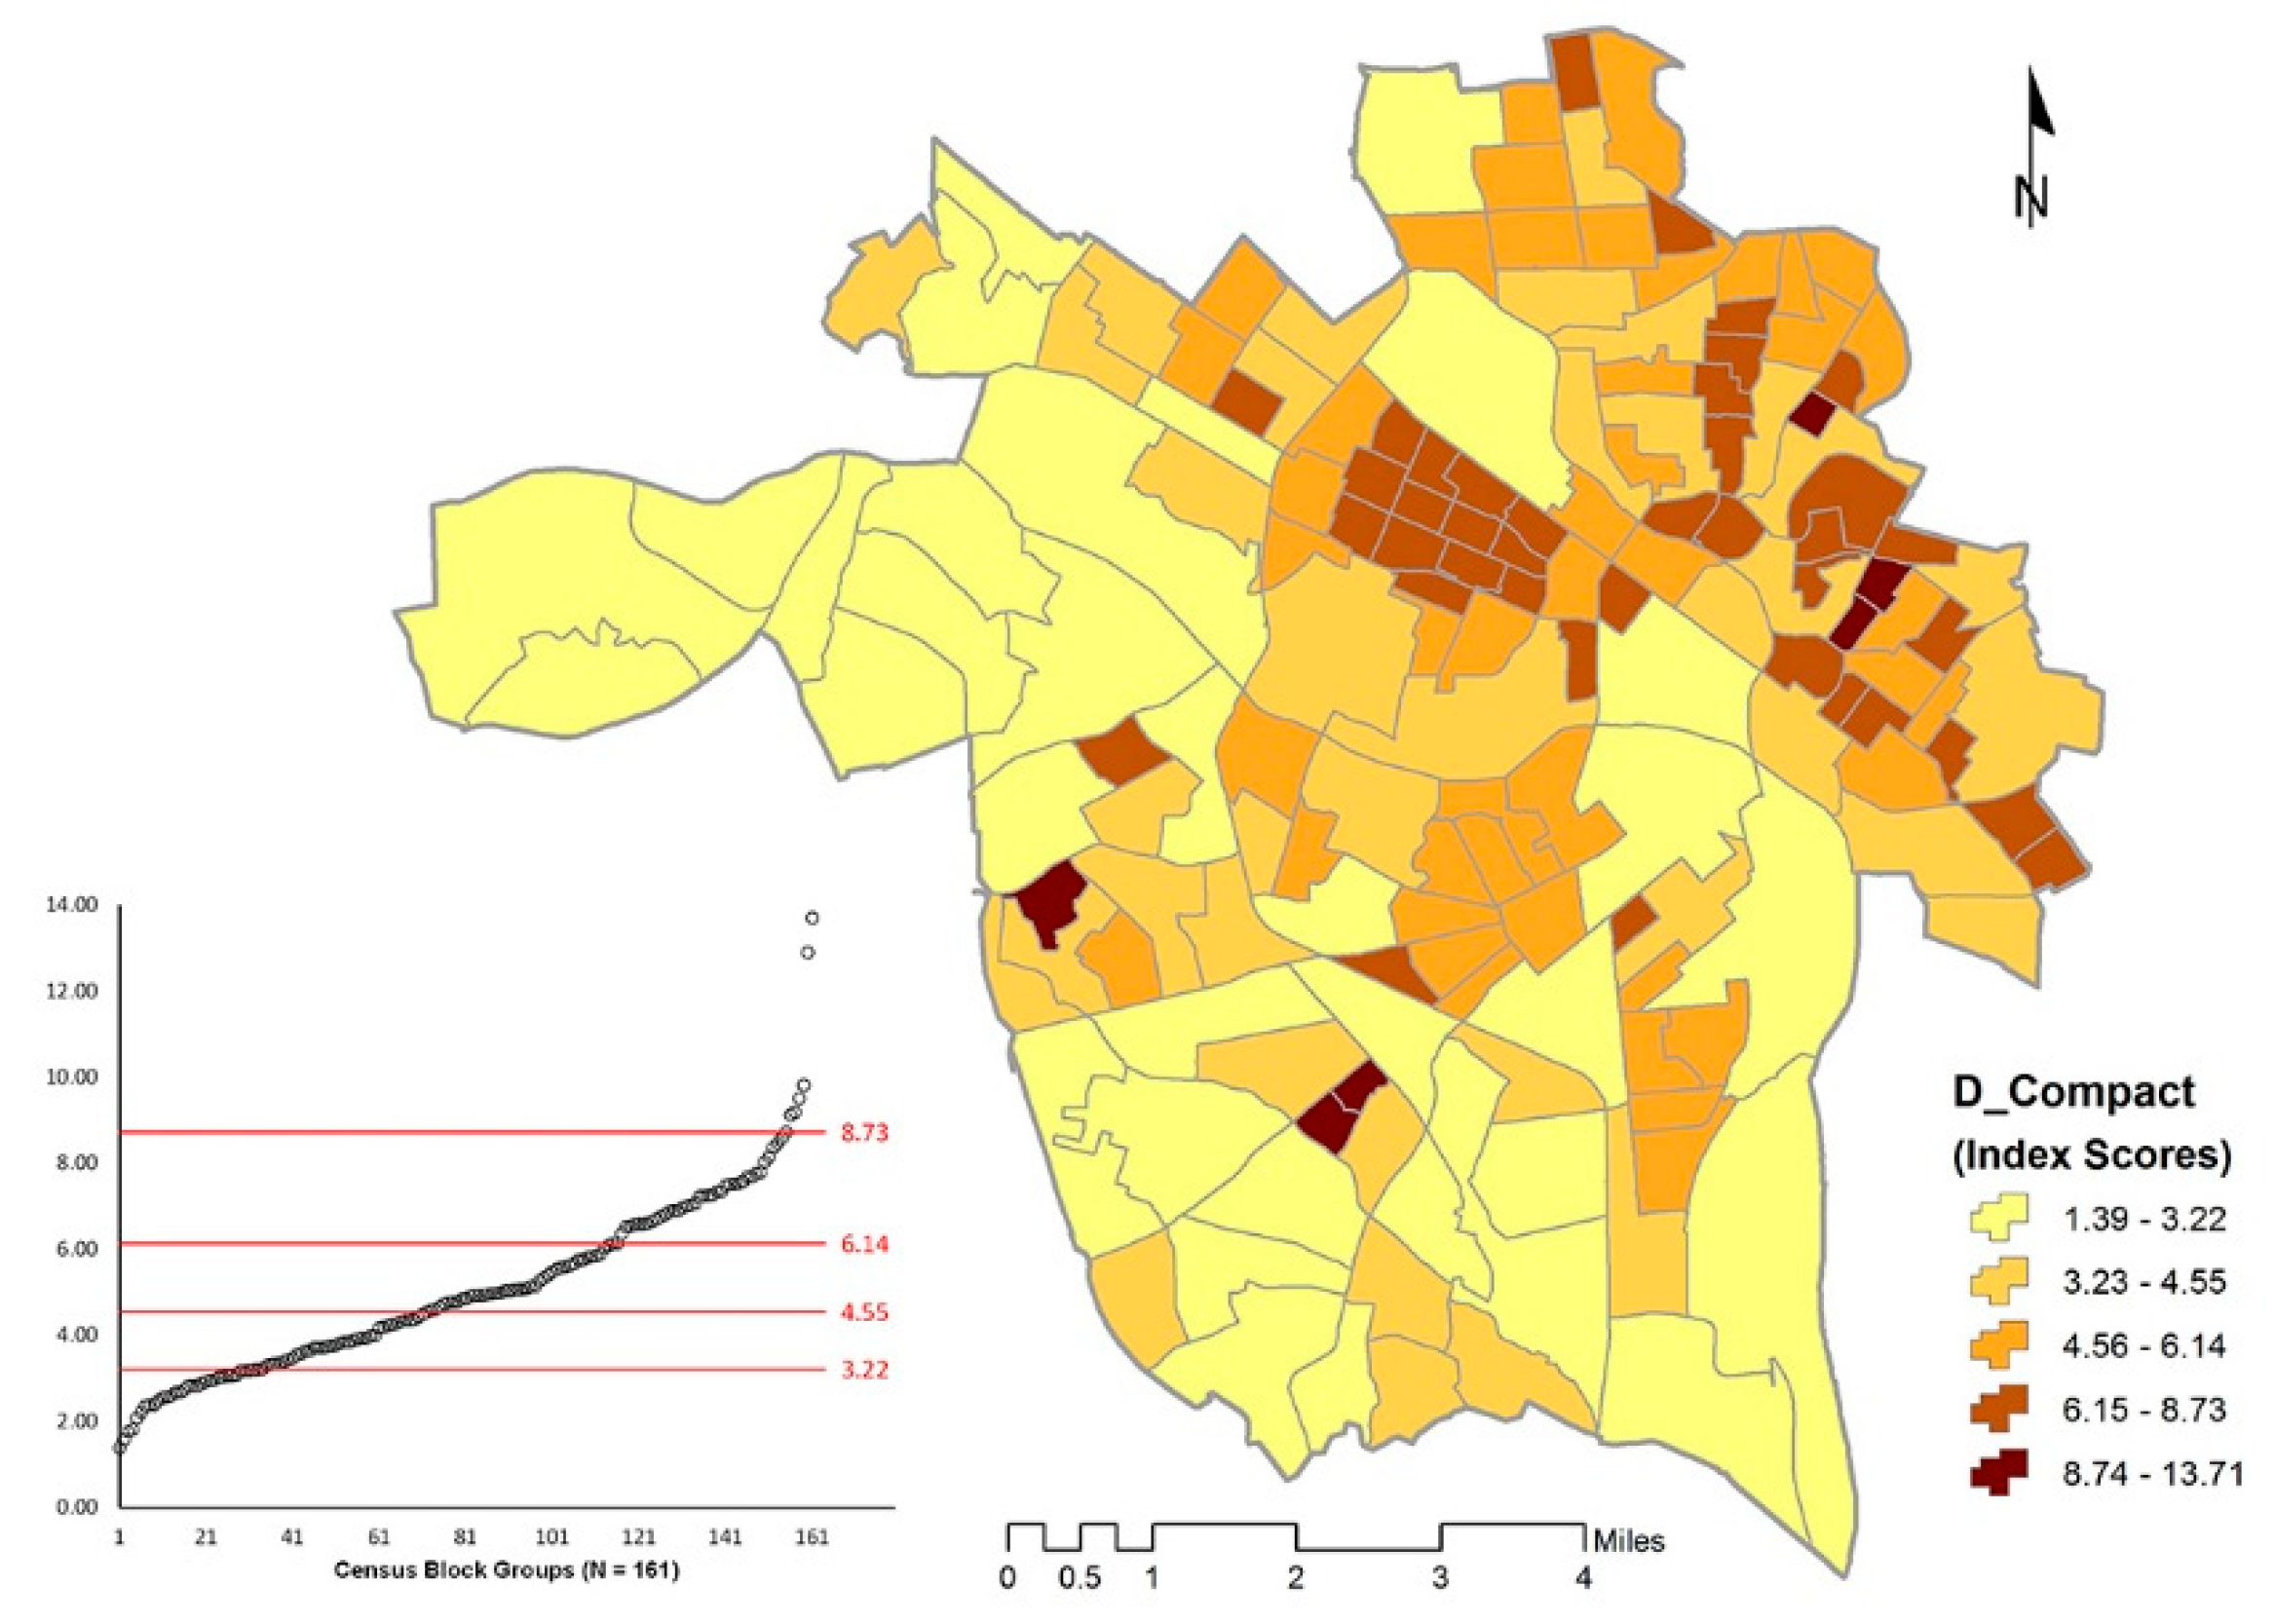
2.2. Development Compactness (D_Compact)

Development compactness of Census Block Groups (see Figure 6) is measured by standard distance [41] expressed in Equation (2), where xj and yj are the centroid coordinates of a developed parcel j, X ¯ and Y ¯ represent the areal mean center of all developed parcels within a Census Block Group i. I use the reciprocal of the standard distance so that a shorter distance (i.e., more compact) would produce a higher D_Compact value. Without the reciprocal treatment, a shorter distance would lead to a lower D_Compact value, which is counterintuitive to interpret when “shorter” distance means “more” compact. It should also be noted that I computed the standard distance in feet first but decided to convert it to miles (hence the 5280 conversion factor in Equation (2)) so that the reciprocal values do not turn out as extremely small fractional values.
D _ C o m p a c t i = ( j = 1 n ( x j X ¯ ) 2 n + j = 1 n ( y j Y ¯ ) 2 n   /   5280 ) 1  

2.3. Land Use Mix (LU_Mix)

Landscape ecologists characterize a landscape by its composition and configuration [54,55] where landscape composition encompasses the variety and abundance of patch types within a landscape. In an urban setting, landscape composition is similar to the concept of land use mix. In this study, I treat each Census Block Group as a landscape while the developed parcels in a Census Block Group act like patches, and used the Shannon’s Diversity Index [42] to measure land use mix. It is based on Equation (3), where LU_Mixi is the land use mix index of a Census Block Group i, and Pj is the area proportion of a land use type j within that Census Block Group.
L U _ M i x i =   j = 1 4 ( P j l n ( P j ) )
Developed parcels within each Census Block Group are classified, based on their existing uses, into four land use categories—residential, business, industrial, and public (see Table 1). The LU_Mix index is 0 when a Census Block Group contains only one type of land use (i.e., no diversity). LU_Mix increases as the type of different land uses increases and the proportional distribution of area among land uses becomes more even (see Figure 7).

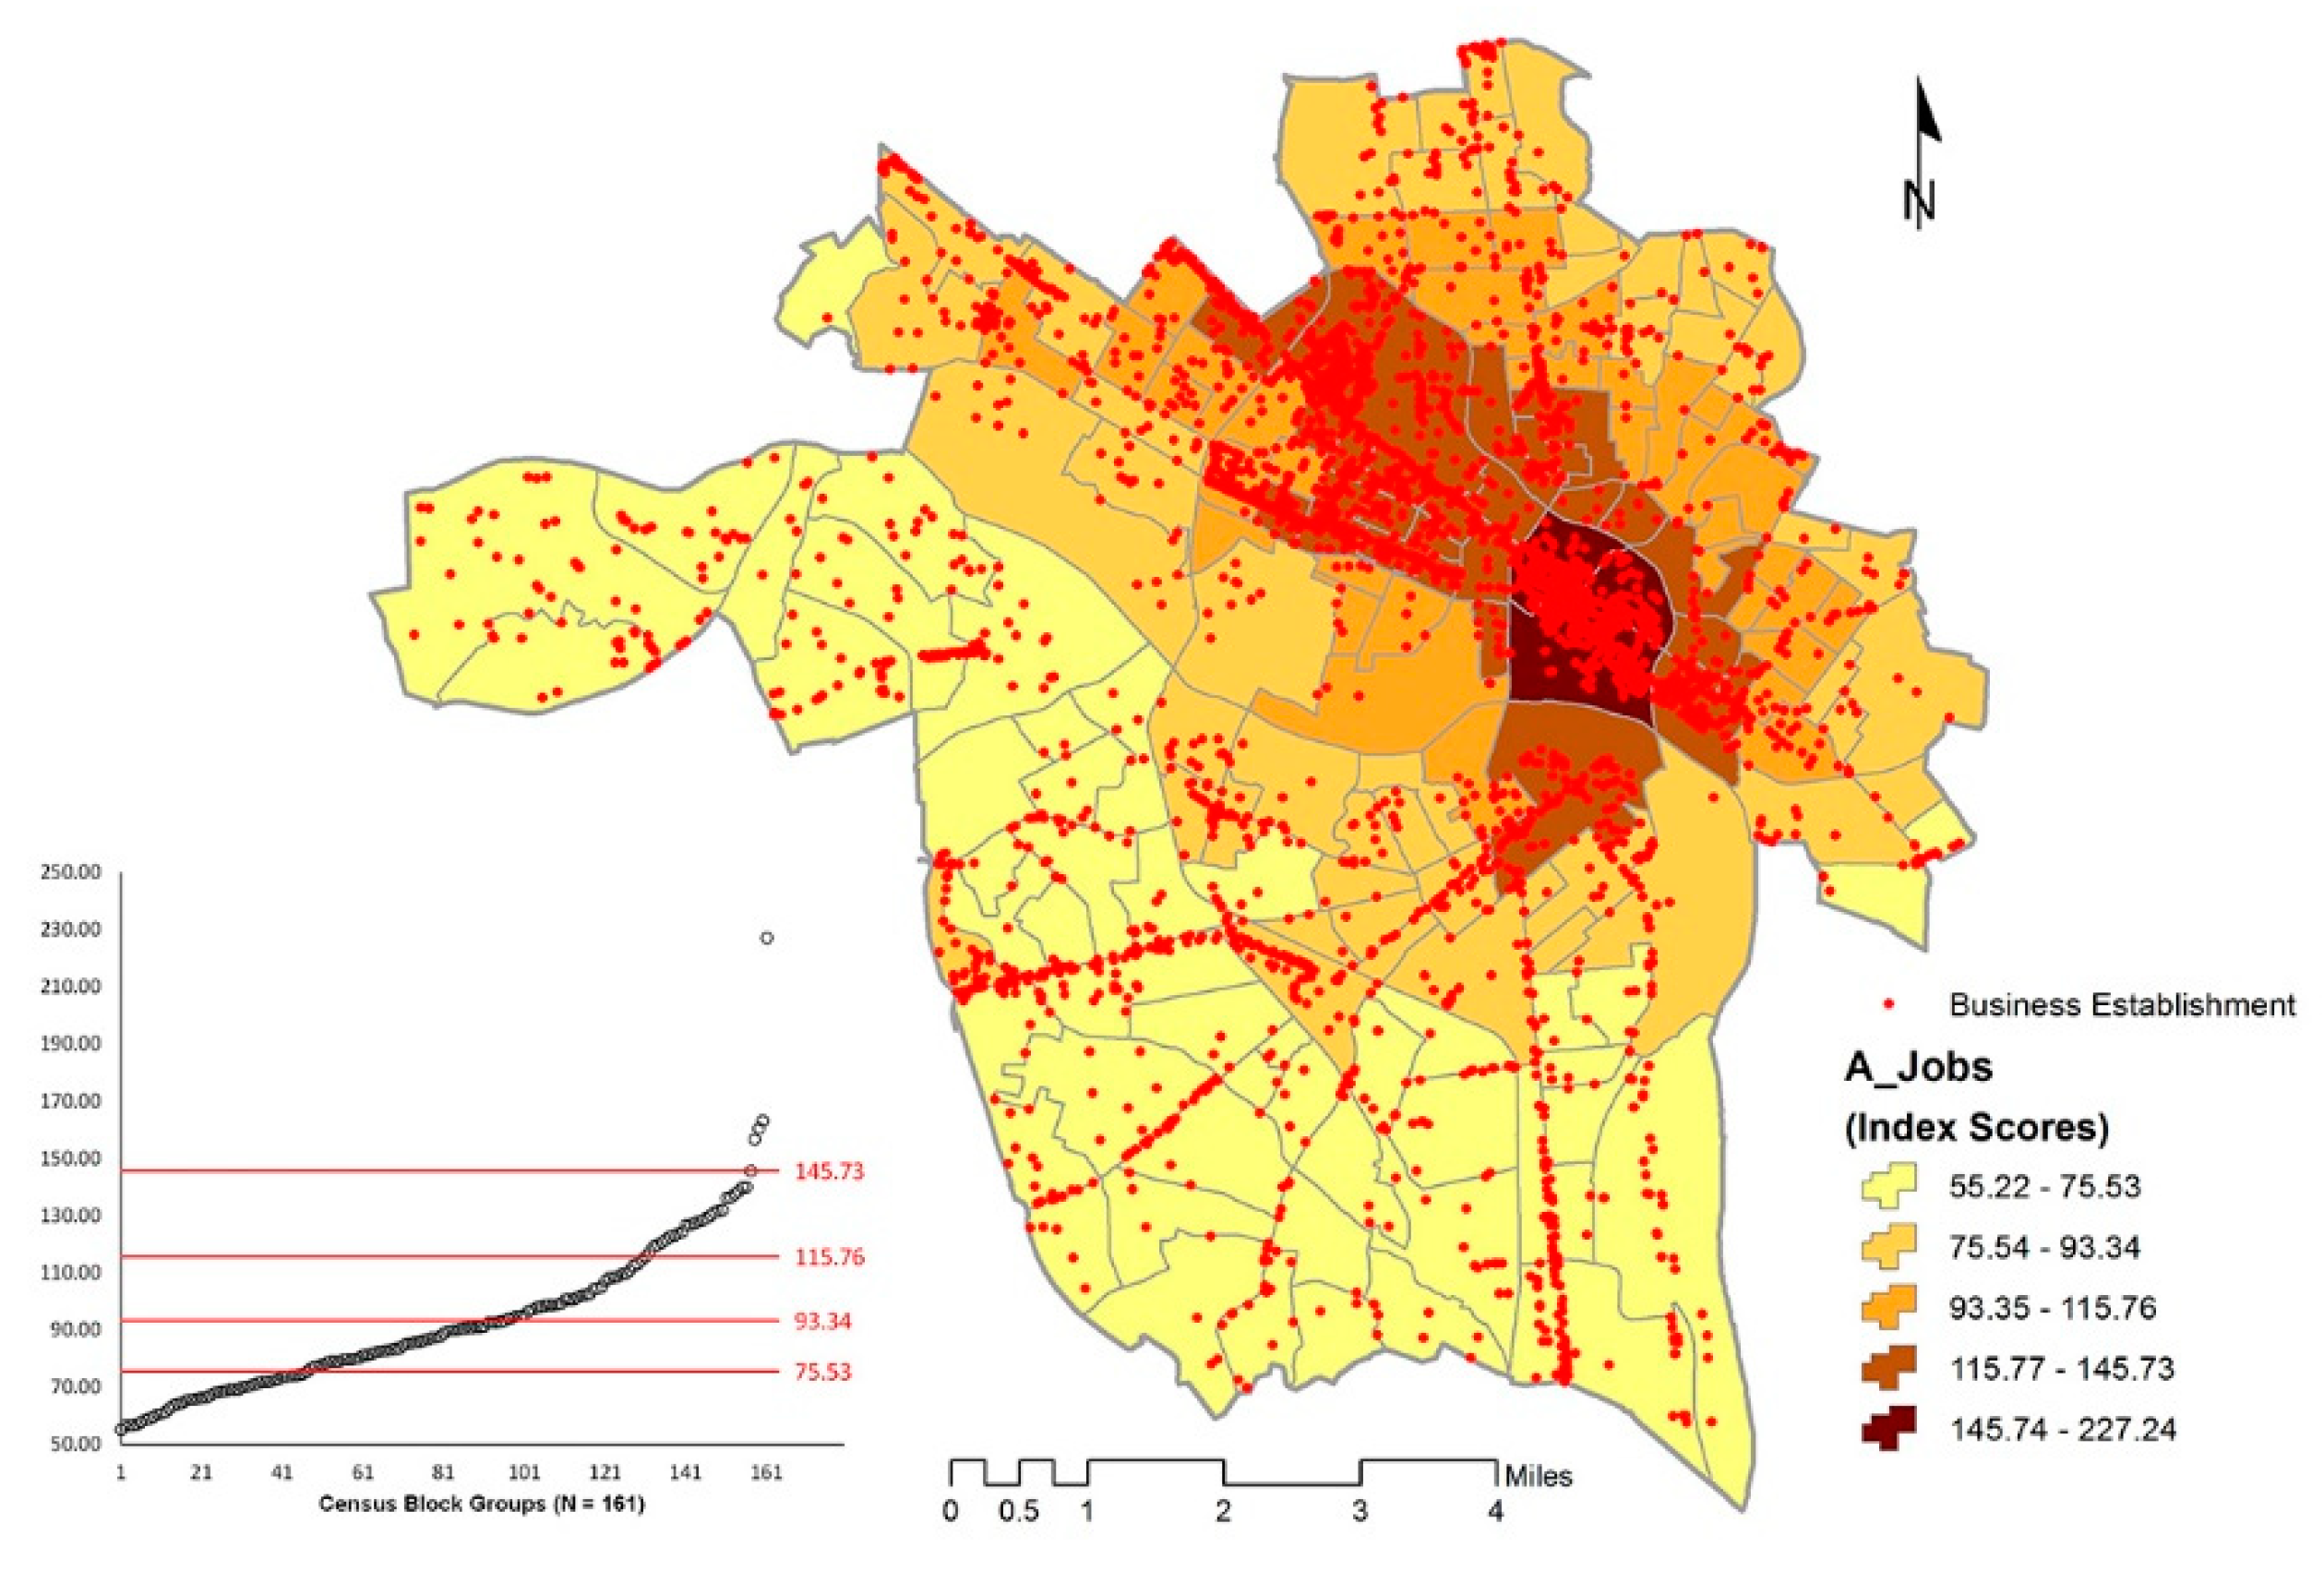
2.4. Accessibility to Jobs (A_Jobs)

The number of jobs available in each Census Block Group is derived from the Quarterly Census of Employment and Wages (QCEW) [56] of the 2nd quarter of 2013. Table 2 presents an overview of business establishments and employees in each sector defined in the North American Industry Classification System (NAICS)—a total of 6053 establishments and 150,084 employees. The number of establishments in the Census Block Groups ranges from 0 to 1330, with an average of 38 establishments per Census Block Group. Respectively, the number of employees in the Census Block Groups ranges from 0 to 33,261, with an average of 944 employees per Census Block Group.
In addition to the number of business establishments and their employees, the QCEW dataset provides establishment locations at the address level. To determine the number of jobs in the Census Block Groups, I first geocoded the establishment locations as points, intersected them with the Census Block Group polygons, then aggregated the number of employees (representing jobs) of the establishments in each Census Block Group. Finally, the resulting number of jobs are joined to the centroids of Census Block Groups, which serve the basis to compute the accessibility to jobs.
I calculated the accessibility to jobs for each Census Block Group based on the number of jobs in that Census Block Group, as well as its proximity to jobs in the rest of Census Block Groups. Each Census Block Group i receives a jobs-accessibility score, A_Jobsi, based on Equation (4), where Jobsj is the number of jobs in Census Block Group j, Dij is the network distance between the centroids of Census Block Groups i and j. Dij serves the purpose of inversely weighting accessibility to jobs by distance. In other words, accessibility to jobs diminishes as the distance to jobs increases.
A _ J o b s i =   j = 1 161 J o b s j D i j
As shown in Figure 8, business establishments concentrate in the downtown area and along major corridors (see Figure 3). Accessibility to jobs is highest in the downtown area and approximates a similar spatial pattern of land value in Figure 5 despite the classification difference.

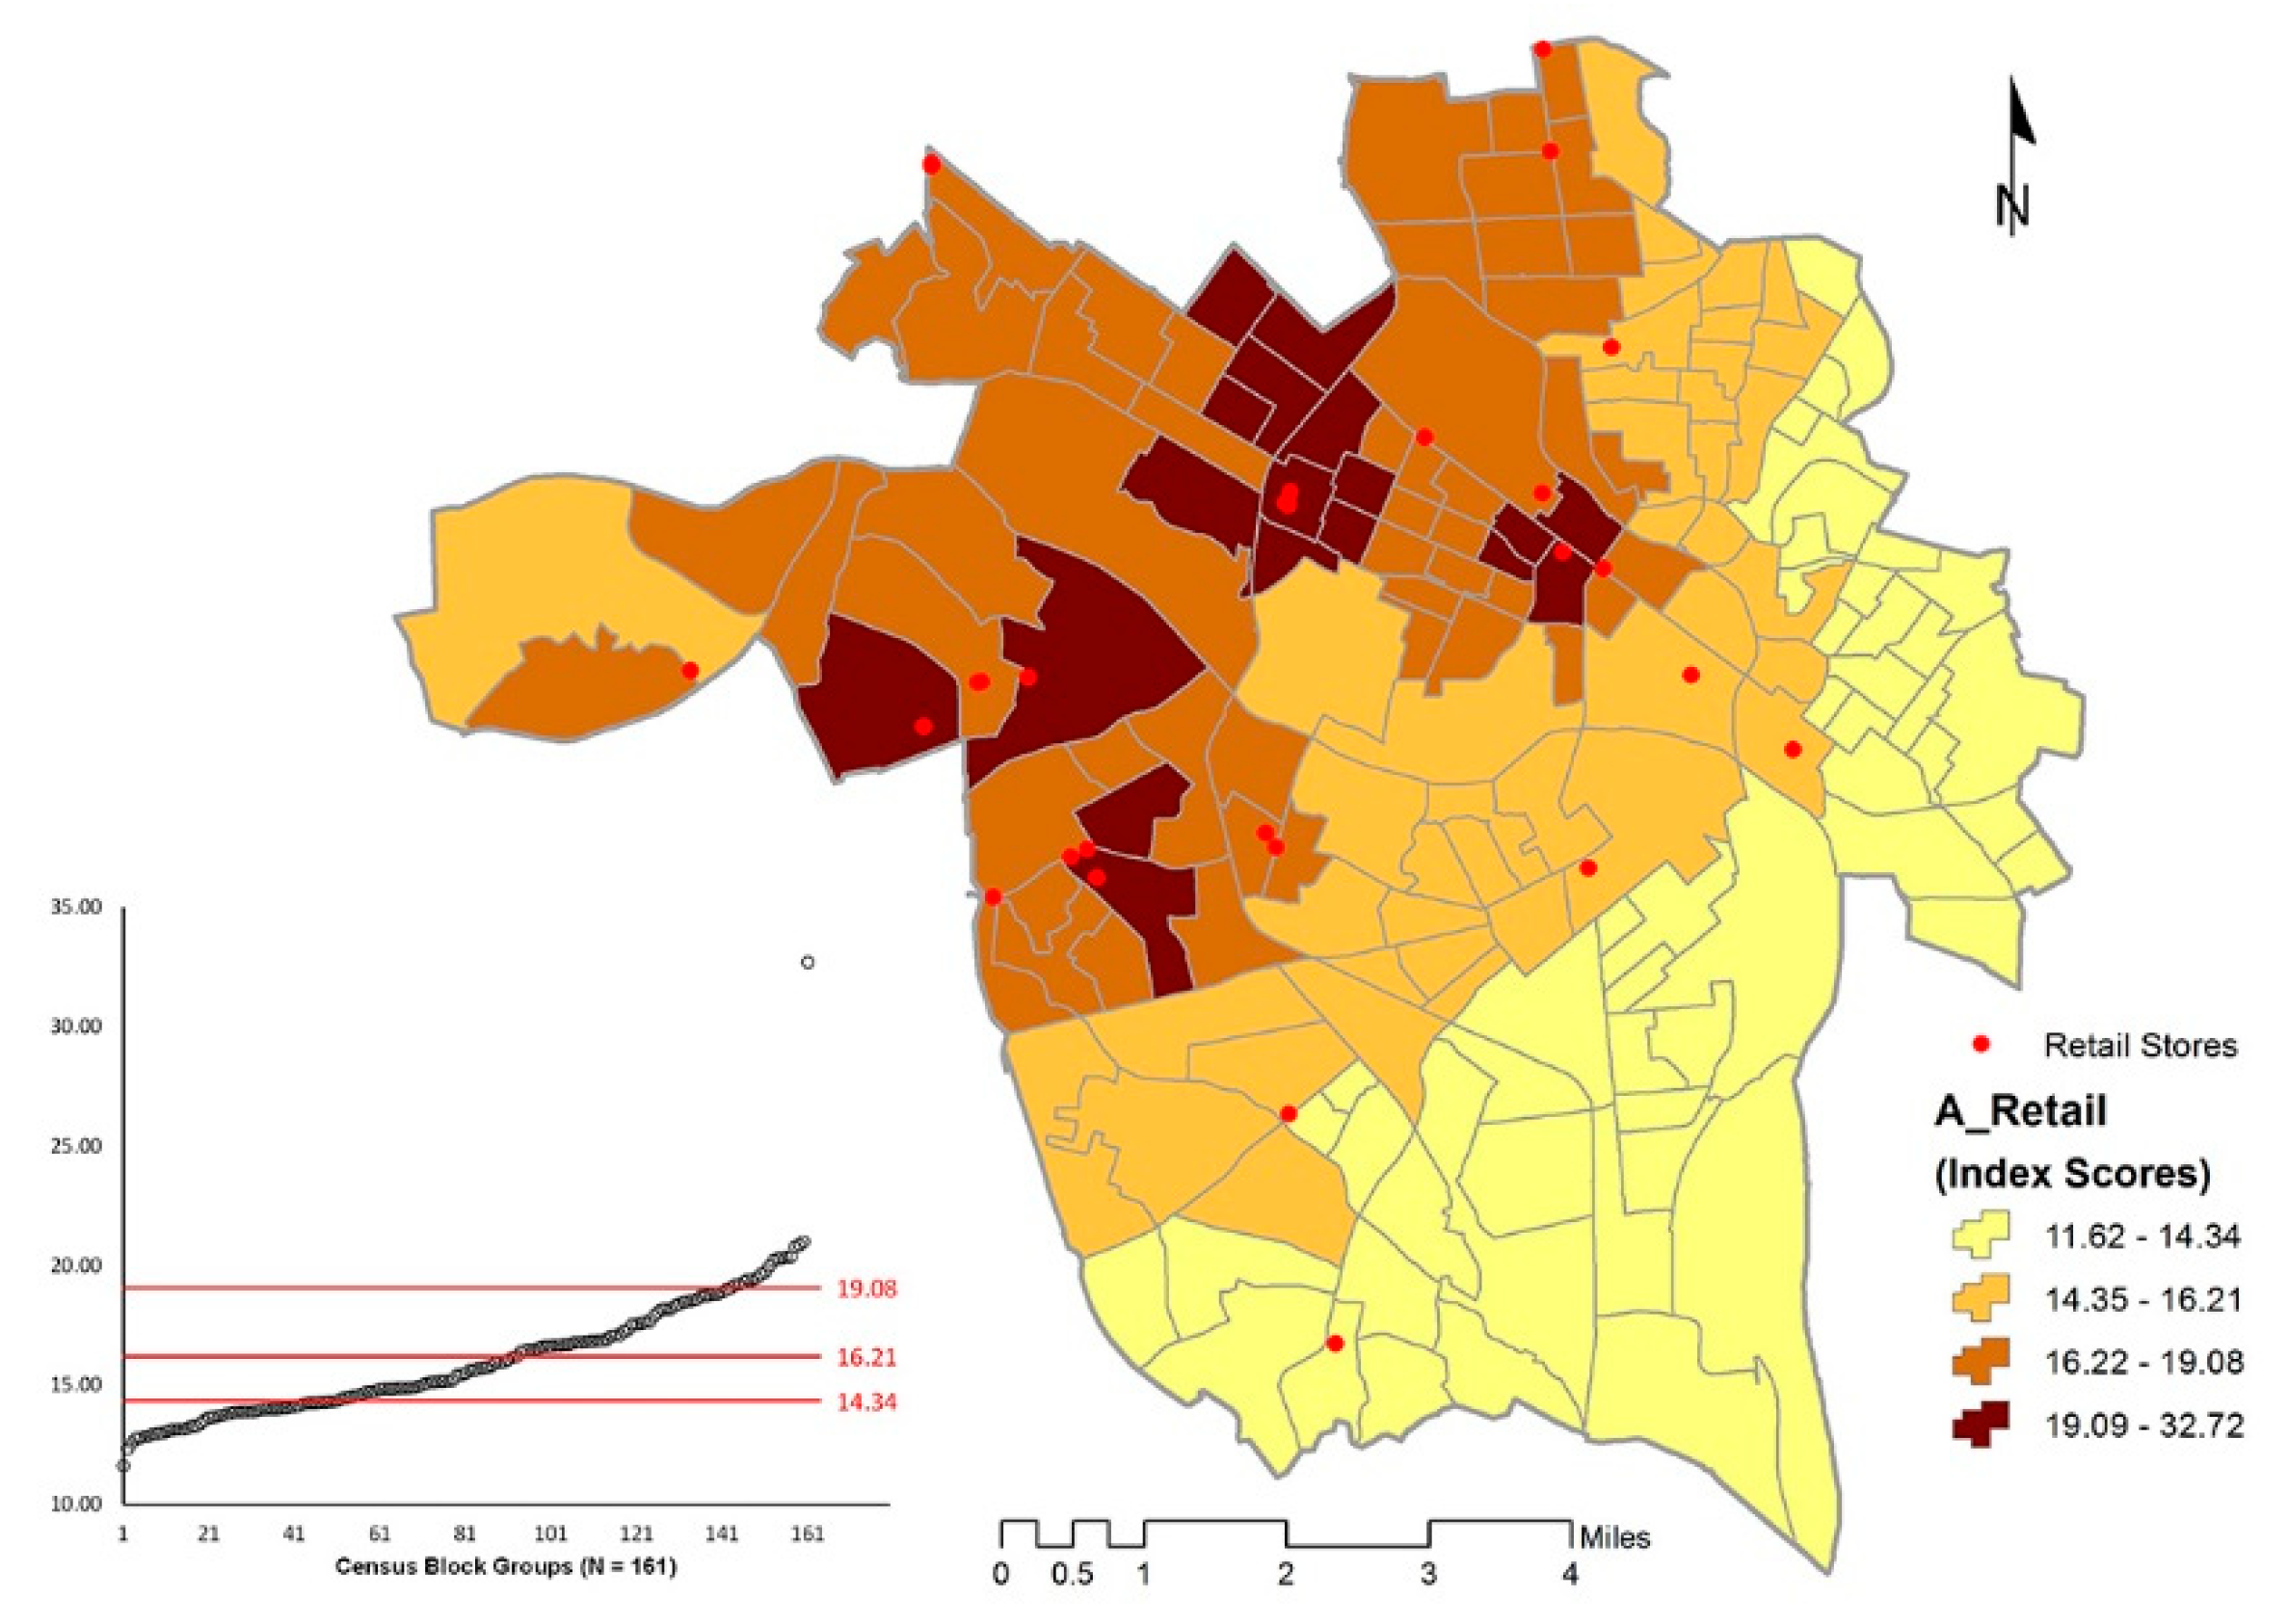
2.5. Accessibility to Retail Stores (A_Retail)

I used accessibility to retail stores as a proxy variable for shopping convenience and put an emphasis on bigger retail stores as they tend to offer a greater variety of goods and services than the smaller or specialty ones (e.g., 7-Eleven, gas station, furniture store, etc.). I selected a set of 40 retail stores including big box stores, grocery stores and pharmacies such as Walmart, Sam’s Club, Target, Costco, Food Lion, Kroger, CVS Pharmacy, Walgreens and Rite Aid. It is assumed that customers are likely to visit the selected retail stores more frequently than others. Selected pharmacies are included because of their convenient locations and that they crossover a mini-version of Target/Walmart and a grocery store. Through these companies’ websites, store addresses were obtained and geocoded (see Figure 9). I then calculated the accessibility to retail stores, A_Retaili, for each Census Block Group i based its proximity to stores in the city. A_Retaili is based on Equation (5), where Dij is the network distance between the centroid of a given Census Block Group i and a retail store j. It is inversely weighted by distance where accessibility to retail stores diminishes as the distance to stores increases.
A _ R e t a i l i =   j = 1 40 D i j 1

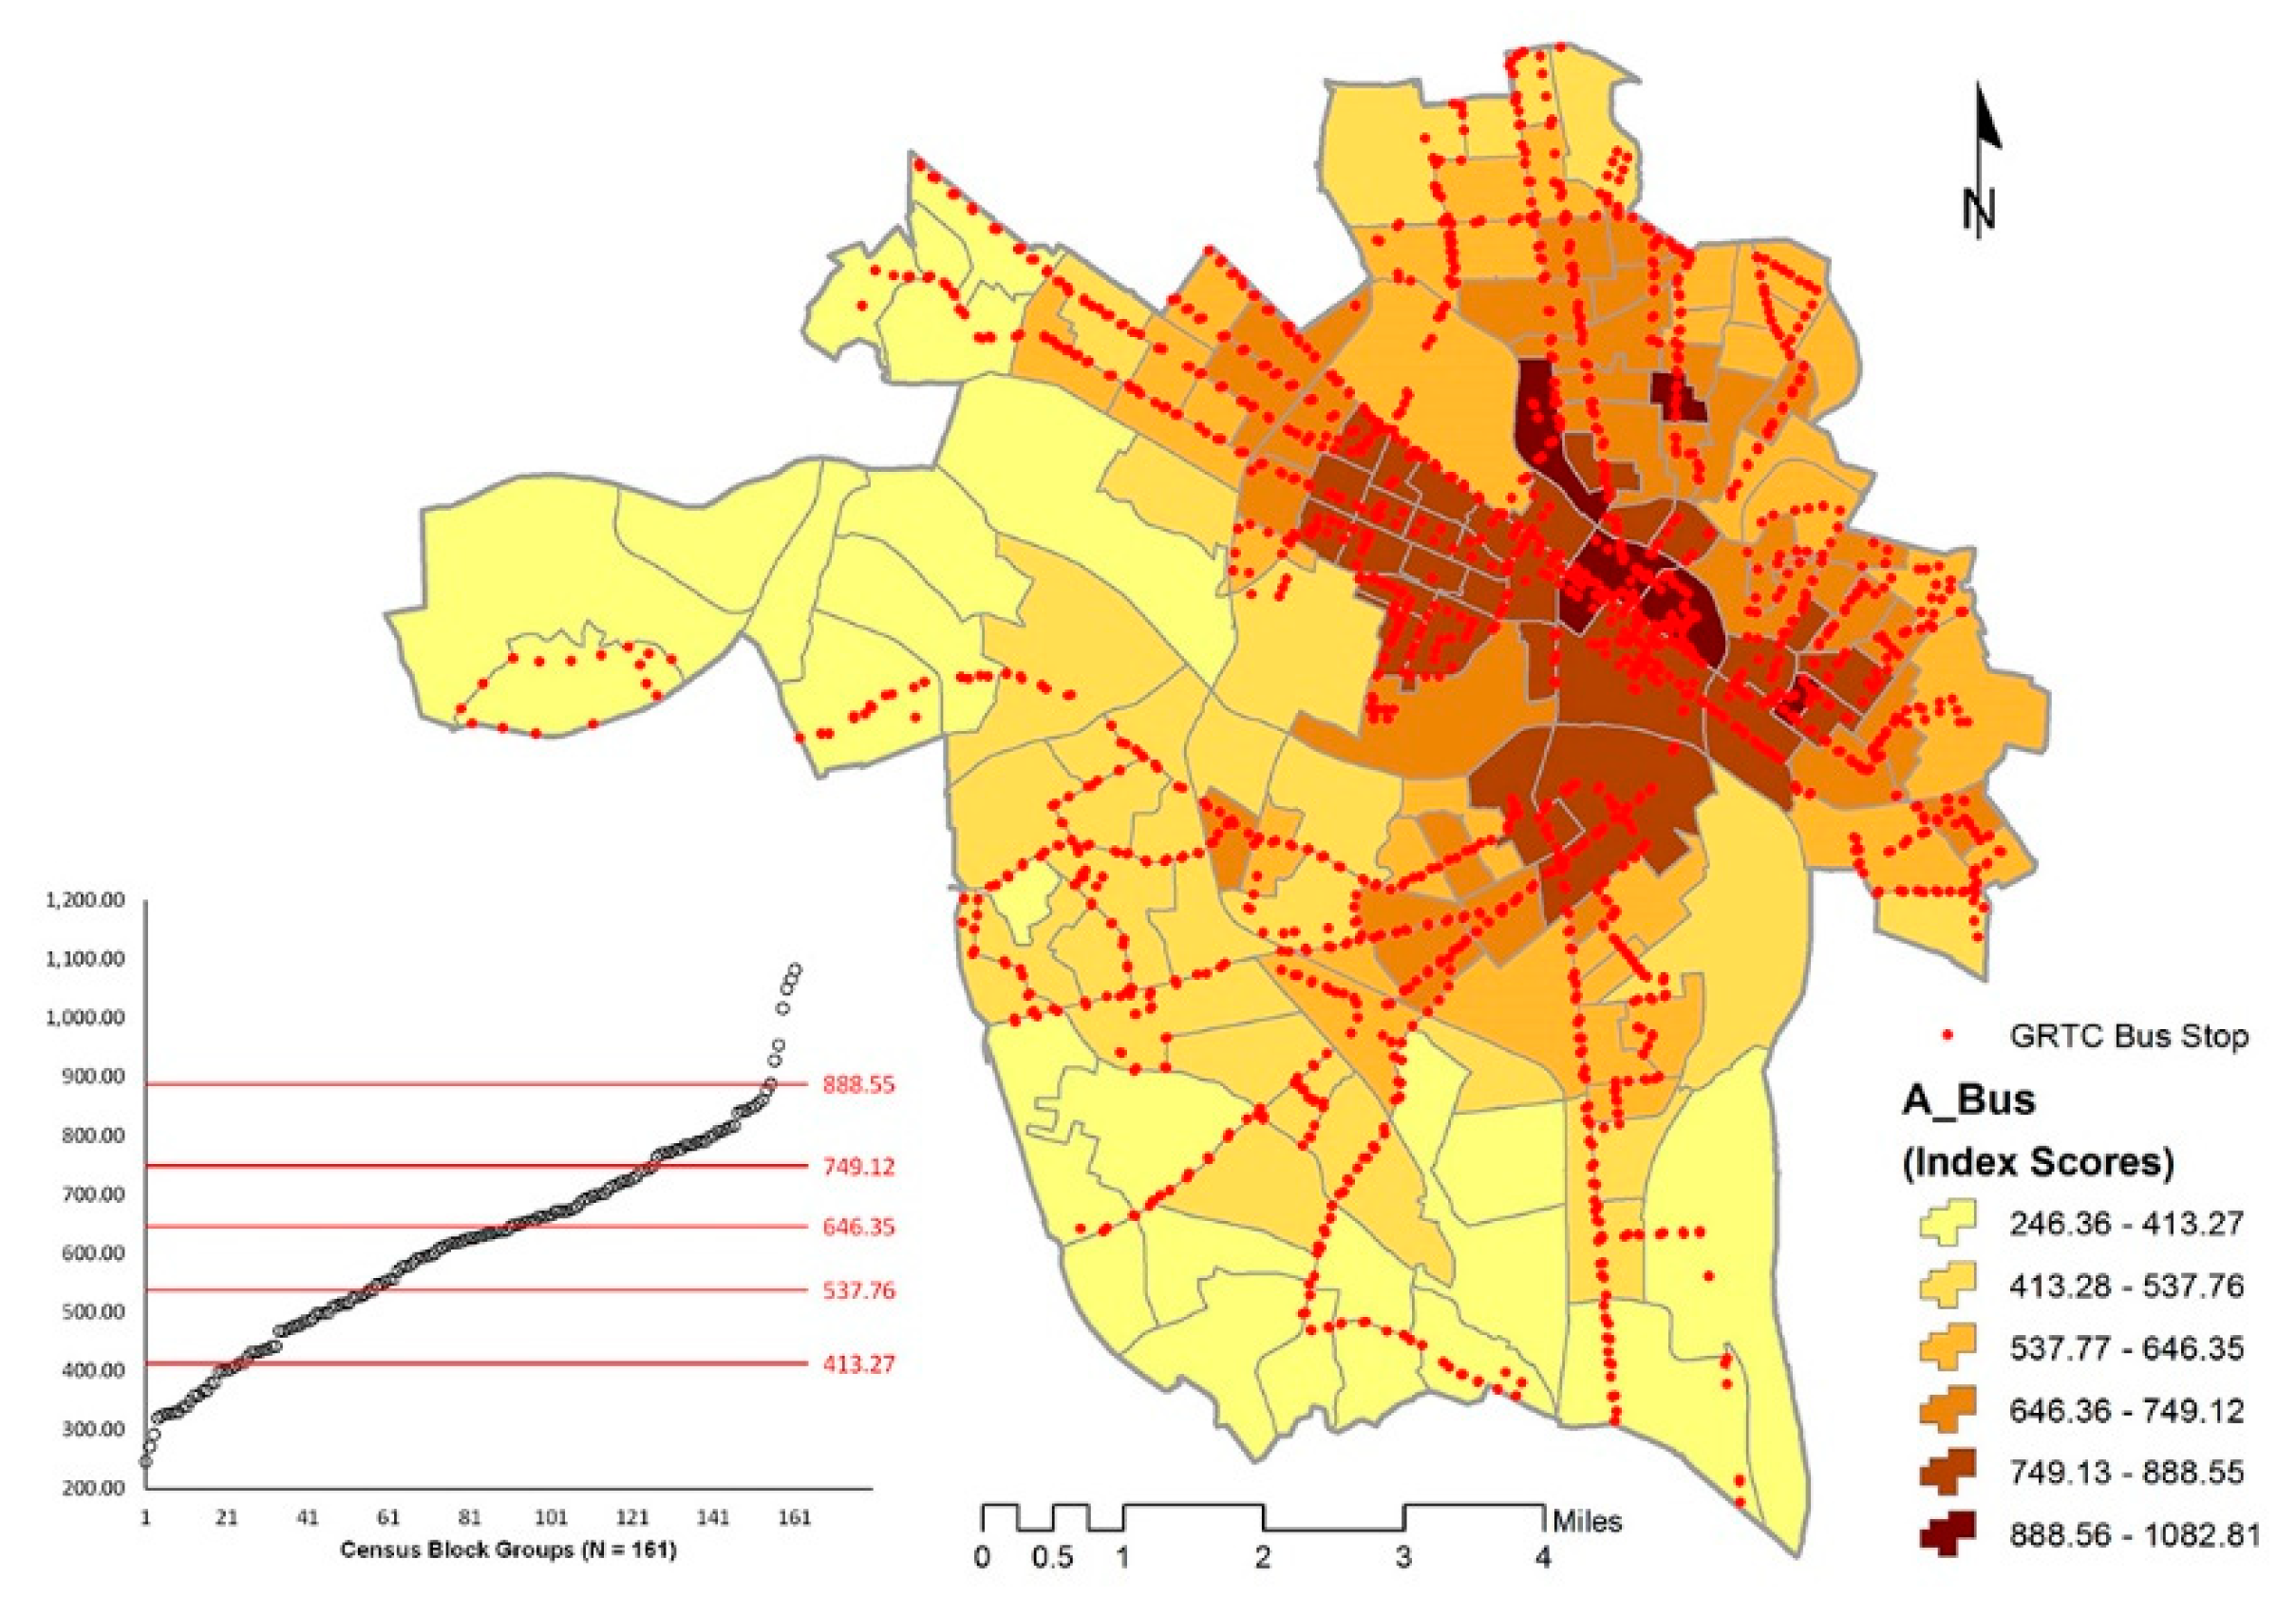
2.6. Accessibility to Public Transportation (A_Bus)

The Greater Richmond Transit Company (GRTC) provides public transportation services to the Richmond area and parts of Chesterfield and Henrico counties in Virginia [57]. In order to assess the accessibility to public transportation, I used the 2015 GRTC bus stop locations (see Figure 10) as access points to public transportation in the City of Richmond. I then calculated the accessibility to public transportation, A_Busi, for each Census Block Group i based its proximity to 1550 bus stops in the city. A_Busi is based on Equation (6), where Dij is the network distance between the centroid of a given Census Block Group i to a bus stop j. It is inversely weighted by distance where accessibility to public transportation diminishes as the distance to bus stops increases.
A _ B u s i =   j = 1 1550 D i j 1

3. Results

In this section, I present findings of the relationships between variables and further assess the impacts of the independent variables on land value.

3.1. Correlation Analysis

To find out the relationships between land value and the independent variables related to development pattern and accessibility, I conducted a correlation analysis and reported the results in Table 3.
Development compactness (r = 0.217) exhibits a weak but positive relationship with land value. The relationship between land use mix and land value is negative and extremely weak (r = −0.042). On the other hand, accessibility-related variables have a much stronger and positive relationship with land value. In specific, the strongest relationship exists between land value and accessibility to jobs (r = 0.734), followed by accessibility to public transportation (r = 0.524), and then accessibility to retail stores (r = 0.480). According to the correlation analysis, Census Block Groups with higher land values generally have better accessibility to jobs, public transportation, retail stores, and more compact development. However, Census Block Groups with greater land use mix are associated with lower land values albeit this relationship is very weak in the City of Richmond.

3.2. Collinearity Diagnostics

While correlation analysis provides a preliminary assessment of the relationships between variables, it is limited to depicting the relationship between two variables. Therefore, I conceptualized a series of regression models to examine the relationship between land value and the independent variables altogether, and further assess the impacts of independent variables on land value. However, collinearity may be a concern and, if detected, highly correlated variable(s) should be excluded from the regression models. Before carrying out the regression analyses, I ran collinearity diagnostics to examine if any collinearity issue was present among the independent variables. Collinearity diagnostics rely on two statistics: tolerance and condition index. In general, collinearity happens when a tolerance drops below 0.01 and a condition index goes beyond 30 [58] (pp. 90–91). As shown in Table 4, collinearity is not evident among the independent variables and I proceeded to perform the following regression analyses in Section 3.3, Section 3.4 and Section 3.5.

3.3. Regression Analysis 1: Impacts of Development Pattern on Land Value

To investigate the impacts of development pattern on land value, I conducted a regression analysis by regressing land value on development compactness and land use mix (see Table 5). The regression model shows the combination of compact and mixed development has a weak relationship with land value (Multiple-R = 0.217) and it only explains 4.7% of the variation in land value (R2 = 0.047). Between the two independent variables, development compactness has a much greater and positive impact (beta = 0.216) on land value than land use mix does (beta = −0.010).

3.4. Regression Analysis 2: Impacts of Development Pattern and Accessibility on Land Value

I further expanded the regression model by including accessibility-related variables to assess their impacts on land value as well. After adding accessibility to jobs, retail stores, and public transportation to the regression model (see Table 6), the strength of relationship increases dramatically (Multiple-R = 0.794) and the independent variables altogether are able to account for 63.0% of the variation in land value (R2 = 0.630). The sizable R2 change is obviously due to the inclusion of accessibility-related variables. In specific, accessibility to jobs has the greatest positive impact (beta = 0.903) on land value, followed by accessibility to public transportation (beta = −0.315), accessibility to retail stores (beta = 0.240), development compactness (beta = 0.087), and lastly land use mix (beta = 0.032).

3.5. Regression Analysis 3: Sub-Groups Comparison

As mentioned earlier in Section 2.1, I classified the Census Block Groups into three sub-groups based on their land values. They are shown in Table 7 as Model 1 (low land value group), Model 2 (medium land value group), and Model 3 (high land value group). Also presented in Table 7 are the regression results of respective beta weights and R2 values of the overall model as well as the three sub-group models.
The regression results reveal that the independent variables influence land value differently not only within a sub-group but also across sub-groups. In Model 1, development compactness and land use mix have a negative impact on land value. Model 2, however, shows that all independent variables contribute to land value in a positive way. As to Model 3, development compactness and access to public transportation have a negative impact on land value. Only accessibility to jobs and accessibility to retail stores have a positive impact on land value across all sub-groups.
When R2 values are compared, the independent variables only explained 28.4% of the variation in land value in Model 1. On the other hand, the independent variables are able to account for 55.6% and 63.3% of the variation in land value in Models 2 and 3, respectively.

4. Discussion

To aid the discussion, I created Figure 11 (based on Figure 5, in Section 2.1) to provide a spatial reference of the sub-groups in relation to Downtown Richmond and other major features like the James River, Interstate and major highways. I also developed Table 8 to present the descriptive statistics (minimum, maximum, mean, and standard deviation) of the Overall Model (all Census Block Groups included), Model 1 (low land value group), Model 2 (medium land value group), and Model 3 (high land value group).

4.1. Model 1—Low Land Value Group

In this group, its development pattern and accessibility do not explain much of the variations in land value (R2 = 0.284). When compared to the medium and high land value groups, its development pattern is less compact, and it has poorer accessibility to jobs, retail stores, and public transportation. The land use mix of this group, however, sits in between the medium and high land value groups.
Census Block Groups in this group are located to the north and south of the medium and high land value groups. A common theme of this group is the prevalence of industrial land uses (shown as gray dots in Figure 3). Also, the majority of the Census Block Groups are located south of the James River, where neighborhoods are less-affluent in Richmond. The presence and concentration of industrial land uses and less-affluent neighborhoods may be the reasons why development compactness (beta = −0.064) and land use mix (beta = −0.125) negatively affect land value in this group.

4.2. Model 2—Medium Land Value Group

This is the only group where land value benefits positively from all independent variables and their combined explanatory power is also good (R2 = 0.556). In addition, it has the highest land use mix and accessibility to retail stores than the other two groups. Its development compactness and accessibility to jobs and public transportation fall in between the low and high land value groups.
Census Block Groups in this group are clustered around downtown and along the Broad Street corridor (an artery traversing Richmond’s central business district and proceeding westward). This group happens to coincide with the area where high-value residential properties, commercial land uses (shown as magenta dots in Figure 3), and public land uses (shown as light blue dots in Figure 3) are most abundant. This probably explains why all independent variables contribute positively to land value in this group.

4.3. Model 3—High Land Value Group

The high land value group enjoys the presence of Downtown Richmond where the concentration of commercial and public land uses (see Figure 3) and jobs reaches its peak. The explanatory power of the independent variables is the highest (R2 = 0.633) among the three groups. Development compactness and accessibility to jobs and public transportation are also the highest in this group. It has the lowest land use mix, however, because of the dominant commercial and public land uses. Interestingly, development compactness (beta = −0.361) and accessibility to public transportation (beta = −0.987) do not help land value in this group.

4.4. Implications

The study findings suggest a few takeaway points which I will summarize below:
  • In general, accessibility has greater impacts than development pattern on land value.
  • Compact development and mixed land use influence land value differently depending on the nature of existing land uses and land values.
  • Accessibility to jobs and retail stores always contributes to the increase of land value. On the other hand, accessibility to public transportation helps but it does not influence land value in a consistent fashion.
  • A sweet spot seems to be an area that has higher residential property values, good proximity to the city center, less industrial land uses, and of course good access to jobs and retail stores.
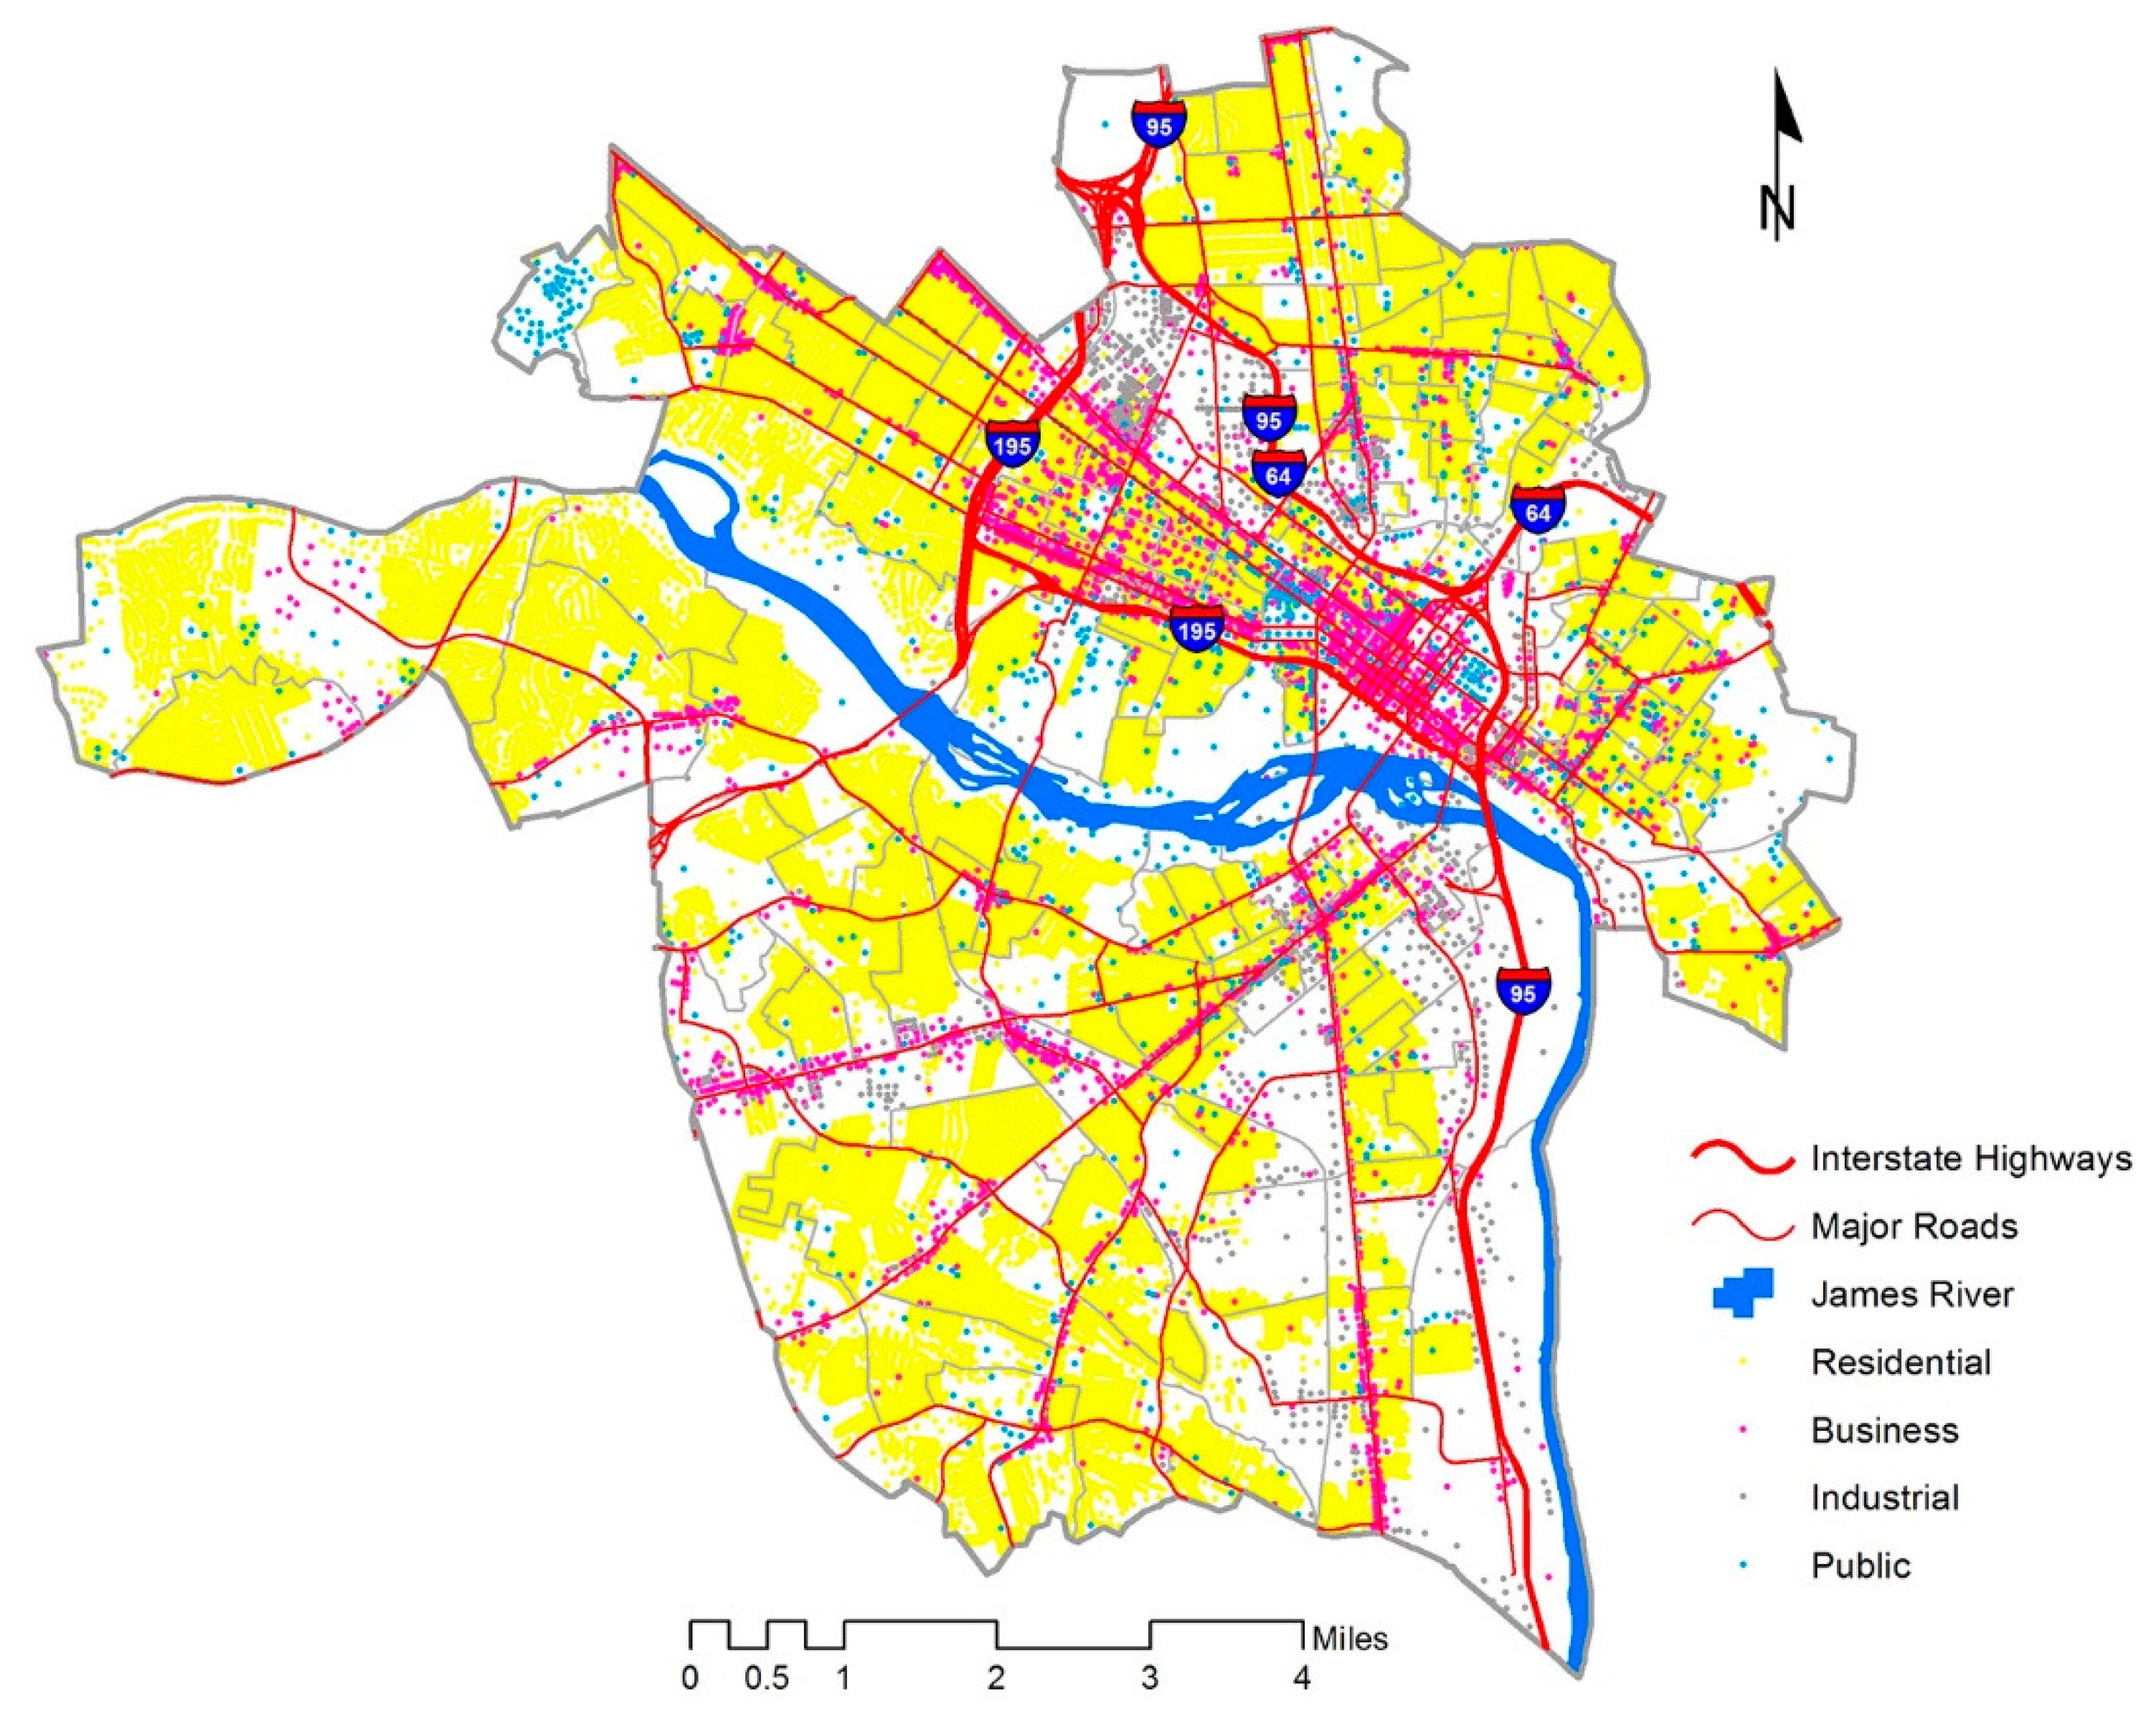
  • There are a number of candidate Census Block Groups to consider if Richmond wants to promote compact development and mixed land use and benefit from the potential of increased land value. For example, Census Block Groups located south of the I-195 (the segment running east-west) and north of the James River (see Figure 11) have comparable accessibility to the ones in the medium land value group. Similarly, Census Block Groups southwest of I-64/I-95 and east of the I-195 (the segment running north-south) are potential candidates as well. On the other hand, it will be a challenge to expand further southward due to the James River, a major natural barrier, and that connections to the city center is limited by only a handful of bridges.

4.5. Limintations and Future Research

While I consider this study a good exercise that sheds some light on the impacts of development pattern and accessibility on land value, I also recognize a few limitations of the study—some of them are data-related and some are methodological. Although these limiting factors require additional attention and effort beyond the scope of the current study, limitations do present themselves as future research opportunities and I will discuss both here.
  • As a case study, the City of Richmond is studied in isolation when in fact development pattern and accessibility do not stop at city boundaries. For example, there are jobs and retail stores outside of the City that are accessible but not included in the study. If the study area is expanded to the entire Richmond MSA for example (provided that the needed data are available), more can be learned about land value and its interactions with development pattern and accessibility across jurisdictions or among urban, suburban, and rural areas.
  • As a cross-sectional study, this study only offers a “snapshot” picture of a given point in time. However, there may be a time lag before certain impacts can take place. Furthermore, impacts may vary depending on how long or short the time lag is. For this reason, a longitudinal study would be better suited to investigate the lag effects of independent variables on the dependent variable, and even the latent interactions and mutual dependencies among variables over time.
  • All jobs are not created equal. This study takes into account the quantity of jobs when assessing the accessibility to jobs. It would be a worthy effort to take a deeper dive and break accessibility to jobs by the types of jobs, their wage bands and develop a more robust accessibility measure.
  • Regarding the independent variable land value, it would be interesting to find out if and to what extent assessed value differs from market value, and how they react to development pattern and accessibility.
  • Lastly, this study examines the impacts of compact and mixed development on land value (along with accessibility). In the pursuit of a more sustainable future, social and environmental impacts resulted from such development patterns can be further explored.

5. Conclusions

This study sets forth to measure development compactness and land use mix and assesses the impacts of such patterns on land value. Many scholars have found that compact and mixed development can lead to a more sustainable built environment, I expected such development patterns beneficial and would contribute to the increase of land value. Impacts of accessibility to jobs, retail stores, and public transportation on land value are also investigated and compared to the impacts from development patterns. I selected the City of Richmond, Virginia as the study area and chose the Census Block Group as the geographic unit of analysis in this study. All dependent and independent variable values are calculated at or aggregated to the Census Block Group level before I carried out a series of analyses including correlation, collinearity diagnostics, and a series of multiple regressions.
I studied the City as a whole with all 161 Census Block Groups included. I also classified them into three sub-groups of low, medium, and high land values, and compared the relationships between land use and the independent variables, as well as the impacts of independent variables on land value across the groups. The study finds that: (1) accessibility has greater impacts than development pattern on land value; (2) compact development and mixed land use influence land value differently depending on the nature of existing land uses and land values; (3) accessibility to jobs and retail stores always contributes to the increase of land value; and (4) accessibility to public transportation helps but it does not influence land value in a consistent fashion.
The results suggest that areas with higher residential property values, good proximity to the city center, less industrial land uses, and good access to jobs and retail stores have greater potential to realize an increase of land value resulted from compact and mixed development in Richmond, Virginia. As a case study, findings of the study are not generalizable beyond Richmond without additional research and validation. Nevertheless, the methodology developed in this study is transferrable and can be applied to study other localities to further our understanding of the impacts of development pattern and accessibility on land value.

Acknowledgments

Developed parcels, land use categories, land assessment value, and QCEW data were provided by the Center for Urban and Regional Analysis (CURA) in the L. Douglas Wilder School of Government and Public Affairs at Virginia Commonwealth University.

Conflicts of Interest

The author declares no conflict of interest.

References

  1. Breheny, M. Centrists, decentrists and compromisers: Views on the future of urban form. In The Compact City: A Sustainable Urban Form? Jenks, M., Burton, E., Williams, K., Eds.; E. & FN Spon: London, UK, 1996; pp. 13–35. ISBN 0-419-21300-7. [Google Scholar]
  2. Ewing, R. Is Los Angeles-style sprawl desirable? J. Am. Plan. Assoc. 1997, 63, 107–126. [Google Scholar] [CrossRef]
  3. Gordon, P.; Richardson, H.W. Are compact cities a desirable planning goal? J. Am. Plan. Assoc. 1997, 63, 95–106. [Google Scholar] [CrossRef]
  4. Berke, P.R.; Conroy, M.M. Are we planning for sustainable development? An evaluation of 30 comprehensive plans. J. Am. Plan. Assoc. 2000, 66, 21–33. [Google Scholar] [CrossRef]
  5. Ben-Zadok, E. Consistency, concurrency and compact development: Three faces of growth management implementation in Florida. Urban Stud. 2005, 42, 2167–2190. [Google Scholar] [CrossRef]
  6. Hirt, S. The compact versus the dispersed city: History of planning ideas on Sofia’s urban form. J. Plan. Hist. 2007, 6, 138–165. [Google Scholar] [CrossRef]
  7. Rerat, P. Housing, the compact city and sustainable development: Some insights from recent urban trends in Switzerland. Int. J. Hous. Policy 2012, 12, 115–136. [Google Scholar] [CrossRef]
  8. Shirazi, M.; Falahat, S. Compact urban form, question or solution? Examining the compact city in the Middle Eastern context: Challenges and opportunities. Int. J. Urban Sustain. Dev. 2012, 4, 246–259. [Google Scholar] [CrossRef]
  9. Frank, L.D.; Pivo, G. Impacts of mixed use and density on utilization of three modes of travel: Single-occupant vehicle, transit, and walking. Transp. Res. Rec. 1994, 1466, 44–52. [Google Scholar]
  10. Dunphy, R.; Fisher, K. Transportation, congestion, and density: New insights. Transp. Res. Rec. J. Transp. Res. Board 1996, 1552, 89–96. [Google Scholar] [CrossRef]
  11. Chatman, D. How density and mixed uses at the workplace affect personal commercial travel and commute mode choice. Transp. Res. Rec. J. Transp. Res. Board 2003, 1831, 193–201. [Google Scholar] [CrossRef]
  12. Ewing, R.; Nelson, A.C.; Bartholomew, K.; Emmi, P.; Appleyard, B. Response to Special Report 298 Driving and the built environment: The effects of compact development on motorized travel, energy use, and CO2 emissions. J. Urban. Int. Res. Placemaking Urban Sustain. 2011, 4, 1–5. [Google Scholar] [CrossRef]
  13. Yin, Y.; Mizokami, S.; Aikawa, K. Compact development and energy consumption: Scenario analysis of urban structures based on behavior simulation. Appl. Energy 2015, 159, 449–457. [Google Scholar] [CrossRef]
  14. Stevens, M.R. Does compact development make people drive less? J. Am. Plan. Assoc. 2017, 83, 7–18. [Google Scholar] [CrossRef]
  15. Burton, E. The potential of the compact city for promoting social equity. In Achieving Sustainable Urban Form; Williams, K., Burton, E., Jenks, M., Eds.; E. & FN Spon: London, UK, 2000; pp. 19–29. ISBN 0-419-24450-6. [Google Scholar]
  16. Frank, L.D.; Engelke, P.O. The built environment and human activity patterns: Exploring the impacts of urban form on public health. J. Plan. Lit. 2001, 16, 202–218. [Google Scholar] [CrossRef]
  17. Duncan, M.J.; Winkler, E.; Sugiyama, T.; Cerin, E.; duToit, L.; Leslie, E.; Owen, N. Relationships of land use mix with walking for transport: Do land uses and geographical scale matter? J. Urban Health 2010, 87, 782–795. [Google Scholar] [CrossRef] [PubMed]
  18. Song, Y.; Knaap, G.-J. Measuring the effects of mixed land uses on housing values. Reg. Sci. Urban Econ. 2004, 34, 663–680. [Google Scholar] [CrossRef]
  19. Sohn, D.-W.; Moudon, A.V. The economic value of office clusters: An analysis of assessed property values, regional form, and land use mix in King County, Washington. J. Plan. Educ. Res. 2008, 28, 86–99. [Google Scholar] [CrossRef]
  20. Gluszak, M.; Zygmunt, R. Development density, administrative decisions, and land values: An empirical investigation. Land Use Policy 2018, 70, 153–161. [Google Scholar] [CrossRef]
  21. Heikkila, E.; Gordon, P.; Kim, J.I.; Peiser, R.B.; Richardson, H.W.; Dale-Johnson, D. What happened to the CBD-distance gradient?: Land values in a policentric city. Environ. Plan. Econ. Space 1989, 21, 221–232. [Google Scholar] [CrossRef]
  22. Iacono, M.; Levinson, D. Accessibility dynamics and location premia: Do land values follow accessibility changes? Urban Stud. 2017, 54, 364–381. [Google Scholar] [CrossRef]
  23. Gordon, P.; Richardson, H.W.; Wong, H.L. The distribution of population and employment in a polycentric city: The case of Los Angeles. Environ. Plan. Econ. Space 1986, 18, 161–173. [Google Scholar] [CrossRef]
  24. McDonald, J.F.; Prather, P.J. Suburban employment centres: The case of Chicago. Urban Stud. 1994, 31, 201–218. [Google Scholar] [CrossRef]
  25. Small, K.A.; Song, S. Population and employment densities: Structure and change. J. Urban Econ. 1994, 292–313. [Google Scholar] [CrossRef]
  26. McDonald, J.F.; McMillen, D.P. Employment subcenters and subsequent real estate development in suburban Chicago. J. Urban Econ. 2000, 48, 135–157. [Google Scholar] [CrossRef]
  27. Giuliano, G.; Gordon, P.; Pan, Q.; Park, J. Accessibility and residential land values: Some tests with new measures. Urban Stud. 2010, 47, 3103–3130. [Google Scholar] [CrossRef]
  28. Cervero, R.; Duncan, M. Transit’s value-added effects: Light and commuter rail services and commercial land values. Transp. Res. Rec. J. Transp. Res. Board 2002, 1805, 8–15. [Google Scholar] [CrossRef]
  29. Du, H.; Mulley, C. Relationship between transport accessibility and land value: Local model approach with geographically weighted regression. Transp. Res. Rec. J. Transp. Res. Board 2006, 1977, 197–205. [Google Scholar] [CrossRef]
  30. Du, H.; Mulley, C. Understanding spatial variations in the impact of accessibility on land value using geographically weighted regression. J. Transp. Land Use 2012, 5. [Google Scholar] [CrossRef] [Green Version]
  31. Bartholomew, K.; Ewing, R. Hedonic price effects of pedestrian- and transit-oriented development. J. Plan. Lit. 2011, 26, 18–34. [Google Scholar] [CrossRef]
  32. Mulley, C. Accessibility and residential land value uplift: Identifying spatial variations in the accessibility impacts of a bus transitway. Urban Stud. 2014, 51, 1707–1724. [Google Scholar] [CrossRef]
  33. Higgins, C.; Kanaroglou, P. Rapid transit, transit-oriented development, and the contextual sensitivity of land value uplift in Toronto. Urban Stud. 2017, 0042098017712680. [Google Scholar] [CrossRef]
  34. Bostic, R.W.; Longhofer, S.D.; Redfearn, C.L. Land leverage: Decomposing home price dynamics. Real Estate Econ. 2007, 35, 183–208. [Google Scholar] [CrossRef]
  35. Davis, M.A.; Heathcote, J. The price and quantity of residential land in the United States. J. Monet. Econ. 2007, 54, 2595–2620. [Google Scholar] [CrossRef] [Green Version]
  36. Krause, A.L.; Bitter, C. Spatial econometrics, land values and sustainability: Trends in real estate valuation research. Cities 2012, 29, S19–S25. [Google Scholar] [CrossRef]
  37. U.S. Census Bureau. U.S. Census Bureau 2010 Geographic Terms and Concepts—Block Groups. Available online: https://www.census.gov/geo/reference/gtc/gtc_bg.html (accessed on 19 May 2018).
  38. Burton, E. Measuring urban compactness in UK towns and cities. Environ. Plan. B Plan. Des. 2002, 29, 219–250. [Google Scholar] [CrossRef]
  39. Cervero, R.; Gorham, R. Commuting in transit versus automobile neighborhoods. J. Am. Plan. Assoc. 1995, 61, 210–225. [Google Scholar] [CrossRef]
  40. Frank, L.D.; Sallis, J.F.; Saelens, B.E.; Leary, L.; Cain, K.; Conway, T.L.; Hess, P.M. The development of a walkability index: Application to the Neighborhood Quality of Life Study. Br. J. Sports Med. 2010, 44, 924–933. [Google Scholar] [CrossRef] [PubMed]
  41. ESRI. How Standard Distance Works. Available online: http://pro.arcgis.com/en/pro-app/tool-reference/spatial-statistics/h-how-standard-distance-spatial-statistic-works.htm (accessed on 19 May 2018).
  42. Shannon, C.E.; Weaver, W. The Mathematical Theory of Communication; University of Illinois Press: Champaign, IL, USA, 1949. [Google Scholar]
  43. De Smith, M.J.; Goodchild, M.F.; Longley, P.A. Network Distance. Geospatial Analysis 6th Edition, 2018. Available online: http://www.spatialanalysisonline.com/HTML/index.html?network_distance.htm (accessed on 26 May 2018).
  44. National Center for Geographic Information and Analysis. Interpolation: Inverse Distance Weighting. Available online: http://www.ncgia.ucsb.edu/pubs/spherekit/inverse.html (accessed on 19 May 2018).
  45. U.S. Census Bureau American FactFinder. 2012—2016 American Community Survey 5-Year Estimates. Available online: https://factfinder.census.gov/faces/nav/jsf/pages/index.xhtml (accessed on 25 May 2018).
  46. Richmond Real Estate Assessor’s Office. Richmond GIS Parcels Shapefile. Available online: http://www.richmondgov.com/Assessor/index.aspx (accessed on 20 May 2018).
  47. U.S. Census Bureau. U.S. Census Bureau 2010 Geographic Terms and Concepts—Census Tract. Available online: https://www.census.gov/geo/reference/gtc/gtc_ct.html (accessed on 19 May 2018).
  48. U.S. Census Bureau. U.S. Census Bureau 2010 Geographic Terms and Concepts—Block. Available online: https://www.census.gov/geo/reference/gtc/gtc_block.html (accessed on 19 May 2018).
  49. Dent, B.D. Cartography: Thematic Map Design, 5th ed.; WCB/McGraw-Hill: Boston, MA, USA, 1999; ISBN 0-697-38495-0. [Google Scholar]
  50. Jenks, G.F.; Caspall, F.C. Error on choroplethic maps: Definition, measurements, reduction. Ann. Assoc. Am. Geogr. 1971, 61, 217–244. [Google Scholar] [CrossRef]
  51. ESRI. Jenks’ Optimization. Available online: https://support.esri.com/en/other-resources/gis-dictionary/term/jenks’%20optimization (accessed on 24 May 2018).
  52. National Center for Geographic Information and Analysis. Natural Breaks. Available online: http://www.ncgia.ucsb.edu/cctp/units/unit47/html/mas_class.html (accessed on 20 May 2018).
  53. ESRI. Classifying Numerical Fields for Graduated Symbology. Available online: http://desktop.arcgis.com/en/arcmap/10.5/map/working-with-layers/classifying-numerical-fields-for-graduated-symbols.htm (accessed on 21 May 2018).
  54. Dunning, J.B.; Danielson, B.J.; Pulliam, H.R. Ecological processes that affect populations in complex landscapes. Oikos 1992, 65, 169–175. [Google Scholar] [CrossRef]
  55. Turner, M.G. Landscape ecology: The effect of pattern on process. Annu. Rev. Ecol. Syst. 1989, 20, 171–197. [Google Scholar] [CrossRef]
  56. Bureau of Labor Statistics, U.S. Department of Labor. Quarterly Census of Employment and Wages. Available online: https://www.bls.gov/cew/ (accessed on 19 May 2018).
  57. Greater Richmond Transit Company. GRTC Transit System: Our Services. Available online: http://ridegrtc.com/ (accessed on 19 May 2018).
  58. Tabachnick, B.G.; Fidell, L.S. Using Multivariate Statistics, 5th ed.; Allyn & Bacon/Pearson Education: Boston, MA, USA, 2007; ISBN 978-0-205-45938-4. [Google Scholar]
Figure 1. Standard distance vs. density: given that both (a) and (b) have the same area and number of elements, they have an identical density of four elements per area. However, (b) has a shorter standard distance than (a), i.e., (b) has a more compact pattern than (a).
Urbansci 02 00047 g001
Figure 2. Study area location—City of Richmond, Virginia.
Urbansci 02 00047 g002
Figure 3. City of Richmond land uses—residential, business, industrial, and public. (Author’s note: due to the sheer number of parcels, they are symbolized as points rather than polygons.)
Urbansci 02 00047 g003
Figure 4. Study area imagery and the 161 Census Block Groups—City of Richmond, Virginia (Sources: US Census, ESRI (Environmental Systems Research Institute), DigitalGlobe, GeoEye, Earthstar Geographics, CNES (Centre national d'études spatiales)/Airbus DS (Defense and Space), USDA (U.S. Dept. of Agriculture), USGS (U.S. Geological Survey), AeroGRID, IGN (Institut géographique national), and the GIS (Geographic Information System) User Community).
Urbansci 02 00047 g004
Figure 5. Land value of Census Block Groups in the City of Richmond.
Urbansci 02 00047 g005
Figure 6. Development compactness of Census Block Groups in the City of Richmond.
Urbansci 02 00047 g006
Figure 7. Land use mix of Census Block Groups in the City of Richmond.
Urbansci 02 00047 g007
Figure 8. Accessibility to jobs of Census Block Groups in the City of Richmond.
Urbansci 02 00047 g008
Figure 9. Accessibility to retail stores of Census Block Groups in the City of Richmond.
Urbansci 02 00047 g009
Figure 10. Accessibility to public transportation of Census Block Groups in the City of Richmond.
Urbansci 02 00047 g010
Figure 11. Sub-groups of low, medium, and high land values in the City of Richmond.
Urbansci 02 00047 g011
Table 1. Developed parcels by land use categories in Richmond, Virginia (Source: 2014 assessor’s database, City of Richmond).
Land Use CategoryDescriptionNumber of ParcelsPercent
Residentialsingle-family, townhouse, duplex, apartments55,67889.12%
Businessoffice, commercial, mixed-commercial44077.05%
Industrialindustrial11601.86%
Publicgovernment, education, religion12291.97%
Developed parcels:62,474100.00%
Undeveloped parcels:7313
Total:69,787
Table 2. Distribution of business establishments and employees in the sectors of the North American Industry Classification System (NAICS) in Richmond, Virginia.
NAICS SectorNAICS Sector DescriptionNumber of EstablishmentsPercent of EstablishmentsNumber of EmployeesPercent of Employees
11Agriculture, Forestry, Fishing and Hunting00.00%00.00%
21Mining, Quarrying, and Oil and Gas Extraction30.05%290.02%
22Utilities130.21%8010.53%
23Construction3906.44%74034.93%
31–33Manufacturing1943.21%58293.88%
42Wholesale Trade2544.20%36142.41%
44–45Retail Trade64610.67%76885.12%
48–49Transportation and Warehousing1242.05%39052.60%
51Information1041.72%19721.31%
52Finance and Insurance3145.19%76015.06%
53Real Estate and Rental and Leasing2303.80%14640.98%
54Professional, Scientific, and Technical Services80813.35%10,1366.75%
55Management of Companies and Enterprises1021.69%87885.86%
56Administrative and Support and Waste Management and Remediation Services2574.25%71504.76%
61Educational Services791.31%18,31212.20%
62Health Care and Social Assistance5929.78%25,28116.84%
71Arts, Entertainment, and Recreation1191.97%44872.99%
72Accommodation and Food Services4908.10%94456.29%
81Other Services (except Public Administration)4958.18%46763.12%
92Public Administration83913.86%21,50314.33%
Total6053100.00%150,084100.00%
Table 3. Correlation coefficients between variables (N = 161).
VariableLand_ValueD_CompactLU_MixA_JobsA_RetailA_Bus
Land_Value1.0000.217−0.0420.7340.4800.524
D_Compact0.2171.000−0.1470.3100.0360.485
LU_Mix−0.042−0.1471.000−0.084−0.094−0.118
A_Jobs0.734−0.310−0.0841.0000.3150.851
A_Retail0.4800.036−0.0940.3151.0000.139
A_Bus0.5240.485−0.1180.8510.1391.000
Correlation is significant at the 0.01 level (2-tailed). Author’s note: statistical significance is irrelevant since the entire population (not a sample) of all Census Block Groups in the City of Richmond are included in this study.
Table 4. Collinearity diagnostics of independent variables.
Dimension
Independent VariableTolerance 123456
Condition Index1.0005.8648.13410.54521.14428.456
Variance Proportion
Constant 0.0000.0020.0010.0560.5320.409
D_Compact0.718 0.0030.1780.6310.0020.1300.057
LU_Mix0.967 0.0030.4090.1630.2800.1000.044
A_Jobs0.224 0.0000.0030.0410.0380.2110.706
A_Retail0.831 0.0010.0010.0130.1620.3310.492
A_Bus0.206 0.0000.0060.0130.0500.2020.727
Dependent Variable:Land_Value: average assessed land value per square foot
Independent Variables:D_Compact: development compactness index
LU_Mix: land use mix index
A_Jobs: accessibility to jobs index
A_Retail: accessibility to retail stores index
A_Bus: accessibility to public transportation index
Table 5. Regression analysis of land value on development compactness and land use mix (N = 161).
Independent VariableCoefficientStd. Errorbetat 1Sig. 1
Constant2.4953.168 0.7880.432
D_Compact1.0400.3780.2162.7480.007
LU_Mix−0.0350.275−0.010−0.1260.900
Dependent Variable:Land_Value: average assessed land value per square foot
Independent Variables:D_Compact: development compactness index
LU_Mix: land use mix index
Multiple R = 0.217R2 = 0.047Adjusted R2 = 0.035F 1 = 3.919 (Sig. 1 = 0.022)
1 The F-test, t-test statistics, and their significance levels are reported here for informational purpose only. They are irrelevant since the entire population (not a sample) of all Census Block Groups in the City of Richmond are included in this study.
Table 6. Regression analysis of land value on development compactness, land use mix, accessibility to jobs, retail stores, and public transportation (N = 161).
Independent VariableCoefficientStd. Errorbetat 1Sig. 1
Constant−31.1643.912 −7.9660.000
D_Compact0.4180.2780.0871.5030.135
LU_Mix0.1110.1740.0320.6380.524
A_Jobs0.3440.0390.9038.7340.000
A_Retail0.9320.2080.2404.4690.000
A_Bus−0.0180.006−0.315−2.9290.004
Dependent Variable:Land_Value: average assessed land value per square foot
Independent Variables:D_Compact: development compactness index
LU_Mix: land use mix index
A_Jobs: accessibility to jobs index
A_Retail: accessibility to retail stores index
A_Bus: accessibility to public transportation index
Multiple R = 0.794R2 = 0.630Adjusted R2 = 0.618F 1 = 52.707 (Sig. 1 = 0.000)
1 The F-test, t-test statistics, and their significance levels are reported here for informational purpose only. They are irrelevant since the entire population (not a sample) of all Census Block Groups in the City of Richmond are included in this study.
Table 7. Regression results of the overall and three sub-group models.
Overall ModelModel 1Model 2Model 3
(N = 161)(N = 125)(N = 26)(N = 10)
Land_Value range$0.84–$59.61$0.84–$8.68$8.69–$26.91$26.92–$59.61
($ per square foot)
Independent VariableStandardized Regression Coefficient (beta)
D_Compact0.087−0.0640.176−0.361
LU_Mix0.032−0.1250.1810.206
A_Jobs0.9030.1860.4650.899
A_Retail0.2400.3280.4950.063
A_Bus−0.3150.2140.095−0.987
R2 = 0.630R2 = 0.284R2 = 0.556R2 = 0.633
Table 8. Descriptive statistics of the overall and three sub-group models—minimum, maximum, mean, and standard deviation.
Variable Overall ModelModel 1Model 2Model 3
Land_ValueMin.0.8420.8428.68529.547
Max.59.6088.39026.91359.608
Mean7.5173.16216.34539.010
S.D.10.0071.7665.2368.400
D_CompactMin.1.3851.3852.8382.980
Max.13.71213.7128.7278.164
Mean5.0884.8445.7866.318
S.D.2.0762.1061.7841.663
LU_MixMin.0.0000.0002.3984.001
Max.14.41114.41113.01613.702
Mean7.7287.7337.9327.133
S.D.2.8562.8312.8623.356
A_JobsMin.55.22155.22184.791121.774
Max.227.242145.726156.768227.242
Mean93.01784.016115.321147.535
S.D.26.24818.10417.96731.162
A_RetailMin.11.61511.61514.03015.629
Max.32.72120.80732.72120.870
Mean16.03115.27518.79118.298
S.D.2.5741.8403.4371.641
A_BusMin.246.361246.361404.025771.350
Max.1082.8081082.8081016.8131050.317
Mean613.301570.271728.187852.467
S.D.172.039155.327146.43282.477

