Engaging the Senses: The Potential of Emotional Data for Participation in Urban Planning


Abstract
1. Introduction—Sharing Cities
1.1. The Challenge of Participation in the Urban Planning Process
1.1.1. Emotions and Planning
1.1.2. Digital Tools as Means for Measuring Emotions
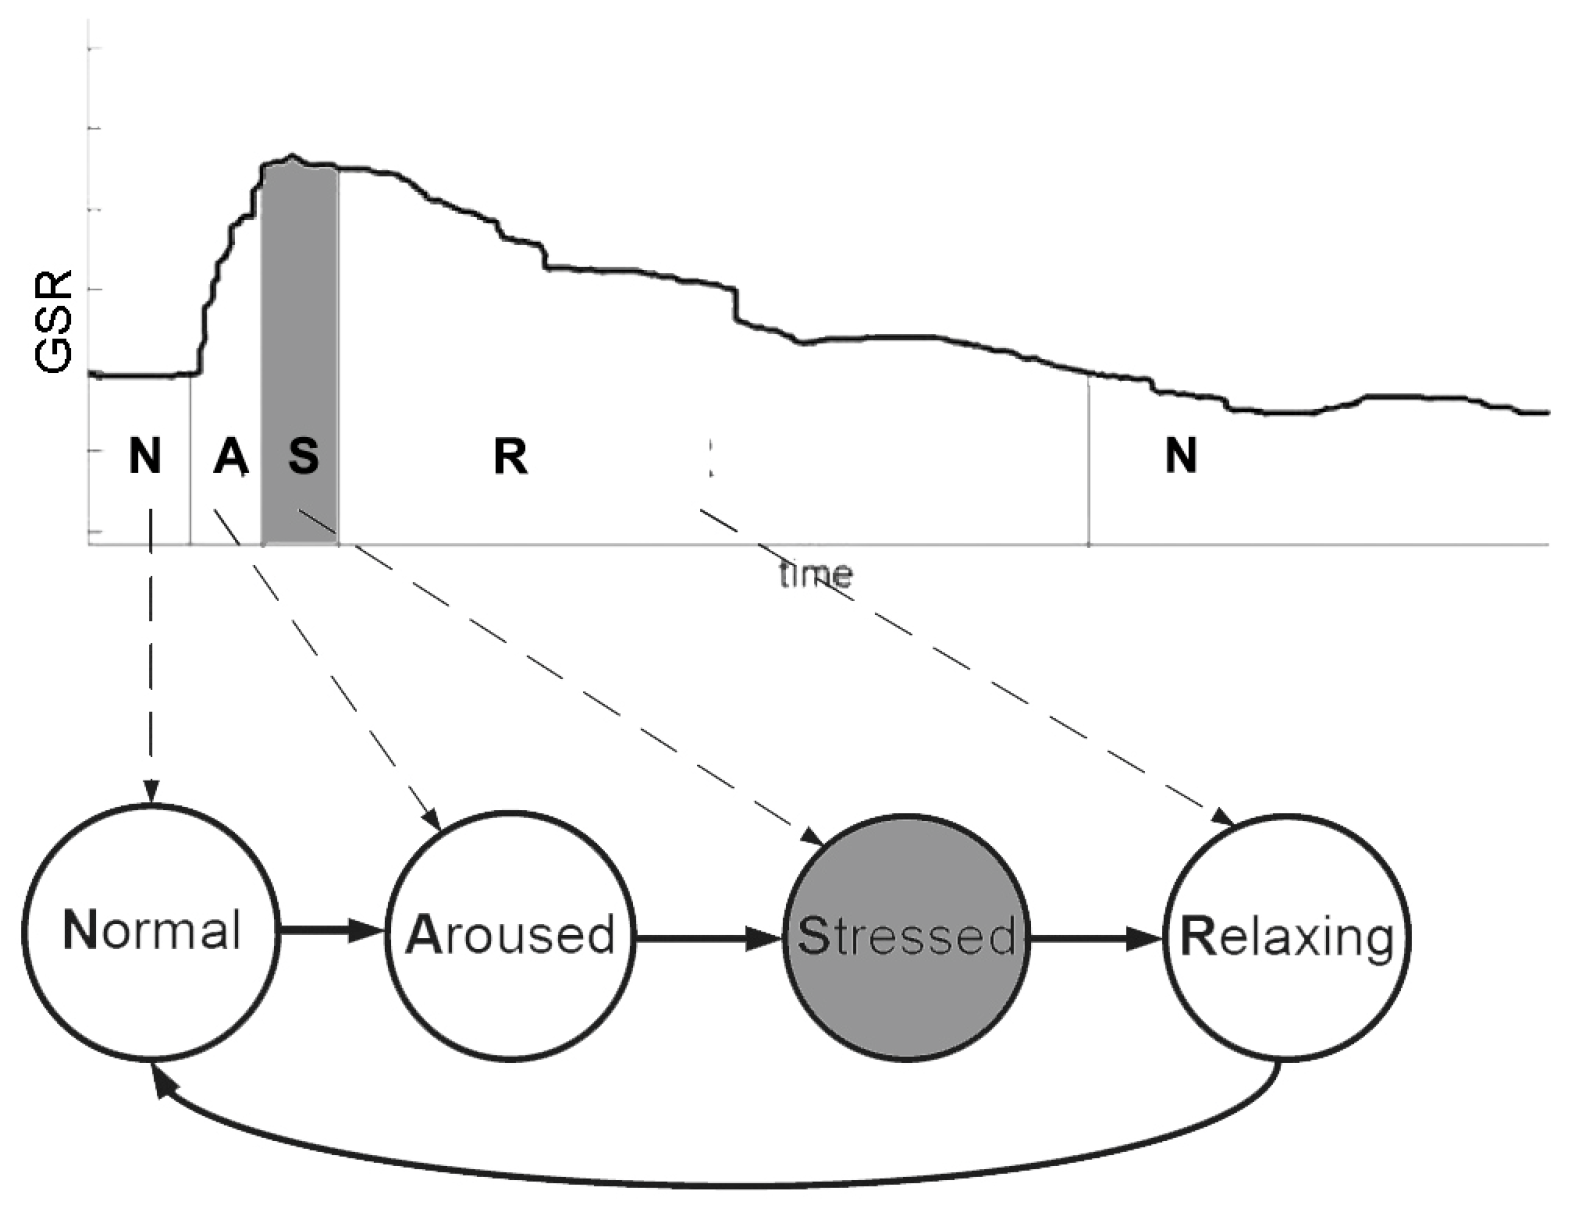
1.1.3. Physiological Measures of Stress Levels Using a GSR Device
2. Materials and Methods
2.1. Participants
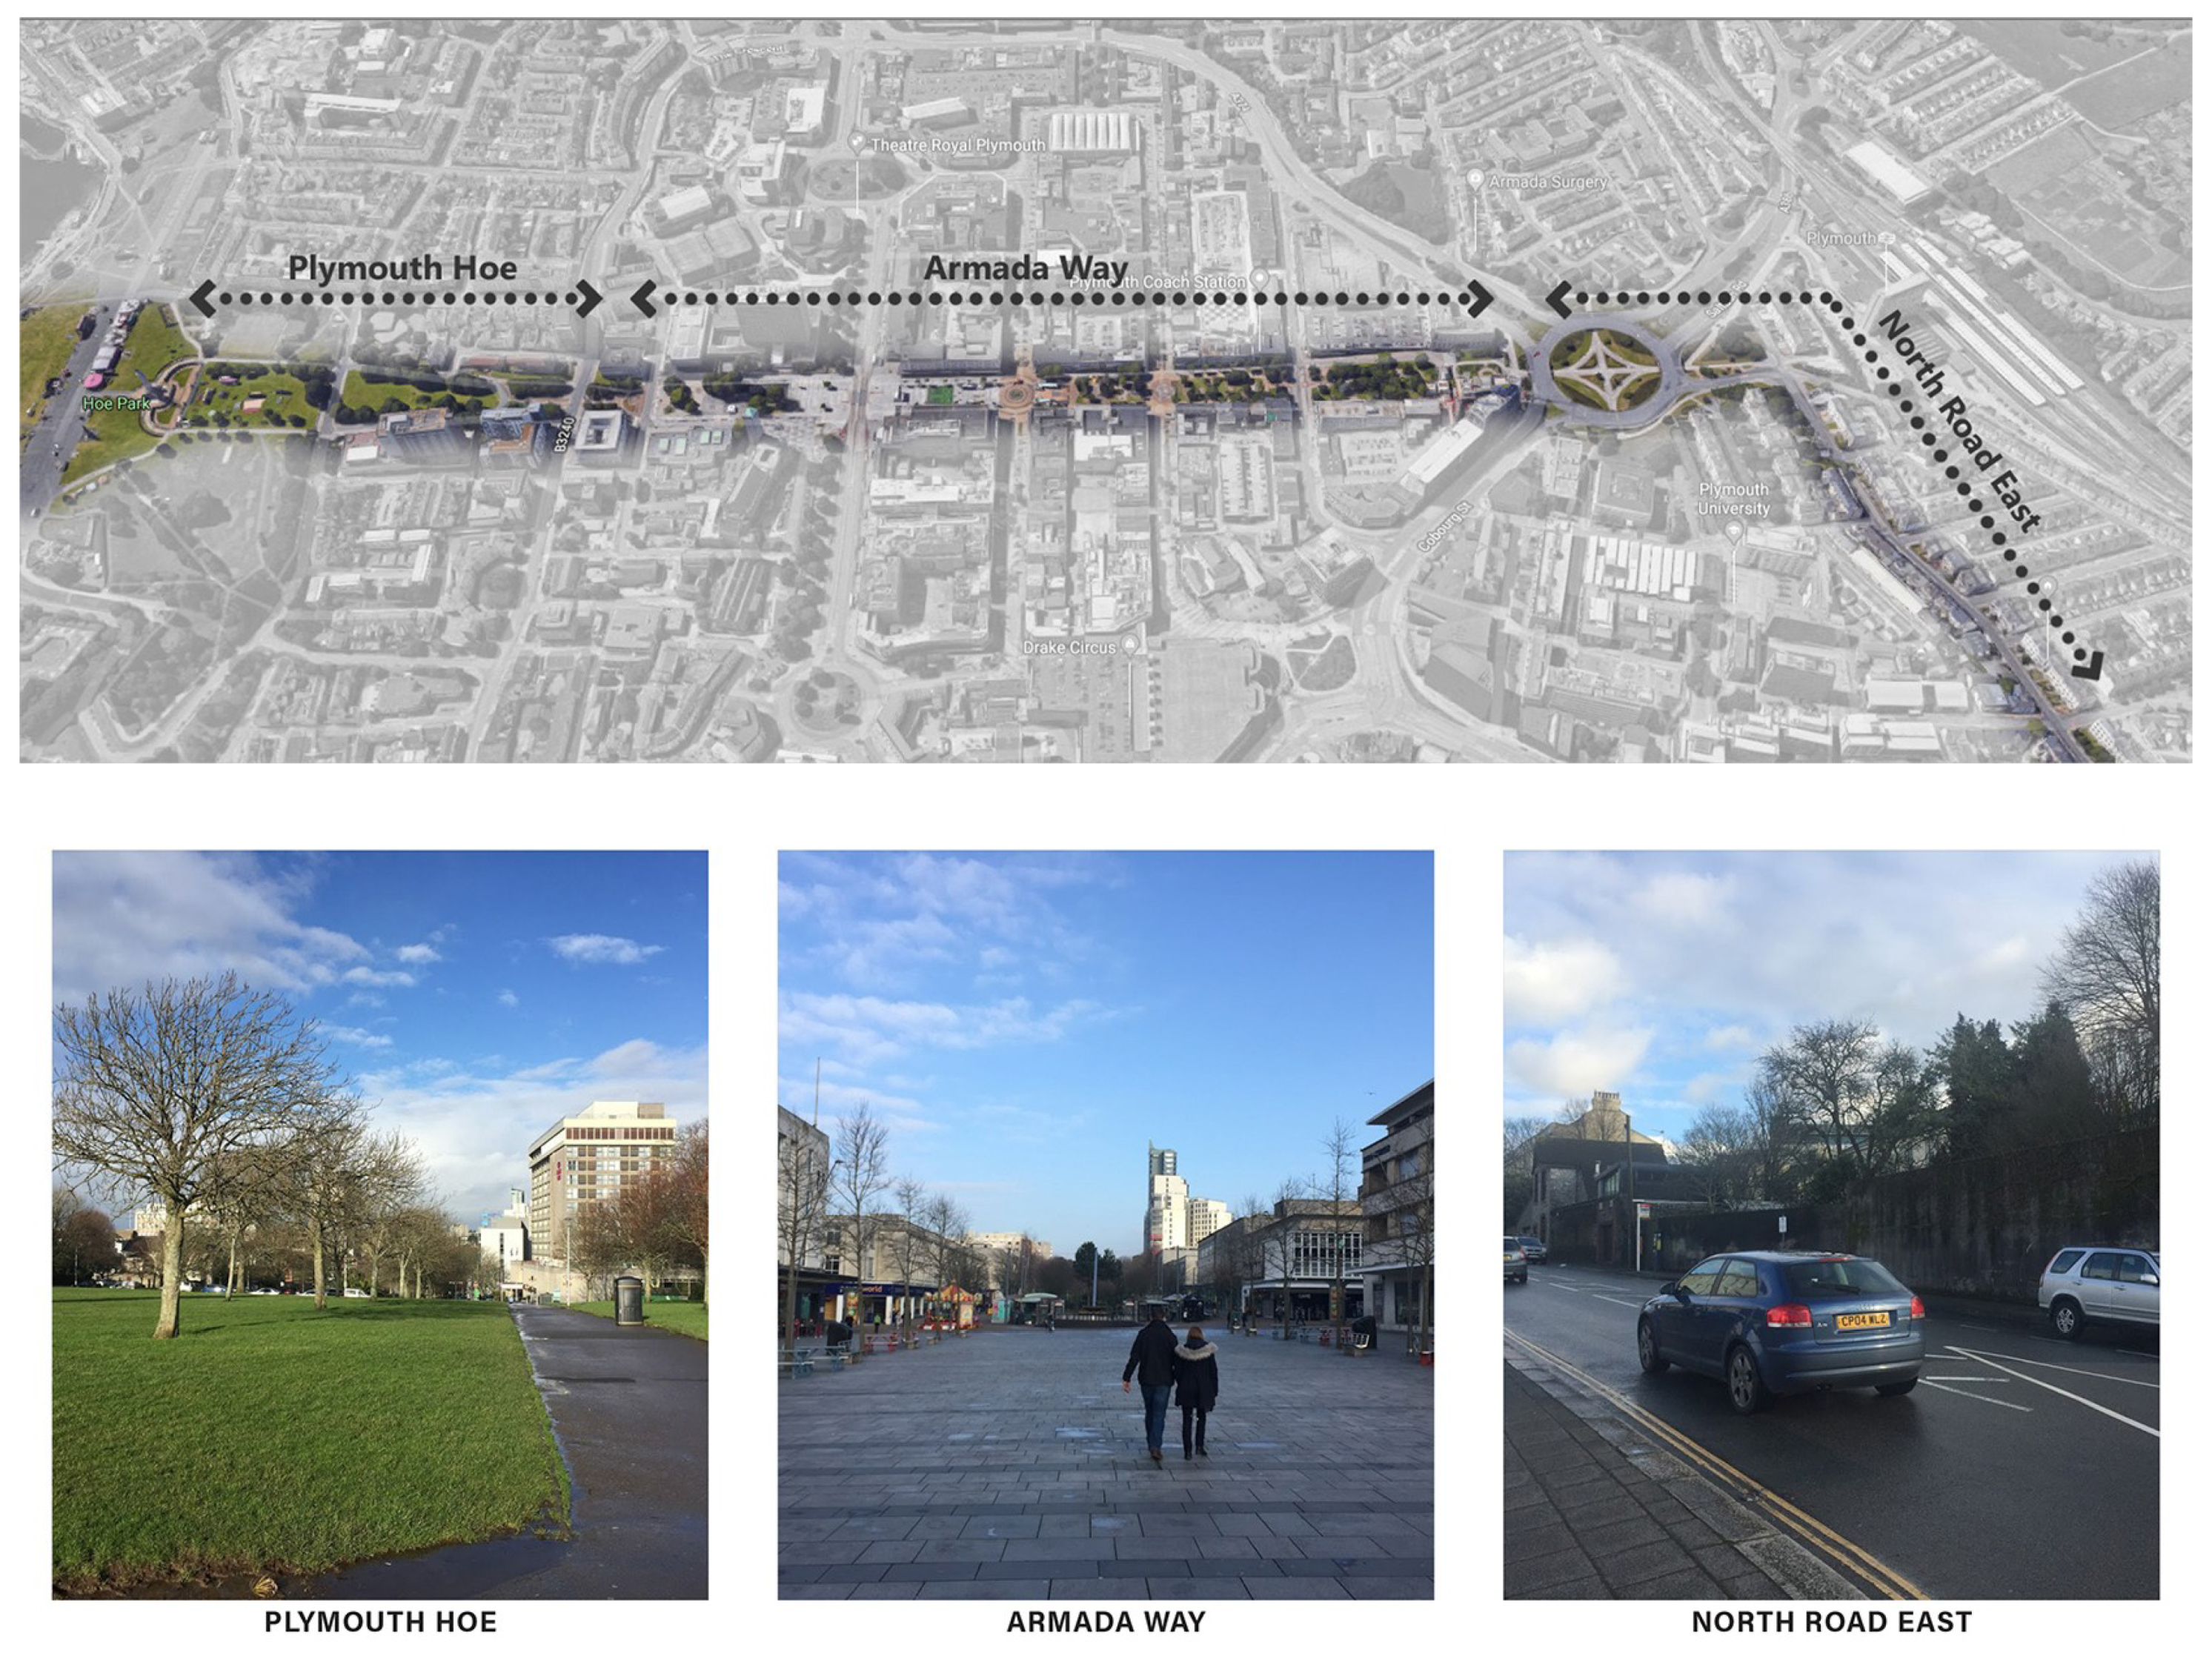
2.2. Setting
2.3. Limitations of the Methods
3. Results
3.1. General Change in Participants’ Emotions
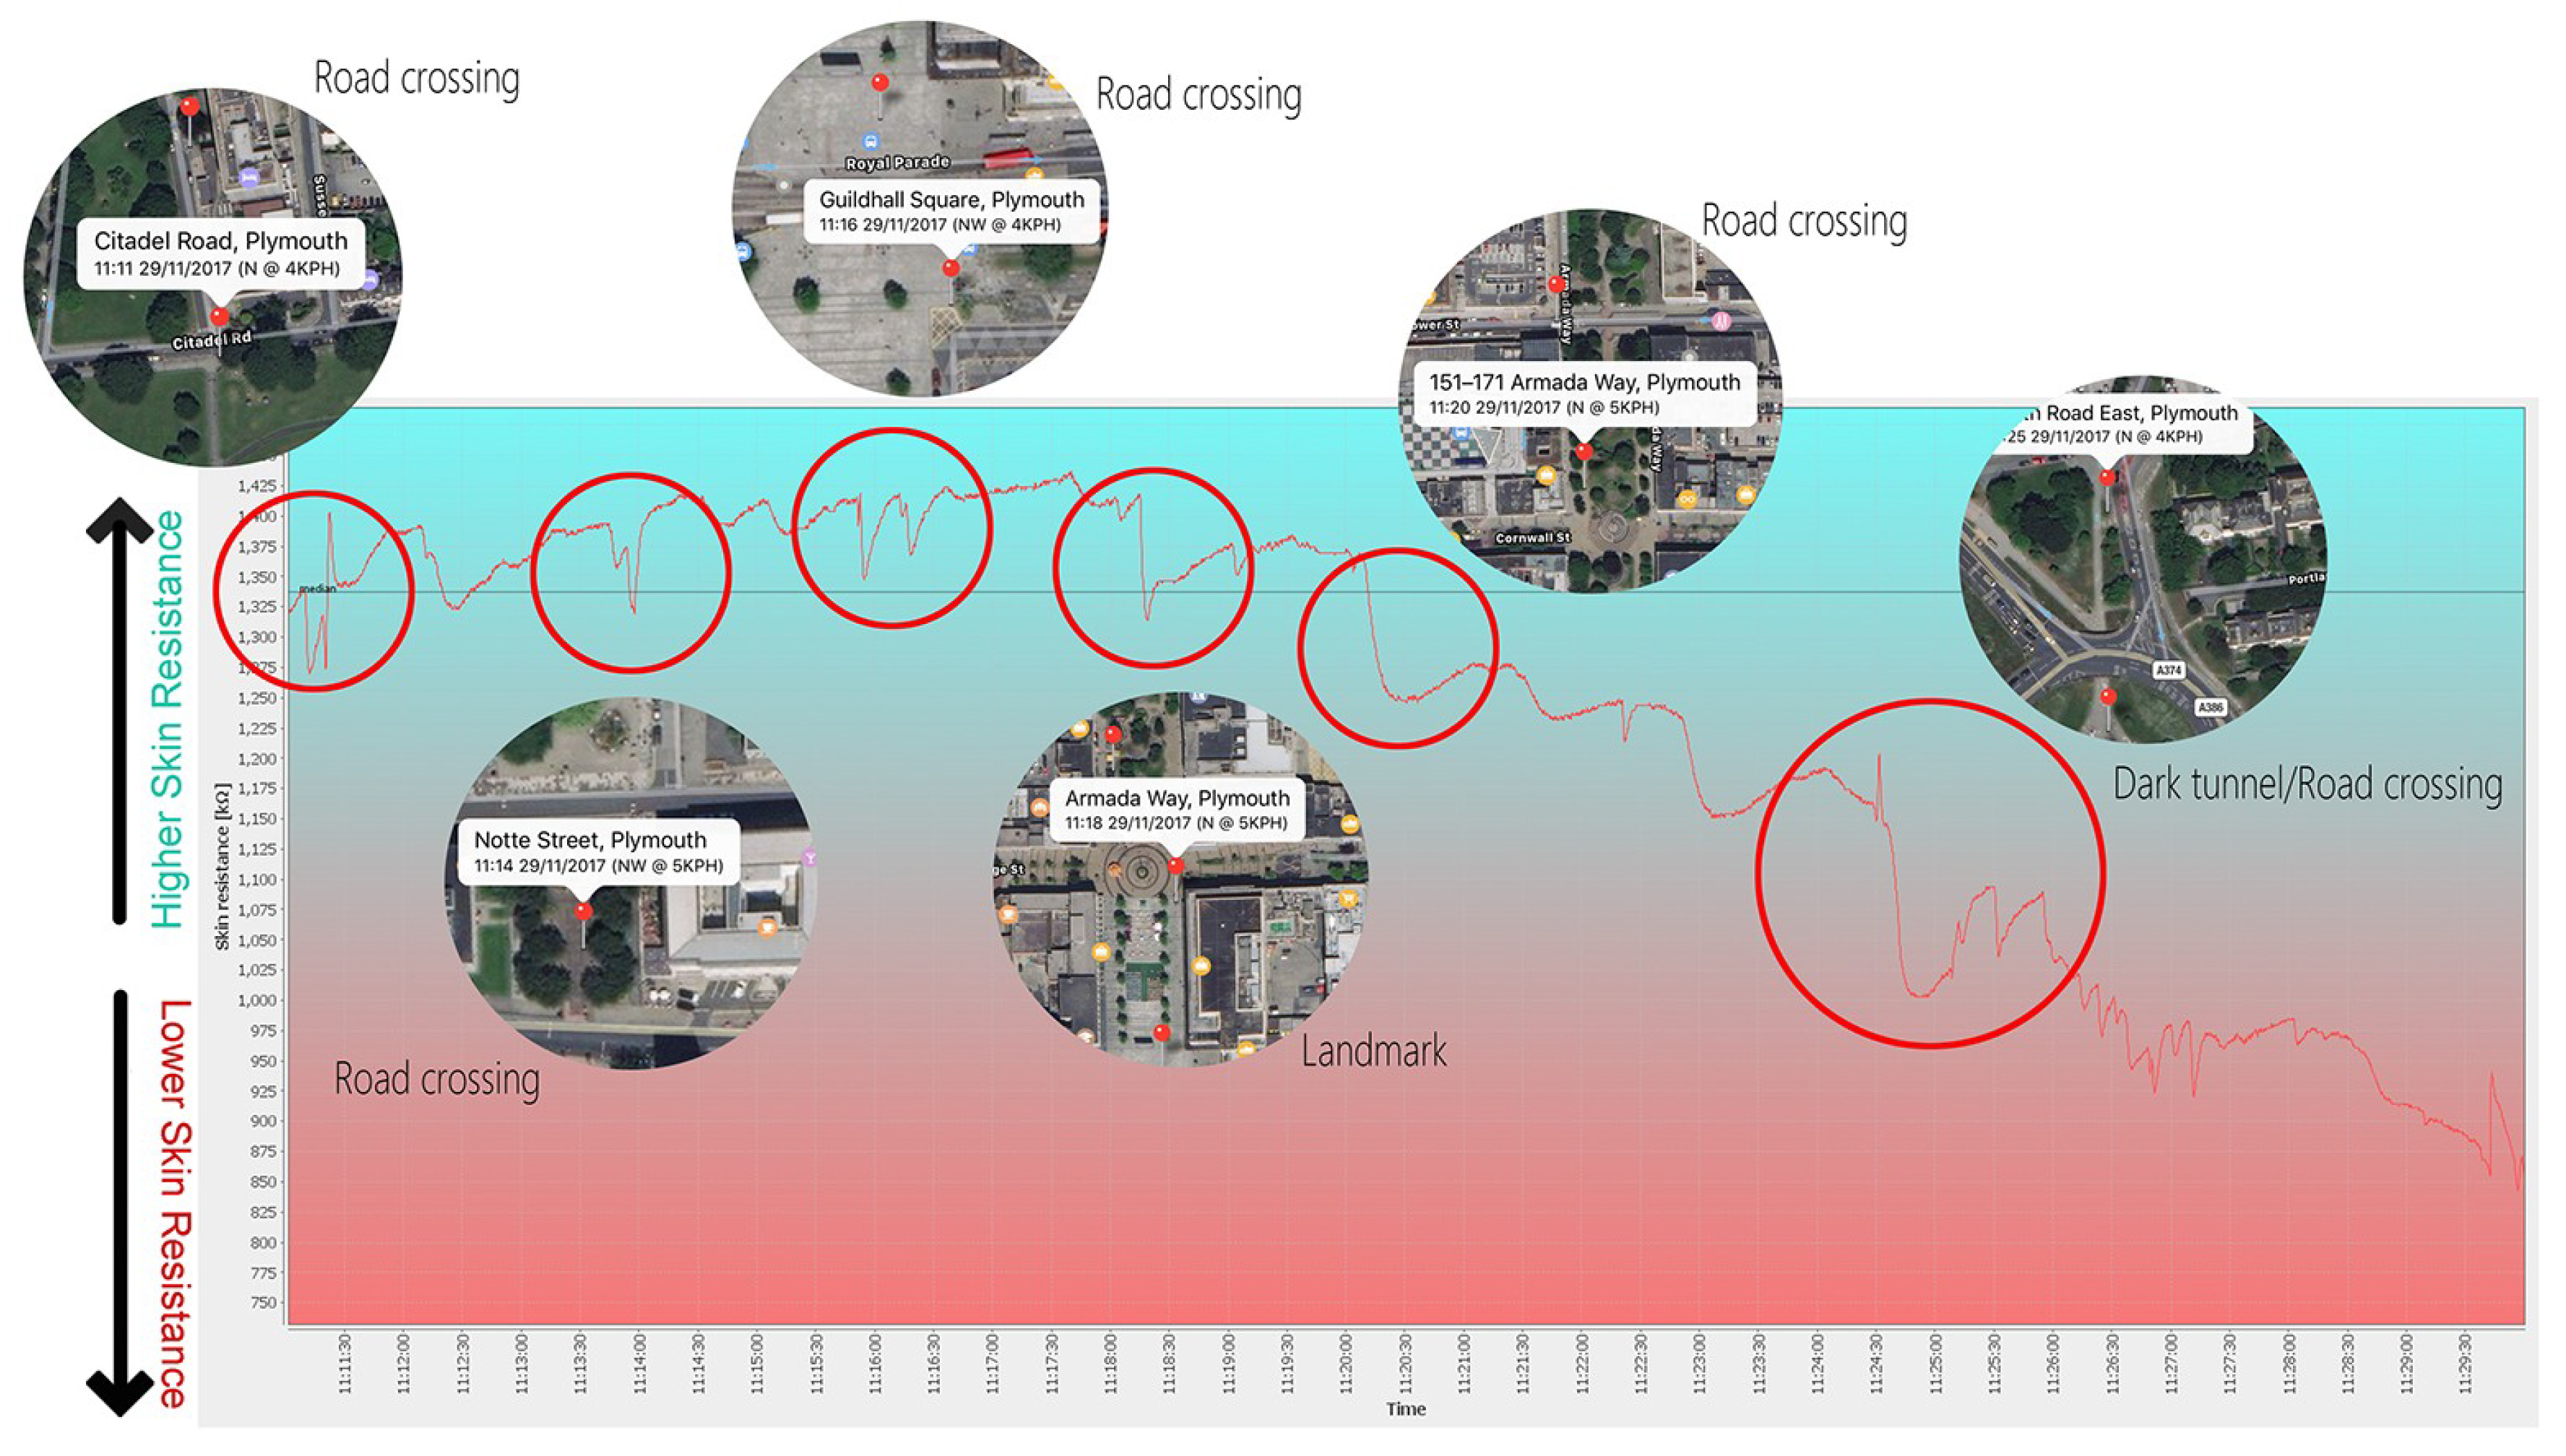
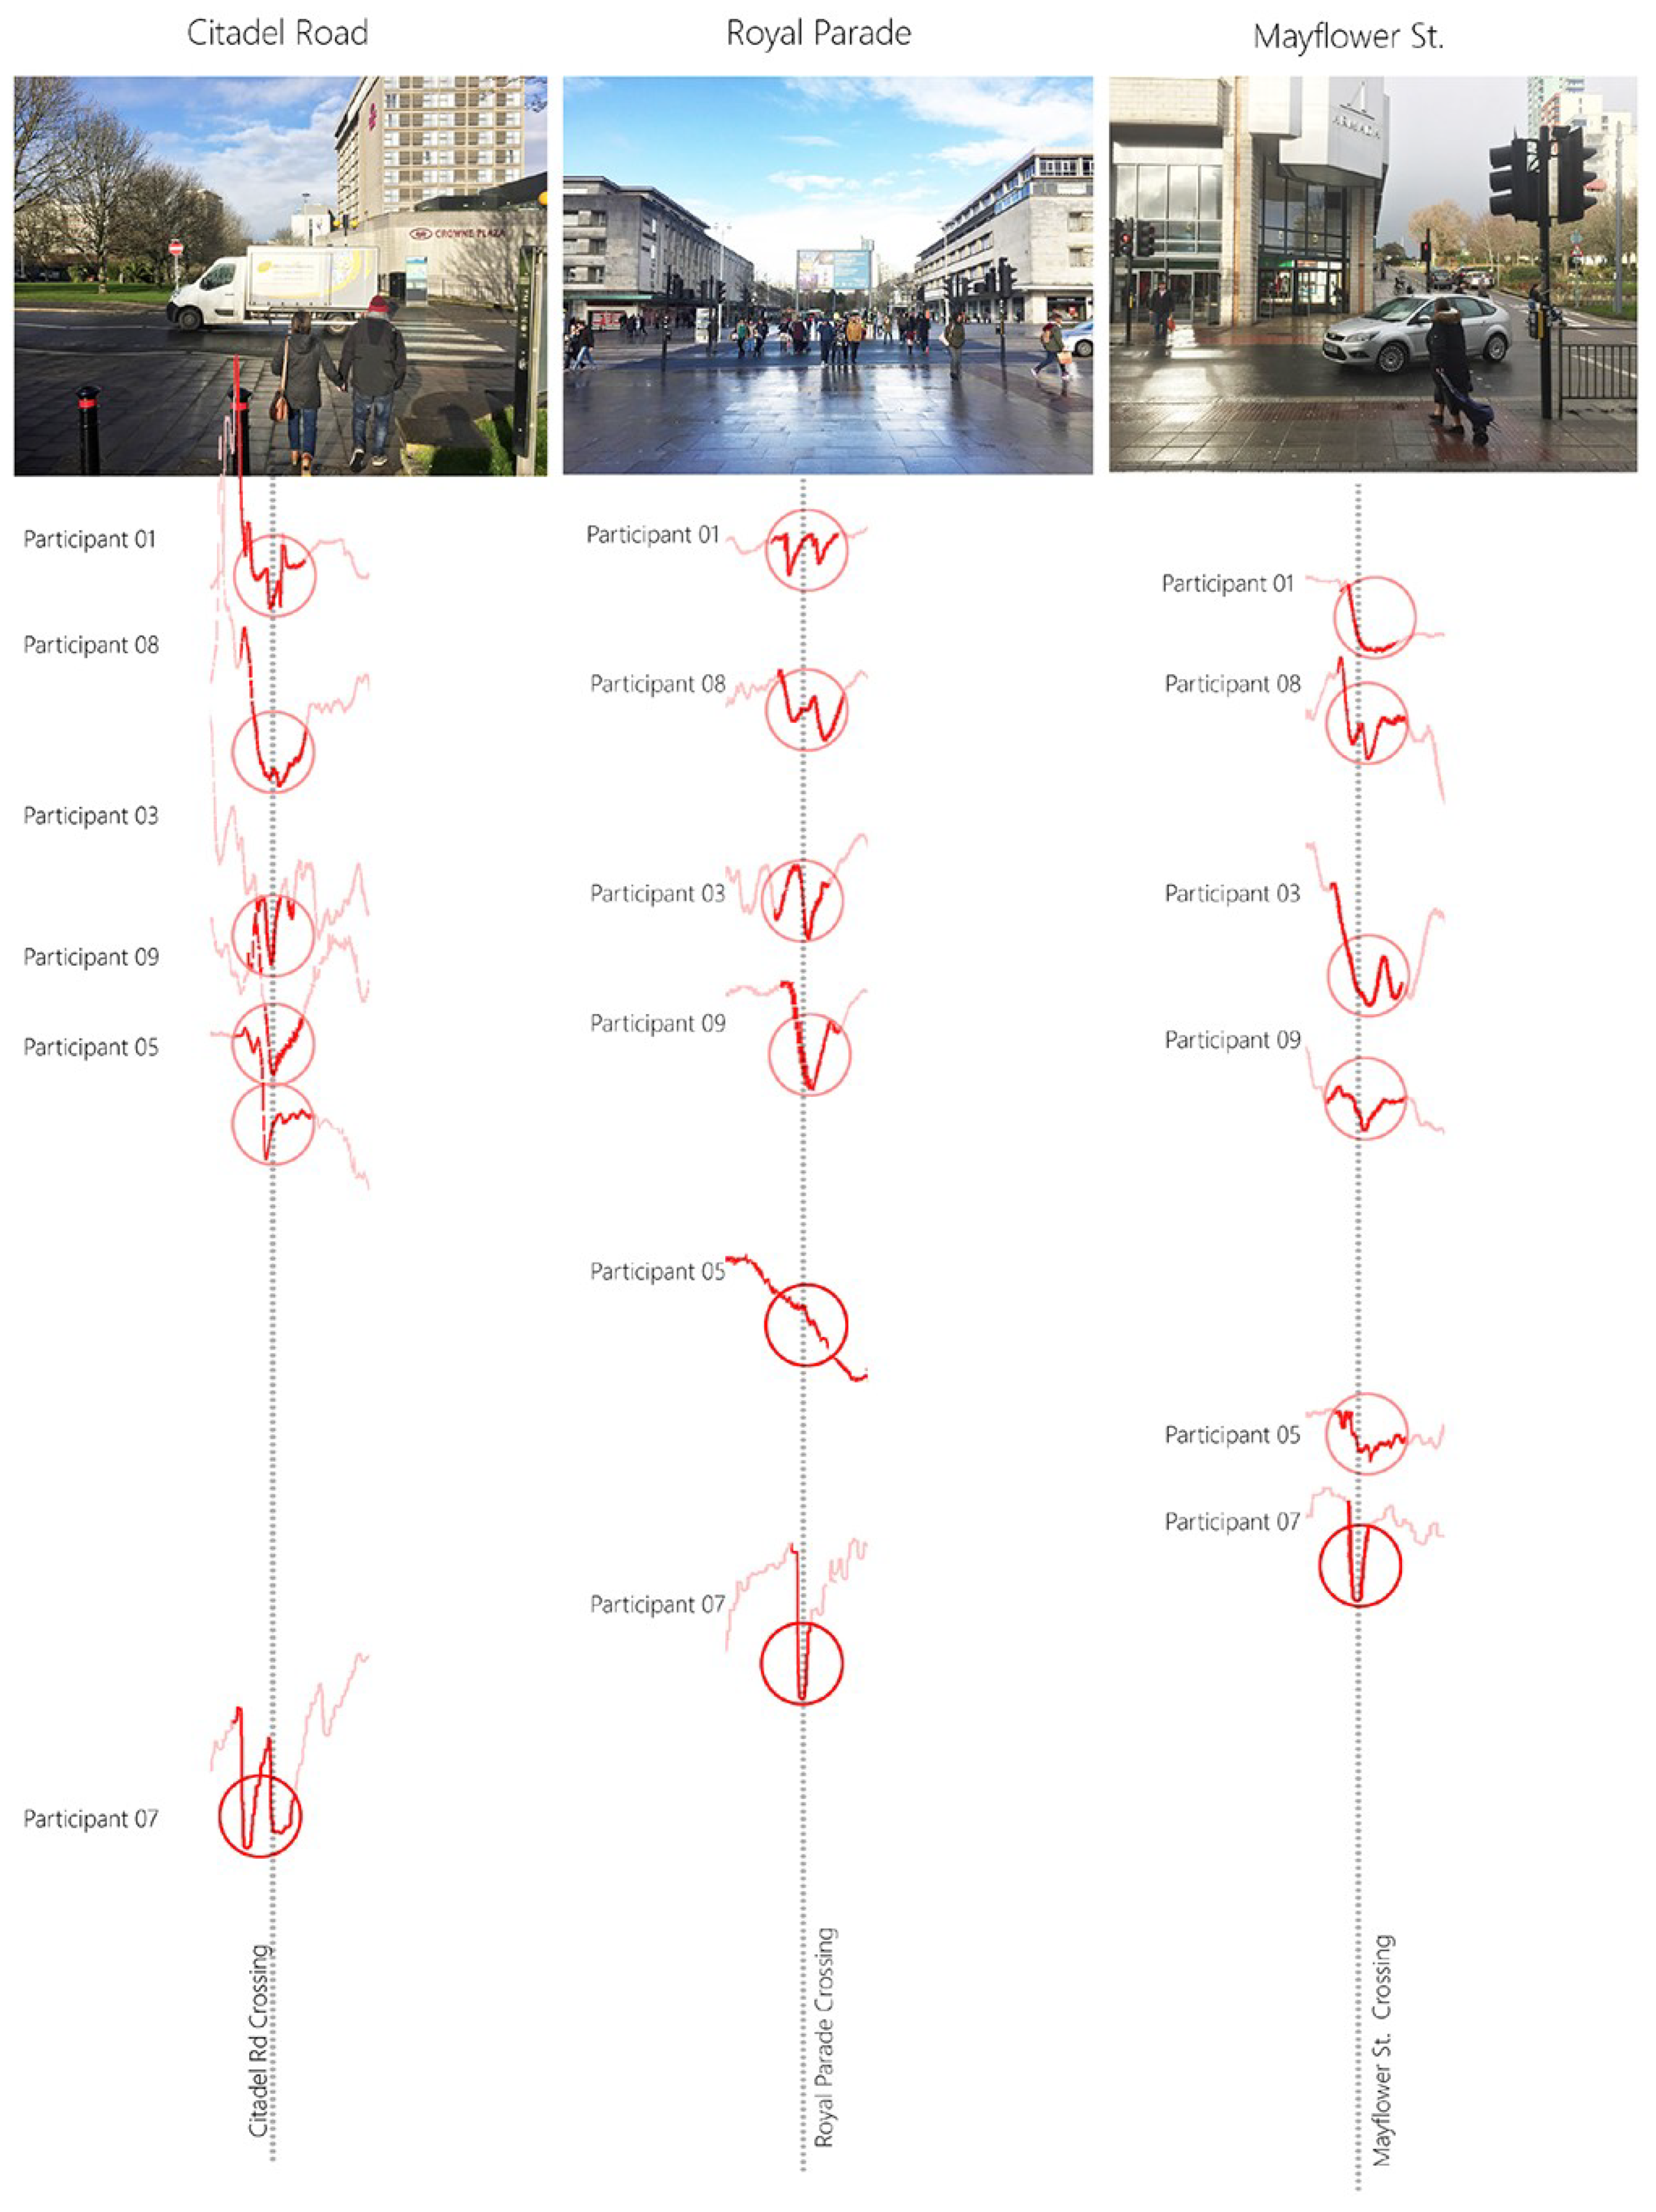
3.2. Change in Stress Levels at Crossings and Junctions
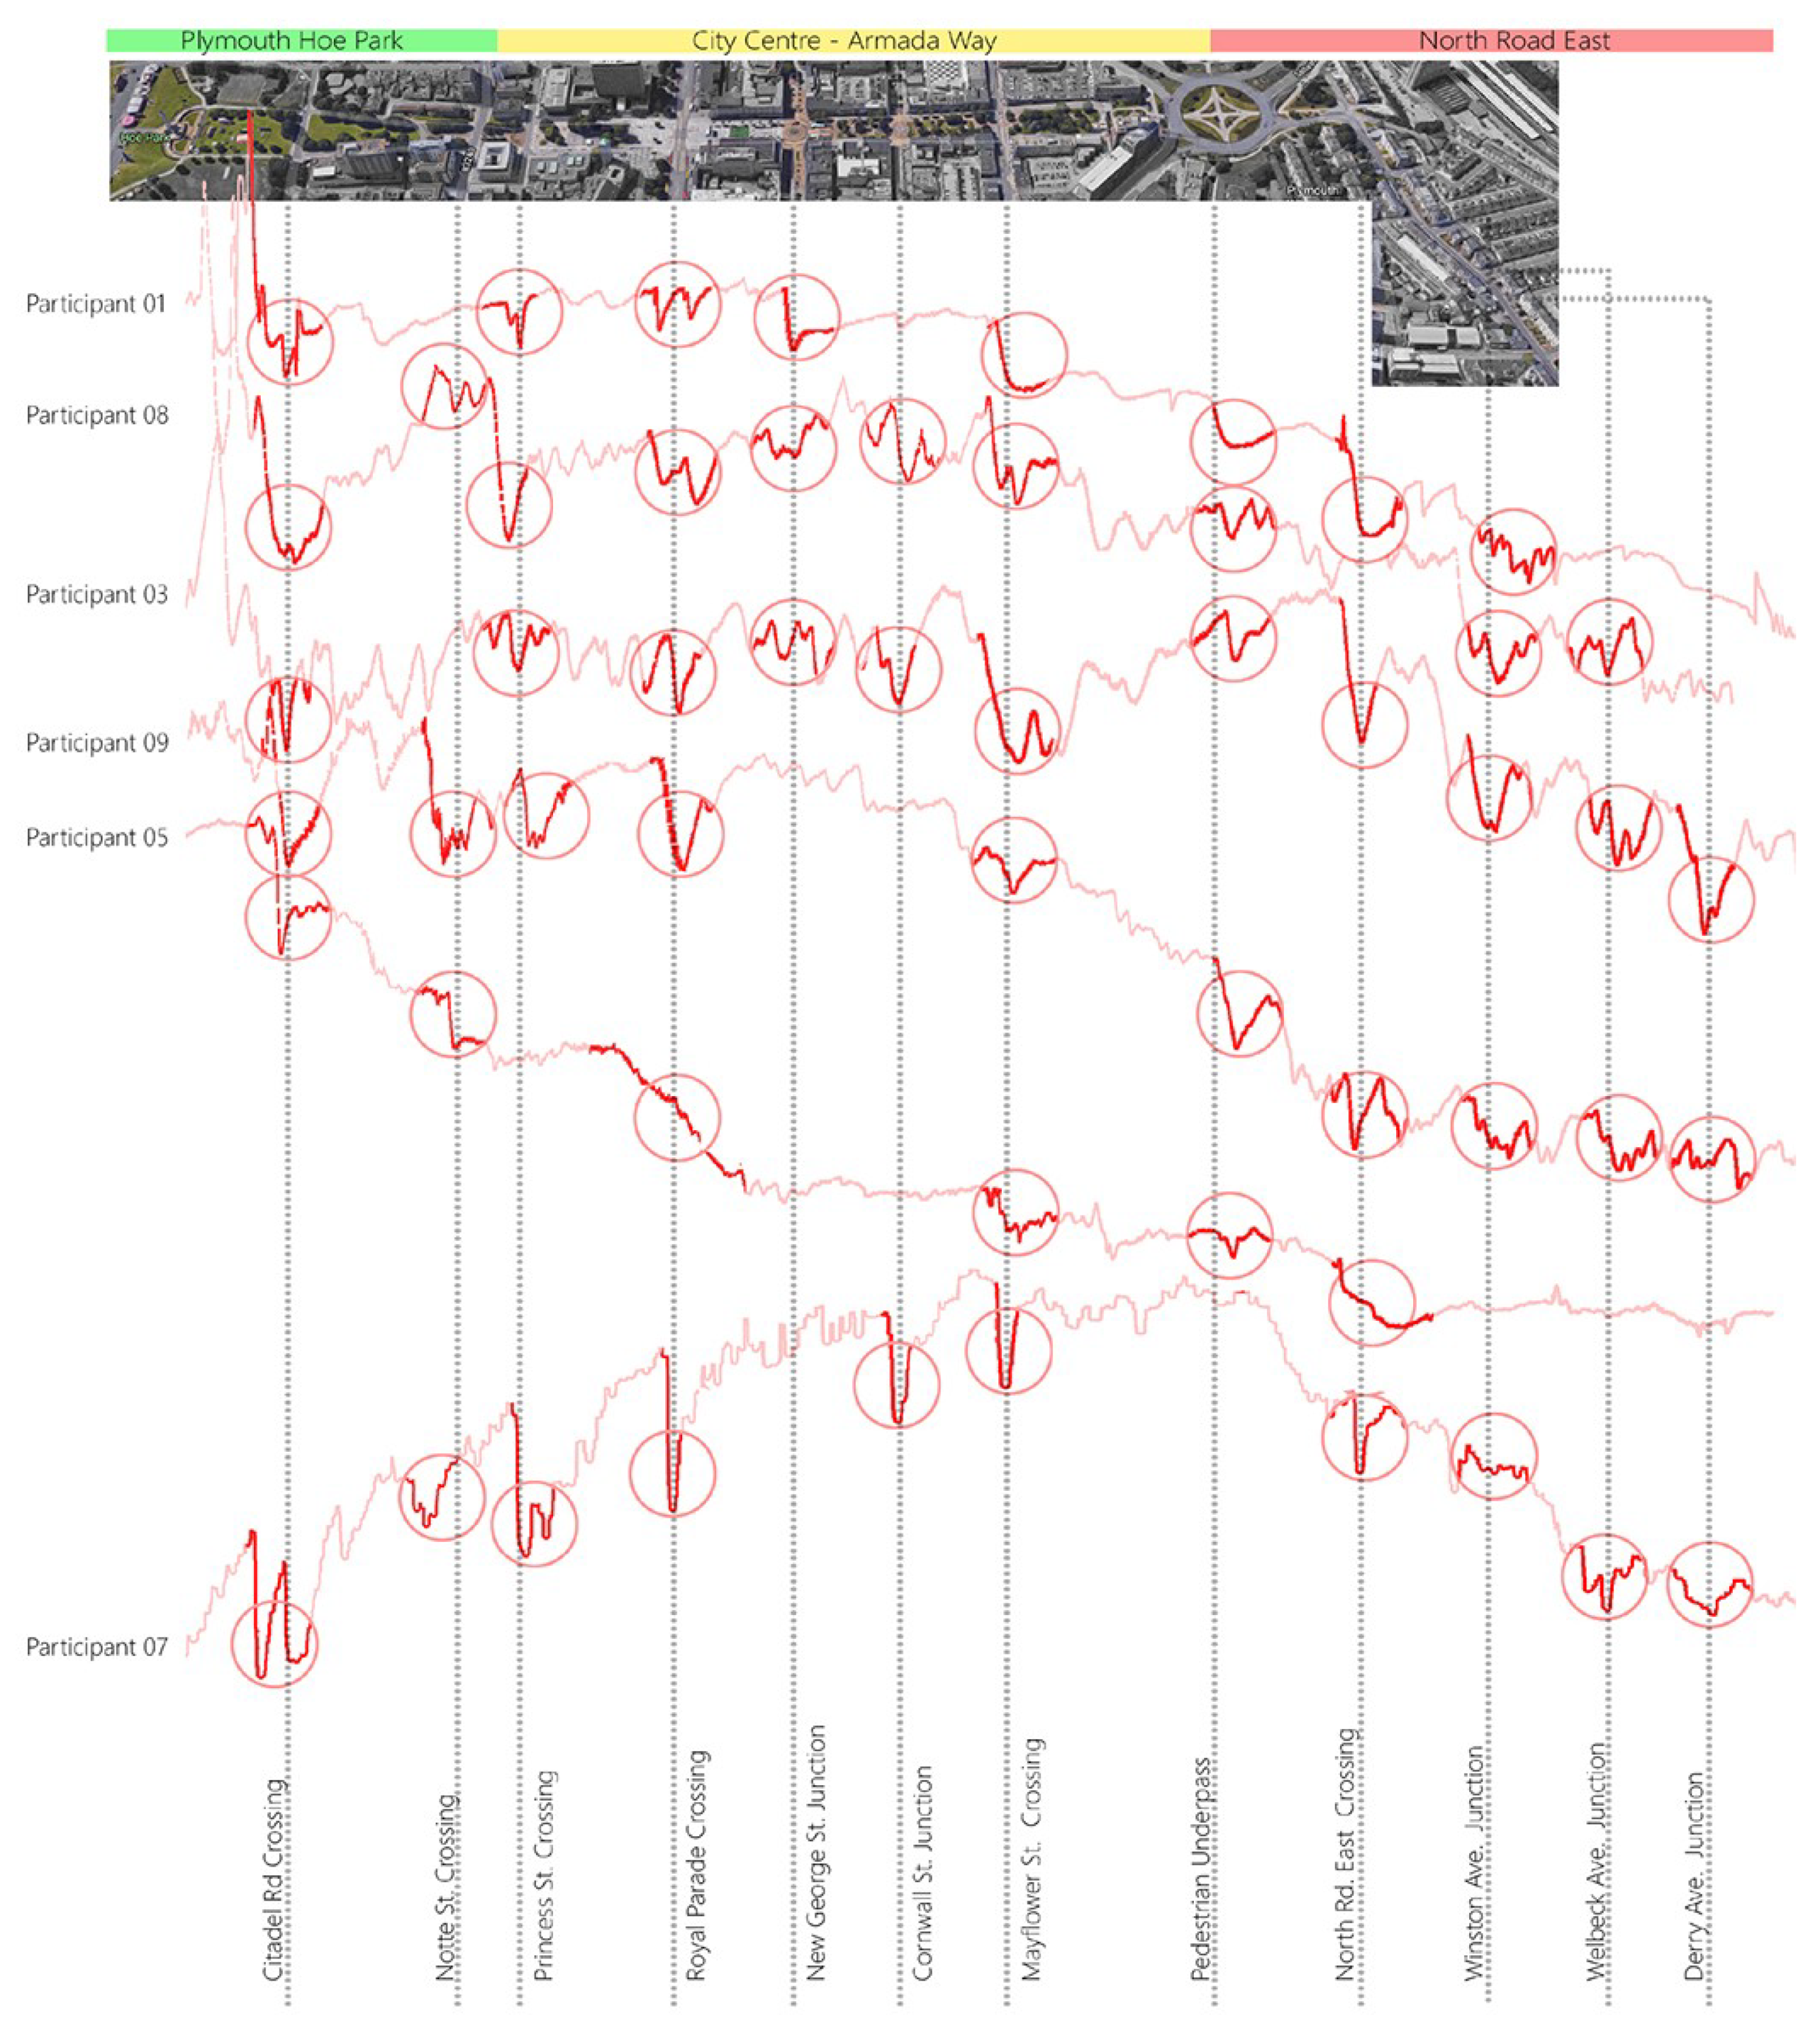
3.3. Relationship between Stress Levels and the Presence of Traffic and Natural Features
4. Discussion
4.1. Changes in Emotions and the Link with Urban Planning Features
- Areas with more green space and natural features result in creating a less stressful environment for the participants (e.g., Plymouth Hoe).
- Areas with higher levels of urban traffic (more cars) result in creating a more stressful environment for the participants (e.g., North Road East).
- Road crossings and junctions result in stress ‘peaks’ or sudden increase in stress level by the participants (e.g., Royal Parade).
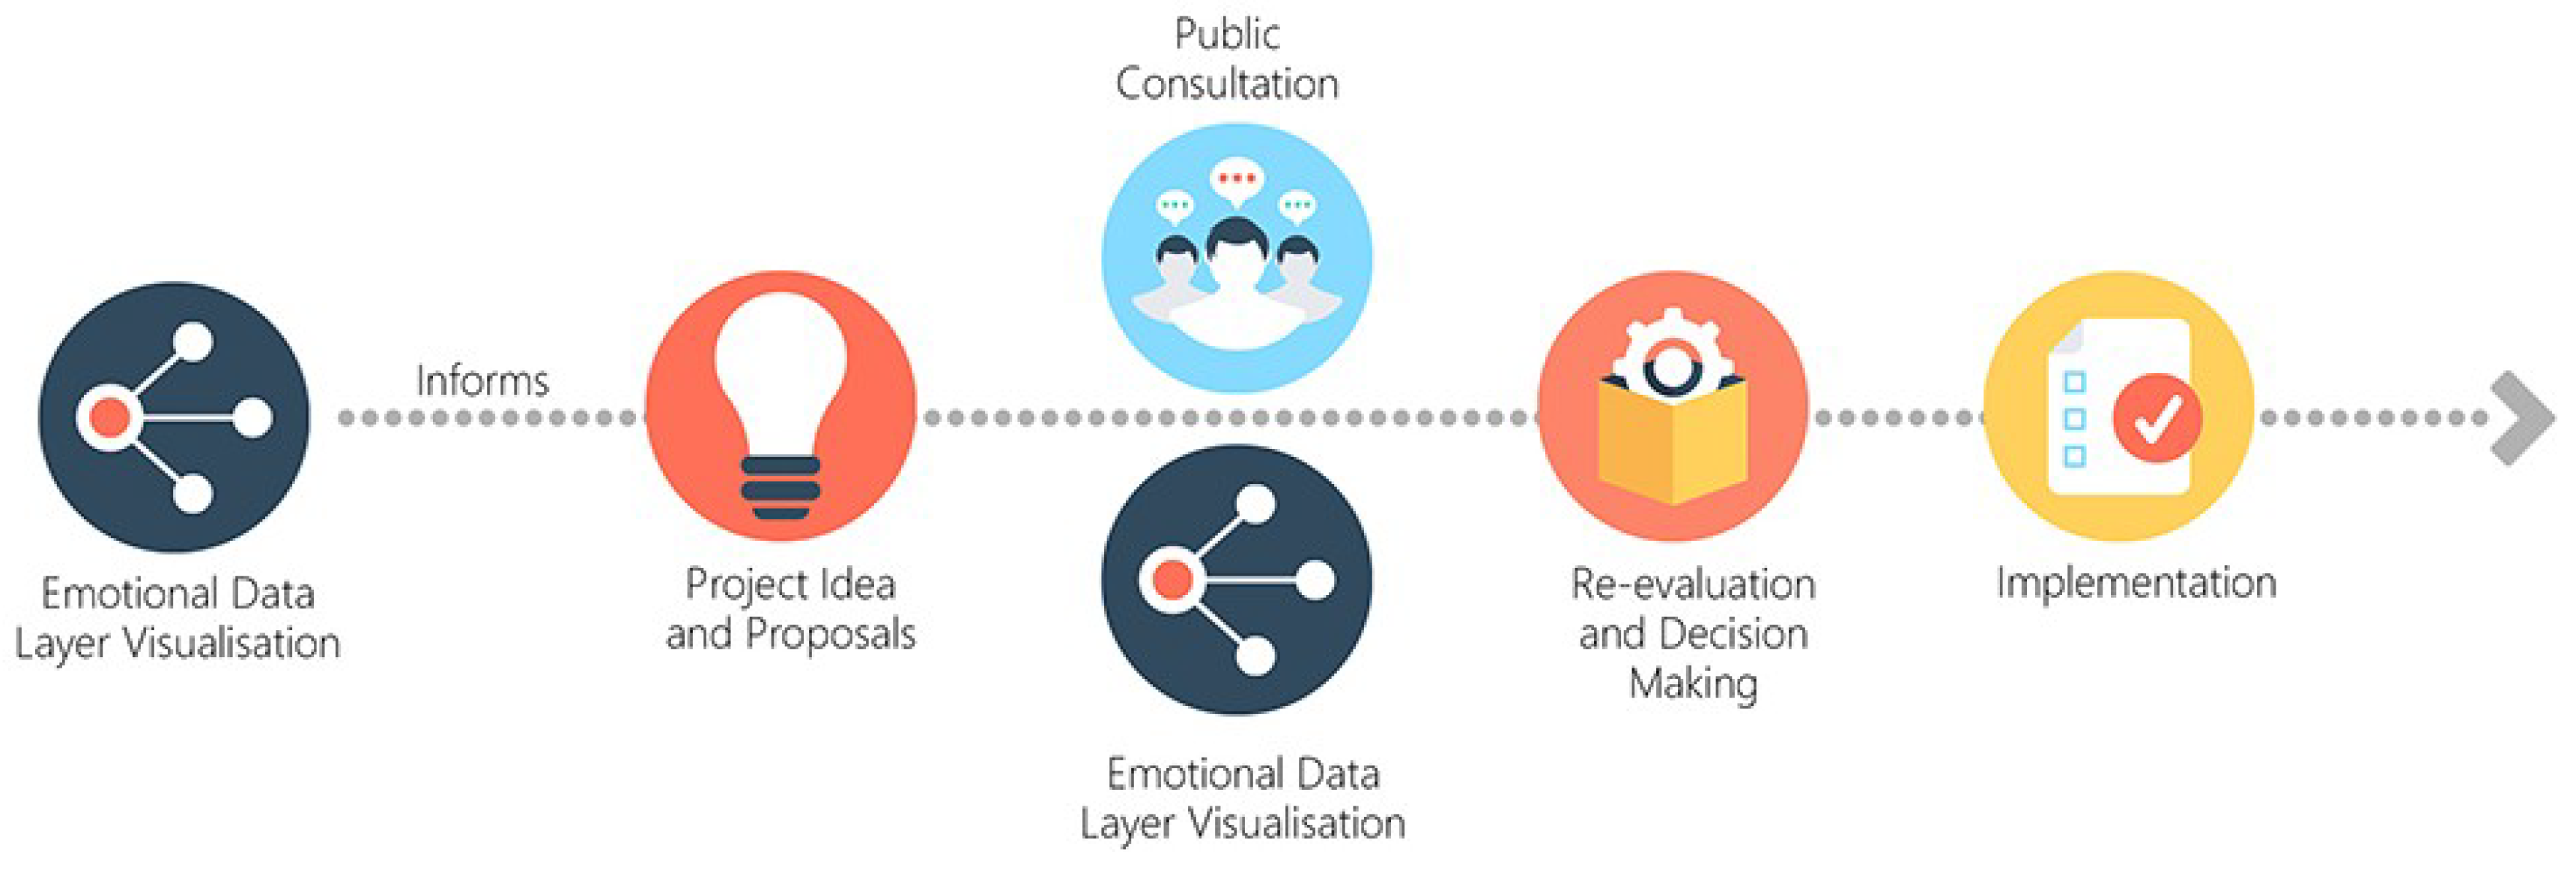
4.2. Physiological Data for Citizen-Centric Participatory Planning
5. Conclusions
Author Contributions
Funding
Acknowledgments
Conflicts of Interest
References
- Willis, K.S.; Aurigi, A. Digital and Smart Cities; Routledge: London, UK, 2017. [Google Scholar]
- Cowley, J.E. Planning in the age of facebook: The role of social networking in planning processes. GeoJournal 2010, 75, 407–420. [Google Scholar] [CrossRef]
- Desouza, K.C.; Bhagwatwar, A. Citizen apps to solve complex urban problems. J. Urban Technol. 2012, 19, 107–136. [Google Scholar] [CrossRef]
- Mclaren, D.; Agyeman, J. Sharing Cities: A Case for Truly Smart and Sustainable Cities; MIT Press: Cambridge, MA, USA, 2015. [Google Scholar]
- Linders, D. From e-government to we-government: Defining a typology for citizen coproduction in the age of social media. Gov. Inf. Q. 2012, 29, 446–454. [Google Scholar] [CrossRef]
- Innes, J.E.; Booher, D.E. Reframing public participation: Strategies for the 21st century. Plan. Theory Pract. 2004, 5, 419–436. [Google Scholar] [CrossRef]
- Renn, O.; Webler, T.; Rakel, H.; Dienel, P.; Johnson, B. Public participation in decision making: A three-step procedure. Policy Sci. 1993, 26, 189–214. [Google Scholar] [CrossRef]
- Wilson, A.; Tewdwr-Jones, M.; Comber, R. Urban planning, public participation and digital technology: App development as a method of generating citizen involvement in local planning processes. Environ. Plan. B Urban Anal. City Sci. 2017. [Google Scholar] [CrossRef]
- Münster, S.; Georgia, C.; Heijneb, K.; Klamerta, K.; Noennig, J.R.; Pump, M.; Stelzle, B.; Meer, H.V.D. How to involve inhabitants in urban design planning by using digital tools? An overview on a state of the art, key challenges and promising approaches. Procedia Comput. Sci. 2017, 112, 2391–2405. [Google Scholar] [CrossRef]
- Crivellaro, C.; Comber, R.; Bowers, J. A Pool of Dreams: Facebook, Politics and the Emergence of a Social Movement. In Proceedings of the 32nd annual ACM conference (CHI ‘14), Toronto, ON, Canada, 26 April–1 May 2014; ACM Press: New York, NY, USA, 2014; pp. 3573–3582. [Google Scholar]
- Hasler, S.; Chenal, J.; Soutter, M. Digital tools as a means to foster inclusive, data-informed urban planning. Civ. Eng. Arch. 2017, 5, 230–239. [Google Scholar] [CrossRef]
- Jacobs, J. The Death and Life of American Cities; Random House: New York, NY, USA, 2002. [Google Scholar]
- Lane, M. Public participation in planning: An intellectual history. Aust. Geogr. 2005, 36, 283–299. [Google Scholar] [CrossRef]
- Hall, P. Urban and Regional Planning, 3rd ed.; Routledge: London, UK, 1992. [Google Scholar]
- Faludi, A. Planning Theory; Pergamon: New York, NY, USA, 1973. [Google Scholar]
- Arnstein, S. A ladder of citizen participation. J. Am. Plan. Assoc. 1969, 35, 216–224. [Google Scholar] [CrossRef]
- Painter, M. Participation and power. In Citizen Participation in Government; Munro-Clarke, M., Ed.; Hale & Ironmonger: Sydney, Australia, 1992. [Google Scholar]
- Raslan, R.; Al-hagla, K.; Bakr, A. Integration of Emotional Behavioural layer “emobel” in city planning. In Proceedings of the REAL CORP 2014—PLAN IT SMART! Clever Solutions for Smart Cities: 19th International Conference on Urban Planning, Regional Development and Information Society, Vienna, Austria, 21–23 May 2014; pp. 309–317. [Google Scholar]
- Baum, H. Planning with half a mind: Why planners resist emotion. Plan. Theory Pract. 2015, 16, 498–516. [Google Scholar] [CrossRef]
- Lynch, K. The Image of the City; MIT Press: Cambridge, MA, USA, 1967. [Google Scholar]
- Ferreira, A. Emotions in planning practice: A critical review and a suggestion for future developments based on mindfulness. Town Plan. Rev. 2013, 84, 703–719. [Google Scholar] [CrossRef]
- Porter, L.; Sandercock, L.; Umemoto, K.; Bates, L.; Zapata, M.A.; Kondo, M.C.; Zitcer, A.; Lake, R.W.; Fonza, A.; Sletto, B.; et al. What’s love got to do with it? Illuminations on loving attachment in planning. Plan. Theory Pract. 2012, 13, 593–627. [Google Scholar] [CrossRef]
- Gunder, M.; Hillier, J. Planning in Ten Words or Less; Ashgate: Farnham, UK, 2009. [Google Scholar]
- Mislove, A.; Lehmann, S.; Ahn, Y.Y.; Onnela, J.P.; Rosenquist, J.N. Pulse of the nation: US mood throughout the day inferred from twitter. Rumpus, 7 March 2010. [Google Scholar]
- Tauscher, S.; Neumann, K. Combining web map services and opinion mining to generate sentiment maps of touristic locations. In Service Oriented Mapping; Jobst, M., Ed.; JobstMedia Management Verlag Wien: Wien, Germany, 2012; pp. 277–286. [Google Scholar]
- Resch, B.; Summa, A.; Sagl, G.; Zeile, P.; Exner, J.-P. Urban emotions—Geo-semantic emotion extraction from technical sensors, human sensors and crowdsourced data. In Progress in Location-Based Services; Gartner, G., Huang, H., Eds.; Springer International Publishing: Berlin/Heidelberg, Germany, 2015; pp. 199–212. [Google Scholar]
- Resch, B.; Sudmanns, M.; Sagl, G.; Summe, A.; Zeile, P.; Exner, J.E. Crowdsourcing physiological conditions and subjective emotions by coupling technical and human mobile sensors. J. Geogr. Inf. Sci. 2015, 514–524. [Google Scholar] [CrossRef]
- Resch, B.; Summa, A.; Zeile, P.; Strube, M. Citizen-centric urban planning through extracting emotion information from twitter in an interdisciplinary space-time-linguistics algorithm. Urban Plan. 2016, 1, 114–127. [Google Scholar] [CrossRef]
- Hauthal, E.; Burghardt, D. Extraction of location-based emotions from photo platforms. In Progress in Location-Based Services; Krisp, J., Ed.; Springer: Munich, Germany, 2013. [Google Scholar]
- Aiello, L.M.; Schifanella, R.; Quercia, D.; Aletta, F. Chatty maps: Constructing sound maps of urban areas from social media data. R. Soc. Open Sci. 2016, 3. [Google Scholar] [CrossRef] [PubMed]
- Mody, R.; Willis, K.; Kerstein, R. Wimo: Location-Based Emotion Tagging. In Proceedings of the 8th International Conference on Mobile and Ubiquitous Multimedia, Cambridge, UK, 22–25 November 2009; ACM Press: New York, NY, USA, 2009; pp. 1–4. [Google Scholar]
- Zeile, P.; Resch, B.; Dörrzapf, L.; Exner, J.-P.; Sagl, G.N.; Summa, A.; Sudmanns, M. Urban emotions—Tools of integrating people’s perception into urban planning. In Proceedings of the REAL CORP: Conference on Urban Planning and Regional Development in the Information Society, Ghent, Belgium, 5–7 May 2015. [Google Scholar]
- Nold, C. Emotional Cartography: Technologies of the Self. 2009. Available online: http://www.emotionalcartography.net/ (accessed on 11 September 2018).
- Zeile, P.; Resch, B.; Loidl, M.; Petutschnig, A.; Dörrzapf, L. Urban emotions and cycling experience—Enriching traffic planning for cyclists with human sensor data. GI Forum 2016, 1, 204–216. [Google Scholar] [CrossRef]
- Shoval, N.; Schvimer, Y.; Tamir, M. Tracking technologies and urban analysis: Adding the emotional dimension. Cities 2018, 72, 32–42. [Google Scholar] [CrossRef]
- Dawson, E.M.; Schell, A.M.; Filion, D.L. The electrodermal system. In Handbook of Psychophysiology; Cambridge University Press: New York, NY, USA, 2007; pp. 200–223. [Google Scholar]
- Boucsein, W.; Fowles, D.C.; Grimnes, S.; Ben-Shakhar, G.; Roth, W.T.; Dawson, M.E.; Filion, D.L. Publication standards for eda. Psychophysiology 2012, 49, 1017–1034. [Google Scholar] [PubMed]
- Kreibig, S.D. Autonomic nervous system activity in emotion: A review. Biol. Psychol. 2010, 84, 394–421. [Google Scholar] [CrossRef] [PubMed]
- Da Silva, A.N.R.; Zeile, P.; de Oliveira Aguiar, F.; Papastefanou, G.; Bergner, B.S. Smart sensoring and barrier free planning: Project outcomes and recent developments. In Technologies for Urban and Spatial Planning: Virtual Cities and Territories; Pinto, N.N., Tenedório, J.A., Antunes, A.P., Cladera, J.R., Eds.; IGI Global: Hershey, PA, USA, 2014; pp. 93–112. [Google Scholar]
- Bakker, J.; Pechenizkiy, M.; Sidorova, N. What’s your current stress level? Detection of stress patterns from gsr sensor data. In Proceedings of the 2011 IEEE 11th International Conference on Data Mining Workshops (ICDMW’11), Washington DC, USA, 11 December 2011; Spiliopoulou, M., Wang, H., Cook, D., Pei, J., Wang, W., Zaïane, O., Wu, X., Eds.; IEEE Computer Society: Washington, DC, USA, 2011; pp. 573–580. [Google Scholar]
- MacKerron, G.; Mourato, S. Happiness is greater in natural environments. Glob. Environ. Chang. 2013, 23, 992–1000. [Google Scholar] [CrossRef]
- Klettner, S.; Huang, H.; Schmidt, K.; Gartner, G. Crowdsourcing affective responses to space. Kartographische Nachrichten 2013, 2, 66–72. [Google Scholar]
- Gabrys, J. Programming environments: Environmentality and citizen sensing in the smart city. Environ. Plan. D Soc. Space 2014, 32. [Google Scholar] [CrossRef]
- Haklay, M. Beyond quantification: A role for citizen science and community science in a smart city. In Proceedings of the Data and City Workshop, Kildare, Ireland, 31 August–1 September 2015. [Google Scholar]
- Niederer, S.; Priester, R. Smart citizens: Exploring the tools of the urban bottom-up movement. Comput. Support. Coop. Work 2016, 25, 137–152. [Google Scholar] [CrossRef]


| Location on Walk | Name | Type of Space | Urban Characteristics |
|---|---|---|---|
| Start of the walk | Plymouth Hoe | Park | Fully pedestrianised greenspace with the least traffic |
| Mid-way through the walk | Armada Way | Urban pedestrianised | A mix of both pedestrianised area and traffic (with some green space and natural features) |
| End of the walk | North Road East | Urban road | Busy road with very limited natural features |
| Name | Type of Space | Characteristics |
|---|---|---|
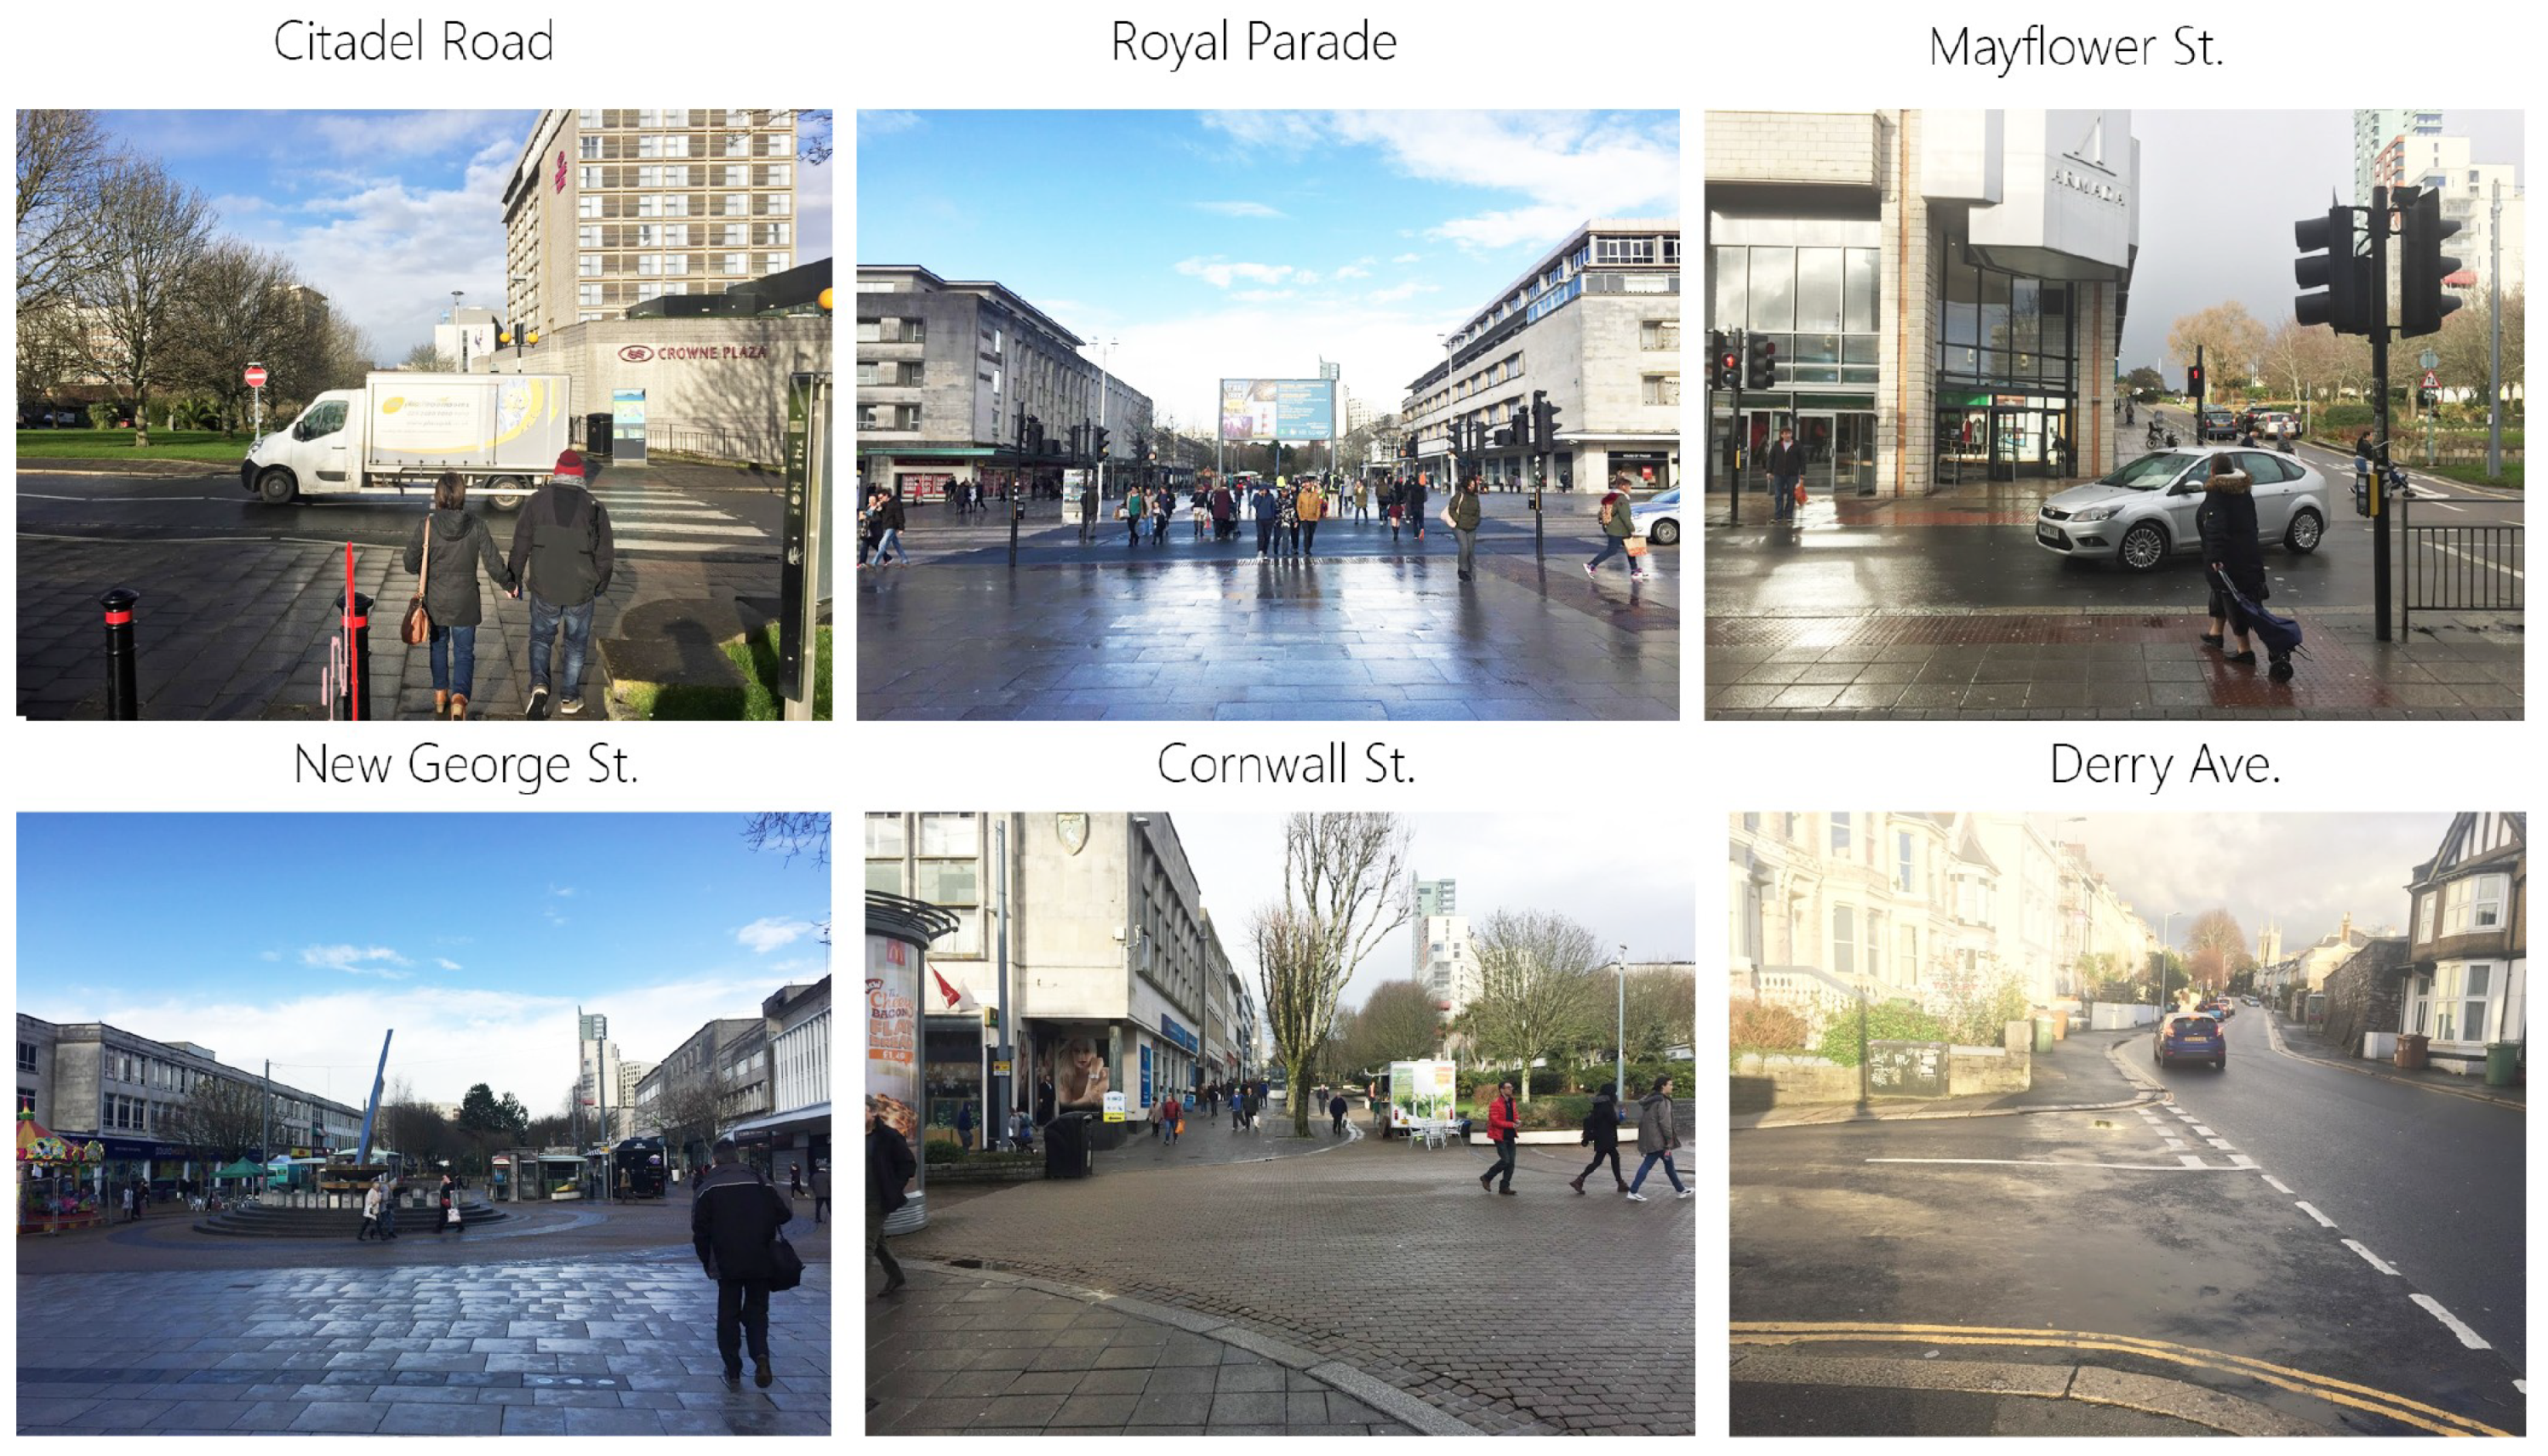
| Citadel Road | Busy road junction | Busy road with high levels of traffic |
| Royal Parade | Busy road, with busy pedestrian crossing | Busy road with high levels of traffic, including buses and taxis. Main pedestrian crossing of city centre with high pedestrian traffic |
| Mayflower Street | Road junction | Busy road |
| New George Street | Pedestrianised | Fully pedestrianised wide shopping avenue with high pedestrian traffic |
| Cornwall Street | Pedestrianised | Fully pedestrianised wide shopping avenue with high pedestrian traffic |
| Derry Avenue | Quiet road junction | Road with low levels of traffic |
© 2018 by the authors. Licensee MDPI, Basel, Switzerland. This article is an open access article distributed under the terms and conditions of the Creative Commons Attribution (CC BY) license (http://creativecommons.org/licenses/by/4.0/).
Share and Cite
Fathullah, A.; Willis, K.S. Engaging the Senses: The Potential of Emotional Data for Participation in Urban Planning. Urban Sci. 2018, 2, 98. https://doi.org/10.3390/urbansci2040098
Fathullah A, Willis KS. Engaging the Senses: The Potential of Emotional Data for Participation in Urban Planning. Urban Science. 2018; 2(4):98. https://doi.org/10.3390/urbansci2040098
Chicago/Turabian StyleFathullah, Afif, and Katharine S. Willis. 2018. "Engaging the Senses: The Potential of Emotional Data for Participation in Urban Planning" Urban Science 2, no. 4: 98. https://doi.org/10.3390/urbansci2040098
APA StyleFathullah, A., & Willis, K. S. (2018). Engaging the Senses: The Potential of Emotional Data for Participation in Urban Planning. Urban Science, 2(4), 98. https://doi.org/10.3390/urbansci2040098