
Understanding the Urban Middle-Class and Its Housing Characteristics—Case Study of Casablanca, Morocco


1
School of Architecture, Planning & Design, Mohammed VI Polytechnic University, UM6P, Benguerir 43150, Morocco
2
École Polytechnique Fédérale de Lausanne, EPFL, 1015 Lausanne, Switzerland
*
Author to whom correspondence should be addressed.
Urban Sci. 2022, 6(2), 32; https://doi.org/10.3390/urbansci6020032
Submission received: 12 February 2022
/
Revised: 9 March 2022
/
Accepted: 11 March 2022
/
Published: 29 April 2022
Abstract
:With the rapid urbanization occurring across African cities, the emergence of a middle class is exerting its influence on the urban form and structure. Matching their social status and drawing on global influences, the housing characteristics of this class are distinctive in spatial organization, material choice, and location, among others. Understanding these emerging typologies is critical for urban housing policy to be responsive to the needs and preferences of this class. The present paper aims first to develop a new approach for defining the middle class in the African context and second, to analyze its housing typology through a multidimensional analysis based on housing attributes and socio-economic characteristics in Casablanca City. A data-driven approach based on principal component analysis (PCA) has been used to define multidimensionally the middle class and its housing typology. Through the construction of a multidimensional composite index to measure middle class, the study highlighted that middle-class housing is characterized by an adequate condition, a suitable size (two to three rooms), and affordability between 8000 and 11,000 Moroccan dirhams (MAD) per square meter. In addition, although the Moroccan modern houses (two-floor single-family housing) and apartments (four floors or greater) are the most occupied by the middle class, the study showed that as income and social mobility increase, the apartment building and the villa are increasingly preferred to the Moroccan modern house.
1. Introduction
Today, 57% of the world’s population lives in urban areas, a proportion that is expected to grow to almost 70% by 2050. Approximately 200,000 new city dwellers are added to the world’s population daily, which translates into 5 million new urban dwellers per month in the developing world and 500,000 in developed countries, there are nearly 1000 urban agglomerations with populations of 500,000 or more, three-quarters of which are in developing countries [1]. Urbanization rates are much faster in these countries as demonstrated by the growth rate in Africa, which is ten times higher than in Europe [1]. Urban areas have always been the world’s economic dynamos for centuries, attracting skilled workers and productive businesses and benefiting from economies of scale. Urbanization and per capita GDP tend to move in close synch as countries develop. The economic development leads to the emergence of a new middle class with incomes high enough to become significant consumers of goods and services [2].
As the fastest growing in the world, Africa’s urban middle class has tripled over the last 30 years. The potential of this growing urban middle class can lead to economic growth, human capital development, and poverty reduction [3,4]. Indeed, the large middle class in Africa can play a key role in supporting socio-economic resilience and socio-political stability [5]. It sustains consumption and drives much of the investment in good education, good health services, and decent housing. Societies with a strong and large middle class have lower crime rates; enjoy higher levels of trust and life satisfaction, as well as greater political stability and good governance [6]. According to the African Development Bank [3], the increase in size and purchasing power of Africa’s middle class has significantly helped reduce poverty and lift previously poor households into the middle class. Therefore, fostering the growth of the middle class has become one of the big challenges which must be met at the highest level of public priorities and interests to policymakers to reap its positive dividends and to make up the socio-economic development deficit in Africa. Designing appropriate and targeted urban policies that can help to expand the middle class and meet their real needs depends, first and foremost, on the exact determination of who falls into this social class and also an understanding of its influence on urban development.
Approaches used to define the middle class are very diverse, even kaleidoscopic, within and across disciplines. Many developed countries use income as a key indicator to define middle-class status, because they consider that income tends to be highly correlated with the other trappings of social class, such as economic security, education levels, and consumer preferences [6,7]. However, in developing countries, if the middle class is characterized by its ability to serve as a pillar of social and political stability, and the engine of economic development, it should not be a concern focused solely on income and the provision of basic needs; but should be a class carrier of, more than others, the values of democracy, equality, modernity, efficiency, and merit [3,5,8]. Therefore, the income or the level of consumption, alone, does not allow to define the parameters of a social class with these desired socio-economic specifications, especially since the median income is very low in African countries and cannot be widely spread [4,9]. Thus, the definition of the middle class must be based on observing the social strata living in satisfactory housing and depicting good socio-economic conditions.
Recently, some authors prefer to use a multidimensional approach consisting of education, property, occupation, housing typology, wealth, and income, to best characterize the middle class in many ways [5,9,10,11]. The multidimensional approach, based on monetary and non-monetary attributes, seems to be an alternative to the income-based approach widely used in American and European countries. It has the advantage of taking into account the plurality of social class identification, and of giving priority to variables that can exactly differentiate the middle class. Once the middle class is defined and localized in multidimensional terms, it, therefore, becomes easier to design targeted housing policies and to study and track its impact on the housing market and its spatiotemporal evolution.
In Morocco, according to the data of the housing ministry, the middle-class housing demand has increased in urban areas to reach 37 percent of total housing demand (20.4 percent for the upper-middle class and 16.9 percent for the lower middle class) [12]. In Latin America, Singapore, and China, many authors highlight the transformation accrued in the housing market due to the expanding middle class [13,14,15,16,17], then, gated communities have become the preferred model for the emerging middle income that generates a new urban landscape and also catalyze the change in the master plan and housing policy.
In African cities, much research has focused on the low-income class and informal sector. In this context, slums were the case studies of various works on the informal sector, infrastructure, and housing. However, there is limited knowledge on the emerging middle-income class and its housing typologies. Therefore, the African urban middle class needs to be analyzed to shed light on the contemporary mutation in housing and their potential to be regenerated.
In this framework, the study contributes to the development of literature in two ways:
- Development of a new methodology to measure and best define the middle class in the context of big African cities like Casablanca as a case study.
- Investigation of the association between middle class and housing and how different housing characteristics integrate together with socio-economic strata in Casablanca.
2. Literature Review
- -
- Why does the middle class matter? Impact on economic development and urban configuration.
The dynamics of the middle class play a very important role as a catalyst for economic growth and human capital development. Their lifestyle is typically associated with certain goods, services, and modes of consumption in terms of housing, education, tourism, sport, and health services [7,18]. With this style, they improve not only their quality of life but also raise income levels for everyone in other social classes.
In terms of economic growth, Norman Loayza et al. (2012) proved that when the size of the middle class increases, social policy on health and education becomes more active, and the quality of governance regarding democratic participation and official corruption improves [19]. This does not occur at the expense of economic freedom, as an expansion of the middle class also implies more market-oriented economic policy on trade and finance [7,20].
Van Stel et al. 2005 show that the middle class also contributes to economic growth and capital accumulation as a source of entrepreneurship and innovation. In countries with more middle-income households, entrepreneurship activities tend to have a positive impact on GDP growth [21]. In this sense, a strong middle class is considered an important element to foster small and medium-sized enterprises and to grow a robust entrepreneurial sector [22]. Overall, it has been shown, in other studies, that economic growth is stronger in countries where the middle class is strong [23,24].
In terms of human capital, Duflo and Banerjee (2008) (2019 Nobel prize in Economics) and Brown and Hunter (2004) emphasize that the middle class allocate greater expenses to the education of their children and invest considerably in improving their knowledge and skills [25,26]. In doing so they participate in the improvement of human capital in the present and future. This will ensure the sustainability of well-being and adequate lifestyle for future generations, and consequently the improvement of current and future GDP per capita [22,23,27].
In terms of housing and urban configuration, many studies show that the rise of the middle class and its new demand for housing represents a tectonic shift in housing quality and urban structure and configuration. The middle-class lifestyle is typically correlated with certain living conditions, such as decent housing, and being secure, affordable, accessible, and close to urban centers [7].
The urban middle class now constitutes an important new market and a major source of revenue for local and global companies. In the future, we are likely to see brands and strategies specifically targeted at this new consumer group [28,29,30].
In China, for example, Choon-Piew (2012) demonstrates how middle-class gated communities have reshaped the urban landscape with the creation of a new territorialization of privilege, lifestyle, and private property [31]. Some scholars have further argued that middle-class housing like gated communities is an effective and innovative way of organizing urban structures. This type of housing has become a part of the state’s urban/national developmental agenda in Singapore for example and is less socially and spatially divisive than those depicted elsewhere [17].
In Latin America, a range of studies have revealed that the middle income exerts its influence on the housing and the urban configuration. Gated communities with private safety schemes, a pool, and private parking systems are the preferred model for the emerging middle class [13,32], this has created a new urban configuration that divides the cities into two distinct blocs: settlement for the poor and gated communities for middle and upper class [13,14,16,33].
In Africa, many studies, in Sudan and Tanzania for example, state that the expanding middle-income fuels demand for formal and well-located housing, public utilities, infrastructure, and services [34,35,36]. It is worth noting that, due to this new demand, companies that design and promote satellite cities have changed their strategies in order to best accommodate the expanding African middle class. Therefore, urban policies targeting this social class in Africa need first to understand their preferences and their financial capacity of payment services such as decent and well-located housing. The adoption of smart city and smart home concepts can be a good alternative for companies to attract and expand the middle class by offering a good quality of life and enhancing efficiency at a lower cost [37,38].
- -
- How can we measure the middle class in African cities?
Although the middle class has been extensively studied in academic literature [6,7,9,10,11,20,25,35,39], developing a specific definition of the middle class is still not easy. There is not even a consensus on how to measure the share of the middle-income population [39] and it is often compounded by the complexity of the situation.
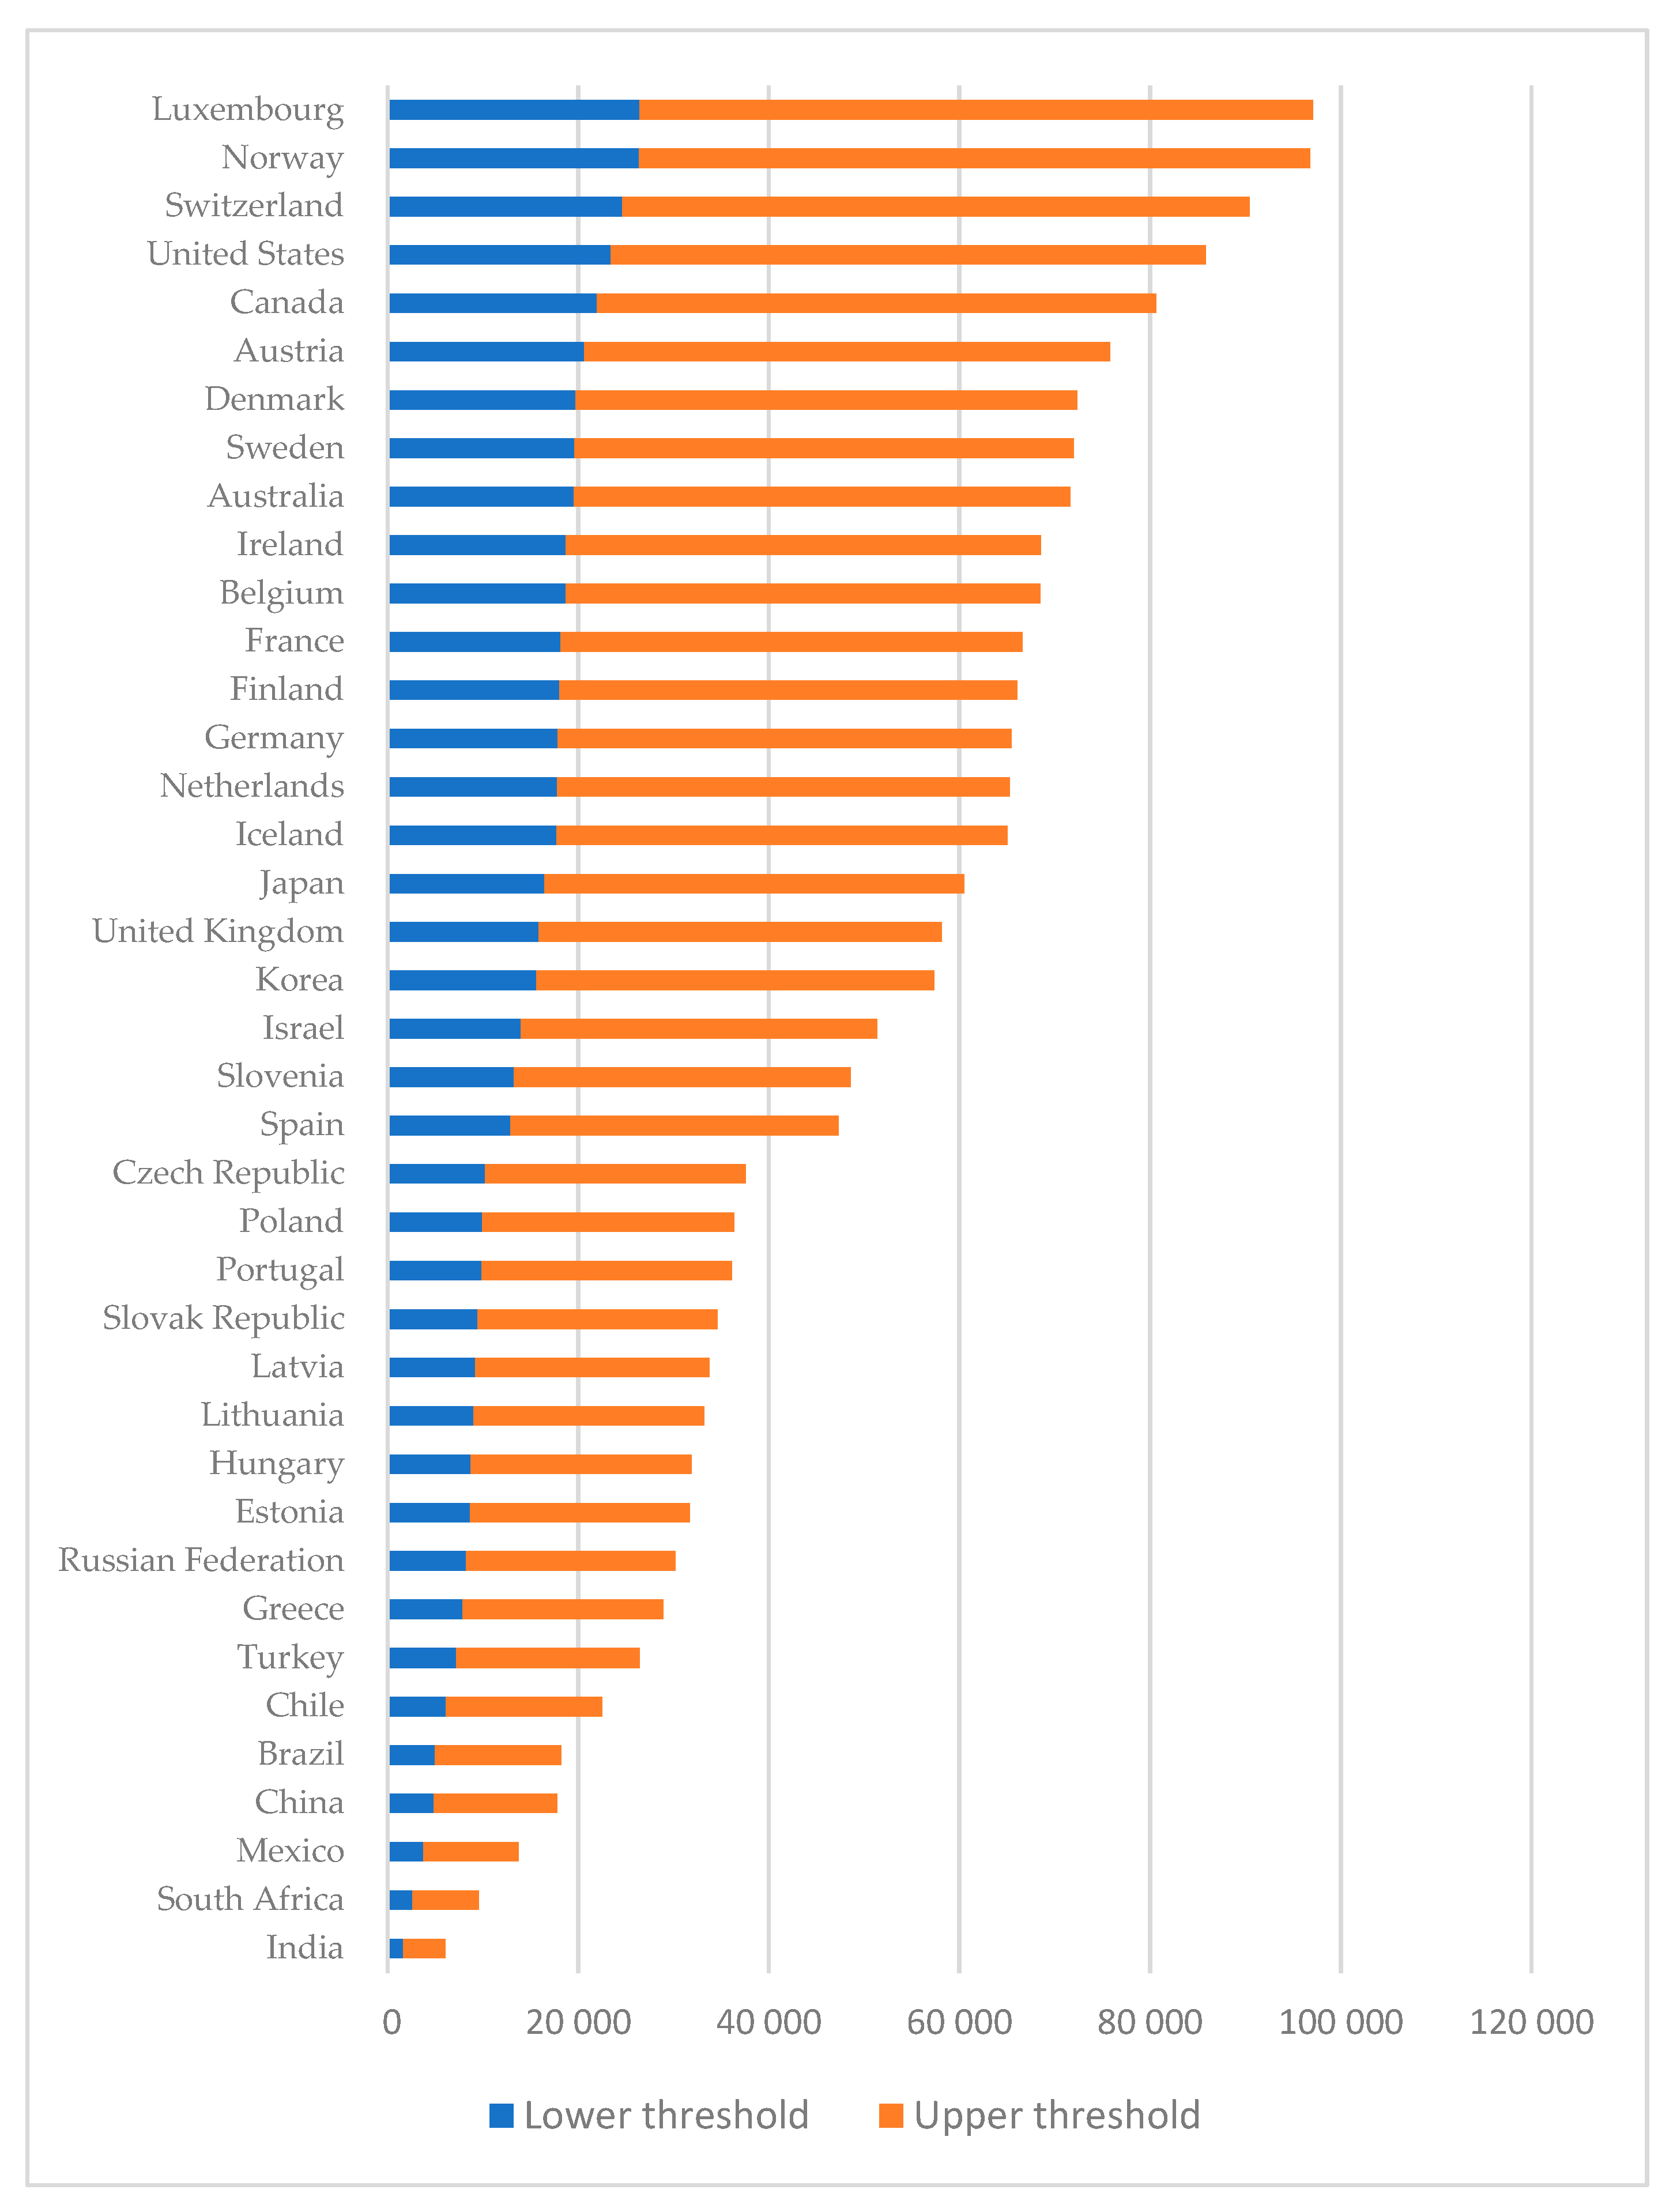
OECD defines the “middle-income class” as the population living in households with incomes ranging between 75% and 200% of the national median. For some of the analyses, the middle-income class is subdivided into three groups: lower-middle incomes (75% to 100% of the median), middle-middle income (100% to 150% of the median), and upper-middle income (150% to 200% of the median). The population in households with income below 75% of the median are the “lower-income class” and those with income above 200% of the median are the “upper-income class”. Based on this definition, the annual income of the middle class in the United States is between USD 23,000 and 62,000, while in Mexico or India is respectively between USD 3757 and 10,019 and USD 1656 and 4417 (Figure 1) [6].
The World Bank uses the absolute approach based on the income thresholds to determine the middle class in the emerging economies of Latin America and the Caribbean. It sets lower and upper thresholds of USD 10 and 50 per day, adjusted for international differences in purchasing power [40]. Indicators based on absolute amounts are intuitive and easily understandable by the public. However, they are more suitable for emerging economies, where analyses of absolute living standards are more widely used.
The African Development Bank and the Asian Development Bank have also chosen an absolute measure, defining the middle class as the class made up of people whose consumption expenditures range between USD 2 and 20 in 2005. The African Development Bank divides the middle class into three sub-groups: (1) the lower-middle class, which ranges from individuals consumption between USD 2 and 4 per day, a rate that exceeds very slightly the poverty line in developing countries, making this the first group vulnerable to external shocks; (2) the middle class with consumption ranging between 4 and 10 dollars per day, a category of the population that lives above the level of essential needs and is, therefore, able to save and consume basic goods; (3) the upper-middle class, whose consumption ranges between USD 10 and 20 per day. In addition, the African Development Bank uses a different definition depending on the level of income of the country concerned: between UDS 2 and 10 for poor countries, and between USD 10 and 20 for middle countries.
Although these approaches are based on simple economic definitions, it does not take into account the socio-economic characteristics usually associated with the middle class in many countries (education, lifestyle, occupation, decent housing). In addition, there is a risk of classifying as middle-class people that belong to the poor class according to the absolute approach specifically in developing countries [5]. Deloitte for example is cautious on the definition of a middle class used by the African Development Bank. It considers that it is difficult to imagine how households with such minimal purchasing capacities can afford decent housing as well as the vehicles needed to move around the city, and it may be that prospective property developers are seriously misreading the African market [4].
In Africa and developing countries in general, many constraints make it difficult to define the middle class, based on the income or consumption level. Recent studies highlight that the lack of regularly updated data on the middle class, the weakness of the statistical framework for tracking salaries in the private sector, the size of the informal sector, and the weakness of statistics related to it, all constitute major difficulties that hinder an effective and precise definition of the middle class in these countries.
From this perspective, many studies recommend the use of a multidimensional approach to determine middle-class based on the lifestyle, the degree of composition and the nature of their aspirations, and the necessary ingredients to play a crucial role in achieving social and political stability and to be an engine for economic, social and cultural development in developing countries [5,9,10,41].
3. Materials and Methods
3.1. Study Areas
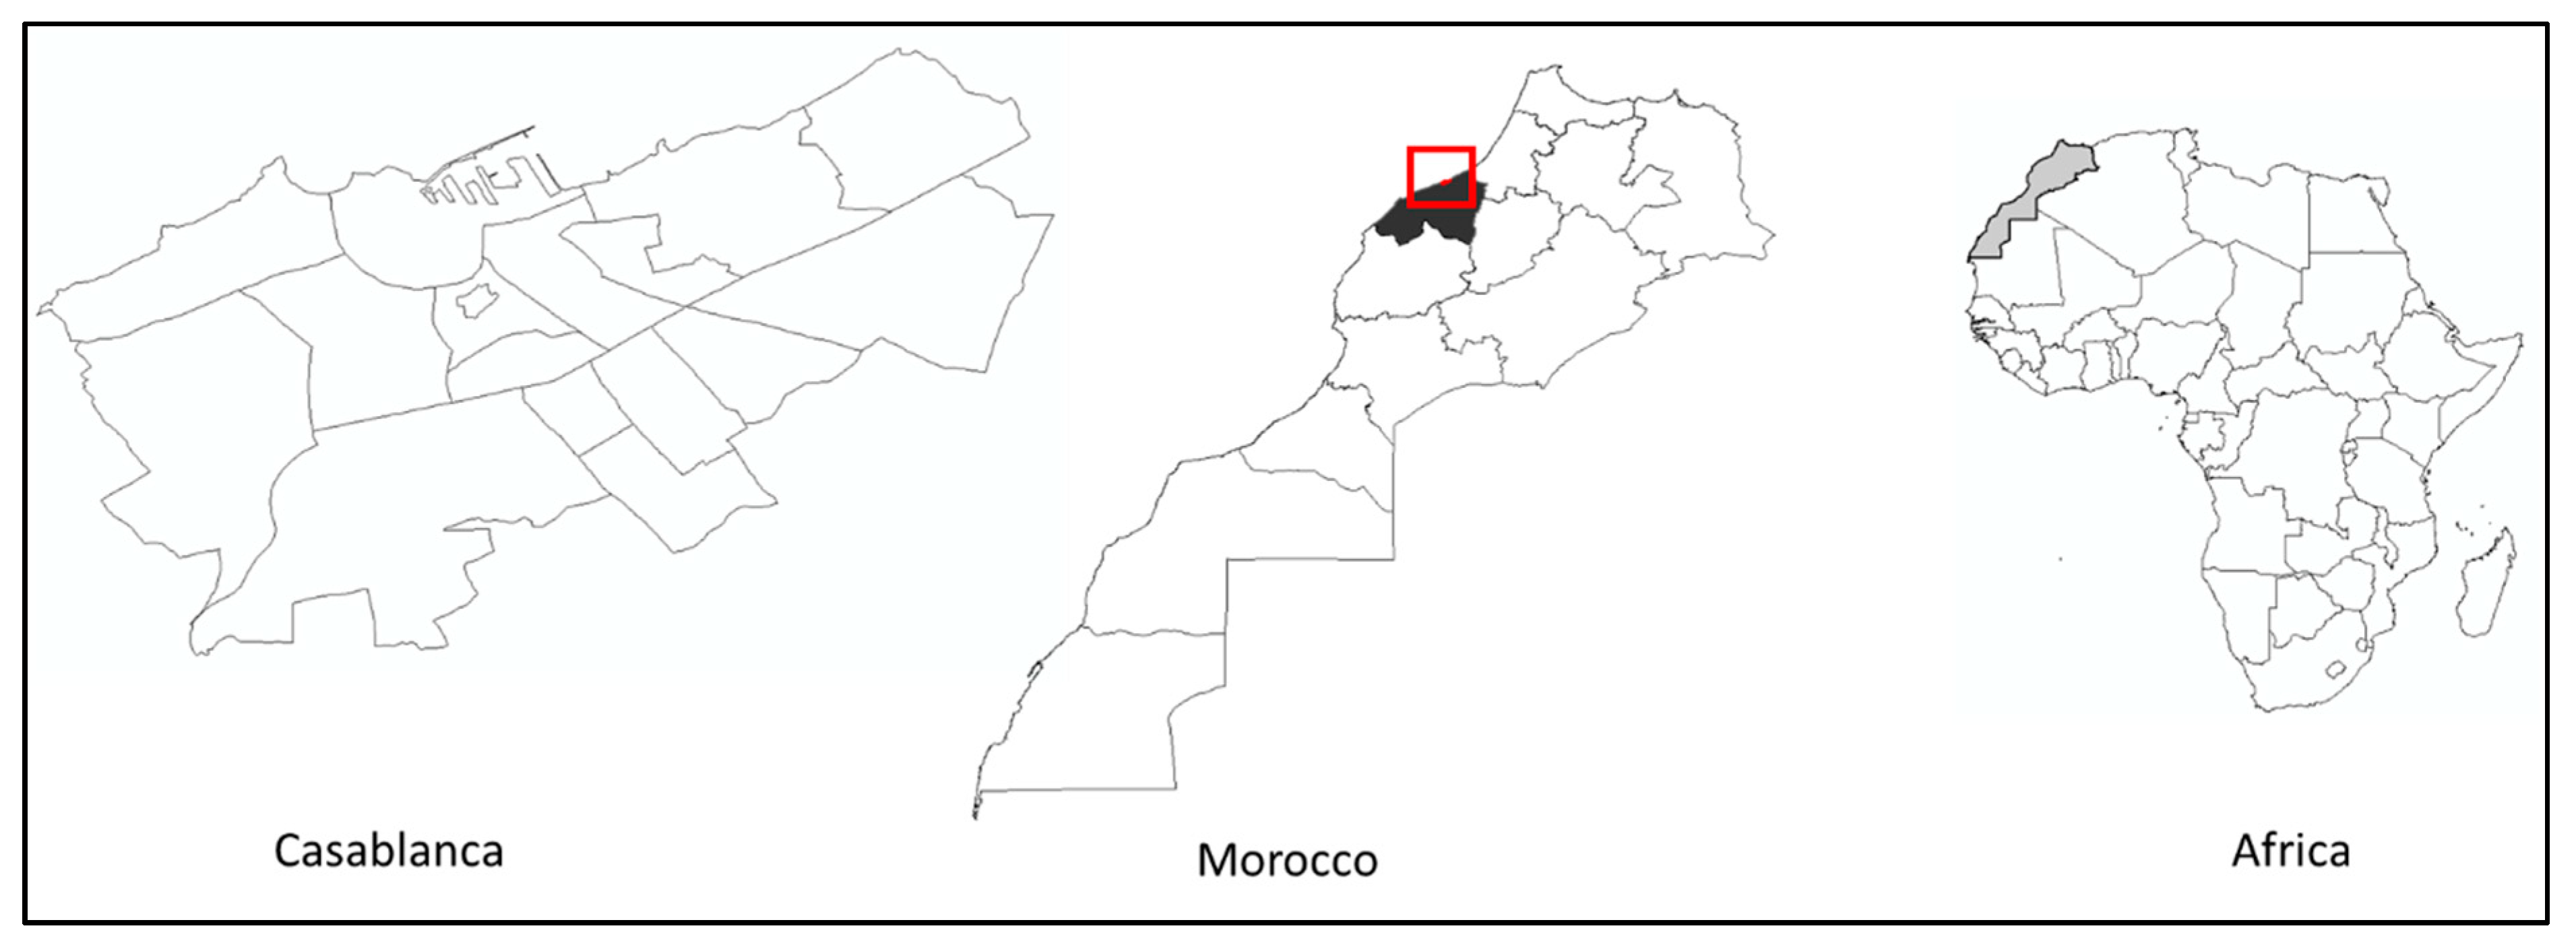
Casablanca has been chosen as the study area for this analysis for many reasons. First, Casablanca is the leading force in the economic development of Morocco and represents the key economic trading node for the African-European region. It is the industrial center of Morocco, with more than 50% of the country’s factories, investment, and commerce operations. Half of all of Morocco’s commercial banking transactions occur in Casablanca [42]. Second, the Greater Casablanca region is considered the locomotive of the development of the Moroccan economy. It attracts 32% of the country’s production units and 60% of industrial labor. This economic development in the city represents 33% of the national gross domestic product (GDP) and has generated strong social mobility and rapid enlargement of the middle class [42]. Finally, the city is also experiencing rapid urban growth and sprawl that lead to an increase in spatial variability in housing demand, infrastructure, public transportation, education and health facilities, and green spaces. The urban sprawl is judged under control due to the densification of the city center and the coastal front, and the spread towards the periphery [43]. In the last national census in 2014, the population of Casablanca was 3,359,818 inhabitants, and its population agglomeration amounted to 4,270,750 inhabitants, representing 46% of the labor force and making it the most populated city in the country (Figure 2).
3.2. Data Collection
As stressed before, many studies recommend the use of a multidimensional approach to identify the middle class in developing countries based on variables that can best describe the middle-class lifestyle. For this purpose, we rely on microdata from the 2014 national population and household census, conducted by the High Commission of Plan (HCP). This census constitutes the only official data that cover detailed information on demographic aspects, education, occupation, and housing attributes as well as characteristics of the dwellings for households across Casablanca City. We include a large set of variables to multidimensionally identify the middle class.
The second set of variables addresses housing price. The idea is to evaluate the affordability to the middle class of certain housing types. This dataset was obtained freely from the National Agency for Land Conservation, Cadaster and Cartography (ANCFCC) website [44]. It is organized by neighborhood and gives the price per square meter for apartments, villas, a Moroccan house, and vacant land.
Accordingly, we selected 76 variables from this data (socio-economic, housing attributes) (Appendix A provides a complete list of variables with a more detailed description), endeavoring to apply theoretical concepts of identifying social classes [45] and relying on the variables most often used in the literature [5,9,46].
3.3. Analysis Methods and Process
Using the R language, the process of analyzing the middle-class housing typology will follow four successive steps (Figure 3):
- Variable selection: application of a first principal component analysis (PCA) allows the selection of the variables, whose contribution to the first component is greater than the average, i.e., the variables with the best correlation with the first component.
- This step aims to select variables based on statistical criteria driven by data in order to avoid any subjectivity in the choice of variables (or group of variables) and avoid redundancy. Only the variables having a contribution to the first factor higher than the average are retained, which means that only the variables most correlated to the first PCA component are retained.
- Construction of a composite index (CI) for measuring middle-class: A second PCA is performed, including the variables selected in the previous step. The first component of this PCA is used to calculate the composite index as the first reduced component.
- Classification of homogeneous geographic territories according to their CI calculated above.
- Analyzing the middle-class housing typology in comparison with the other classes.
The use of the R language was motivated by the fact that it is a powerful programming language and environment commonly used in statistical computing and data analytics. The code developed in this work can be easily reproduced for similar purposes and analysis of the middle class in another city.
4. Results and Discussion
4.1. Identifying the Middle Class
4.1.1. Multicollinearity Analysis
Multicollinearity refers to the situation in which there are some exogenous variables that are nearly linearly dependent. Two steps are recommended when we want to treat this problem. First, detecting its presence and then implementing solutions in order to obtain more consistent results.
The cross-correlation between variables is a basic way of detecting collinearity. The graphic below (Figure 4) shows clearly that some variables (such as cadre_sup (senior executive) and etud_sup (higher education), villa, and poverty) are strongly correlated (positively or negatively). In fact, the r is higher than 0.9 and the p-value lower than 0.005.
For dealing with multicollinearity, numerous techniques are proposed in the literature. For this study, we retain the approach based on a principal component analysis (PCA) of the independent variables. As stressed before, the objective of this operation is to better highlight the variables that maximize the variability and help to differentiate between homogeneous groups. It also helps to select redundant variables for each category of variables using the ones that present the highest correlation with the first component of the PCA.
4.1.2. Variables Selection and Creation of the Composite Index
In order to select the variables that will be included in the final index, two PCAs were carried out, the first one aims to select variables based on statistical criteria driven by data in order to avoid any subjectivity in the choice of variables (or group of variables) and avoid redundancy. Only the variables having a contribution to the first factor higher than the average are retained, which means that only the variables most correlated to the first PCA component are retained.
The second PCA uses the selected variables in the previous step and aims to create a composite index to characterize the middle class and the other classes.
Using this procedure, we have selected 28 variables from the 76 variables. We can notice that the first component is negatively correlated with “disadvantage” variables (global poverty (−0.93), rate of occupancy (−0.93), and illiteracy rate (−0.99), Moroccan house (−0.7), etc.) and positively correlated with “welfare” variables (higher education (0.94), villa (villa in Morocco is a type of housing that speaks of status and wealth) (0.66), activity rate (0.63), senior executive (0.92), etc.) (Table 1 and Figure 5). This is perfectly in line with the notion of the composite index.
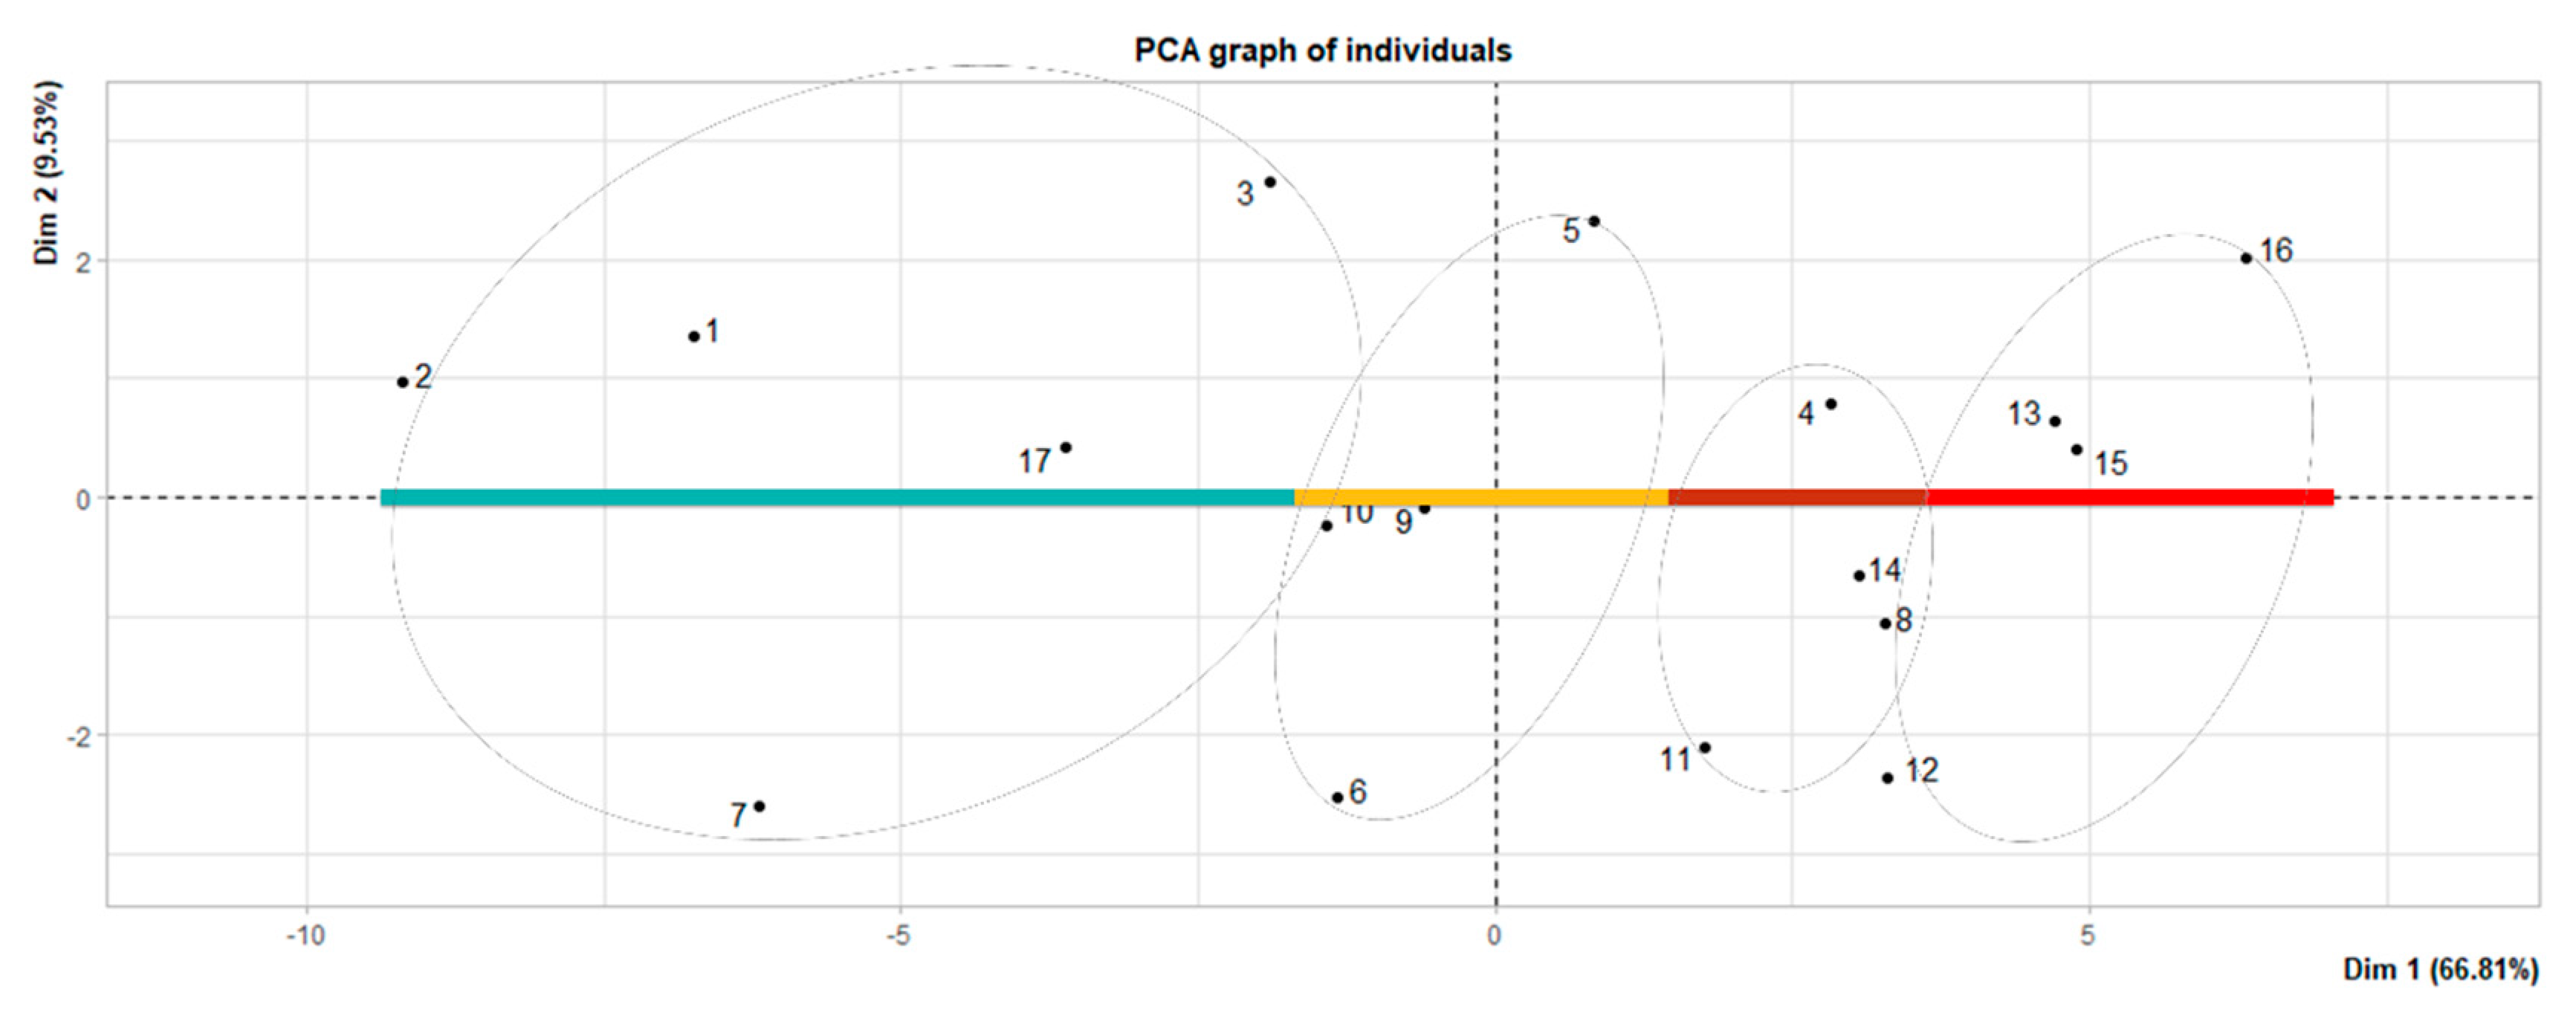
Once the variables are then selected and defined, the result of the second PCA are shown below (Figure 6 and Figure 7).
The first principal component of this PCA explains almost 70% of the total variance (Table 2, Figure 7). In contrast, the second component explains less than 10% of the total variance. The ability to draw residual structures from the second component is then difficult and justifies the conclusion that all of the discriminating information useful for characterizing the middle class is in fact captured by the first component.
As in the income-based approach, the middle class will be defined as the subset of observations within a lower bound that separates the poor from the middle class, and an upper bound that separates it from the rich [6]. Moreover, following the High Commission of Plan (HCP) approach for mapping global poverty, we incorporate a third bound that divides the middle class into two groups: the “lower-middle class” and the “upper-middle class”.
Therefore, the problem consists in partitioning the socio-economic index space into four ordered groups, labeled as the poor/lower class, the lower-middle class and the upper-middle class, and the rich. That is, any notion of the middle class must be conceptually compatible with the implicit definition of the remaining groups outside it (the poor and the rich).
Table 3 presents the mean values of the index by socio-economic class. The first class (class 1 = rich) is characterized by the lowest mean index value and includes the most privileged area, defined by the best living conditions (low percentages of the variables describing socio-economic deprivation and high percentages of variables illustrating material comfort) (Table 3, Figure 8).
At the other end, the fourth class (class 4 = low-income class, poor) is characterized by the highest mean index value and includes the poorest blocks. The blocks of this class are characterized by a greater cumulative lack of material and social resources (low education, workers, high occupancy rate, and high density).
Between these two classes we find in the middle-class, we divided them into two groups: class 3 as the lower-middle class and class 2 as the upper-middle class, the upper-middle class (class 2) is characterized by an index in the second quantile and includes a relatively privileged block likely similar to the rich class, defined by good living conditions (villa, apartment, high education, rate of occupation near the average).
On the other hand, the lower-middle class (class 3) is characterized by values in the third quantile of the composite index and includes a relatively vulnerable middle-class block likely similar to the poor class, defined by acceptable living conditions (Moroccan house, high unemployment rate, industries, and manufacturing industry workers).
The index thus constructed demonstrates the existence of a socioeconomic gradient in Casablanca City, along which we observe a progressive improvement of the level and quality of life between the fourth and first classes (p < 0.01).
At less than 5% significance level, the Moran’s index (Appendix B) shows that the gradient is markedly and spatially clustered (Moran’s index = 0.21, p-value = 0.05) in the cartographic representation (Figure 9). The richest blocks are located in the coastal zone of the study area. These are principal blocks with relatively low densities and villa or apartment typologies. In opposition, the poorest blocks are accentuated as we reach areas that are farthest from the coastal zones with a relatively high population and generally with Moroccan houses of high occupancy rates.
4.2. Middle Class Housing Typology
Once the areas with a high probability of the presence of middle class were identified, an analysis of the housing typology was conducted with the following results:
Dwelling type:
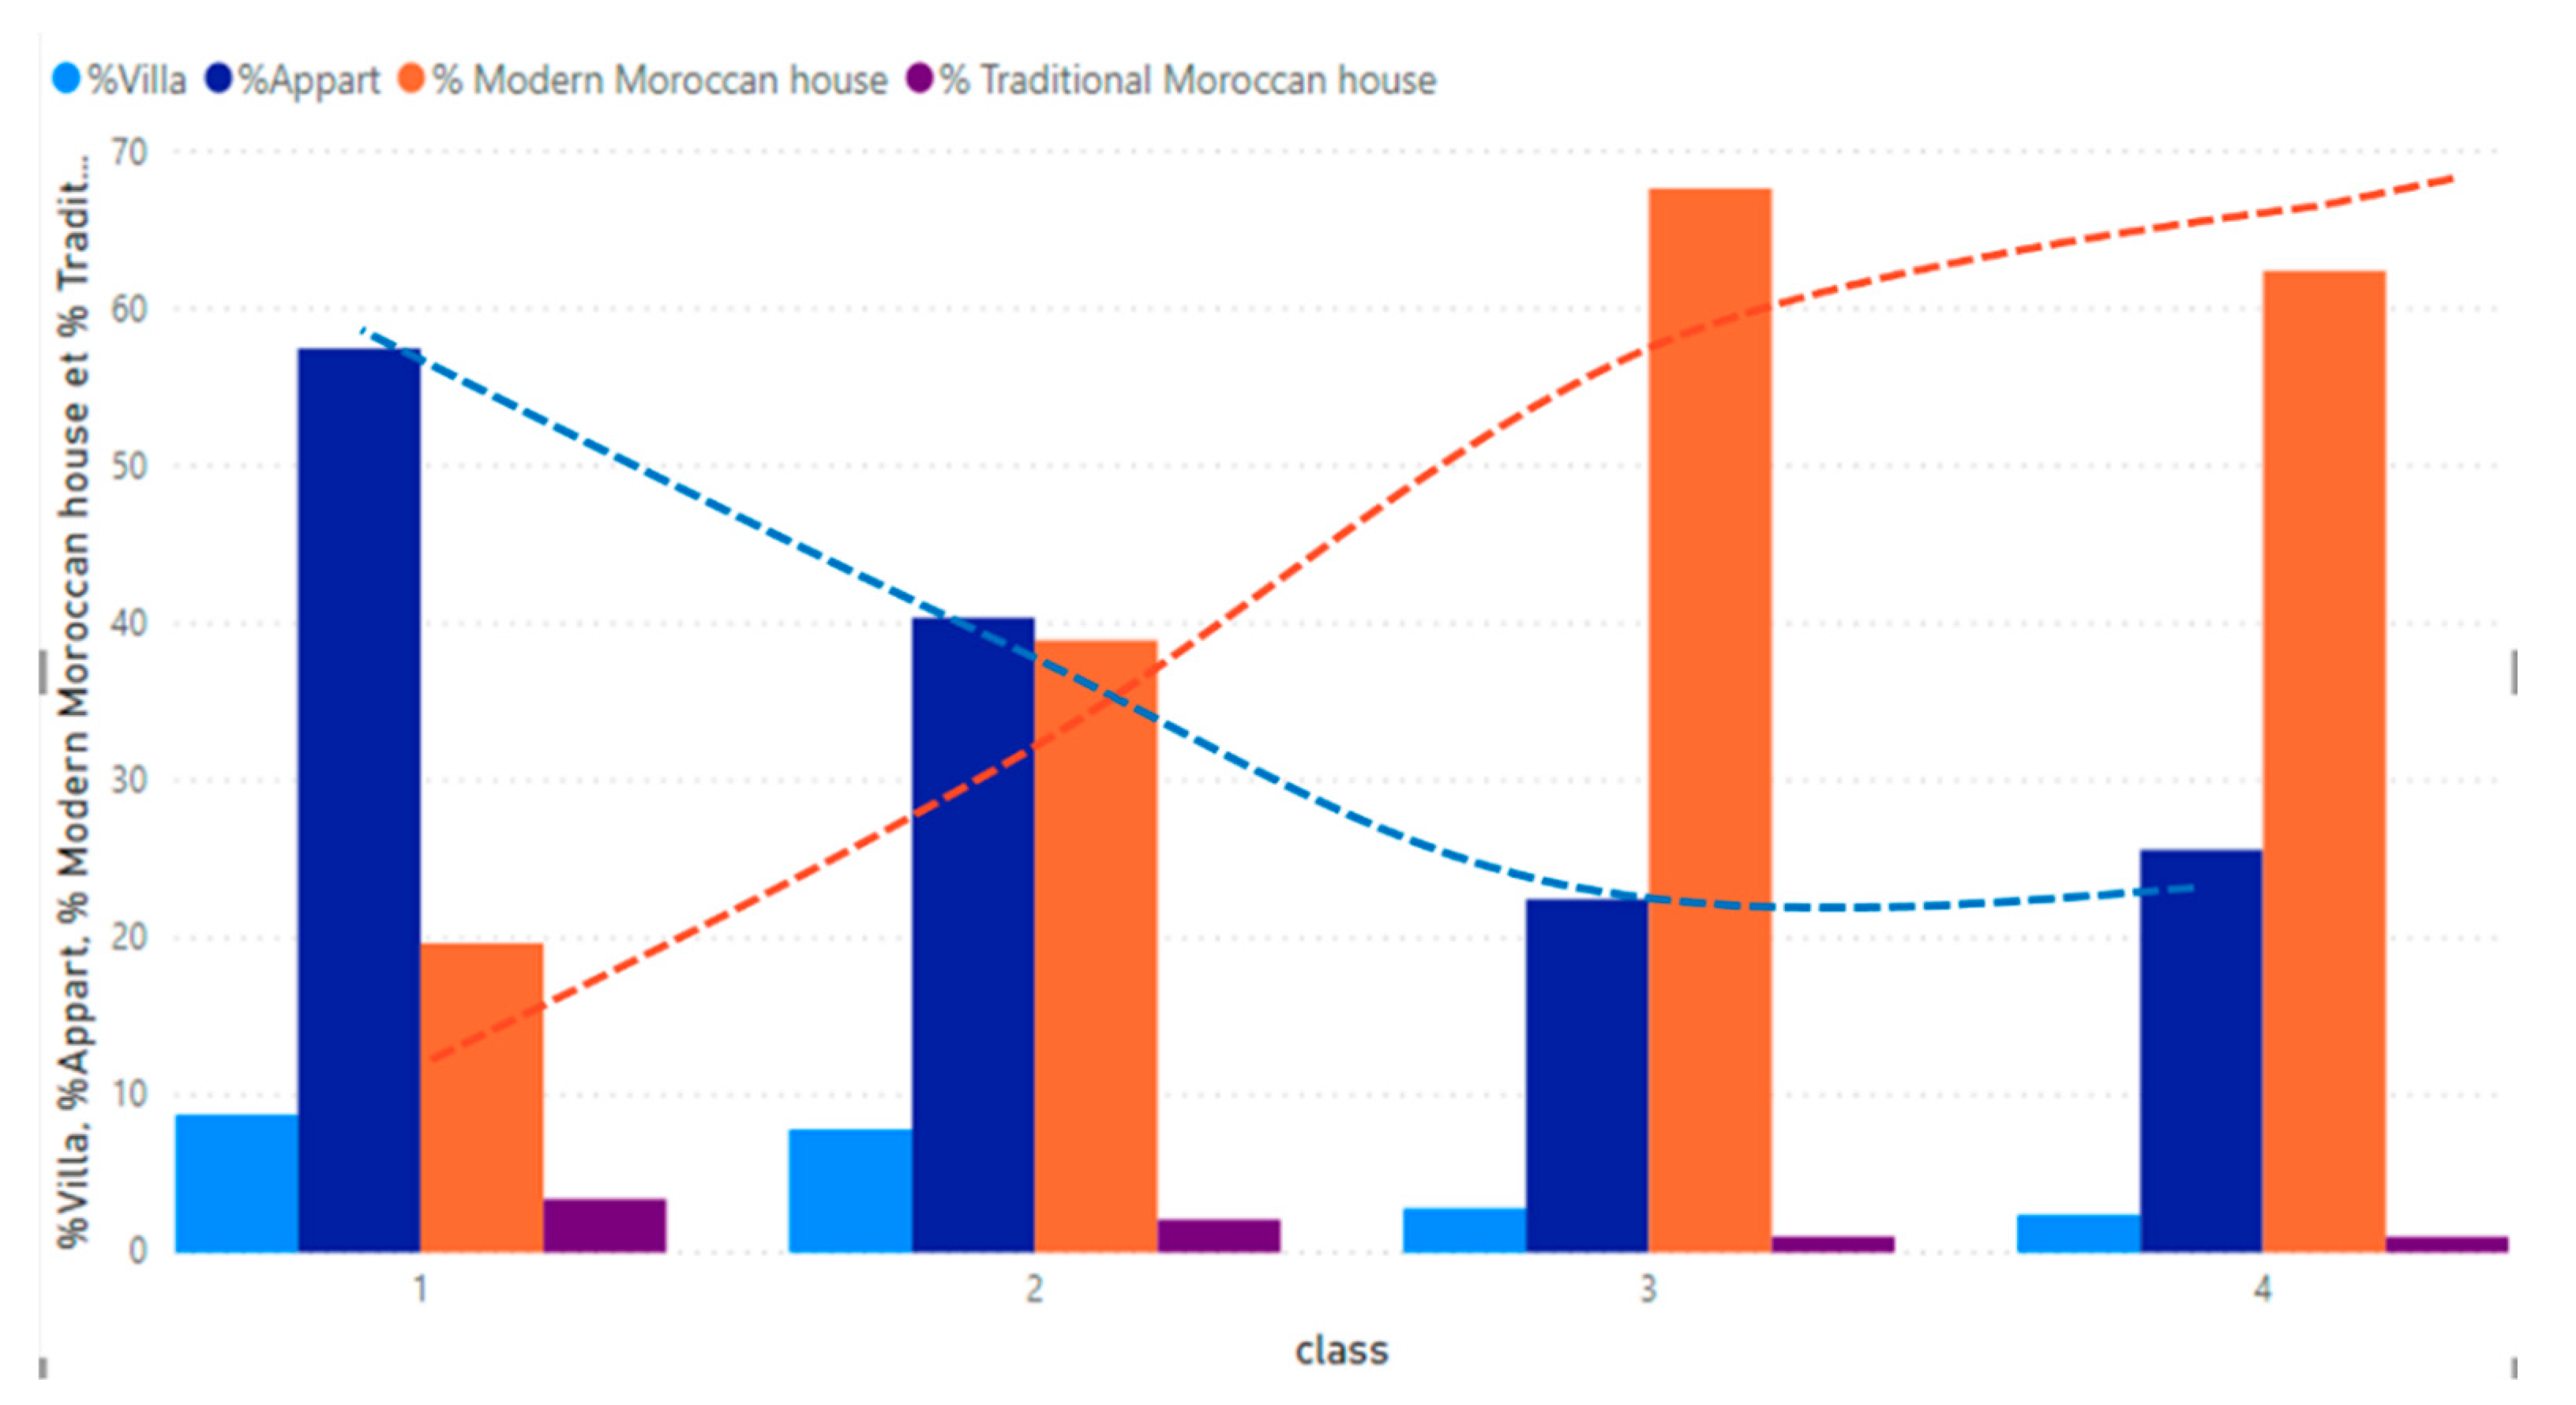
At less than 1% significance level, the chi−2 test shows that there is a statistically significant dependence between social class and type of housing (chi-squared = 60.496, df = 9, p-value = 1.076 × 10⁻⁹) (Figure 10). Indeed, the analysis on dwelling typology showed that households belonging to the middle classes, according to the multidimensional approach, reside mainly in Moroccan modern houses (a Moroccan modern house, commonly called (R+2), is a construction comprised of a commercial-use street-floor and two additional habitable levels where domestic life takes place) (69% for the lower-middle class and 38% for upper-middle class versus 19% for upper-class) or apartments in buildings (23% for the lower-middle class and 40% for upper-middle class versus 55% for upper-class).
Thus, as with the distribution of the overall housing stock, there is a high concentration of middle-class households in Moroccan modern houses and apartments.
It is also worth noting that as income increases and social mobility occurs (from the poor to the rich class), the apartment building (four floors or greater) and the villa (detached house) are increasingly preferred to the modern Moroccan house.
Housing size:
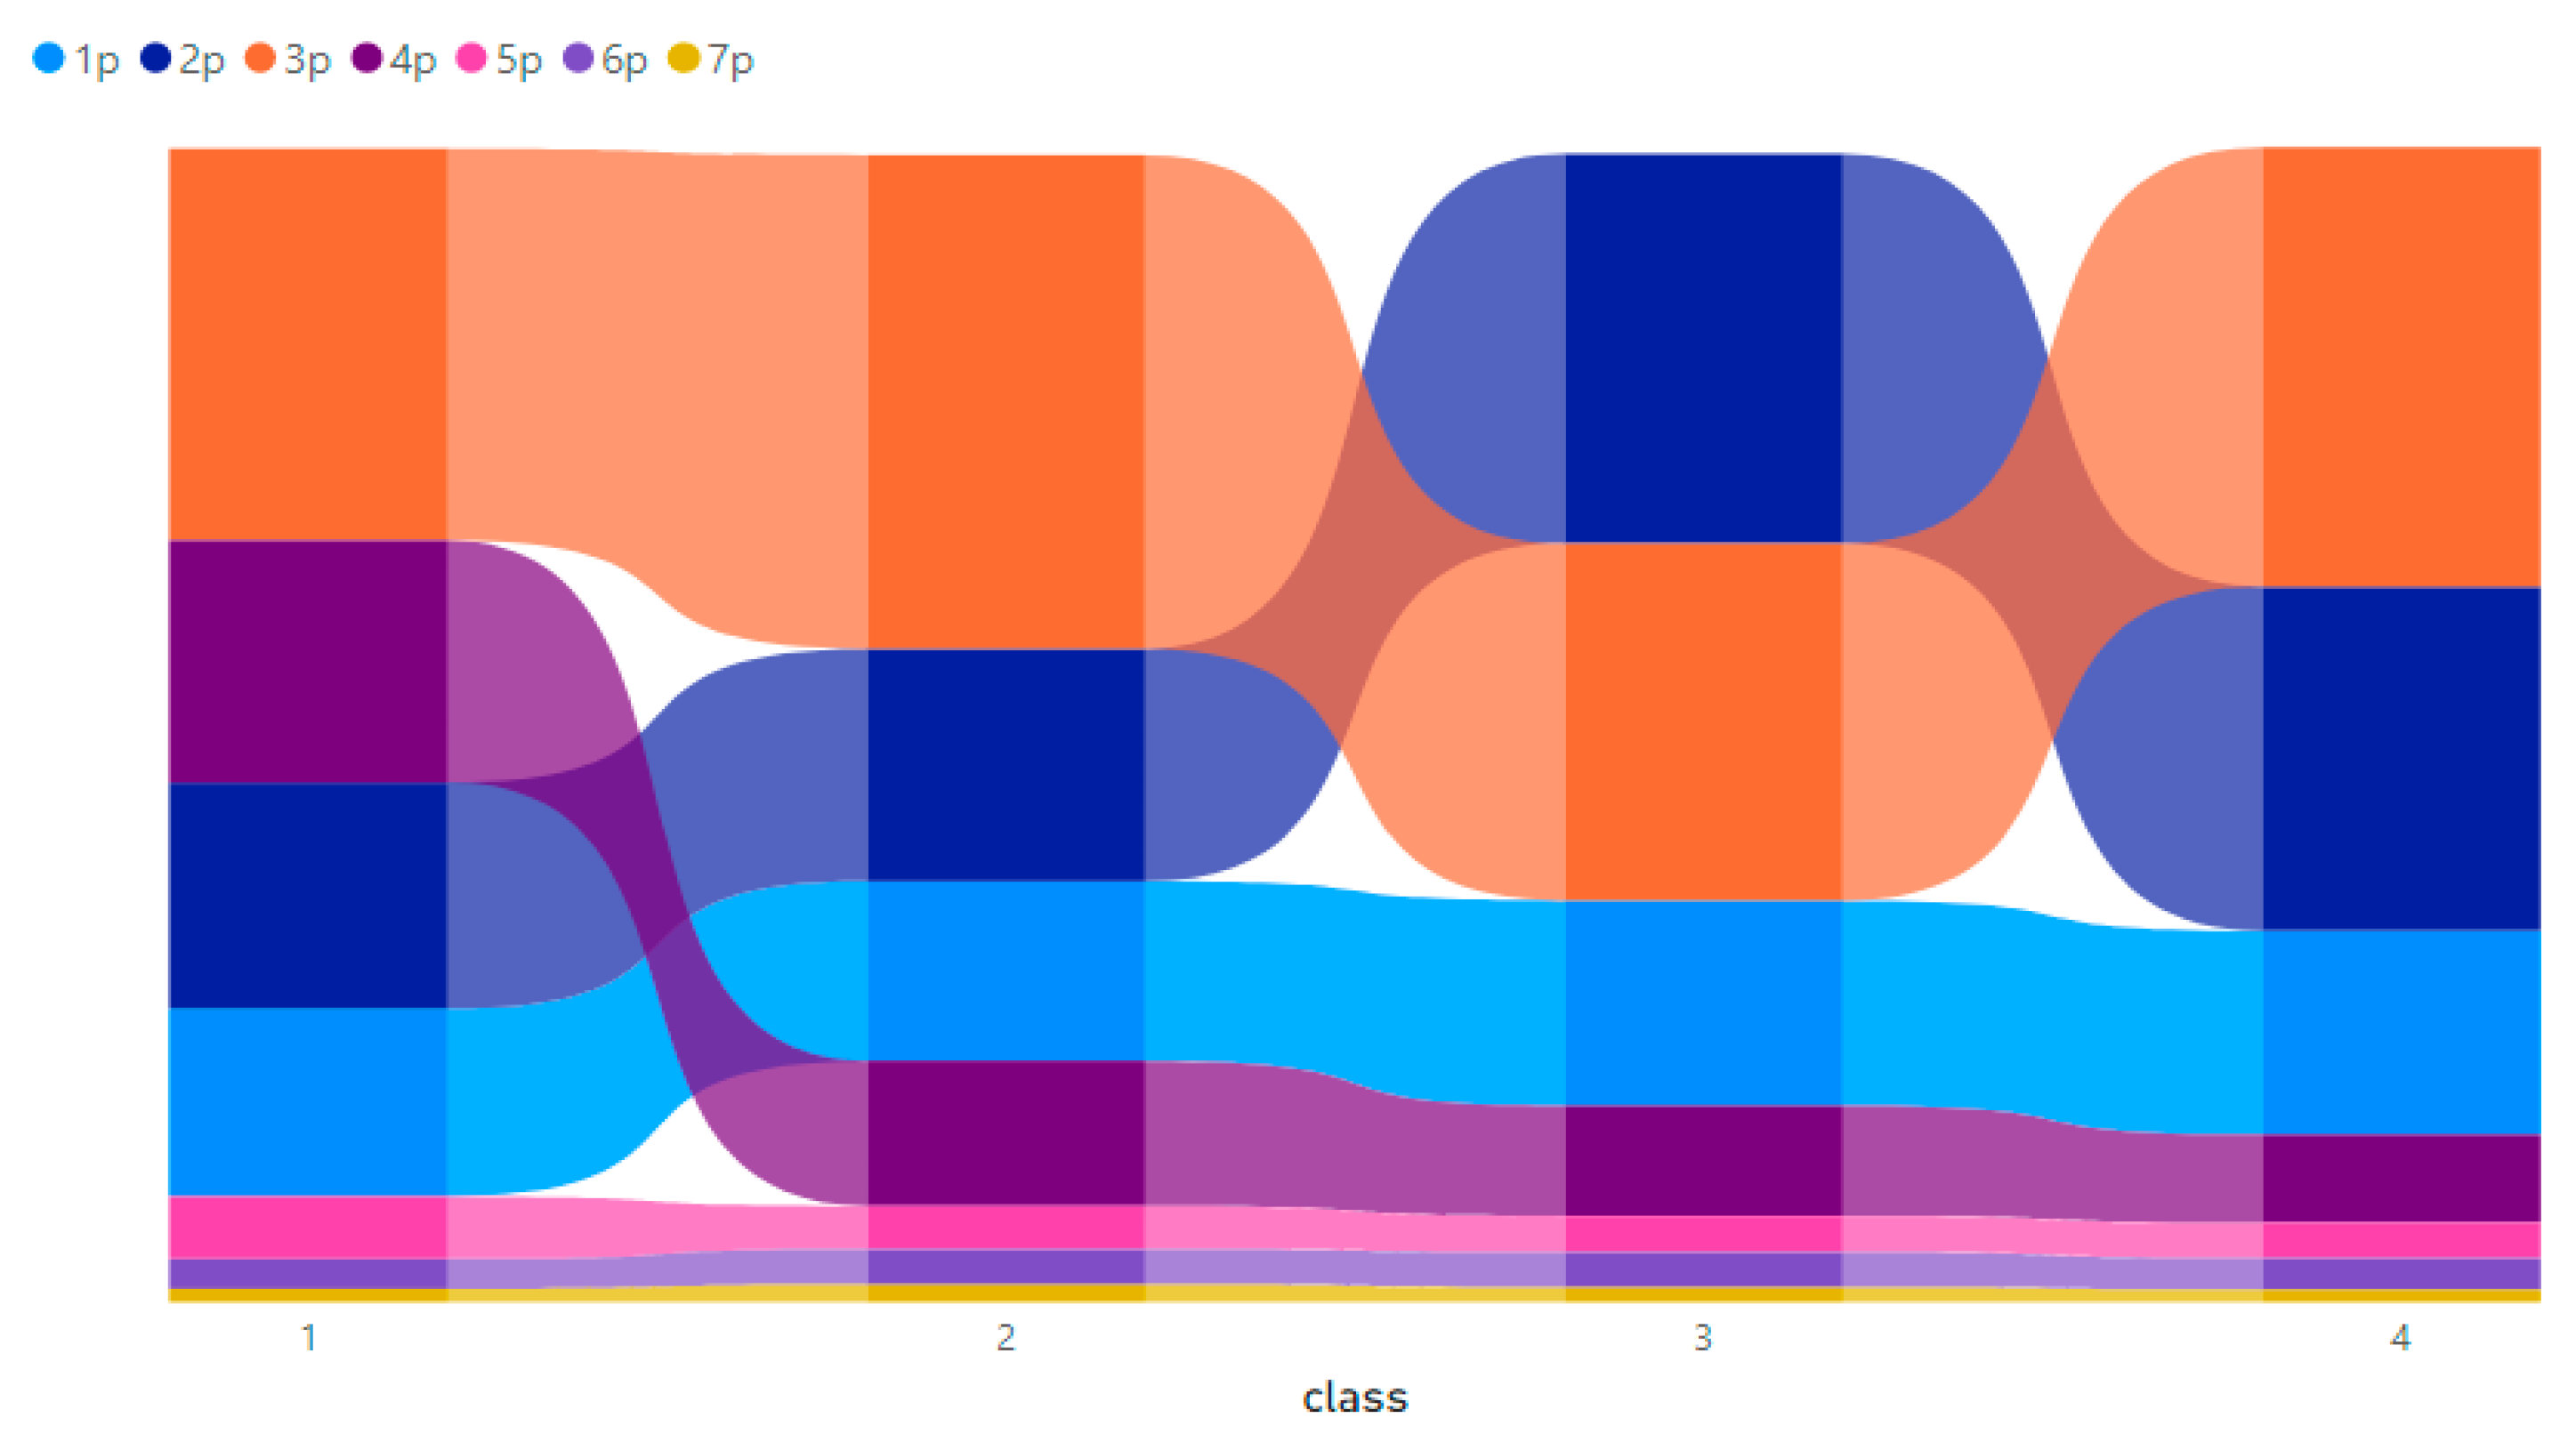
Following Pearson’s chi-squared test, the dependence between housing size and social class (Figure 11) is highly significant (chi-squared = 16.113, df = 9, p-value = 0.05). Indeed, housing stock occupied by middle-class households is mostly small to medium-sized, with 1 to 3 rooms and an average occupancy rate of 1.4. For the upper-middle class, 42% live in 3 room apartments, 20% in 2 room apartments, and 15% in only 1 room apartments. On the other hand, for the lower-middle class, we find that 33% of the dwellings with 2 rooms are occupied by this social category, followed by dwellings with 3 rooms (30%) and one room (17%).
For the upper-class, we find that this category generally occupies the larger dwellings (70% live in dwellings with 3 to 7 rooms), the occupancy rate (Figure 12) is the lowest among these categories (1.2 compared to 1.65 for the lower class).
Dwelling age:
The overall housing stock in Casablanca is relatively new as almost 68% of housing is less than 50 years old, according to 2014 statistics (37% between 20 and 50 years and 31% less than 20 years).
By decomposing this stock according to social classes (Figure 13), the distribution of housing occupied by the upper-middle class according to their age shows that 45% of the housing stock is less than 20 years old (thus exceeding the average for the entire stock) and 28% is between 20 and 50 years old.
On the other hand, data on the age of lower-middle-class housing show that only one out of 10 (11%) were built during the 2004–2014 intercensal period. About 50% of the dwellings are between 20 and less than 50 years old.
Occupancy status:
For the four social classes, we note that there is no statistically significant difference with the occupancy status (chi-squared = 4.3952, df = 3) at a p-value of 5%. Therefore, the occupancy status of the dwellings is almost similar for all social classes. Moreover, the proportion of dwellings owners from the middle class is 50% against 37% for renters (Figure 14).
Equipment, quality, and conditions of housing:
In 2014, the HCP has established a statistical index on the quality and conditions of housing and its equipment based on the degree of comfort and satisfaction of households (quality of flooring, liquid sanitation, and layout of sanitary facilities such as bath, shower, bathtub, kitchen, etc.).
The analysis of this index (Figure 15) reveals that at p-value = 0.03, the quality of the housing is statistically significant when it is compared to the social class (chi-squared = 8.48, df = 3, p-value = 0.03707). Indeed, the middle classes housing is well rated (4.4) compared to other classes, it is 23% lower than the upper-class (5.78) but remains at 37% much better than the lower class (2.74).
Housing value:
Housing value is a great indicator from an economic point of view [47]. A number of specific criteria can influence it, such as quality of transportation infrastructure, availability, and accessibility of public services [48,49,50]; location and characteristics of neighborhoods, and also the social class and income of residents [51,52].
Analyzing the housing price is of great importance to know the affordability of the middle class on a specific type of housing, for the case of Casablanca, by analyzing the map below (Figure 16 and Figure 17), we can conclude that there is a high correlation between social class and affordability. Indeed, the middle-class affordability for the apartment type is relatively high between MAD 8000 and 11,000. However, for the rich class, it is between MAD 11,000 and 32,000.
This result is of great importance and justifies in part the low supply of middle-class housing in Casablanca despite the fiscal stimulus of the middle-class housing program initiated by the Ministry of Housing in 2014. Indeed, the subsidized housing mechanism for the middle class (80 to 150 m2 at a maximum price of MAD 6000 per square meter) had not been as successful as had been hoped. Barely 9000 housing units have been agreed, 3300 started and 220 completed, which is far below the objectives.
The ratio between the tax incentives and the price ceiling required by the Ministry of Housing seems that it makes difficult the development of real-estate projects in the city of Casablanca given the very high value of land, specifically in the areas and localities preferred by the middle class.
Innovative solutions for housing that would match the financial capabilities of the middle class are highly required. A revision of the tax incentives (or of the required ceilings) and a territorialization of housing policies specifically targeting the middle class and taking into account the specificity of each region, could bring a new breath of life to the middle-class housing mechanism and program in Casablanca.
5. Conclusions
The growing urban middle class in Africa represents a potential catalyst for economic growth, human capital development, and poverty reduction. Helping the growth of this social class should be on the priority list of public policies. In Morocco, the urban middle class was considered, for a long time, as the great forgotten category in public housing policies. Although high-standard projects have multiplied over the last few years, and the social housing program fueled the market by a significant supply for the underprivileged social class, the middle class still cannot find what it needs due to the lack of suitable supply.
Designing urban and housing policies that can meet preferences and help to expand the middle class depends primarily on a deep understanding of this social class and its housing characteristics.
This paper presents, for the first time in an African context, a new data-driven approach to define multidimensionally the middle class, through the construction of a composite index based on a socio-economic growth direction. The proposed approach ensures a high probability of detection of the middle class belonging to the central region based on multidimensional socio-economic variables. The use of two PCA procedures has made it possible to ensure the selection of variables based on statistical criteria and avoid any subjectivity in the choice of variables.
Hence, the created index performs creditably in detecting the middle-class. It was defined as the first principal component of the PCA, which explained almost 70% of the total variance of the model. In contrast, the ability to draw residual structure from the second component was difficult (9%) and justifies the conclusion that all of the discriminating information useful for detecting middle class was in fact captured by the created index.
In terms of housing characteristics, the study shows with a highly statistically significance level (p-value = 0.05) that middle-class housing is characterized by an adequate condition (quality index is 3/5), suitable size (2–3 rooms), and affordability between 8000 to 11,000 MAD/m2. In addition, it shows that the apartments and Moroccan modern houses are the most occupied type of housing by the middle class. The study also showed that as income and social mobility increase, the apartment building and the villa are increasingly preferred by the middle class.
In light of the result of this study, we recommend the following:
- Take into account a multidimensional definition of the middle class to adopt better-targeted and adapted housing policy in African and Morocco cities.
- Promote the regionalization of housing policy targeting the middle class taking into account the land value in each region.
- Adopt appropriate approaches and programs for long-lasting housing units by paying attention to their appropriate quality and size.
- Study the opportunity to have a land bank, in the Casablanca region, to be mobilized for middle class real-estate projects in order to increase housing affordability. In this context, the smart-house concept can be a good opportunity for companies to meet the middle class preferences at an optimized cost.
Limitations and Future Research
The data used in this study are a less than ideal framework in terms of spatial representation and degree of update. While the study covers all districts of Casablanca and had 76 detailed variables by district, we recommend using more updated data in a fine spatial representation (at least by neighborhood). The population and household census in Morocco is expected to be updated by the end of 2024. Future research will benefit from the updated datasets that will help refine the definition of middle-class and then their housing characteristics. The study offers a multidimensional approach to measure middle-class in Casablanca, then the results of the study are only applied in Casablanca and cannot be generalized, but we recommend using the same multidimensional approach to adopt a specific definition of middle-class in another African city.
In addition, smart city planning presents a real potential to meet most of the middle class’s needs. The smart city is planned in a way to ensure that it is not only an economical option but also well-planned accommodation that can help to attract and expand the middle class. Future work should then highlight the potential role of the smart city and its interaction with the middle class.
Author Contributions
Conceptualization, H.M.A., H.R., J.C., H.Y. and S.B.; data curation, H.M.A.; formal analysis, H.M.A.; methodology, H.M.A. and H.R.; project administration, H.R.; software, H.M.A. and S.B.; supervision, H.R. and J.C.; validation, H.R., J.C., and H.Y.; writing—original draft, H.M.A.; writing—review and editing, H.R., H.Y. and J.C. All authors have read and agreed to the published version of the manuscript.
Funding
The work presented in this paper is funded by the Project “Sustainable, Resilient and Smart African Cities (SRSAC)”, conducted by Mohammed VI Polytechnic University (UM6P)-Morocco and École Polytechnique Fédérale de Lausanne (EPFL)-Swiss.
Institutional Review Board Statement
Not applicable.
Informed Consent Statement
Not applicable.
Data Availability Statement
Data are available in a publicly accessible repository. Data from the national population and household census 2014 were obtained from the High Commission of Plan (HCP) website (http://rgphentableaux.hcp.ma/, accessed on 10 October 2021). The housing price dataset was obtained using python webscaping from the National Agency for Land Conservation, Cadaster and Cartography (ANCFCC) website (https://ancfcc.gov.ma/ValeursVenalesPage/, accessed on 15 December 2021).
Conflicts of Interest
The authors declare no conflict of interest.
Appendix A. Selected Variables

Table A1.
Selected Variables.
| Variable Category | Variable Description | Code | |
|---|---|---|---|
| Socioéconomic attributs | Grand groupe de professions | Membres des corps législatifs, élus locaux, responsables hiérarchiques de la fonction publique, directeurs et cadres de direction d’entreprises, cadres supérieurs et membres des professions libérales | cadr_sup |
| Techniciens et professions intermédiaires | Tech | ||
| Employés | employ | ||
| Commerçants et intermédiaires commerciaux et financiers | com | ||
| Exploitants agricoles, pêcheurs de poissons et d’autres espèces aquatiques, forestiers, chasseurs et travailleurs assimilés | exploi_agri | ||
| Artisans et ouvriers qualifiés des métiers artisanaux (non compris les ouvriers de l’agriculture) | ouvri_qal | ||
| Ouvriers et manœuvres agricoles et de la pêche (y compris les ouvriers qualifiés) | ouvr_agri | ||
| Conducteurs d’installations et de machines et ouvriers de l’assemblage | ouv_ass | ||
| Manœuvres non agricoles, manutentionnaires et travailleurs des petits métiers | ouvr_nagri | ||
| Travailleurs ne pouvant être classés selon la profession | ouv_otr | ||
| Secteur d’activité | Agriculture, sylviculture et pêche | agri | |
| Industrie extractives et manufacturières | Indus | ||
| Eau et électricité | h2o | ||
| Construction | constru | ||
| Commerce, réparation d’automobiles et de motocycles | comm | ||
| Transport, entrepôt et communication | trans | ||
| Autres services marchands | otr_activ | ||
| Administration publique, éducation, santé et action sociale | fonct | ||
| Activités extraterritoriales et non déclarées | activ_extra | ||
| Niveau d’études | Taux de scolarisation des enfants âgés de 7 à 12 ans | scol7 | |
| Taux d’analphabétisme | analph | ||
| Néant | etud_n | ||
| Préscolaire | etud_0 | ||
| Primaire | etud_1 | ||
| Secondaire collégial | etud_2 | ||
| Secondaire qualifiant | etud_21 | ||
| Supérieur | etud_sup | ||
| Taux net d’activité | T_activ | ||
| Taux de chômage | T_chom | ||
| Situation dans la profession des actifs occupés et des chômeurs ayant déjà travaillé | Employeur | hier | |
| Indépendant | indep | ||
| Salarié dans le secteur public | sal_pub | ||
| Salarié dans le secteur privé | sal_priv | ||
| Aide familiale | aid_fam | ||
| Apprenti | app | ||
| Associé ou partenaire | associ | ||
| Autre | otr_fct | ||
| Housing attribut | Population et ménages | Ménage | mng |
| Taille moyenne | tail_mng | ||
| Type de logement | Villa/Étage de villa | villa | |
| Appartement | appart | ||
| Maison marocaine traditionnelle | maiso | ||
| Maison marocaine moderne | Maiso_mod | ||
| Bidonville/Habitat sommaire | hab_som | ||
| Logement rural | log_rur | ||
| Autre | otr_log | ||
| Prix du logement | Prix_m2_villa | Prix_villa | |
| Prix_m2_apprt | Prix_apprt | ||
| Prix_m2_maison | Prix_maison | ||
| Taux d’occupation | t_occ | ||
| Statut d’occupation | Propriétaire | propri | |
| Locataire | locat | ||
| Autre | otr_stat | ||
| Nbr de pièces par logement | 1 pièce | 1p | |
| 2 pièces | 2p | ||
| 3 pièces | 3p | ||
| 4 pièces | 4p | ||
| 5 pièces | 5p | ||
| 6 pièces | 6p | ||
| 7 pièces | 7p | ||
| 8 pièces et plus | 8p | ||
| Confort de logement/Équipements de base du logement | Qualité du logement | pov_log | |
| Cuisine | cuisine | ||
| W.-C. | Wc | ||
| Bain moderne/Douche | Bmod | ||
| Bain local | Blocal | ||
| Électricité | Elec | ||
| Eau courante | H2o | ||
| Ancienneté du logement | Moins de 10 ans | Moins10 | |
| Entre 10 et 19 ans | 10–19 | ||
| Entre 20 et 49 ans | 20–49 | ||
| 50 ans et plus | 50plus | ||
| Taux de pauvreté globale (en%), 2014 | pov_glob | ||
Appendix B. Moran’s Index
Figure A1.
Global Moran’s I Spatial autocorrelation results.

Table A2.
Moran’s Index.
| Moran’s Index: | 0.211021 |
| Expected Index: | −0.062500 |
| Variance: | 0.020970 |
| z-score: | 1.888824 |
| p-value: | 0.058915 |
References
- UN. Revision of World Urbanization Prospects; United Nations, Department of Economic and Social Affairs: New York, NY, USA, 2018. [Google Scholar]
- Dobbs, R.; Remes, J.; Manyika, J.; Roxburgh, C.; Smit, S.; Schaer, F. Urban World: Cities and the Rise of the Consuming Class; McKinsey Global Institute: Seoul, Korea, 2012. [Google Scholar]
- Ncube, M.; Leyeka Lufumpa, C.; Kayizzi-Mugerwa, S. The Middle of the Pyramid: Dynamics of the Middle Class in Africa; African Development Bank Group: Abidjan, Côte d’Ivoire, 2011; p. 24. [Google Scholar]
- Chimhanzi, J.; Gounden, A. The Rise and Rise of the African Middle Class. Deloitte Afr. Collect. 2013, 1, 1–5. [Google Scholar]
- CESE. Elargissement de la Classe Moyenne, Locomotive du Développement Durable et de la Stabilité Sociale; Conseil Economique Social et Environnemental-Maroc: Rabat, Morocco, 2021. [Google Scholar]
- OECD. Under Pressure: The Squeezed Middle Class; Edition OCDE; Organisation for Economic Cooperation and Development: Paris, France, 2019; ISBN 978-92-64-54283-9. [Google Scholar]
- Reeves, R.V.; Guyot, K.; Monday, E.K. Defining the Middle Class: Cash, Credentials, or Culture? Brookings: Washington, DC, USA, 2018; p. 24. [Google Scholar]
- Arbouch, M.; Dadush, U. Measuring the Middle Class in the World and in Morocco; Policy Center: Rabat, Morocco, 2019; p. 24. [Google Scholar]
- Edo, M.; Escudero, W.S.; Svarc, M. A Multidimensional Approach to Measuring the Middle Class. J. Econ. Inequal. 2021, 19, 139–162. [Google Scholar] [CrossRef]
- Gayo, M. Revisiting Middle-Class Politics: A Multidimensional Approach–Evidence from Spain. Sociol. Rev. 2013, 61, 814–837. [Google Scholar] [CrossRef]
- Davis, J.C.; Huston, J.H. The Shrinking Middle-Income Class: A Multivariate Analysis. East. Econ. J. 1992, 18, 277–285. [Google Scholar]
- MHPV. Synthèse: Enquete Du Logement Au Maroc; Ministere de l’Habitat et de la Politique de la Ville: Rabat, Morocco, 2012. [Google Scholar]
- Short, J.R.; Martínez, L. The Urban Effects of the Emerging Middle Class in the Global South. Geogr. Compass 2020, 14, e12484. [Google Scholar] [CrossRef]
- Janoschka, M.; Sequera, J. Gentrification in Latin America: Addressing the Politics and Geographies of Displacement. Urban Geogr. 2016, 37, 1175–1194. [Google Scholar] [CrossRef]
- Bernt, M. Loretta Lees, Hyun Bang Shin and Ernesto López-Morales 2015: Global Gentrifications: Uneven Development and Displacement. Bristol: Policy Press. Int. J. Urban Reg. Res. 2015, 39, 1284–1285. [Google Scholar] [CrossRef]
- Steel, G.; van Noorloos, F.; Klaufus, C. The Urban Land Debate in the Global South: New Avenues for Research. Geoforum 2017, 83, 133–141. [Google Scholar] [CrossRef] [Green Version]
- Pow, C.-P. Public Intervention, Private Aspiration: Gated Communities and the Condominisation of Housing Landscapes in Singapore. Asia Pac. Viewp. 2009, 50, 215–227. [Google Scholar] [CrossRef]
- Nijman, J. Mumbai’s Mysterious Middle Class. Int. J. Urban Reg. Res. 2006, 30, 758–775. [Google Scholar] [CrossRef]
- Loayza, N.; Rigolini, J.; Llorente, G. Do Middle Classes Bring about Institutional Reforms? Econ. Lett. 2012, 116, 440–444. [Google Scholar] [CrossRef]
- Kharas, H. The Emerging Middle Class in Developing Countries. OECD Dev. Cent. Work. Pap. 2010. [CrossRef]
- Van Stel, A.; Carree, M.; Thurik, R. The Effect of Entrepreneurial Activity on National Economic Growth. Small Bus. Econ. 2005, 24, 311–321. [Google Scholar] [CrossRef] [Green Version]
- OCDE. Sous Pression: La Classe Moyenne en Perte de Vitesse; OECD: Paris, France, 2019; ISBN 978-92-64-99556-7. [Google Scholar]
- Brueckner, M.; Dabla-Norris, E.; Gradstein, M.; Lederman, D. The Rise of the Middle Class and Economic Growth in ASEAN. J. Asian Econ. 2018, 56, 48–58. [Google Scholar] [CrossRef] [Green Version]
- Easterly, W. The Middle Class Consensus and Economic Development. J. Econ. Growth 2001, 6, 317–335. [Google Scholar] [CrossRef]
- Banerjee, A.V.; Duflo, E. What Is Middle Class about the Middle Classes around the World? J. Econ. Perspect. 2008, 22, 3–28. [Google Scholar] [CrossRef] [Green Version]
- Brown, D.S.; Hunter, W. Democracy and Human Capital Formation: Education Spending in Latin America, 1980 to 1997. Comp. Polit. Stud. 2004, 37, 842–864. [Google Scholar] [CrossRef]
- OECD. The Sources of Economic Growth in OECD Countries; Edition OCDE; Organisation for Economic Co-Operation and Development: Paris, France, 2003; ISBN 978-92-64-19945-3. [Google Scholar]
- Cavusgil, S.T.; Deligonul, S.; Kardes, I.; Cavusgil, E. Middle-Class Consumers in Emerging Markets: Conceptualization, Propositions, and Implications for International Marketers. J. Int. Mark. 2018, 26, 94–108. [Google Scholar] [CrossRef]
- Donmaz, A.; Sayil, E.; Havayolları, A.; Bölümü, B. The Growth & Importance of Middle Class Consumers in Emerging Markets; IBANESS Conference Series: Kırklareli, Turkey, 2017. [Google Scholar]
- Javalgi, R.G.; Grossman, D.A. Aspirations and Entrepreneurial Motivations of Middle-Class Consumers in Emerging Markets: The Case of India. Int. Bus. Rev. 2016, 25, 657–667. [Google Scholar] [CrossRef]
- Choon-Piew, P. Gated Communities in China, Reprint ed.; Routledge: London, UK, 2012; ISBN 978-0-415-53351-5. [Google Scholar]
- Borsdorf, A. Condominios Fechados and Barrios Privados: The Rise of Private Residential Neighbourhoods in Latin America; Routledge: London, UK, 2005; pp. 92–108. ISBN 978-0-415-34170-7. [Google Scholar]
- Delgadillo, V. Selective Modernization of Mexico City and Its Historic Center. Gentrification without Displacement? Urban Geogr. 2016, 37, 1154–1174. [Google Scholar] [CrossRef]
- Watson, V. African Urban Fantasies: Dreams or Nightmares? Environ. Urban. 2014, 26, 215–231. [Google Scholar] [CrossRef] [Green Version]
- Mercer, C. Boundary Work: Becoming Middle Class in Suburban Dar Es Salaam. Int. J. Urban Reg. Res. 2020, 44, 521–536. [Google Scholar] [CrossRef]
- Azza, A.M.B. Urban Planning and the Reconfiguration of Tuti Island; Nationalmuseet: Khartoum, Sudan, 2020; p. 19. [Google Scholar]
- Irvine, K.N.; Suwanarit, A.; Likitswat, F.; Srilertchaipanij, H.; Ingegno, M.; Kaewlai, P.; Boonkam, P.; Tontisirin, N.; Sahavacharin, A.; Wongwatcharapaiboon, J.; et al. Smart City Thailand: Visioning and Design to Enhance Sustainability, Resiliency, and Community Wellbeing. Urban Sci. 2022, 6, 7. [Google Scholar] [CrossRef]
- Aliero, M.S.; Asif, M.; Ghani, I.; Pasha, M.F.; Jeong, S.R. Systematic Review Analysis on Smart Building: Challenges and Opportunities. Sustainability 2022, 14, 3009. [Google Scholar] [CrossRef]
- Pressman, S. Defining and Measuring the Middle Class; American Institute for Economic Research: Great Barrington, MA, USA, 2015; p. 27. [Google Scholar]
- Ferreira, F.H.G.; Messina, J.; Rigolini, J.; López-Calva, L.-F. Maria Ana Lugo Economic Mobility and the Rise of the Latin American Middle Class|World Bank Latin American and Caribbean Studies. Available online: https://elibrary.worldbank.org/doi/abs/10.1596/978-0-8213-9634-6 (accessed on 4 August 2021).
- Chaudhuri, P. On a Geometric Notion of Quantiles for Multivariate Data. J. Am. Stat. Assoc. 1996, 91, 862–872. [Google Scholar] [CrossRef]
- PDR. Plan de Developpement Regional; PDR: Région Casablanca-Settat, Morocco, 2017; p. 51. [Google Scholar]
- Bounoua, L.; Fathi, N.; El Berkaoui, M.; El Ghazouani, L.; Messouli, M. Assessment of Sustainability Development in Urban Areas of Morocco. Urban Sci. 2020, 4, 18. [Google Scholar] [CrossRef] [Green Version]
- ANCFCC Référentiel Commun Des Prix Immobiliers de Casablanca, ANCFCC/DGI. Available online: https://ancfcc.gov.ma/ValeursVenalesPage/ (accessed on 15 December 2021).
- Krieger, N.; Williams, D.R.; Moss, N.E. Measuring Social Class in US Public Health Research: Concepts, Methodologies, and Guidelines. Annu. Rev. Public Health 1997, 18, 341–378. [Google Scholar] [CrossRef] [Green Version]
- Challier, B.; Jf, V. Pertinence et Validité d’un Nouvel Indice Composite Français Mesurant La Pauvreté Au Niveau Géographique. Rev. D’épidemiologie St. Publique 2001, 49, 41–50. [Google Scholar]
- Fan, Y.; Yang, Z.; Yavas, A. Understanding Real Estate Price Dynamics: The Case of Housing Prices in Five Major Cities of China. J. Hous. Econ. 2019, 43, 37–55. [Google Scholar] [CrossRef]
- Bagheri, B.; Shaykh-Baygloo, R. Spatial Analysis of Urban Smart Growth and Its Effects on Housing Price: The Case of Isfahan, Iran. Sustain. Cities Soc. 2021, 68, 102769. [Google Scholar] [CrossRef]
- Tian, G.; Wei, Y.D.; Li, H. Effects of Accessibility and Environmental Health Risk on Housing Prices: A Case of Salt Lake County, Utah. Appl. Geogr. 2017, 89, 12–21. [Google Scholar] [CrossRef]
- Wittowsky, D.; Hoekveld, J.; Welsch, J.; Steier, M. Residential Housing Prices: Impact of Housing Characteristics, Accessibility and Neighbouring Apartments–A Case Study of Dortmund, Germany. Urban Plan. Transp. Res. 2020, 8, 44–70. [Google Scholar] [CrossRef] [Green Version]
- Wen, H.; Xiao, Y.; Hui, E.C.M.; Zhang, L. Education Quality, Accessibility, and Housing Price: Does Spatial Heterogeneity Exist in Education Capitalization? Habitat Int. 2018, 78, 68–82. [Google Scholar] [CrossRef]
- Xiao, Y.; Hui, E.C.M.; Wen, H. Effects of Floor Level and Landscape Proximity on Housing Price: A Hedonic Analysis in Hangzhou, China. Habitat Int. 2019, 87, 11–26. [Google Scholar] [CrossRef]
Figure 1.
Middle-income thresholds in OECD countries and selected emerging economies. Note: Middle-classes and median incomes are defined relative to equivalised household disposable income. The middle-income class comprises individuals in households with incomes of between 75% and 200% of the median [6].

Figure 2.
Casablanca’s location.

Figure 3.
Flow chart of the used methodology.

Figure 4.
Correlation matrix.

Figure 5.
First PCA of variables.

Figure 6.
Second PCA.

Figure 7.
Scree plot.

Figure 8.
PCA graph of individuals.

Figure 9.
The main geographic location of the social class in Casablanca.

Figure 10.
Dwelling type by social class.

Figure 11.
Housing size (1p: one room, 7p: seven rooms).

Figure 12.
Rate of occupancy by household according to social class.

Figure 13.
Dwelling age by social class.


Figure 14.
Occupacy status by social class.

Figure 15.
Housing quality index.

Figure 16.
Apartment price in MAD/m2.

Figure 17.
Localization of middle class in Casablanca City.

Table 1.
Summary of the two first components.
| Variable | Coord 1 | Cos2 1 | Contribution 1 | Coond2 | Cos2 2 | Contribution 2 |
|---|---|---|---|---|---|---|
| Pop15 | −0.18 | 0.03 | 0.15 | −0.62 | 0.39 | 3.14 |
| cadr sup | 0.92 | 0.85 | 3.3 | −0.17 | 0.03 | 0.23 |
| Tech | 0.65 | 0.42 | 1.83 | −0.24 | 0.06 | 0.42 |
| employ | 0.33 | 0.3 | 1.32 | 0.49 | 0.24 | 1.95 |
| com | −0.69 | 0.47 | 2.00 | 0.65 | 0.42 | 2.40 |
| exploi_agri | 0.46 | 0.21 | 0.92 | 0.57 | 0.33 | 2.62 |
| ouvri_qa1 | −0.96 | 0.92 | 4.04 | −0.14 | 0.02 | 0.12 |
| ouvr_agri | 0.1 | 0.01 | 0.04 | −0.42 | 0.17 | 1.42 |
| ouv_ass | −0.77 | 0.59 | 2.55 | 0.29 | 0.08 | 0.68 |
| ouvr_nagri | −0.28 | 0.14 | 0.62 | 0.22 | 0.03 | 0.44 |
| ouv_otr | 0.82 | 0.67 | 2.92 | 0.03 | 0 | 0.01 |
| agri | 0.64 | 0.4 | 2.77 | 0.15 | 0.02 | 0.10 |
| Indus | −0.75 | 0.57 | 2.49 | −0.32 | 0.1 | 0.84 |
| h2o | 0.02 | 0 | 0 | −0.8 | 0.65 | 5.27 |
| constru | −0.68 | 0.46 | 2.03 | −0.5 | 0.25 | 2.06 |
| comm | −0.41 | 0.17 | 0.74 | 0.81 | 0.66 | 5.4 |
| trans | 0.07 | 0 | 0.02 | −0.33 | 0.11 | 0.89 |
| otr_activ | 0.76 | 0.58 | 2.54 | 0.06 | 0 | 0.03 |
| fonct | 0.76 | 0.57 | 2.52 | 0.24 | 0.12 | 0.94 |
| activ_extra | 0.8 | 0.64 | 2.8 | −0.21 | 0.1 | 0.78 |
| age_mar | 0.21 | 0.1 | 0.43 | 0.76 | 0.58 | 4.73 |
| scol7 | 0.83 | 0.69 | 3.01 | 0.07 | 0 | 0.04 |
| analph | −0.97 | 0.93 | 4.09 | 0.08 | 0.01 | 0.05 |
| etud_n | −0.99 | 0.97 | 4.26 | −0.1 | 0.01 | 0.08 |
| etud_0 | 0.34 | 0.12 | 0.31 | −0.6 | 0.36 | 2.91 |
| etud_1 | −0.97 | 0.93 | 4.09 | −0.11 | 0.01 | 0.1 |
| etud_2 | −0.8 | 0.64 | 2.8 | 0.07 | 0 | 0.04 |
| etud_21 | 0.6 | 0.36 | 1.39 | 0.55 | 0.2 | 2.42 |
| etud_sup | 0.94 | 0.89 | 3.9 | −0.09 | 0.01 | 0.06 |
| T_activ | 0.62 | 0.4 | 1.76 | −0.22 | 0.1 | 0.02 |
| T_chom | −0.69 | 0.47 | 2.06 | 0.14 | 0.02 | 0.15 |
| hier | 0.76 | 0.57 | 2.5 | −0.21 | 0.09 | 0.77 |
| indep | −0.91 | 0.82 | 3.59 | 0.2 | 0.04 | 0.32 |
| sal_pub | 0.61 | 0.37 | 1.63 | 0.27 | 0.07 | 0.6 |
| sal_priv | 0.44 | 0.19 | 0.02 | −0.32 | 0.27 | 2.22 |
| aid_fam | 0.32 | 0.1 | 0.44 | 0.77 | 0.59 | 4.78 |
| app | −0.49 | 0.24 | 1.07 | 0.65 | 0.42 | 2.29 |
| associ | 0.02 | 0 | 0 | 0.84 | 0.7 | 5.73 |
| otr_fct | −0.16 | 0.02 | 0.11 | 0.20 | 0.08 | 0.66 |
| mng | −0.19 | 0.04 | 0.16 | −0.62 | 0.4 | 2.22 |
| Tail_mng | −0.82 | 0.69 | 3.03 | 0 | 0 | 0 |
| villa | 0.66 | 0.42 | 1.9 | 0.2 | 0.09 | 0.75 |
| appart | 0.61 | 0.38 | 1.65 | −0.59 | 0.24 | 2.79 |
| maiso | −0.7 | 0.49 | 2.16 | 0.55 | 0.3 | 2.45 |
| hab_som | 0.16 | 0.02 | 0.11 | −0.62 | 0.39 | 3.15 |
| log_rur | 0.23 | 0.12 | 0.32 | −0.2 | 0.09 | 0.75 |
| otr_log | 0.6 | 0.36 | 1.58 | 0.25 | 0.06 | 0.52 |
| T_occ | −0.92 | 0.87 | 3.82 | −0.02 | 0 | 0 |
| Propri | −0.24 | 0.06 | 0.24 | −0.78 | 0.61 | 4.95 |
| local | 1 | 0.01 | 0.04 | 0.82 | 0.68 | 5.52 |
| otr_stat | 0.51 | 0.26 | 1.12 | −0.47 | 0.22 | 1.79 |
| pov_14 | −0.78 | 0.61 | 2.67 | 0.44 | 0.19 | 1.55 |
| pov_educ | −0.6 | 0.36 | 1.59 | −0.60 | 0.46 | 2.76 |
| pov_healt | 0.21 | 0.1 | 0.42 | 0.3 | 0.25 | 2.06 |
| pov_serv | 0.27 | 0.14 | 0.6 | −0.08 | 0.01 | 0.06 |
| pov_log | 0.42 | 0.19 | 0.81 | 0.82 | 0.67 | 5.48 |
| pov_glob | −0.93 | 1.22 | 3.75 | 0.17 | 0.02 | 0.24 |
| In red: Variables selected in the second step | ||||||
Table 2.
Eigenvalues of the 4 first components.
| Eigenvalue | Percentage of Variance | Cumulative Percentage of Variance | |
|---|---|---|---|
| comp 1 | 18.71 | 66.81 | 66.81 |
| comp 2 | 2.67 | 9.53 | 76.34 |
| comp 3 | 2.13 | 7.6 | 83.94 |
| comp 4 | 1.4 | 4.99 | 88.93 |
Table 3.
Composite index by geographic unit and by social class.
| id | Arrondissement/Communes | Composite Index (CI) | Standardized CI | CI Class | Social Class |
|---|---|---|---|---|---|
| 1 | Anfa(Arrond,) | −6.75 | −1.51 | 1 | Rich |
| 17 | MechouardeCasablanca(Mun,) | −3.62 | −0.81 | 1 | |
| 2 | El Maarif(Arrond,) | −9.2 | −2.06 | 1 | |
| 3 | Sidi Belyout(Arrond,) | −1.89 | −0.42 | 1 | |
| 7 | AssoukhourAssawda(Arrond,) | −6.19 | −1.39 | 1 | |
| Avg | −5.53 | −1.24 | 1 | ||
| 10 | Ain-Chock(Arrond,) | −1.42 | −0.32 | 2 | Upper-middle class |
| 5 | Mers-Sultan(Arrond,) | 0.84 | 0.19 | 2 | |
| 6 | Ain-Sebaa(Arrond,) | −1.32 | −0.3 | 2 | |
| 9 | Hay-Hassani(Arrond,) | −0.59 | −0.13 | 2 | |
| Avg | −0.62 | −0.14 | 2 | ||
| 11 | Sidi Bernoussi(Arrond,) | 1.77 | 0.4 | 3 | Lower-Middle class |
| 14 | Sbata(Arrond,) | 3.05 | 0.68 | 3 | |
| 4 | Al-Fida(Arrond,) | 2.82 | 0.63 | 3 | |
| 8 | Hay Mohammadi(Arrond,) | 3.28 | 0.74 | 3 | |
| Avg | 2.73 | 0.61 | 3 | ||
| 12 | Sidi Moumen(Arrond,) | 3.3 | 0.74 | 4 | Lower class/poor |
| 13 | Ben M’Sick(Arrond,) | 4.71 | 1.06 | 4 | |
| 15 | Moulay Rachid(Arrond,) | 4.9 | 1.1 | 4 | |
| 16 | Sidi Othmane(Arrond,) | 6.31 | 1.42 | 4 | |
| Avg | 4.81 | 1.08 | 4 |
Publisher’s Note: MDPI stays neutral with regard to jurisdictional claims in published maps and institutional affiliations. |
© 2022 by the authors. Licensee MDPI, Basel, Switzerland. This article is an open access article distributed under the terms and conditions of the Creative Commons Attribution (CC BY) license (https://creativecommons.org/licenses/by/4.0/).
Share and Cite
MDPI and ACS Style
Mharzi Alaoui, H.; Radoine, H.; Chenal, J.; Yakubu, H.; Bajja, S. Understanding the Urban Middle-Class and Its Housing Characteristics—Case Study of Casablanca, Morocco. Urban Sci. 2022, 6, 32. https://doi.org/10.3390/urbansci6020032
AMA Style
Mharzi Alaoui H, Radoine H, Chenal J, Yakubu H, Bajja S. Understanding the Urban Middle-Class and Its Housing Characteristics—Case Study of Casablanca, Morocco. Urban Science. 2022; 6(2):32. https://doi.org/10.3390/urbansci6020032
Chicago/Turabian StyleMharzi Alaoui, Hicham, Hassan Radoine, Jérôme Chenal, Hassan Yakubu, and Salwa Bajja. 2022. "Understanding the Urban Middle-Class and Its Housing Characteristics—Case Study of Casablanca, Morocco" Urban Science 6, no. 2: 32. https://doi.org/10.3390/urbansci6020032