
Testing the Informal Development Stages Framework Globally: Exploring Self-Build Densification and Growth in Informal Settlements


Program in Environmental Design, University of Colorado Boulder, Boulder, CO 80309, USA
*
Author to whom correspondence should be addressed.
Urban Sci. 2023, 7(2), 50; https://doi.org/10.3390/urbansci7020050
Submission received: 18 March 2023
/
Revised: 7 April 2023
/
Accepted: 26 April 2023
/
Published: 9 May 2023
(This article belongs to the Special Issue Deprived Area (Slum) Mapping)
Abstract
:This article challenges the narrow definition of informal settlements as solely lacking a formal framework, which overlooks the dynamic city-making and urban design processes within these areas. Communities’ self-building processes and areas’ constant growth are indeed informal settlements’ most salient morphological features. The study builds upon the informal development stages (IDS) framework and explores how it applies globally. The research follows a sample of fifty informal settlements with a high change coefficient from the Atlas of Informality (AoI) across five world regions to explore how change and urban densification across IDS can be mapped in such areas using human visual interpretation of Earth observation (EO). The research finds evidence of IDS framework fitment across regions, with critical morphological differences. Additionally, the study finds that settlements can pass through all IDS phases faster than anticipated. The study identifies IDS as a guiding principle for urban design, presenting opportunities for policy and action. The study suggests that integrating IDS with predictive morphological tools can create valuable data to refine identification models further. Finally, the article concludes that an IDS approach can anticipate development and integrate into an urban design evolutionary process that adapts to the deprived areas’ current and future needs.
1. Introduction
Informal settlements are among the planet’s most common forms of urbanization, accounting for one-third of the total urban form. By the mid-twenty-first century, up to three billion people are expected to live in informal urban environments [1]. However, we lack a consistent mapping method to pinpoint where that informality is located or how it expands [2]. Despite a reported decrease in the relative proportion of the population living in informal settlements, “the absolute number of urban residents who live in slums continued to grow” [3,4]. The current scale of poverty on the planet has overwhelmed the capacity of the formal market to incorporate the masses of impoverished settlers arriving at urban centers worldwide. Some view the acceleration of this urban phenomenon as a sign of apocalyptic ruin, exemplified by the work of Mike Davis in “Planet of Slums” [5]. In contrast, others perceive them as spaces of opportunity, as suggested by Stewart Brand in “How Slums Can Save the Planet” [6].
Solutions to world urban poverty require global structural changes, which is one reason why there is little innovation in urban poverty. Our limited understanding of the distinctive features of this prevalent form of urbanization arises from a disciplinary perspective and is attributable to three main factors. Firstly, the difficulty in arriving at a comprehensive definition of an informal settlement [7,8]. Secondly, the absence of data pertaining to this type of urban development, starting with even the most fundamental cartography [9,10]. The third factor, attached to the lack of accurate mapping, is understanding variations within this urban phenomenon over time [2].
Informal settlements’ most significant urban design feature is their constant state of change. Research in mapping and urban change challenges assumptions of informal as unplanned or chaotic and argues that these areas change, densify, and evolve in predictable ways [11,12]. This framework of change opens the opportunity to forecast informal areas. It presents the opportunity to classify these areas in stages of unique characteristics that fit multiple definitions of an informal settlement. Defining informality as an ever-evolving urban form presents a new urban design paradigm. It forces the creation of new intervention strategies more adequate to developing urban design projects and policies tailored to the peculiarity of these urban forms and the needs of the world’s poor. In response to this perspective that focuses on the morphological change of informal settlements, the informal development stages (IDS) framework has emerged as a method for classifying the change process in informal settlements into predictable successive stages of urban densification [13]. However, while several authors across Latin America’s informal settlements support a staged framework [14,15,16], the IDS is still untested globally. This research project tests such a framework by examining fifty cases across five world regions and asking two critical questions: is there evidence that the densification process happens similarly across other countries and regions, and what differences can be identified among the sample. Answering such questions can help create a world classification of informal areas in relation to their urban density and time and help develop better models for estimating the future growth of populations in these areas.
This paper is divided into four sections; the first one looks at the issues of the definition of informality and presents a revised identifying framework not focused on the missing features concerning formality but on the three overarching unique identifiers: morphology, regulatory framework, and poverty. The second section explains some of the limiting features of measuring informality globally, while the third section explores the concepts of IDS, and the methodology section describes the measuring process and the data sources and results, followed by findings on the application of IDS to the cases. The final two sections present the implications of an IDS framework for research, urban design, and policy and end with the research conclusions and limitations and the potential applicability of the results.
2. Informal Settlements’ Morphological Features
Among the obstacles to understanding deprived areas is the epistemological complexity of defining what constitutes an informal settlement [14]. The literature on informal settlements, both current and historic, spends a significant amount of time attempting to determine the limits between formal and informal [15,16,17,18,19]. In addition, informal settlements in the literature are traditionally presented as the other side of the coin from the formal [20]. In this tension between the formal and the informal, settlements can be established as places lacking access to such faculties of a formal city as access to safe water, access to improved sanitation, durable structures, sufficient living area (overcrowding), and access to secure tenure [21].
Until today, scholars and agencies have not developed a universal definition of either slums or informal settlements. However, UN-Habitat provides a widely accepted working definition for the SDG 11.1.1 indicator (Table 1), a framework of household deprivations along five dimensions: insecure residential status, poor structural quality of housing, insufficient living area, inadequate access to safe water, and inadequate access to sanitation infrastructure [22]. Informal settlements concern less the physical environment than the legal nature, as such settlements are often built-in disrespect of land-use and building regulations and irregular land titles [23].
Authors call attention to the need for more specificity in how informal settlements are defined and classified [24]. International agencies find it challenging to assess the indicators of informal settlements as currently defined and examples of such problems can be found in the Sustainable Development Goals [3,25]. No consistency of evaluative variables exists between different countries or cities [26]. The UN-Habitat, the United Nations Statistics Division, and the Cities Alliance agree on an operational definition for slums to be used for measuring the indicator of MDG 7 Target 7.D. The agreed definition classified a “slum household” as one in which the inhabitants suffer one or more of the following “household deprivations”: 1. Lack of access to improved water sources; 2. Lack of access to improved sanitation facilities; 3. Lack of sufficient living area; 4. Lack of housing durability; and 5. Lack of security of tenure. However, characterization is still an elusive subject because the definition of informal settlements can have social, economic, or political implications. Each definition of informal settlements has its limitation.
The traditional definition that compares informal vs. formal is beneficial for developing the service provision policy, projects, and evaluation. However, its focus on looking at these areas as places lacking formality tells us little about their unique identifiers that do not relate to formality. The lacking framework of international agencies shifts our gaze from what informal settlements are by only looking at what informal settlements households should aspire to. In other words, if we define a square form as what it does not have in comparison to a circle, we miss some of its unique values. Here, I offer a new framework based on three categories: informal settlements are self-built neighborhoods outside city regulations in extreme poverty conditions. Below, I present more detail on the virtues of using just these three categories.
- Self-built neighborhoods: Informal areas are a communal effort in which members participate in the foundation and evolution of urban development processes in which self-construction is a salient feature. This process creates a particular urban pattern distinct from formal (planned) urban forms; it looks physically different and confirms the physical separability of slums from formal settlements [27,28]. No other urban structure is consistently built by its users and constantly changed.
- Outside of city regulations: This issue highlights the legal instability resulting from occupying the land violating the city code. However, even when these conflicts over land tenure are resolved, this legacy has long-lasting repercussions for the inhabitants. Therefore, naming a territory as informal (any name associated with it) acknowledges it as a space where state rules and regulatory framework are challenged.
- In conditions of poverty: Informal settlements have socioeconomic diversity. However, not all residents have the same income or are “equally poor”. While informal dwellers have differences in economic capacity, they live in extreme poverty in relationship to the rest of the city.
The definition of informal settlements based on these criteria is not yet complete. Therefore, more data must be collected to create a precise definition applicable across different scales and regions.
2.1. Creating Data about Informal Settlements
The total number of global informal dwellers continues to grow [3,29]. However, this macrolevel analysis seems to hide within the accurate definition and measure of “slum” the actual percentage of change of such spaces. Existing data about informal settlements are not available, accurate, or complete and are in most cases obsolete [30]. Imprecise data about the scale of informal settlements hinder agencies, city officials, and scholars’ efforts to inform appropriate policies about the phenomena of informality. The question then is, what is the best way to solve this information vacuum? To fill those voids, urban planners, geographers, and other researchers have been exploring two core features that emerge when seeking to understand the informal settlements’ physical form and urban growth: precise mapping and creating predictive growth models.
The mapping of informal settlements can be divided into five methodologies: community mapping, single case selection, national indexes, remote sensing, and urban morphologies. Each one of these methods has its virtues and challenges:
- Community mapping is born out of the vacuum of information and the need for communities to create data to make the needs of their neighborhoods visible due to state inaction [10,11,31,32]. This self-mapping produces a precise level of detail of living conditions. Along with the mapping data, the community benefits from the empowerment that emanates from community self-identification. The generalization of community mapping is limited since most maps reflect local needs.
- Single case selection is the mappings by scholars, NGOs, and municipalities that focus on the neighborhood or city as a case [33,34,35]. Here, the output is more detailed, as new aerial photography and remote sensing data make possible highly detailed maps of neighborhoods. Unique case mapping allows bypassing state regulations since non-state agencies can perform them. Single case mapping offers challenges to the generalization of data.
- On the other hand, national indexes lend themselves to generalization; these mappings draw on the capacity of nations to collect demographic data based on variables of census tracts that then get compared at the global scale. International agencies such as the World Bank or the United Nations use this data type [5,36,37]. However, the broad nature of national indexes is characterized by low resolution at the urban scale.
- Remote sensing (RS) technologies bridge the gap between comparability and the level of detail necessary to create global analyses [27,30]. Using high-resolution satellite data permits researchers to visit multiple sites and apply variables to analyze the qualities of urban form [38,39,40,41]. The use of algorithms applied to these data, such as object-oriented, radial casting, and contour model (snakes), permits the extraction and recognition of the unique features of an urban form and landscape [30,39,40,41,42,43]. Remote sensing imagery is crucial to collecting, locating, identifying, and mapping informal settlements [10,44]. However, despite this promise, there is still no global mapping of informal settlements or a systematic inventory of their morphologic types across the globe [45].
- Finally, urban morphology (UM) of informal settlements, shares unique characteristic patterns across settlements: scale, size, shape, and distribution [14]. Texture measures contrast planned and unplanned settlements [46]. Analyzing the urban environment’s physical features, such as green space, the layout structure, the density of built-up areas, and the size of buildings, can help identify heterogeneity in urban areas that allows the determination of informal settlements [47]. The self-building process in which informal settlements are created tends to follow particular morphological processes [35], which can be analyzed using methods such as space syntax [48]. Interest in the physical structure of informal settlements has grown alongside a developing body of knowledge on their morphologies and how they take shape over time (morphogenesis) [14,49,50,51,52,53].
The variation over time in the extent of informal areas presents challenges for planning and city management [54]. As a response, an emerging body of work focuses on exploring the change in the morphology of informal settlements [35,51,55]. Concentrating on areas instead of population percentage estimations can provide a more empirical approach to understanding the changing rates of informal settlements globally. The morphological approach can also help in developing guidelines for urban policy and adaptive capacity [2]. Since no method is perfect, a practical approach comes from merging multiple methods to build in their qualities and reduce the shortcomings and biases that each process introduces [56].
2.2. Understanding Change in Informal Settlements
A staple theme in the literature on urban informality is the territories’ constant state of construction [57,58,59,60,61,62]. Improvement and growth become essential defining characteristics of what makes an informal settlement different from other city forms. Change happens across various dimensions: population size and features, housing quantity, quality, and infrastructure. Planners and scholars use the fact that dwellings in these areas are in a constant state of physical flux to argue that private or public entities do not plan them, which allows a limited focus on change itself and the seeming resulting chaos and unrest. The literature that focuses on issues of the self-built nature of informal settlements describes them as unfinished in nature, tells us little, and, in fact, shifts our gaze from how communities come together, nurture, and sustain themselves and how they strategically navigate the impacts of this urban process of constant change in conditions of scarcity.
At the urban scale, there are profound implications of this incremental process in the constitution of the form of an informal city. The most important feature is that as the houses improve, the urban space changes. This urban upgrade results from private, collective NGO, and state-funded processes. The diversity of actors in modifying the urban form made visible the multitude of methods and financing mechanisms to improve urban infrastructure, from community members’ self-built and financed to a myriad of partnerships that include a mix of state–NGO–community designed, funded, and constructed. This system reveals a new and more complex community–state synergy of building informal settlements. The interaction and synergies between multiple actors start a virtuous development cycle in which the infrastructure continuously improves [63]. Community improvements follow state-sponsored improvements at the urban scale in housing units. Finally, infrastructure improvements change perceptions of tenure security, assuring community members that they will not be removed and encouraging them to invest in their properties. Together, these improvements add up to coherent urban environments that not only fulfill the function of housing, but also include social, religious, educational, and production areas. Understanding the process of urban incrementality is fundamental in improving the lives of informal dwellers worldwide given the value that progressive infrastructure improvement can bring to the urban poor.
2.3. Predictability of Informal Growth
New mapping tools and techniques offer insight into the second feature: the creation of predictive models to successfully simulate the housing pattern of informal settlements’ growth [64]. Scholars found that informal settlements “present robust configurational patterns.” Urban patterns made possible the creation of descriptive geometric models for informal settlements [65]. The mapping of slum geometry over time has demonstrated how an informal settlements urban form changes with the growth in the shape and size of housing units [14]. The further development of these geometrical models opens an opportunity to create predictions of how an informal settlement urban form will change [11,14,66,67]. That process of mapping and forecasting informal settlements is called “slumulation” [68]. The current literature on informal settlements mainly supports the idea that informal development follows a prescriptive series of stages [50,64,69,70,71,72]. In this approach to understanding informal settlements, a key outcome is modeling and predicting “growth and consolidation” as a linear process. Understanding the linearity of the growth process in informal settlements is crucial to forecasting settlements’ future. This predictability is critical to setting up procedures and policies to design better outcomes.
3. Informal Development Stages (IDS)
Beyond recognizing stages of growth, the previous morphological growth studies tell us little about each step’s particular defining characteristics. Recording each morphological change in informal settlements during the entire evolutionary process using retroactive mapping (RM) permitted identifying inflection points in the evolving nature of informal settlement neighborhoods in Medellin, Colombia. The informal development stages (IDS) framework is a categorization matrix that has been developed to classify the age and level of densification in informal settlements, comprising three successive states of densification [13]. Three stages of development are thresholds of densification that determine patterns of the urban form. Furthermore, the underlying assumption is that urban form changes affect how the social networks inside these spaces respond to such variations. The IDS are (A) foundation, (B) infill, and (C) consolidation (See Figure 1).
The foundation is the least dense period determined by erecting the first group of homes. It is followed by infill: in this stage, population and urban density increase, correlating with the diminishing quantity of open space due to the growth of the existing units. In this stage, urban development delineates the final urban form, defining the limit between the private and public spaces. Finally, consolidation is the final moment of urban incorporation with the surrounding urban form and possible integration. The units’ quality improves, and most urban growth happens in the third dimension (upward).
3.1. Foundation, IDS1
In Medellín, this refers to the moment of the first “invasión” (land-taking) where the community carefully and strategically selects the land. So, this first moment is preceded by forming a community group of families and individuals who claim ownership of the site. Formally, this period is characterized by light and quick construction. Speed is paramount in the land-taking process. By moving and building fast, communities slow the state’s ability to enact legal evictions. The speed of construction leads to a mislabeling and misconception about informal settlements as “temporary or spontaneous”. Settlers must erect the houses with limited economic resources and little time, and these limitations determine the architectural housing typologies they employ. In the literature, the term “ephemeral” is often used to define the physical characteristics of informal settlements. Most people mistake here that what is ephemeral is the typology and the materials of the housing, not the intention of occupation. These houses do not occupy the entirety of the terrain claimed by community members, meaning that building walls do not touch their neighbors, and ample space is left between units. This minimal land occupation gives these settlements a suburban appearance in the foundation stage.
The number of community members who compose the settlement is relatively small. The magical number of families needed to conquer a site during land-taking ranges from 25 to 75. Such a low population number correlates with low urban density (units/hectare). Small units are the key defining physical features of this period. However, the small number of dwellers makes settlements more susceptible to evictions during this stage. Even when dwellers are removed, they regroup quickly and start the land-taking effort again, adding more members. Successive land-takings and evictions are frequent in this stage. This period begins an endurance race between the state (or private owners) and the settlers; the group with the most stamina prevails. Successful informal settlements are those that are sufficiently resilient to endure.
3.2. Infill, IDS2
This phase is characterized by increasing population density and diminishing open space. Creating new plots by the subdivision of the existing ones creates the definitive urban form. The ultimate relationship between open spaces and built structures is determined at this stage. The neighborhood obtains its final distinctive urban structure of paths of movement and public spaces defined by the edges of private spaces. Dwellers replace the fragile units from the foundation phase with larger buildings made of more traditional and robust materials. Community members, in most cases, pave roads, build public facilities, and deliver public services, such as water, sewer, and electricity. Many of these services are installed in a substandard manner, breaking city regulations. In Medellín, this upgrading happens concurrently to most units due to collective labor in what they call “convites” that are community meetings to improve infrastructure. Families with larger plots sell or share the property until no buildable land is available. Densification happens by increasing the number of units, their square footage, and the number of dwellers who occupy them. The population growth at this point is exponential up to 30 times. Finally, as the units become more robust thanks to the materials used to replace the early fragile structures, the provisional appearance of the neighborhood disappears.
3.3. Consolidation, ISD3
In this stage, informal settlements obtain their mature urban form as growth reaches a plateau. Some areas may successfully be integrated into the formal city. Even as development continues, it does so in a marginal way compared to the previous stage, up to three times. Most units go from a single story to two, three, or more floors in height. Unit growth depends on the economic standing and family size increases. In that process, community members again upgrade their houses, the ones that used terraces as roofing add floors, and the ones with lighter roofing materials get dismantled and replaced for terraces waiting for the next funding opportunity.
At this point, threats of eviction become more improbable given the number of families required to be displaced and the lack of low-income housing projects to relocate such families. The state also enters a different type of relationship with the informal settlement providing public services (water, energy, sewer, and roads); most state-sponsored urban upgrading programs are in the neighborhoods that have arrived at this stage. Density is double or more that of the previous stage. However, it is also apparent that the neighborhood reaches a plateau in which population increases are not feasible at the previously observed rate. In most cases, there is a small reduction in the number of dwellers in the last years of consolidation. The dwellers’ higher economic standing gives them the means to reduce unit overcrowding.
The quality of life improves because of a more significant state’s public infrastructure such as roads, bridges, and public buildings. Many of these state improvements replace older structures built by the community or NGOs in earlier stages. All these state interventions can occur because the legality of most settlements is resolved. Along with structural changes, aesthetic improvements become evident in the units. Owners paint facades or cover the outside of their buildings with decorative materials that become public and an artistic representation of self and identity. The different levels of housing quality also reveal the heterogeneous nature of income in informal areas.
Finally, the IDS approach presents three different settlements distanced by time and density and challenges the traditional definitions of slums. It also opens the opportunity to modify the current urban design practices in the spaces of informality, forcing urban designers to invent interventions that understand each of these places and the moment in time in which they are. However, one of the weak areas of understanding is how this model born from the study of a particular cultural and urban context can be applied to the diversity of urban forms that comprise the constellation of informal settlements globally.
4. Methodology
This research project employs a three-phase methodological approach to test the IDS globally; the three phases are case selection, IDS fitment filter, and sample and area coverage measurement. See Figure 2 for a graphic depiction of the Methodological workflow.
4.1. Phase 1: Case Selection
One of the most challenging aspects of the fragmentation of initiatives in the mapping of slum areas is that they present challenges to comparability across regions. Different definitions, mapping techniques, and mapping timeframes challenge the generalization of findings. The IDS framework used RM to measure the morphological change over time [13]. RM permitted to have a database collected at the same scale and with the same level of resolution to measure across the cases. The IDS states that informal settlements arrive at a plateau at the consolidation stage, where the change in population density and urban density continues, but is at a lower rate. To that end, in this research, it was essential to select places with a significant mapped change. We looked for cases with large levels of urban changes, intending to capture most of the urban transformation using the same mapping methods with sufficient detail. A standardized approach to collecting and measuring each case was necessary to test the IDS framework globally. The goal was to capture settlements before formation to experience the entire lifespan of mapped places. The RM method requires maps of informal settlements worldwide from before foundation (IDS1) to consolidation (IDS3). Mapping of informal settlements globally is limited, and in very few instances’ maps are consistent across the entire lifespan of informal settlements.
A recent strategy to build on that gap is The Atlas of Informality (AoI), which combines confirmed boundaries of settlements at the neighborhood scale reported by researchers or institutions mapping informal areas. The settlements in the AoI come from a varied methodological mapping process, community mapping, municipal delineation, or RS identification. Each settlement’s existing mapping information is geolocated, and its borders are retraced from high-resolution satellite images in two moments—the closest available moment and 15–20 years before [2]. In order for a settlement to be included in the AoI, it needs to be designated as an informal settlement by a scholar or institution. This selection process guarantees that at least two conditions (poverty and lack of regulation by the city) of the definition selected for this research are met.
Presently, 447 areas have been mapped, distributed over 102 countries or territories and 188 cities. Within our sample, there are 228 cities in Latin America and the Caribbean (LAC), 35 in the Middle East and North Africa (MENA), 112 in Sub-Saharan Africa (SSA), 31 in South Asia (SA), and 32 in East Asia and the Pacific (EAP). The entire dataset is available as a publicly accessible data repository [73]. The AoI provides a good number of cases for comparability across regions and countries. Using the same methodology, measuring different moments in time becomes a valuable instrument for measuring the land expansion of informal areas globally.
We selected the AoI because it is a standard global sample of informal neighborhoods and because the growth rate is a suitable estimator of informal settlements within the process of IDS. However, the AoI has a limitation in that it relies on identifying informal settlements from scholarly publications, state and city mappings, and nongovernmental organizations worldwide. While this process is valuable for confirming that a peer actor or institution has recognized a settlement as informal, it has the unintended consequence of biasing selection towards well-known and older informal settlements. This can discriminate against newer settlements where evidence of the IDS and transformation may be more visible. Another limitation is that while the context of each settlement can be accessed by looking at the source in the AoI, the heterogeneous methodology of study of each case makes that context not useful for comparability with the other settlements’ variables and collection methods. Exploring further into the context and comparability of the cases is a future area of research.
4.2. Phase 2: IDS Fitment Filter
The second phase of the research evaluated if there was evidence of IDS within the change for each case. For that process, we created RM for each case using the Google Earth historical imagery, collecting imagery for each case ranging from 2000 to 2022. The imagery resolution in Google Earth varies depending on the data source: from 10 m for the SPOT satellites to 1.5 m for Ikonos, ca. 1 m for Digital Globe’s WorldView-1/2/3 series, ca. 0.5 m for GeoEye-1 and Airbus’ Pleiades, and ca. 0.3 m for WorldView-3 [74]. Using direct mapping for each case, we attempted to identify the evidence of IDS. Additionally, when the evidence existed, we classified change into four periods: no construction and the three IDS. To identify each stage, we used the following visual indicators within the AoI settlement perimeter: at IDS0, there are no structures; at IDS1, the first areal image shows more than ten structures; for IDS2, area coverage increases significantly by adding new structures, with a coverage of more than 90 percent of the surface area and evidence of an identifiable final street grid; finally, for IDS3, we looked for unit expansion to cover individual lots and evidence of growth in the number of levels of structures. To determine IDS3, we looked for evidence of second floors by measuring the length of shadows to determine the increase in the height of structures; we employed a simplified version of the building height estimation using Google Earth [75]. We measured the length of the shadows that were more than two times the length of the adjacent structures. Finally, urban change over the years was calculated using the historical images available. Sometimes, no available images exist between years; for example, there is an image for 2000 but not for 2001; in that case, we used the next year’s available image.
4.3. Phase 3: Sample Measurement
The final methodological phase evaluates the area coverage of settlements with manifestations of all IDS. To ensure consistency in the measurements of each settlement, a sample area of 100 m × 100 m, or 10,000 square meters, was selected at each corresponding IDS period. For each sample, all visible structures were manually digitalized in CAD/vector software, resulting in accurate drawings of the settlement at each IDS. Figure 3 shows the sample images and CAD digitalization process for Maili Saba, Nairobi, Kenya. After digitizing each sample, the resulting files were geolocated in ArcGIS to consistently measure the total surface area of the settlements.
5. Results
5.1. Phase 1: Case Selection
In this research project, we ranked all cases in the AoI according to their expansion growth rate, which is a variable that measures the percentage increase in the perimeter area over the years of data collection (%GY). The main assumption underlying this ranking was that settlements with high expansion rates are more likely to exhibit changes across the IDS.
We selected fifty cases with a higher percentage of expansion %GY in the AoI ranging from 602.74% to 6.34% per year. The case distribution was as follows: 11 in Latin America and the Caribbean (LAC), 12 in the Middle East and North Africa (MENA), 23 in Sub-Saharan Africa (SSA), 2 in South Asia (SA), and 1 in East Asia and the Pacific (EAP). See Figure 4 for a distribution of cases across world regions and Figure 5 for case locations and growth rates. Out of the entire sample, 36 cases were situated in areas where there was potential for urban expansion, while 14 were located in areas where expansion was limited due to various factors such as topographical features, e.g., waterbodies or roads, or areas that had already been developed.
5.2. Phase 2: IDS Fitment Filter
Using the collected RM for each case, we used direct mapping; with the classification process outlined in the methodology, we identified evidence of IDS for each of the 50 settlements. Out of the entire sample, 20 cases had pre-foundation IDS0 data; 41 cases were classified as foundation (IDS1), 47 cases were classified as infill (IDS2), and 43 cases were classified as consolidation (IDS3). Please refer to Figure 5 for the distribution of cases across the IDS: (a) showing the number of cases for each IDS, (b) the total counts, and (c) the percentage for each IDS and the total number of cases identified for an IDS. A total of 94% of cases showed signs of growth, as expected by the IDS. Of all the cases, four did not fit the expected IDS model: Busnaib in Banghazi, Libya; Houd 10 in Alexandria, Egypt; Mariguini in Nairobi, Kenya; and Kibuye in Sanaa, Yemen. These settlements appear similar to traditional formal developments; the first three settlements have some evidence of conventional core housing or social housing development. The last one is likely to be a more formal settlement declared a slum. From the sample, 17 settlements had all the IDS and presented good imagery to measure density changes per stage.
5.3. Phase 3: Sample Measurement
The resulting measurements from the standardized samples from the 17 informal settlements with all the IDS were as follows: the average coverage area (A1m2, A2m2, and A3m2) of IDS1: 1070.61 square meters, IDS2: 2678.23 square meters, and IDS3: 4217.49 square meters. The area coverage change is measured by calculating the percentage difference between the previous stage and the next. Average percentage of area coverage increase from IDS1 to IDS2 (%C1–2): 225.6%; from IDS2 to IDS3, 73.87%. The rate of change per year between the IDS is measured by the total area change percentage between the IDS divided by the average number of years it took that settlement to reach the next stage. The percentage area coverage increase per year between the IDS1 and IDS2 (YPer1–2) was 65.4%, and for the period between IDS2 and IDS3 (YPer2–3), it was 12.69%. For the detailed measurements for the samples from each of the 17 informal settlements with all the IDS, see Table 2.
6. Findings
Our findings provide a significant evidence of change across all the cases as each settlement demonstrated an expansion of its urban perimeter. Urban growth was expected in the 50 cases selected for this study as they were chosen from the AoI based on the highest percentage of urban change. In other words, the study focused on the 50 areas within the AoI that had experienced the greatest urban development. However, we found evidence of densification in relationship with time. We found that from the sample, 94% showed signs of changes in densification, as expected in the IDS model. Forty percent of all the cases show evidence of all three IDS (foundation, infill, consolidation); see Figure 6 for counts and proportions per IDS. The IDS framework builds on the observation that as informal settlements age, individual lots and units will densify. For example, Figure 7 shows the morphological change of a single settlement lot over sixteen years; multiple additions and changes are visible over time. Additionally, in this example, it is visible that change happens to most other lots around the highlighted one. Changes are constant but not equal. Most lots are densified in similar ways; however, each one densifies in a slightly different form and pace. Our research revealed that in 94% of the cases examined, we found clear evidence of unit changes and densification within the settlements.
Each of the three different IDS represents a distinctive urban pattern based on the area coverage of the built environment, a specific pattern that is different from the other stages. The foundation, IDS1, covers a built area of 10.71%. The second phase, infill, IDS2, covers a larger area of 26.78%, which means that it represents a more prevalent urban pattern in the area being studied. The third and largest stage consolidation, IDS3, covers an area of 42.17%; see Table 2 for details per case. Overall, by breaking down the urban area being studied into different IDS with distinct patterns, researchers can gain a more nuanced understanding of the built environment and how it has evolved. This information can be helpful in a range of purposes, such as urban planning, policy development, or academic research.
Our analysis of the transitions between the IDS revealed some interesting patterns in the densification of the settlements. Specifically, we found that in IDS2, the average sample coverage area densified by 225.6% compared to the previous IDS1. This significant increase in density suggests that settlements undergo rapid transformations during this period. However, in IDS3, the trajectory of densification slowed down to 73.87% compared to the previous IDS2, as shown in Table 2, which presents the area and change percentage per sample case. This observation corroborates our initial assumption that significant urban changes occur at earlier IDS, where the morphological structure of the informal settlement achieves its final form.
The sample demonstrates that a settlement can go through the entire IDS process in a decade. The median sample time was 10.2 years for the settlements where all the IDS were identified. However, this resulted from sample bias and only accounted for 34% of all the cases with IDS. However, for the remaining cases in which there was evidence of IDS, the 20 years of available data were insufficient to capture the entire process.
Our analysis of the IDS framework led us to an interesting finding: the timeframe of densification does not appear to have a significant impact on the outcomes. This is noteworthy because the IDS framework was initially designed to examine settlements over a span of 60 years, which raises questions about whether the framework would be valid only for settlements of that age or older. However, we found that this was not the case. IDS evidence can be found in much newer settlements, some only 12 years old, such as Los Artesanos, as shown in Figure 8. This finding supports the idea that the IDS framework is a good predictor of change in informal settlements, regardless of the settlement’s age or the timeframe of densification.
The total area of an informal settlement has an impact on the fitment of the model. Small settlements within confined urban perimeters, such as those within urban areas, fit better into the expected model; see Figure 8 for Los Artesanos. In contrast, large settlements of a scale of districts usually located at the periphery presented in some cases the three IDS in different areas at the same time. In these cases, the foundational core (the area of the first urban development) had already reached the IDS3 consolidation while the inner-settlement area was moving to IDS2 (infill), and the edges, as it expanded, behaved more like IDS1 (foundation). As a result, different densities representing different IDS were the same across countries and regions. This condition of gradual densification in relation to the foundational urban core is very morphologically similar to the conceptualization of the urban transect from new urbanism [76,77] that presupposes a decrease in densification and intensity of uses when moving across the different zones towards the periphery; for an example, see Figure 9.
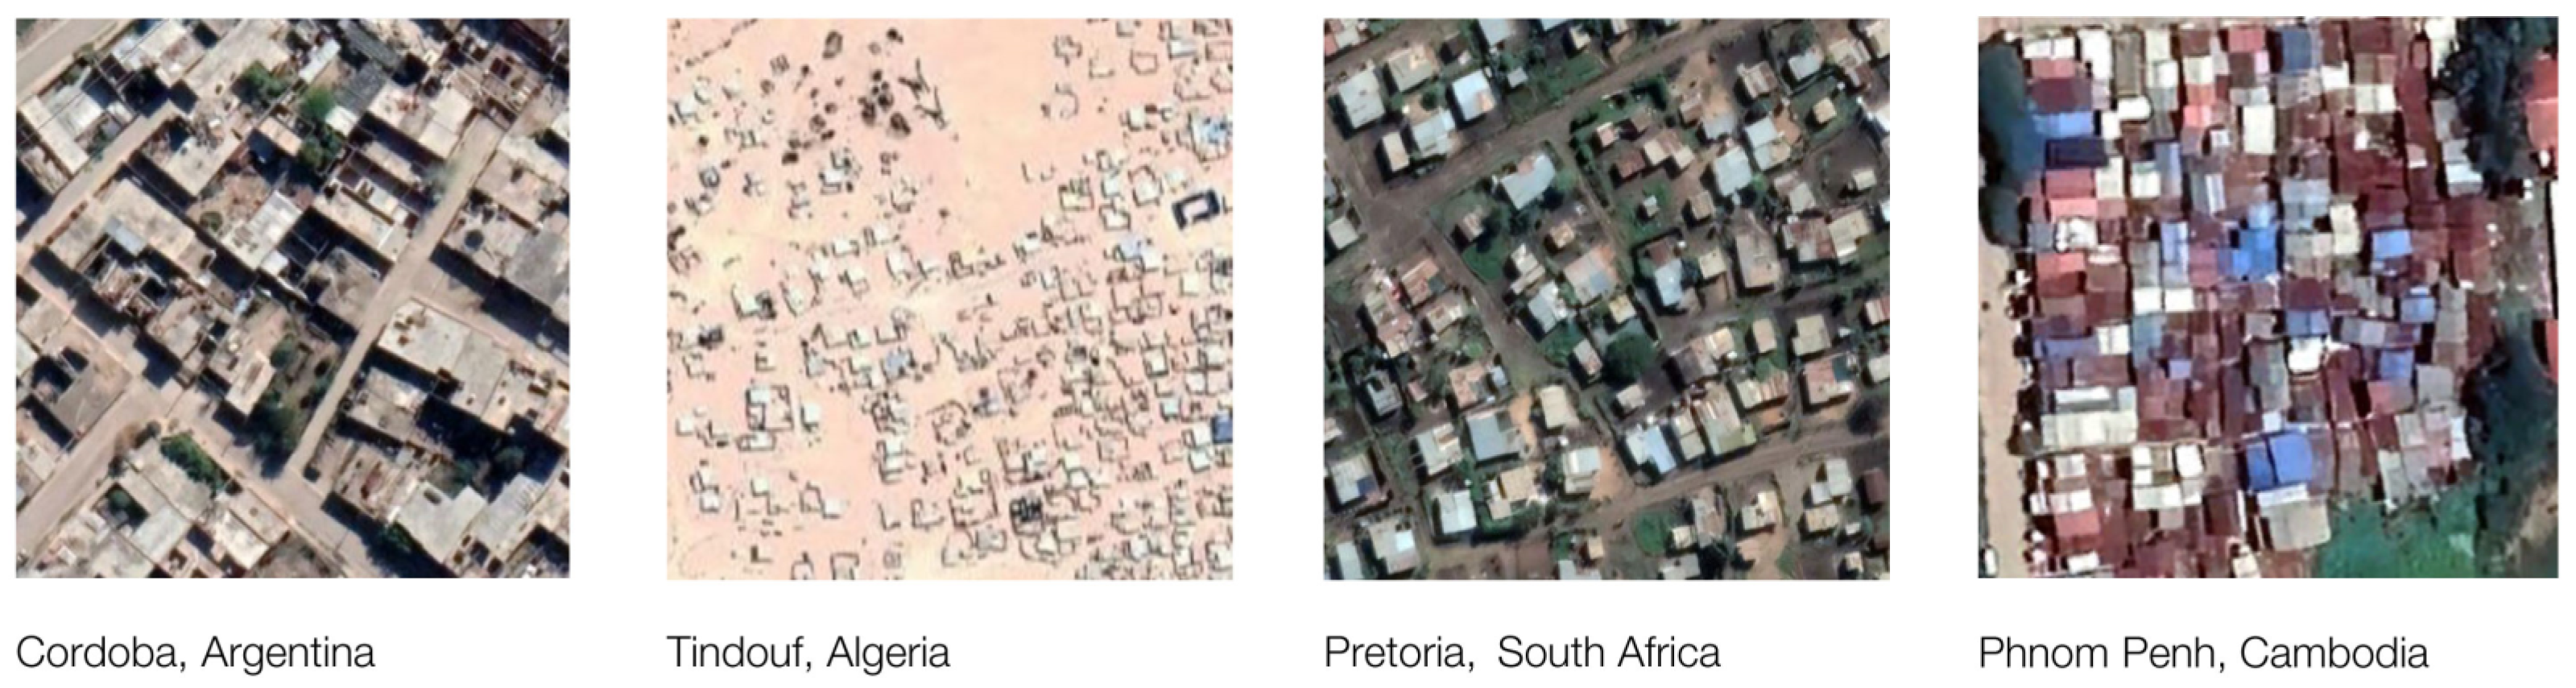
There is variability in how the IDS applies to world cases. The measure of density is not uniform or consistent across different cases. As a result, settlements in various regions of the world can exhibit varying degrees of density and, consequently, follow distinct development patterns. For example, settlements in Algeria and South Africa tend to be less dense than those in Asia or Latin America. Different densities across geographic regions imply that the built environment in these regions is characterized by a lower degree of compactness and greater dispersion compared to other parts of the world, as illustrated in Figure 10. The variability in density can be attributed to various environmental and cultural factors. For example, settlements in areas with high population density may be more closely packed due to limited space, while those with lower population density may be more dispersed. Additionally, cultural factors, such as preferences for certain building materials or housing types, can influence a particular region’s development pattern. Overall, density is not a uniform or standardized measure across cases. Instead, it is affected by various environmental and cultural factors that can differ from place to place. Further measurement and research are needed to unpack the differences and fitment of the IDS across these differences.
7. Discussion
There is a need to modify how we define informal settlements beyond just being the opposite of formality for a deeper understanding of the phenomenon. The need for a more precise and definite definition of informal settlements has been emphasized by scholars [14,78]. Informal settlements are unique areas that differ from other parts of the city in their urban patterns [28,79], how their economy develops [80], how the land is negotiated [81], and how they physically develop over time [13]. Much of the literature on informal settlements has focused on understanding informality as an urban pathology [82,83]. When viewed through this pathological lens, the projects and methods developed for informal settlements have been concentrated on solving the challenges of informal settlements as a “disease”. The use of the lack-of-formality frameworks by political actors, planners, city managers, and nongovernmental agencies has led to the use of dangerous modernist urban methods, such as eradicating and replacing informal practices, spaces, and buildings with formal ones [84,85,86]. This line of thinking has produced incredible human rights abuses against the community members who had created their everyday spaces, harming or even destroying their social networks and, thus, their capacity for resilience [49]. With all this in mind, there is a need for new creative strategies that move our discipline away from the lack-of-formality framework to a broad understanding of informal settlement processes [87,88].
Current efforts into creating predictive models for identifying informal settlements using urban morphological tools [11,28,30,89] do not train for predictive morphological time variation of settlements over time with their density variations. This research contributes towards addressing that gap by creating evidence of global densification patterns of informal settlements identified in the IDS framework. Further exploration in this area mixing IDS with those models can produce valuable data to refine such identification models further. This research builds on scholarship that looks at informal settlements’ constant growth as their most salient, influential, and unique defining feature [2,13,64,67]. Informal areas mapping, growth, and forecasting have opened an opportunity to unveil the unique peculiarities of these places and people. A growth approach helps explain the logic and resilience of informal settlements and the agency and strategies of those who build them [49]. Looking at incremental change not as a pathology but as inherent characteristics reveals a simple but dramatic urban process that opens the door for new intervention tactics.
While an IDS process can bring benefits in developing appropriate policies towards informal settlements, its application still has significant challenges. One of these challenges is the lack of data [9,10,30], which hinders finding more information about changes in informal settlements. In this case, data precision is one of the most sensitive issues; the lack of consistent mapping over time makes it difficult to find and measure change over the entire period of growth [2]. The research has identified IDS fitment patterns; however, there are still areas for improvement of the model given the statistically small sample of cases which can introduce selection bias into the research. Additionally, there is still a need for more precise measurements and the inclusion of more variables to understand this phenomenon better. For example, more data can help describe and identify the limits between each stage or whether more stages are needed to clarify the morphological change in informal settlements fully. Further research and mapping are required to fine-tune a worldwide framework for classifying informal settlements based on their urban density. There is a need for more data collection to evaluate and measure changes in informal settlements. As time passes and more historical high-resolution images become available, mapping these issues will become more accessible.
8. Conclusions
A recurrent framework of defining informal settlements (IS) has a singular goal of reaching formality. As such, development agencies define “slums” as areas that “lack” the expected features of a formal city (e.g., durable housing, sufficient living area, access to improved water, access to improved sanitation facilities, and secure tenure). Focusing on the lack of a (formal) framework results in overlooking the processes that make these urban forms and communities who live there different from the traditional western perspectives of city-making and urban design. Communities’ self-building processes and the areas’ constant growth are indeed informal settlements’ most salient morphological features. These features then permit the identification, mapping, and creation of geometrical models that ultimately help scholars predict informal settlements’ growth. Part of the challenge of accurately defining informal settlements is limiting our understanding to fixed characteristics regarding an urban form in constant flux. This research builds upon the informal development stages (IDS) framework to measure rates of change in IS and explores how such structures apply globally. The informal development stages (IDS) framework is a categorization matrix that has been developed to classify the age and level of densification in informal settlements [13]. The IDS created three unique thresholds of densification that determine patterns of urban form. The first one, foundation, represents the lowest level of density, which is followed by infill, an increase in population and urban density and a diminishing quantity of open space due to the growth of existing units. Finally, during consolidation, the units’ quality improves, and most growth happens in the third dimension (upward).
The research follows a sample of fifty informal settlements with a high change coefficient from the Atlas of Informality (AoI) across five world regions to explore how change and densification across IDS can be mapped in such areas. The research found evidence of change and densification across regions. From the 50 settlements sample, a total of 94% demonstrated densification changes that fit the IDS model. Furthermore, the timeframe of densification does not appear to have had a significant impact on the outcomes. IDS evidence can be found in newer settlements, some only 12 years old. After reviewing samples of settlements using IDS, we observed clear densification patterns between different stages and significant changes in area coverage rates during transitions. Specifically, the area coverage increased by an average of 225.6% between IDS1 and IDS2 and by 73.87% between IDS2 and IDS3. This difference is significant for classification and the creation of a policy tailored to the rates of change at each IDS.
Additionally, the research found that large settlements can exhibit all IDS simultaneously, meaning that as older areas densify, new expanding areas are created. The sample demonstrates a significant reason to believe that the IDS framework has evidence across regions. However, cultural and architectural typologies result in differences across regions. Furthermore, time changes happen at different speeds, probably reflecting each case’s political and economic local context that later reflects on the densification process. This research selected cases from the AoI; this introduced a potential identification bias toward new settlements with high rates of change. Additionally, the AoI standardized samples from a diverse methodological identification process and represented different contexts. Future research using further multiple methods could examine these changes on the ground more thoroughly.
In conclusion, this research highlights the importance of considering the self-building processes and constant growth of informal settlements in our understanding of urban forms. The IDS framework provides a comprehensive and dynamic approach to defining and understanding informal settlements, which is crucial in accurately predicting their growth and development. This research also demonstrates the global applicability of the IDS framework and highlights the need for further research to understand the unique morphological features of informal settlements worldwide. This research engages with the literature of understanding the morphology of informal settlements. It builds on a theoretical framework to classify them based on their unique characteristic of ongoing urban densification.
The possibility of classifying informal settlements based on their progressive densification, as expected in the IDS framework, presents opportunities for policy and action in informal settlements. For example, the predictive nature of model changes can help city governments to develop projects and funding in anticipation of future changes. Furthermore, classifying informal settlement areas by IDS can help city governments to include in city planning efforts a budget tailored to each place, concerning their needs more effectively.
An inherent danger exists in visibilizing poor marginal communities in informal settlements. Making these areas and their future change evident can also incentivize the dangerous actions perpetuated by slum eradication practices. Therefore, we must be vigilant about how such methods can serve as an excuse for further imposing harm and violence on these population groups. However, we need to also understand that the invisibilization of informal settlements does not automatically mean the protection of such communities and that their lack of recognition is also a strategy long employed to facilitate the use of violent and harmful practices.
The next step is to apply such new knowledge in the interventions in informal settlements. Improving the current urban upgrading practices means moving beyond palliative design responses to what informal areas lack. Instead, an IDS approach looks at growth and change as guiding principles of urban design by looking at not-developed areas as part of the intervention strategy, anticipating future development and integrating into the urban design not as a finite image of the neighborhood but as an evolutionary process that adapts to these settlements’ current and future needs. Finally, adopting an IDS urban design approach would require a radical change in how we approach design in these areas in terms of the regulatory framework and funding strategies, all of which are nonexistent today, as well as the creativity of multiple actors in developing new urban design paradigms of intervention in the planet’s most common form of development.
Author Contributions
Conceptualization, J.S.; methodology, J.S.; software, W.L.; validation, J.S. and W.L.; formal analysis, W.L.; investigation, J.S. and W.L.; resources, J.S.; data curation, J.S.; writing—original draft preparation, J.S.; writing—review and editing, J.S.; visualization, W.L.; supervision, J.S.; project administration, J.S.; funding acquisition, J.S. All authors have read and agreed to the published version of the manuscript.
Funding
This research received no external funding.
Data Availability Statement
AoI settlement information can be accessed at www.atlasofinformality.com (accessed on 15 April 2023).
Conflicts of Interest
The authors declare no conflict of interest. The funders had no role in the design of the study; in the collection, analyses, or interpretation of data; in the writing of the manuscript; or in the decision to publish the results.
References
- Desa, U.N. World Urbanization Prospects, The 2018 Revision; United Nations, Department of Economic and Social Affairs, Population Division: New York, NY, USA, 2018; p. 126. [Google Scholar]
- Samper, J.; Shelby, J.A.; Behary, D. The paradox of informal settlements revealed in an ATLAS of informality: Findings from mapping growth in the most common yet unmapped forms of urbanization. Sustainability 2020, 12, 9510. [Google Scholar] [CrossRef]
- United Nations. Progress towards the Sustainable Development Goals; United Nations: New York, NY, USA, 2017. [Google Scholar]
- United Nations. The Sustainable Development Goals Report 2019; United Nations: New York, NY, USA, 2019; p. 64. [Google Scholar]
- Davis, M. Planet of slums; Verso: London, UK; New York, NY, USA, 2006; ISBN 1-84467-022-8. [Google Scholar]
- Brand, S. How slums can save the planet. Prospect 2010, 167, 39–41. [Google Scholar]
- Mayne, A. Slums: The History of a Global Injustice; Reaktion Books: London, UK, 2017; ISBN 1-78023-887-8. [Google Scholar]
- Gilbert, A. The return of the slum: Does language matter? Int. J. Urban Reg. Res. 2007, 31, 697–713. [Google Scholar] [CrossRef]
- Abascal, A.; Rothwell, N.; Shonowo, A.; Thomson, D.R.; Elias, P.; Elsey, H.; Yeboah, G.; Kuffer, M. “Domains of deprivation framework” for mapping slums, informal settlements, and other deprived areas in LMICs to improve urban planning and policy: A scoping review. Comput. Environ. Urban Syst. 2022, 93, 101770. [Google Scholar] [CrossRef]
- Kuffer, M.; Pfeffer, K.; Sliuzas, R. Slums from space—15 years of slum mapping using remote sensing. Remote Sens. 2016, 8, 455. [Google Scholar] [CrossRef]
- Patel, A.; Crooks, A.; Koizumi, N. Simulating Spatio-Temporal Dyanmics of Slum Formation in Ahmedabad, India. In Proceedings of the 6th Urban Research and Knowledge Symposium - Rethinking Cities: Framing the Future, LSE Cities. Barcelona, Spain, 8–10 October 2012; Volume 2012, p. 336387-1369969101352. [Google Scholar]
- Samper, J. Forecast Anticipate and Condition: Informal Development Strategies in Mumbai. In Landscape + Urbanism around the Bay of Mumbai; Massachusetts Institute of Technology: Cambridge, MA, USA, 2010; ISBN 81-901974-8-7. [Google Scholar]
- Samper, J. An urban design framework of informal development stages: Exploring self-build and growth in informal settlements. In The Routledge Handbook of Urban Design Research Methods; Routledge: Abingdon-on-Thames, UK, 2023; p. 528. ISBN 978-0-367-76805-8. [Google Scholar]
- Barros, J.; Sobreira, F. City of slums: Self-organisation across scales. UCL Work. Pap. Ser. 2002, 55, 1–10. [Google Scholar]
- Fernandes, E. Regularization of Informal Settlements in Latin America; Lincoln Institute of Land Policy: Cambridge, MA, USA, 2011; ISBN 1-55844-202-2. [Google Scholar]
- Hansen, K.T.; Vaa, M. Reconsidering Informality: Perspectives from Urban Africa; Nordic Africa Institute: Uppsala, Sweden, 2004; ISBN 91-7106-518-0. [Google Scholar]
- Huchzermeyer, M. Unlawful Occupation: Informal Settlements and Urban Policy in South Africa and Brazil; Africa World Press: Trenton, NJ, USA, 2004; ISBN 978-1-59221-211-8. [Google Scholar]
- Leeds, A. The Significant Variables Determining the Character of Squatter Settlements; University of Texas: Austin, TX, USA, 1971. [Google Scholar]
- Mehrotra, R. Kinetic city, Issues for urban design in South Asia. In Reclaiming (the Urbanism of) Mumbai. Explorations in/of Urbanism; Sun Publishers: Amsterdam, The Netherlands, 2009; pp. 142–152. [Google Scholar]
- Kamalipour, H.; Dovey, K. Mapping the visibility of informal settlements. Habitat Int. 2019, 85, 63–75. [Google Scholar] [CrossRef]
- Ballesteros, M. Verb Crisis; Actar: Barcelona, Spain; New York, NY, USA, 2008; ISBN 978-84-96540-97-2. [Google Scholar]
- Zhang, X.Q. Housing for All: The Challenges of Affordability, Accessibility and Sustainability: The Experiences and Instruments from the Developing and Developed Worlds; Human settlements finance and policy series; United Nations Human Settlements Programme: Nairobi, Kenya, 2008; ISBN 978-92-1-131992-7. [Google Scholar]
- Boanada-Fuchs, A.; Boanada Fuchs, V. Towards a taxonomic understanding of informality. Int. Dev. Plan. Rev. 2018, 40, 397–421. [Google Scholar] [CrossRef]
- Huchzermeyer, M.; Karam, A. Informal Settlements: A Perpetual Challenge? UCT Press: Cape Town, South Africa, 2006; ISBN 1-919713-94-8. [Google Scholar]
- Arfvidsson, H.; Simon, D.; Oloko, M.; Moodley, N. Engaging with and measuring informality in the proposed Urban Sustainable Development Goal. Afr. Geogr. Rev. 2017, 36, 100–114. [Google Scholar] [CrossRef]
- Sliuzas, R.; Mboup, G.; de Sherbinin, A. Report of the Expert Group Meeting on Slum Identification and Mapping; CIESIN: Palisades, NY, USA; UN-Habitat: Nairobi, Kenya; ITC: Enschede, The Netherlands, 2008. [Google Scholar]
- Taubenbock, H.; Kraff, N.J. The physical face of slums: A structural comparison of slums in Mumbai, India, based on remotely sensed data. J. Hous. Built Environ. J. Hous. Built Environ. 2014, 29, 15–38. [Google Scholar] [CrossRef]
- Kuffer, M.; Orina, F.; Sliuzas, R.; Taubenböck, H. Spatial patterns of slums: Comparing African and Asian cities. In Proceedings of the 2017 Joint Urban Remote Sensing Event (JURSE) IEEE, Dubai, United Arab Emirates, 6–8 March 2017; pp. 1–4. [Google Scholar]
- Purwanto, E.; Sugiri, A.; Novian, R. Determined Slum Upgrading: A Challenge to Participatory Planning in Nanga Bulik, Central Kalimantan, Indonesia. Sustainability 2017, 9, 1261. [Google Scholar] [CrossRef]
- Hofmann, P. Detecting Informal Settlements from IKONOS Image Data Using Methods of Object Oriented Image Analysis-an Example from Cape Town (South Africa). In Remote Sensing of Urban Are-as/Fernerkundung in Urbanen Räumen; Jürgens, C., Ed.; Regensburger Geographische Schriften: Regensburg, Germany, 2001; Volume 35, pp. 107–118. [Google Scholar]
- Archer, D.; Luansang, C.; Boonmahathanakorn, S. Facilitating community mapping and planning for citywide upgrading: The role of community architects. Environ. Urban. 2012, 24, 115–129. [Google Scholar] [CrossRef]
- Hasan, A. Orangi Pilot Project: The expansion of work beyond Orangi and the mapping of informal settlements and infrastructure. Environ. Urban. 2006, 18, 451–480. [Google Scholar] [CrossRef]
- Hagen, E. Mapping change: Community information empowerment in Kibera (innovations case narrative: Map Kibera). In Innovations: Technology, Governance, Globalization; MIT Press: Cambridge, MA, USA, 2011; pp. 69–94. [Google Scholar]
- Samper, J. Physical Space and Its Role in The Production and Reproduction of Violence in the “Slum Wars” in Medellin, Colombia (1970s–2013); Massachusetts Institute of Technology MIT: Cambridge, MA, USA, 2014. [Google Scholar]
- Kamalipour, H. Improvising Places: The Fluidity of Space in Informal Settlements. Sustainability 2020, 12, 2293. [Google Scholar] [CrossRef]
- Roy, A.; AlSayyad, N. Urban Informality: Transnational Perspectives from the Middle East, Latin America, and South Asia; Lexington Books: Lanham, MD, USA; Berkeley, CA, USA, 2004; ISBN 0-7391-0741-0. [Google Scholar]
- UN, D.I.U. Unstats|Millennium Indicators. Available online: http://mdgs.un.org/unsd/mdg/SeriesDetail.aspx?srid=710 (accessed on 23 October 2020).
- Angeles, G.; Lance, P.; Barden-O’Fallon, J.; Islam, N.; Mahbub, A.Q.M.; Nazem, N.I. The 2005 census and mapping of slums in Bangladesh: Design, select results and application. Int. J. Health Geogr. 2009, 8, 32. [Google Scholar] [CrossRef]
- Niebergall, S.; Loew, A.; Mauser, W. Integrative assessment of informal settlements using VHR remote sensing data—The Delhi case study. IEEE J. Sel. Top. Appl. Earth Obs. Remote Sens. 2008, 1, 193–205. [Google Scholar] [CrossRef]
- Rüther, H.; Martine, H.M.; Mtalo, E.G. Application of snakes and dynamic programming optimisation technique in modeling of buildings in informal settlement areas. ISPRS J. Photogramm. Remote Sens. 2002, 56, 269–282. [Google Scholar] [CrossRef]
- Stow, D.; Lopez, A.; Lippitt, C.; Hinton, S.; Weeks, J. Object-based classification of residential land use within Accra, Ghana based on QuickBird satellite data. Int. J. Remote Sens. 2007, 28, 5167–5173. [Google Scholar] [CrossRef]
- Kuffer, M.; Barrosb, J. Urban morphology of unplanned settlements: The use of spatial metrics in VHR remotely sensed images. Procedia Environ. Sci. 2011, 7, 152–157. [Google Scholar] [CrossRef]
- Mayunga, S.D.; Coleman, D.J.; Zhang, Y. A semi-automated approach for extracting buildings from QuickBird imagery applied to informal settlement mapping. Int. J. Remote Sens. 2007, 28, 2343–2357. [Google Scholar] [CrossRef]
- Huang, J.; Lu, X.X.; Sellers, J.M. A global comparative analysis of urban form: Applying spatial metrics and remote sensing. Landsc. Urban Plan. 2007, 82, 184–197. [Google Scholar] [CrossRef]
- Taubenböck, H.; Kraff, N.J.; Wurm, M. The morphology of the Arrival City-A global categorization based on literature surveys and remotely sensed data. Appl. Geogr. 2018, 92, 150–167. [Google Scholar] [CrossRef]
- Kohli, D.; Sliuzas, R.; Kerle, N.; Stein, A. An ontology of slums for image-based classification. Comput. Environ. Urban Syst. 2012, 36, 154–163. [Google Scholar] [CrossRef]
- Baud, I.; Kuffer, M.; Pfeffer, K.; Sliuzas, R.; Karuppannan, S. Understanding heterogeneity in metropolitan India: The added value of remote sensing data for analyzing sub-standard residential areas. Int. J. Appl. Earth Obs. Geoinf. 2010, 12, 359–374. [Google Scholar] [CrossRef]
- Hillier, B.; Greene, M.; Desyllas, J. Correspondence Self-generated Neighbourhoods: The role of urban form in the consolidation of informal settlements. Urban Des. Int. 2000, 5, 61–96. [Google Scholar] [CrossRef]
- Samper, J. Eroded resilience, Informal settlements predictable urban growth implications for self-governance in the context of urban violence in Medellin, Colombia. UPLanD-J. Urban Plan. Landsc. Environ. Des. 2017, 2, 183–206. [Google Scholar]
- Bhatt, V.; Rybczynski, W. How the other half builds. Time-Saver Standard Urban Design; McGraw-Hill New York: New York, NY, USA, 2003; p. 1. [Google Scholar]
- Kamalipour, H. Mapping Urban Interfaces: A Typology of Public/Private Interfaces in Informal Settlements. Spaces Flows Int. J. Urban Extra Urban Stud. 2017, 8, 1–12. [Google Scholar] [CrossRef]
- Kamalipour, H.; Dovey, K. Incremental urbanisms. In Mapping Urbanities; Routledge: New York, NY, USA, 2017; pp. 249–267. ISBN 1-138-23360-9. [Google Scholar]
- Ribeiro, G. An ecological approach to the study of urban spaces: The case of a shantytown in Brasilia. J. Archit. Plan. Res. 1997, 14, 289–300. [Google Scholar]
- Ioannidis, C.; Psaltis, C.; Potsiou, C. Towards a strategy for control of suburban informal buildings through automatic change detection. Comput. Environ. Urban Syst. 2009, 33, 64–74. [Google Scholar] [CrossRef]
- Hurskainen, P.; Pellikka, P. Change detection of informal settlements using multi-temporal aerial photographs–the case of Voi, SE-Kenya. In Proceedings of the 5th African Association of Remote Sensing of the Environment Conference, Nairobi, Kenya, 18–21 October 2004. [Google Scholar]
- Shafqat, R.; Marinova, D. Using Mixed Methods to Understand Spatio-Cultural Process in the Informal Settlements: Case Studies from Islamabad, Pakistan. Humans 2022, 2, 17. [Google Scholar] [CrossRef]
- Caminos, H.; Turner, J.F.; Steffian, J.A. Urban Dwelling Environments: An Elementary Survey of Settlements for the Study of Design Determinants; MIT Press: Cambridge, MA, USA, 1969; ISBN 0-262-03028-4. [Google Scholar]
- Ward, P.M. The Squatter Settlement as Slum or Housing Solution: Evidence from Mexico City. Land Econ. 1976, 52, 330–346. [Google Scholar] [CrossRef]
- Turner, J.F.C. Housing by People: Towards Autonomy in Building Environments; Pantheon Books: New York, NY, USA, 1977; ISBN 0-394-40902-7. [Google Scholar]
- Holston, J. Autoconstruction in Working-Class Brazil. Cult. Anthropol. 1991, 6, 447–465. [Google Scholar] [CrossRef]
- Goethert, R.; Director, S. Incremental housing. Monday Dev. 2010, 9, 23–25. [Google Scholar]
- Nohn, M.; Goethert, R. Growing Up! The Search for High-Density Multi-Story Incremental Housing; SIGUS-MIT & TU Darmstadt: Cambridge, UK, 2017. [Google Scholar]
- Samper, J.; Marko, T. (Re)Building the City of Medellín: Beyond State Rhetoric vs. Personal Experience—A Call for Consolidated Synergies. In Housing and Belonging in Latin America; Berghahn Books: New York, NY, USA, 2015; Volume 105. [Google Scholar]
- Augustijn-Beckers, E.-W.; Flacke, J.; Retsios, B. Simulating informal settlement growth in Dar es Salaam, Tanzania: An agent-based housing model. Comput. Environ. Urban Syst. 2011, 35, 93–103. [Google Scholar] [CrossRef]
- Sobreira, F.; Gomes, M. The Geometry of Slums: Boundaries, packing and diversity. CASA 2001, 30, 24. [Google Scholar]
- Beardsley, J.; Werthmann, C. Improving Informal Settlements: Ideas from Latin America. Harvard Design Magazine Spring 2008, Can Designers Improve Life in Non-Formal Cities? 28, 31–34. Available online: https://www.harvarddesignmagazine.org/issues/28/improving-informal-settlements-ideas-from-latin-america (accessed on 25 January 2023).
- Sietchiping, R. Predicting and Preventing Slum Growth: Theory, Method, Implementation and Evaluation; VDM-Verlag Müller: Riga, Latvia, 2008; ISBN 3-639-03626-3. [Google Scholar]
- Patel, A. Slumulation: An integrated Simulation Framework to Explore Spatio-Temporal Dynamics of Slum Formation in Ahmedabad, India; George Mason University: Fairfax, VA, USA, 2012. [Google Scholar]
- Drummond, D. Architectes des Favelas; Pratiques de l’espace; Dunod: Paris, France, 1981; Volume 1, ISBN 2-04-012091-2. [Google Scholar]
- Mesa Sánchez, N.E. Proceso de Desarrollo de Los Asentamientos Populares No Controlados: Estudios de Caso Medellín; Repositorio Institucional UN, National University of Colombia: Bogota, Colombia, 1985. [Google Scholar]
- Williams, S.M. “Young Town” Growing Up: Four Decades Later: Self-Help Housing and Upgrading Lessons from a Squatter Neighborhood in Lima; Massachusetts Institute of Technology MIT: Cambridge, MA, USA, 2005. [Google Scholar]
- Owusu, M.; Kuffer, M.; Belgiu, M.; Grippa, T.; Lennert, M.; Georganos, S.; Vanhuysse, S. Towards user-driven earth observation-based slum mapping. Comput. Environ. Urban Syst. 2021, 89, 101681. [Google Scholar] [CrossRef]
- Samper, J. Atlas of Informality. Available online: www.atlasofinformality.com (accessed on 23 October 2020).
- Adams, C. Spatial Resolution of Google Earth Imagery. Available online: https://gis.stackexchange.com/ (accessed on 9 February 2023).
- Qi, F.; Zhai, J.Z.; Dang, G. Building height estimation using Google Earth. Energy Build. 2016, 118, 123–132. [Google Scholar] [CrossRef]
- Bohl, C.C.; Plater-Zyberk, E. The Transect—Building Community across the Rural-to-Urban Transect. Places 2005, 18, 4. [Google Scholar]
- Duany, A. Introduction to the special issue: The transect. J. Urban Des. 2002, 7, 251–260. [Google Scholar] [CrossRef]
- Hofmann, P.; Taubenböck, H.; Werthmann, C. Monitoring and Modelling of Informal Settlements-A Review on Recent Developments and Challenges. In Proceedings of the 2015 Joint Urban Remote Sensing Event (JURSE), Lausanne, Switzerland, 30 March–1 April 2015; pp. 1–4. [Google Scholar]
- Buhl, J.; Gautrais, J.; Reeves, N.; Solé, R.V.; Valverde, S.; Kuntz, P.; Theraulaz, G. Topological patterns in street networks of self-organized urban settlements. Eur. Phys. J. B-Condens. Matter Complex Syst. 2006, 49, 513–522. [Google Scholar] [CrossRef]
- Sheuya, S. Reconceptualizing housing finance in informal settlements: The case of Dar es Salaam, Tanzania. Environ. Urban. 2007, 19, 441–456. [Google Scholar] [CrossRef]
- Dovey, K. Informalising architecture: The challenge of informal settlements. Archit. Des. 2013, 83, 82–89. [Google Scholar] [CrossRef]
- Kamete, A.Y. Missing the point? Urban planning and the normalisation of ‘pathological’spaces in southern Africa. Trans. Inst. Br. Geogr. 2013, 38, 639–651. [Google Scholar] [CrossRef]
- Lindell, I. Introduction: Re-spatialising urban informality: Reconsidering the spatial politics of street work in the global South. Int. Dev. Plan. Rev. 2019, 41, 3–22. [Google Scholar] [CrossRef]
- O’Hare, G.; Abbott, D.; Barke, M. A review of slum housing policies in Mumbai. Cities 1998, 15, 269–283. [Google Scholar] [CrossRef]
- Arabindoo, P. Rhetoric of the ‘slum’ Rethinking urban poverty. City 2011, 15, 636–646. [Google Scholar] [CrossRef]
- Huchzermeyer, M. Troubling continuities: Use and utility of the term ‘slum.’. In The Routledge Handbook on Cities of the Global South; Routledge: Abingdon-on-Thames, UK, 2014; pp. 108–119. ISBN 0-203-38783-X. [Google Scholar]
- Samper, J. Overcrowding innovation: How informal settlements develop sustainable urban practices. In Retroactive; sixth edition of Lisbon Architecture Triennale; Circo de Ideias: Porto, Portugal, 2022; p. 120. ISBN 978-989-33-3797-4. [Google Scholar]
- Samper, J. INformality Process Strategies. In Does Effective Planning Really Exist? Syntagma: Berlin, Germany, 2018; pp. 69–86. ISBN 978-3-940548-60-3. [Google Scholar]
- Wurm, M.; Taubenböck, H. Detecting social groups from space–Assessment of remote sensing-based mapped morphological slums using income data. Remote Sens. Lett. 2018, 9, 41–50. [Google Scholar] [CrossRef]
Figure 1.
Informal development stages (IDS) in Santo Domingo Savio, Medellín, Colombia (maps of the urban form in 1969, 1994, and 2020) [13].
Figure 1.
Informal development stages (IDS) in Santo Domingo Savio, Medellín, Colombia (maps of the urban form in 1969, 1994, and 2020) [13].

Figure 2.
Methodological workflow. Describing the three phases of research: case selection, IDS fitment process, and the measurement of a 10,000 square meters sample of each case with all the IDS.
Figure 2.
Methodological workflow. Describing the three phases of research: case selection, IDS fitment process, and the measurement of a 10,000 square meters sample of each case with all the IDS.

Figure 3.
Example of a sample of 10,000 m2 at each IDS. Informal settlement of Maili Saba, Nairobi, Kenya.
Figure 3.
Example of a sample of 10,000 m2 at each IDS. Informal settlement of Maili Saba, Nairobi, Kenya.

Figure 4.
Cases per world region.

Figure 5.
Selected fifty informal settlements with the largest rate of change from the AoI.

Figure 6.
Case fitment into the IDS model, (a) IDS fitment for all the 50 cases, (b) number of cases per IDS, (c) percentage per IDS.
Figure 6.
Case fitment into the IDS model, (a) IDS fitment for all the 50 cases, (b) number of cases per IDS, (c) percentage per IDS.

Figure 7.
An Nuzhan, 2006, 2013, 2017, and 2022 unit change.

Figure 8.
Los Artesanos, 2010 to 2022. IDS evidence.

Figure 9.
Three IDS simultaneously in an informal settlement located at the city’s periphery. Nuevo Jerusalem, Bello, 2006–2021.
Figure 9.
Three IDS simultaneously in an informal settlement located at the city’s periphery. Nuevo Jerusalem, Bello, 2006–2021.

Figure 10.
Cultural and regional morphological differences across world regions.


Table 1.
Definition of slums, informal settlements, and inadequate housing (according to UN-Habitat) using a lack of services criteria.
Table 1.
Definition of slums, informal settlements, and inadequate housing (according to UN-Habitat) using a lack of services criteria.
| Lack of Services Criteria 1 | Slums | Informal Settlements | Inadequate Housing |
|---|---|---|---|
| access to water | X * | X * | X |
| access to sanitation | X * | X * | X |
| sufficient living area (overcrowding) | X * | X | |
| structural quality, durability, and location | X * | X * | X |
| security of tenure | X | X * | X |
| affordability | X * | ||
| accessibility | X | ||
| cultural adequacy | X |
1 Criteria defining Slums, Informal settlements, and Inadequate Housing; * presently measured; and empty cells are not included in the definition.
Table 2.
IDS results for samples of 10,000 sq. m. IDS1Y: IDS1 year mapped, A1m2: total area in IDS1 in square meters, IDS2Y: IDS2 year mapped, A2m2: total area in IDS2 in square meters, %C1–2: area change percentage from IDS1 to IDS2, YPer1–2: percentage of area coverage increase per year between IDS1 and IDS2, IDS3Y: IDS3 year mapped, A3m2: total area in IDS3 in square meters, %C2–3: area change percentage from IDS2 to IDS3, YPer2–3: percentage of area coverage increase per year between IDS2 and IDS3.
| Settlement Name | IDS1Y | A1m2 | IDS2Y | A2m2 | %C1–2 | YPer1–2 | IDS3Y | A3m2 | %C2–3 | YPer2–3 |
|---|---|---|---|---|---|---|---|---|---|---|
| Adbogbloshie | 2010 | 529.9 | 2014 | 1842.3 | 247.7% | 61.9% | 2017 | 2371.6 | 28.73% | 9.58% |
| Big Bend | 2004 | 421.6 | 2012 | 1947.9 | 362.1% | 45.3% | 2017 | 2550.5 | 30.94% | 6.19% |
| Comas | 2009 | 331.4 | 2013 | 2285.5 | 589.7% | 147.4% | 2018 | 3003.6 | 31.42% | 6.28% |
| eNkanini | 2009 | 1849.2 | 2011 | 2495.6 | 35.0% | 17.5% | 2021 | 5226.1 | 109.41% | 10.94% |
| Kamenge | 2007 | 347.6 | 2011 | 1509.7 | 334.3% | 83.6% | 2019 | 3283.4 | 117.48% | 14.69% |
| La Invacion | 2011 | 163.1 | 2013 | 1246.2 | 664.2% | 332.1% | 2020 | 5361.5 | 330.22% | 47.17% |
| Los Artesanos | 2011 | 1327.3 | 2014 | 3212.4 | 142.0% | 47.3% | 2019 | 6142.6 | 91.21% | 18.24% |
| Maili Saba | 2007 | 1077.8 | 2013 | 4473.0 | 315.0% | 52.5% | 2017 | 5037.8 | 12.63% | 3.16% |
| New Jerusalem | 2015 | 1250.3 | 2017 | 3425.3 | 174.0% | 87.0% | 2019 | 5396.7 | 57.55% | 28.78% |
| Rabounit | 2010 | 2344.2 | 2018 | 3176.2 | 35.5% | 4.4% | 2020 | 4090.5 | 28.79% | 14.39% |
| Sampaka | 2004 | 1332.6 | 2007 | 3052.4 | 129.1% | 43.0% | 2016 | 4126.5 | 35.19% | 3.91% |
| Sebkha | 2004 | 440.6 | 2010 | 1018.0 | 131.1% | 21.8% | 2019 | 3048.6 | 199.47% | 22.16% |
| Sebonkeng | 2010 | 894.3 | 2013 | 1590.4 | 77.8% | 25.9% | 2017 | 1774.6 | 11.58% | 2.90% |
| SenSokTy | 2002 | 1846.4 | 2010 | 3502.1 | 89.7% | 11.2% | 2017 | 5280.2 | 50.77% | 7.25% |
| Tahuantinsuyo | 2008 | 897.2 | 2013 | 3022.2 | 236.8% | 47.4% | 2019 | 3825.4 | 26.58% | 4.43% |
| Tork Abad | 2009 | 1836.4 | 2012 | 5437.4 | 196.1% | 65.4% | 2020 | 7677.5 | 41.20% | 5.15% |
| Toujonine | 2008 | 1310.6 | 2012 | 2293.2 | 75.0% | 18.7% | 2017 | 3500.4 | 52.64% | 10.53% |
| Total averages | 2008.12 | 1070.61 | 2012.53 | 2678.23 | 225.6% | 65.4% | 2018.35 | 4217.49 | 73.87% | 12.69% |
Disclaimer/Publisher’s Note: The statements, opinions and data contained in all publications are solely those of the individual author(s) and contributor(s) and not of MDPI and/or the editor(s). MDPI and/or the editor(s) disclaim responsibility for any injury to people or property resulting from any ideas, methods, instructions or products referred to in the content. |
© 2023 by the authors. Licensee MDPI, Basel, Switzerland. This article is an open access article distributed under the terms and conditions of the Creative Commons Attribution (CC BY) license (https://creativecommons.org/licenses/by/4.0/).
Share and Cite
MDPI and ACS Style
Samper, J.; Liao, W. Testing the Informal Development Stages Framework Globally: Exploring Self-Build Densification and Growth in Informal Settlements. Urban Sci. 2023, 7, 50. https://doi.org/10.3390/urbansci7020050
AMA Style
Samper J, Liao W. Testing the Informal Development Stages Framework Globally: Exploring Self-Build Densification and Growth in Informal Settlements. Urban Science. 2023; 7(2):50. https://doi.org/10.3390/urbansci7020050
Chicago/Turabian StyleSamper, Jota, and Weichun Liao. 2023. "Testing the Informal Development Stages Framework Globally: Exploring Self-Build Densification and Growth in Informal Settlements" Urban Science 7, no. 2: 50. https://doi.org/10.3390/urbansci7020050