
Sociodemographic Analysis of Disability in a Highly Depopulated Rural Region: The Case of Soria, Spain


1
Social Research Unit on Health and Rare Diseases, Department of Sociology and Social Work, Faculty of Business and Labour Sciences of Soria, University of Valladolid, 42004 Soria, Spain
2
Department of Geography, Faculty of Geography and History, Spanish Distance Learning University, 28040 Madrid, Spain
3
Social Research Unit on Health and Rare Diseases, Department of Pedagogy, Faculty of Education of Soria, University of Valladolid, 42004 Soria, Spain
4
GIR06—Psychological Research in the Digital Age, Faculty of Legal and Economic, Isabel I University, Sciences, 09003 Burgos, Spain
*
Author to whom correspondence should be addressed.
Urban Sci. 2023, 7(4), 112; https://doi.org/10.3390/urbansci7040112
Submission received: 4 August 2023
/
Revised: 23 September 2023
/
Accepted: 24 October 2023
/
Published: 26 October 2023
(This article belongs to the Special Issue Urban Agenda)
Abstract
:European regions with a lower population density have greater structural difficulties in ensuring that the daily life of their inhabitants matches that of more populated regions. This problem persists in groups of people who present some type of disability. Soria (Spain) is one of such regions. It is considered the most depopulated region of Southern Europe. Therefore, the aim of this study was to analyse the reality of people with disabilities in one of the provinces with a lower population density. It also seeks to explore the relationship between the perceptions and the reality of the existing structure to infer the promotions or limitations of agency. To this end, we conducted a systematic review of the existing literature, a sociogeographic study of the study context, and a mixed investigation. The results show that the greatest problem lies in the cities and towns located far away from the capital city, causing budget cutbacks and, therefore, reducing the attention to the needs of people with disabilities. However, social solidarity has increased, which is perceived as greater social inclusion for this group.
1. Introduction
Disability is a human reality that presents a large variety of faces and nuances; thus, we can assert that it is a biosocial phenomenon of great complexity due to the numerous aspects affected, which has generated the concept of the world of life. The idea of disability refers to the interaction between people who have some health problems and certain personal and environmental factors [1]. Thus, in order to approach this complexity, it is convenient to analyse the elements that constitute the sociotype of people with disabilities.
This concept implies the consideration of human relations and interactions among individuals of said group with their environment [2]. These authors based their study on the work of Berry [3] and reported that the term sociotype is an integrating concept that comprises internal and external factors, combining biological, psychological and social aspects.
Usually, it is considered that there are different types of disabilities, and these are usually limited to the following: auditory, intellectual, visual and physical. Moreover, they are also differentiated between congenital and acquired or unforeseeable disabilities [4]. Depending on the reality of each person and her/his limitations, the sociotype may be nuanced. In the present work, we performed a generic analysis of a person with a disability sociotype and how it is modulated by the sociogeographic context of depopulation.
The studies about the perception of people with disabilities toward areas with low population density are not frequent. The studies we found (Table 1) are mainly related to biomedical aspects: osteoporosis, obesity, cardiovascular diseases, etc. In our documentary analysis, we identified four articles with certain interest for our objectives. However, none of them were related to analyses of life perception. These studies analyse the importance of context in its relationship with disability, showing the relevance of social structure for our sociotype.
Berry [3] stated that the concept of sociotype is a conceptual framework that allows understanding the interactions between the social, cultural and environmental scopes. This framework influences the life-long growth, development and behaviour of a person, including his/her relationships, lifestyle and coping strategies. In this sense, it could be added that the sociotype is strongly related to agency (action capacity), which is influenced by the conditioning factors of each sociotype.
Margaret Archer established an analysis of the Social System based on two major dimensions: agency and structure. For this author, neither agency nor structure can separately determine human action. Human action requires the reflectivity that operates as a mediator between social structure and agency [9,10]. Therefore, this author considers that, at the internal level, there is a process that allows people to make decisions about their actions. Archer proposes a relationship between agency and structure through time [10]. In this sense, agency is related to structure and, lastly, the latter is also influenced by agency. Based on this idea, Archer considers that social agents are strongly related to structure, since these are the different existing social institutions.
The Archerian perspective, although useful, suffers from a certain subjectivism, as well as certain structuralism. Thus, it does not consider the phenomena of incorporation of people in their social environment, that is, the intermediate processes between the subjective elements and the objective–structural elements. In fact, Caetano [11] stated that Archer minimises social factors such as social origins, family socialisation, externality internalisation processes, the role of other structure–agency mediation mechanisms, and the persistence of social reproduction. However, Archer’s perspective is sufficient to attain the objectives of the present study.
This work is focused on the concept of agency in people with disabilities and, more specifically, the perception and experience of this group in areas of low population density. This study is based on the premise that living in an area with a considerable demographic decline can substantially intensify the difficulties of a social group with a “low agency level” [12]. In this sense, we assert that the structure of the system influences the agency of people. Thus, the European regions with lower population density will have greater structural difficulties to ensure that the social agency of their inhabitants matches that of more populated areas. Furthermore, this problem is even greater in groups of people with disabilities.
Therefore, the present study is focused on one of the most depopulated territories of Southern Europe with the lowest population density: Soria (Spain). We begin by providing context for the province of Soria, highlighting its status as one of the most sparsely populated regions in all of Europe, and its prominent position within the group of sparsely populated regions in Southern Europe. As can be observed in Table 2 (where the most updated European data are shown, 2019), the greatest European depopulation is concentrated in the regions of said continent and in some of the regions that are not geographically located in the European continent (Guyane). According to Van Herwijnen et al. [13], many of the rural areas that suffer the most from demographic decline are located in Southern Europe. Some of these regions are Bulgaria, Greece, Il Mezzogiorno (Southern Italy), northeastern Spain and Portugal, as well as islands such as Sicily and Sardinia. However, the data about population density show that Soria is the most depopulated province of Southern Europe, although its depopulation level is somewhat stable.
Next, we will elucidate the methodology employed to fulfill our objectives, followed by an exposition of the results derived from the application of this methodology. We will also offer a succinct section delineating the limitations we encountered during the study. Finally, we will expound upon the pivotal conclusions we have gleaned from our research endeavours.
2. Objectives
Through this research, we aim to gain insights into the challenges faced by individuals with disabilities residing in an extensively depopulated region. To accomplish this, we outline the following specific objectives:
O1: analyse the social structure in the most depopulated region of Southern Europe and determine how it hinders or favours the study sociotype.
O2: explore the relationship between the perceptions and the reality of the existing structure to infer the promotions or limitations of agency.
3. Methodology
This is an instrumental case study of the most depopulated province of Southern Europe. Following Stake [14], this study is instrumental for not being exclusively limited to the described area, since the aim is to extend it (as an operational model) to other areas of Southern Europe in demographic decline. In order to delve into the difficulties of people with disabilities in the most depopulated area of Southern Europe, at the beginning of 2020, a study was conducted in three different phases: documentary analysis, sociodemographic study and mixed investigation.
Bricout and Gray [15] stated that research requires a mixed approach, incorporating historical evidence, the analysis of those critical elements for the phenomenon under study, mixed-methods investigation, and repeated measures in adequate time intervals. Therefore, this multiple approach was selected for the present study.
3.1. Documentary Analysis
In the documentary study, which was carried out during April 2022, different information searches were conducted in different databases (specifically in Web of Science and SCOPUS), with the aim of performing a review of the articles published to date. Our analysis was based on the following searches: Disability + Europe + Depopulation = 1 paper; Disability + Europe + Society + Perception = 18 papers in WOS and 17 papers in SCOPUS (none of the articles mentioned low-population areas); Disability + Europe + “Low Population” = 2 papers in WOS and 0 in SCOPUS (1 related in Russian); Disability + Europe + “Population density” = 19 papers in WOS and 2 in SCOPUS (2 related); Disability + Europe + Population + Density = 100 papers in WOS and 24 in SCOPUS (1 related). This analysis was complementary to other studies conducted.
3.2. Sociodemographic Study
For the socio-geographic analysis, the demographic sources from the Spanish Institute of Statistics (INE) were used, specifically population censuses and registers of different years (https://www.ine.es/dyngs/INEbase/es/categoria.htm?c=Estadistica_P&cid=1254734710984 (accessed on 10 May 2023)). The population censuses are used in numerous countries for demographic studies [16,17,18]. To determine the historical evolution of the population of the province of Soria, from the year 1900 to the year 2021, the data of the censuses were used. The population censuses gather, analyse and publish the demographic, cultural, economic and social data of the inhabitants of the country, as well as the data of the different administrative divisions (regional, provincial, municipal…, etc.) related to a given date or period. They are carried out every ten years and were traditionally published in the years ending in 0. Thus, for the present study, we used the censuses of 1900, 1910, 1920, 1930, 1940, 1950, 1960 and 1970; after the 1970 census, the censuses began to be published in the years ending in 1. Therefore, the rest of the censuses used in this work were those of 1981, 1991, 2001, 2011 and 2021.
To build the population pyramids, which reflect the population structure by sex and age, we used the data from the Population Register of the province of Soria for January 2021. The Municipal Register is an administrative register that gathers the neighbours of a municipality and whose revision is the responsibility of the town halls, which are in charge of informing the INE about the monthly variations that occur in the data of their municipal registers.
The demographic information is completed with that provided by the INE through the 2012 Social Integration and Health Survey (https://www.ine.es/dyngs/INEbase/es/operacion.htm?c=Estadistica_C&cid=1254736176987&menu=resultados&idp=1254735573175 (accessed on 10 May 2023)), the survey of the Government of Castile and Leon (in the social services website) (https://serviciossociales.jcyl.es/web/es/servicios-sociales.html (accessed on 21 June 2023)), which shows the situation of people with disabilities in the autonomous community and the information related to the Social Action Centres (C.E.A.S.) obtained from the website of the Council of Soria (https://www.dipsoria.es/areas-diputacion/servicios-sociales/actividades-servicios-sociales (accessed on 06 July 2023)). With all this information, a series of cartograms were performed, which allowed for the visualisation of this information and showed its distribution throughout the territory, enabling comparisons among different geographic spaces. For the development of this mapping, we used ArcGis (ArcMap) software v.10.6. Maps of proportional symbols and choropleths were generated, which allowed representing zonal phenomena with absolute or relative values [19,20,21]. For the map of proportional symbols, i.e., the one related to the distribution of people with disabilities by Autonomous Community, the intervals were manually defined to better show the similarities/differences among the different Spanish regions. For the map of choropleths, that is, the one that presents the population density and variation, the colour palettes used allow identifying the existing similarities and differences among the municipalities of the province of Soria. For the graphs and tables, the Excel 2019 spreadsheet software was employed.
3.3. Mixed Investigation
In the quantitative study, an online questionnaire was developed, which gathered information about aspects related to mobility, specifically the state of the streets of their cities, as well as the accessibility to buildings and public transportation. The quantitative study presented difficulties and was completed by a small number of people. The reasons for this low response rate are analysed in the Limitations section. The questionnaire was responded to by 37 people (16 women and 21 men). Moreover, the number of responses from people over 60 years of age was also limited. Considering that, in the province of Soria in 2019, there were 6759 people with disabilities, the level of statistical significance of the data is low (the margin of error reached 16.07%, with 95% confidence interval). Of the analysed sample, 86.49% lived in the city of Soria, and 13.51% lived in the rest of the province; 22 people presented some administratively recognised disability, and 15 people did not have any type of administrative disability. The age of the participants is shown in Table 3. All this implies certain limitations in the quantitative data, granting them an illustrative character.
After determining these limitations in the quantitative information, these data were completed with a qualitative study. In this way, the study was completed and acquired greater depth, providing a complete and comprehensive view of the situation of this depopulated region. In this sense, the qualitative analysis was conducted based on a focal discussion group with 6 people who were strongly related to the scope of disability. All of these participants were workers in some association related to disability and had extensive knowledge on the reality of this issue in the province of Soria. The discussion group lasted two and a half hours and was conducted on 30 January 2020 at the campus of the University of Valladolid at Soria.
4. Results
4.1. Sociodemographic Analysis
4.1.1. Disability at the Regional Level
According to the data of the Spanish Secretariat of Social Services (2019), Castile and Leon was, in 2019, the fourth region in the whole of the Spanish territory with the largest number of applications to the system requesting autonomy and attention to dependency. The profiles of people who can enter this system are gathered in Article 2 of Law 39/2006, of 14 December, on the Promotion of Personal Autonomy and Attention to people in a situation of dependency, that is, those in a permanent state of dependency derived from age, disability or disease, and those with a lack or loss of physical, mental, intellectual or sensory autonomy.
Firstly, Andalusia is the region that recorded the largest number of applications (21.61%) of the total Spanish territory, followed by Catalonia and the Community of Madrid (17.97% and 11.94%, respectively). In the fourth place, Castile and Leon recorded 7.87% of applications, followed by the Community of Valencia, despite the fact that the population of the former (2,383,139) is 2.5 times smaller than that of the latter (5,058,138). After analysing the data as a function of the relationship between the number of applications and the total population of each Autonomous Community (AC), a significant change occurred: Castile and Leon was the region with the largest number of applications (5.95%), followed by Extremadura (5.16%) and La Rioja (4.86%).
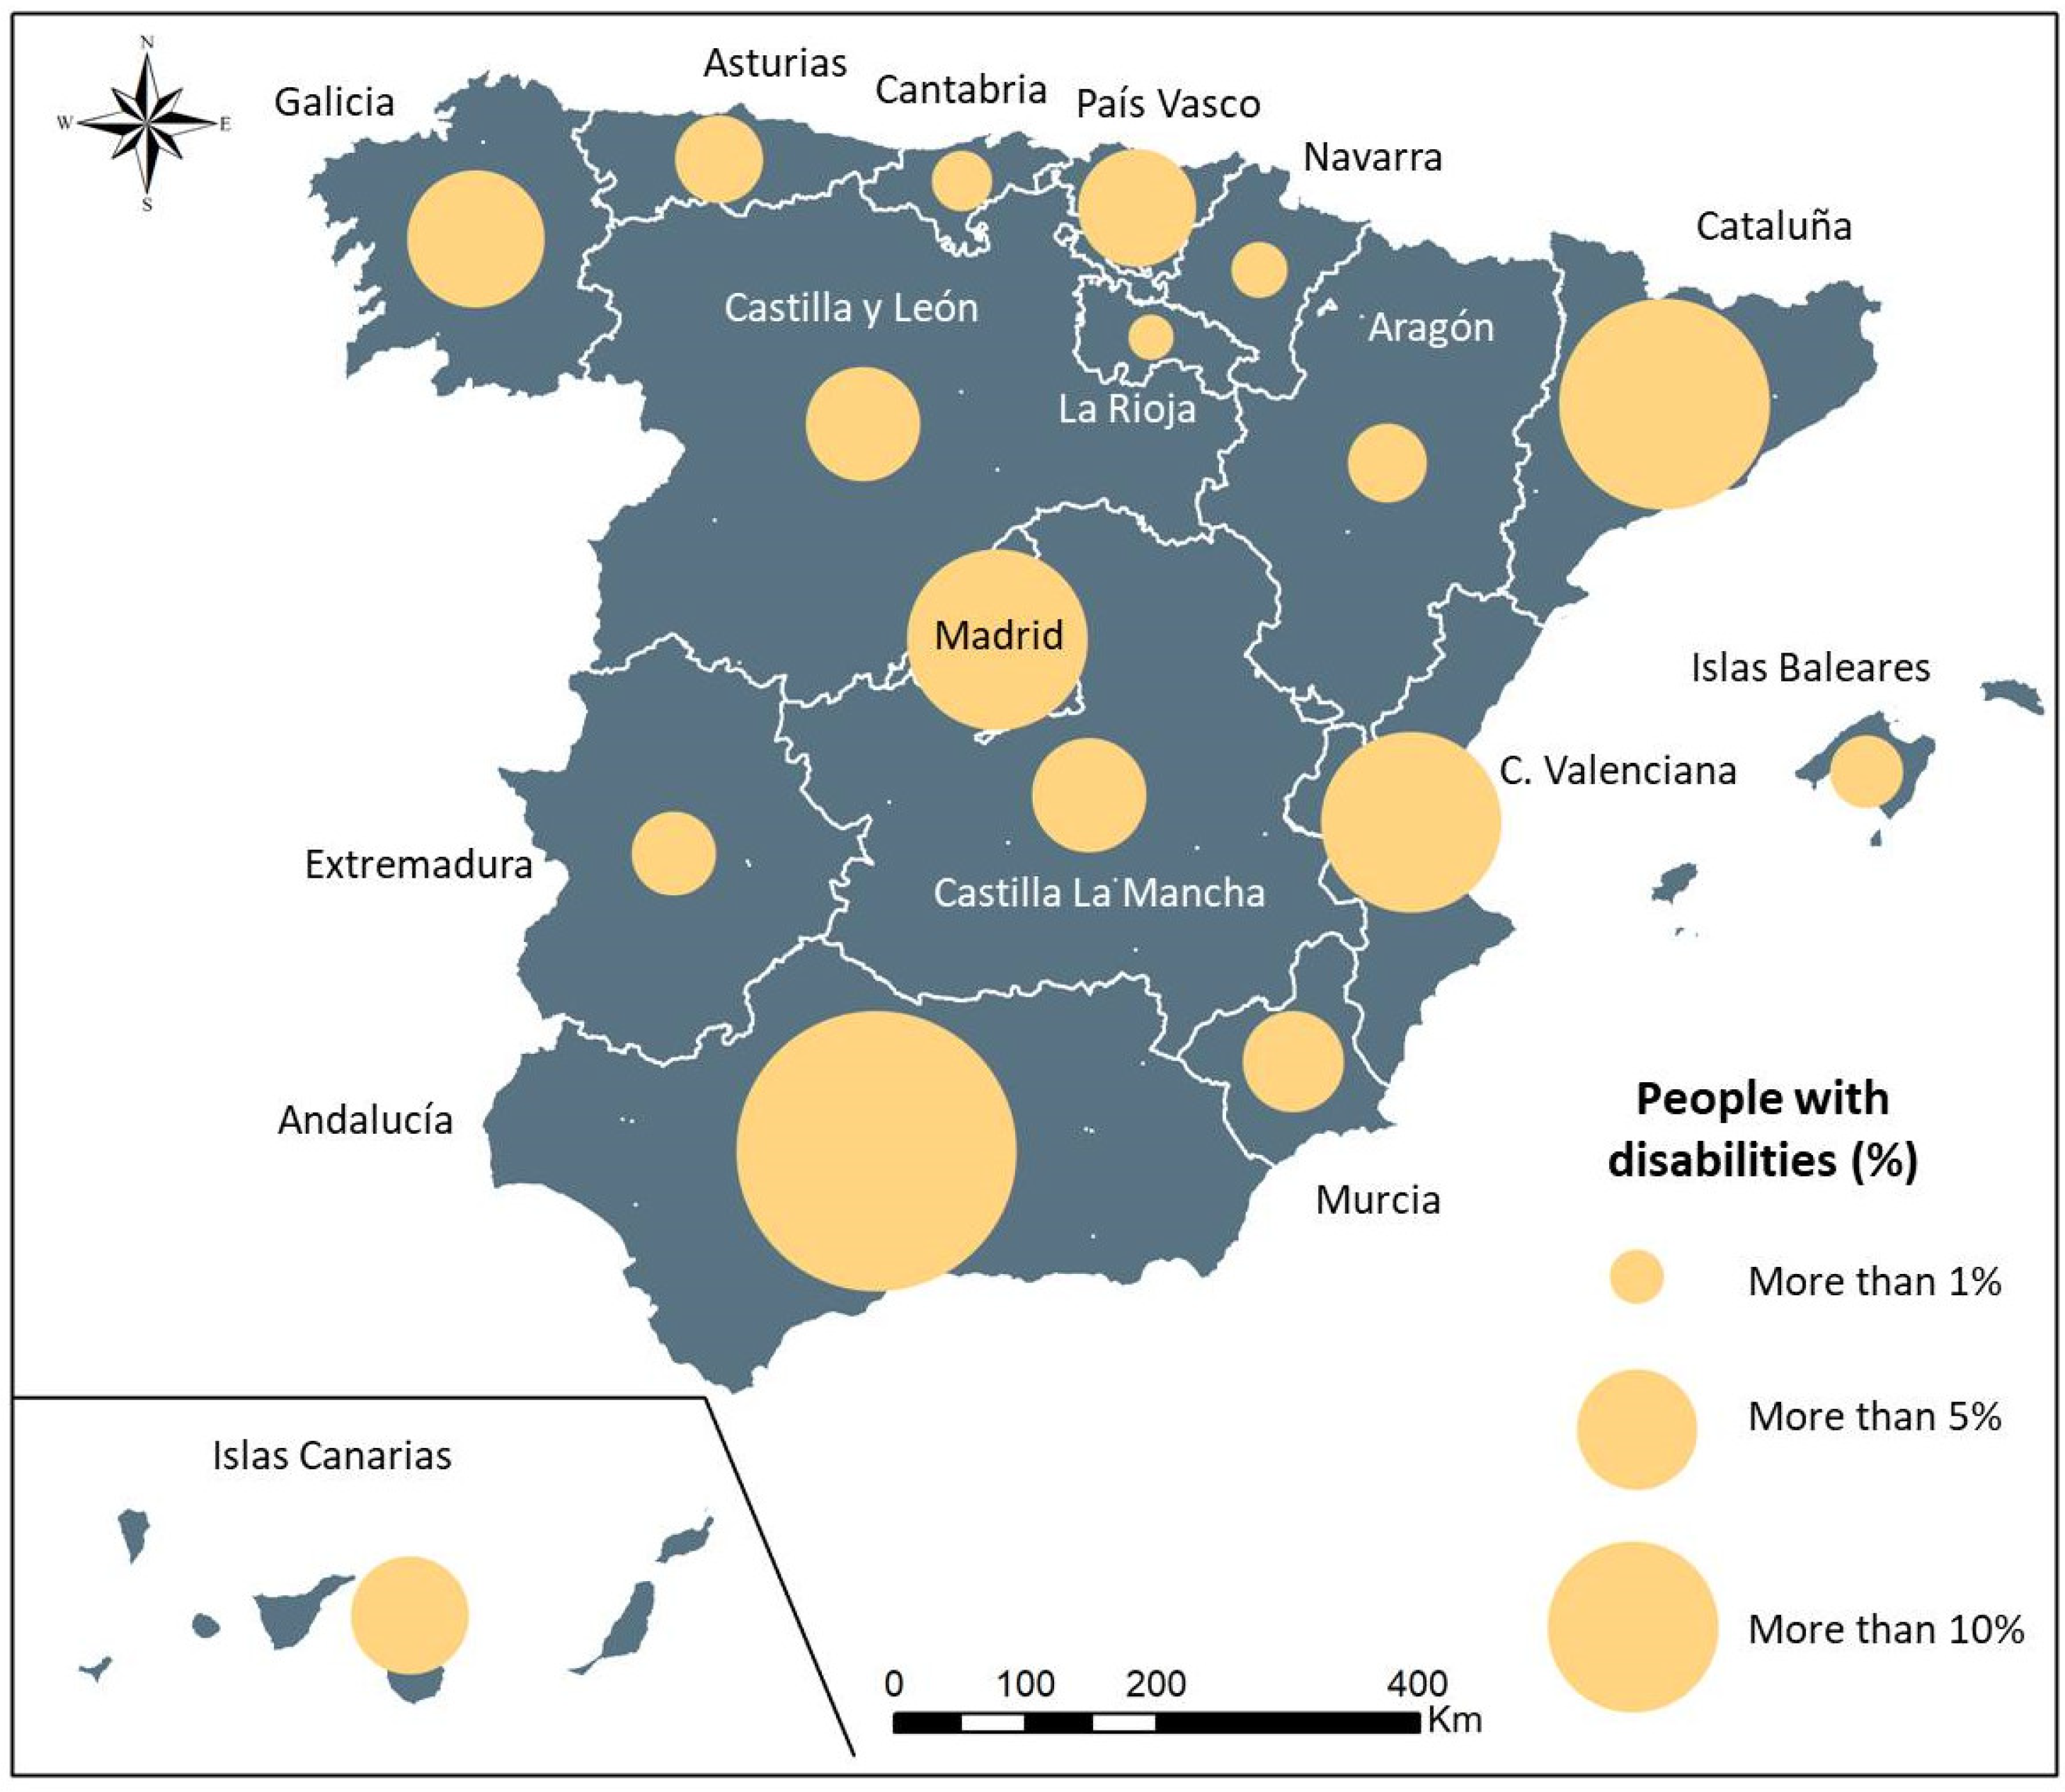
The applications to the system requesting autonomy and attention to dependency are an indicator that shows, in part, the existing situation and the possible number of people who may have their disability legally registered. However, a more real view is provided by the Social Integration and Health Survey (2012), which shows the distribution, by autonomous communities and percentages, of disability in Spain, that is, of the people who have administratively recognised disabilities (Figure 1).
The largest number of people is concentrated in Andalusia, with a fifth of the Spanish total (20.96%), followed by Catalonia (15.37%), the Community of Valencia (11.30%) and the Community of Madrid (11.12%). These four regions combined gather over half of the people with disabilities in the whole of the country, specifically 58.75%. It is important to mention that these four communities are the most populated communities in Spain, and they gather 58.91% of all the inhabitants of the country; that is, there is a correspondence between the total population and people with disabilities. This is not the case for surface distribution, since all these people live in 29.8% of the Spanish territory. These communities are followed by Galicia (6.47%), the Canary Islands (4.78%), the Basque Country (4.86%) and Castile and Leon (4.52%). These are autonomous communities with smaller populations compared to the previous communities, and therefore, they show a smaller total number of people with disabilities. They are in an intermediate level between the most populated regions and the following group of territories with a smaller number of inhabitants and lower population with disabilities, such as Cantabria, the Balearic Islands, Extremadura and La Rioja (Figure 1).
It is in the territory scope where problems emerge regarding accessibility to certain services and the lack of specialised equipment and centres required by this population group. A total of 41.25% of the population with disabilities is located in 70.2% of the Spanish territory, which coincides with the most aged regions, whose population is decreasing, presenting important structural problems.
Analysing the situation in Castile and Leon, the temporal data allow studying the evolution of the population with disabilities in this region. There are available data about the total number of cases between the years 2007 and 2018 (Government of Castile and Leon, 2018) by age groups and sex. In 2007, the number of cases was 152,037, whereas in 2018, the number of cases was 176,336; that is, an increase of 24,299 new cases of people with disabilities was recorded. These numbers indicate that 7.32% of the inhabitants of this Autonomous Community had some type of administratively recognised disability. The main cause that explains this increase is the ageing of Castile and Leon, which is a situation that implies the need for greater investment in daily social and care services. According to the data of the INE in 2018, the percentage of inhabitants aged 65 years and older in Spain was 19.07%, i.e., six points below the numbers of Castile and Leon, whose ageing data exceeded 25% of the population. Specifically, in this autonomous community, 25.06% of the population was over 65 years of age, which made it the second most aged region of Spain after Asturias (25.25%) and followed by Galicia (24.91%).
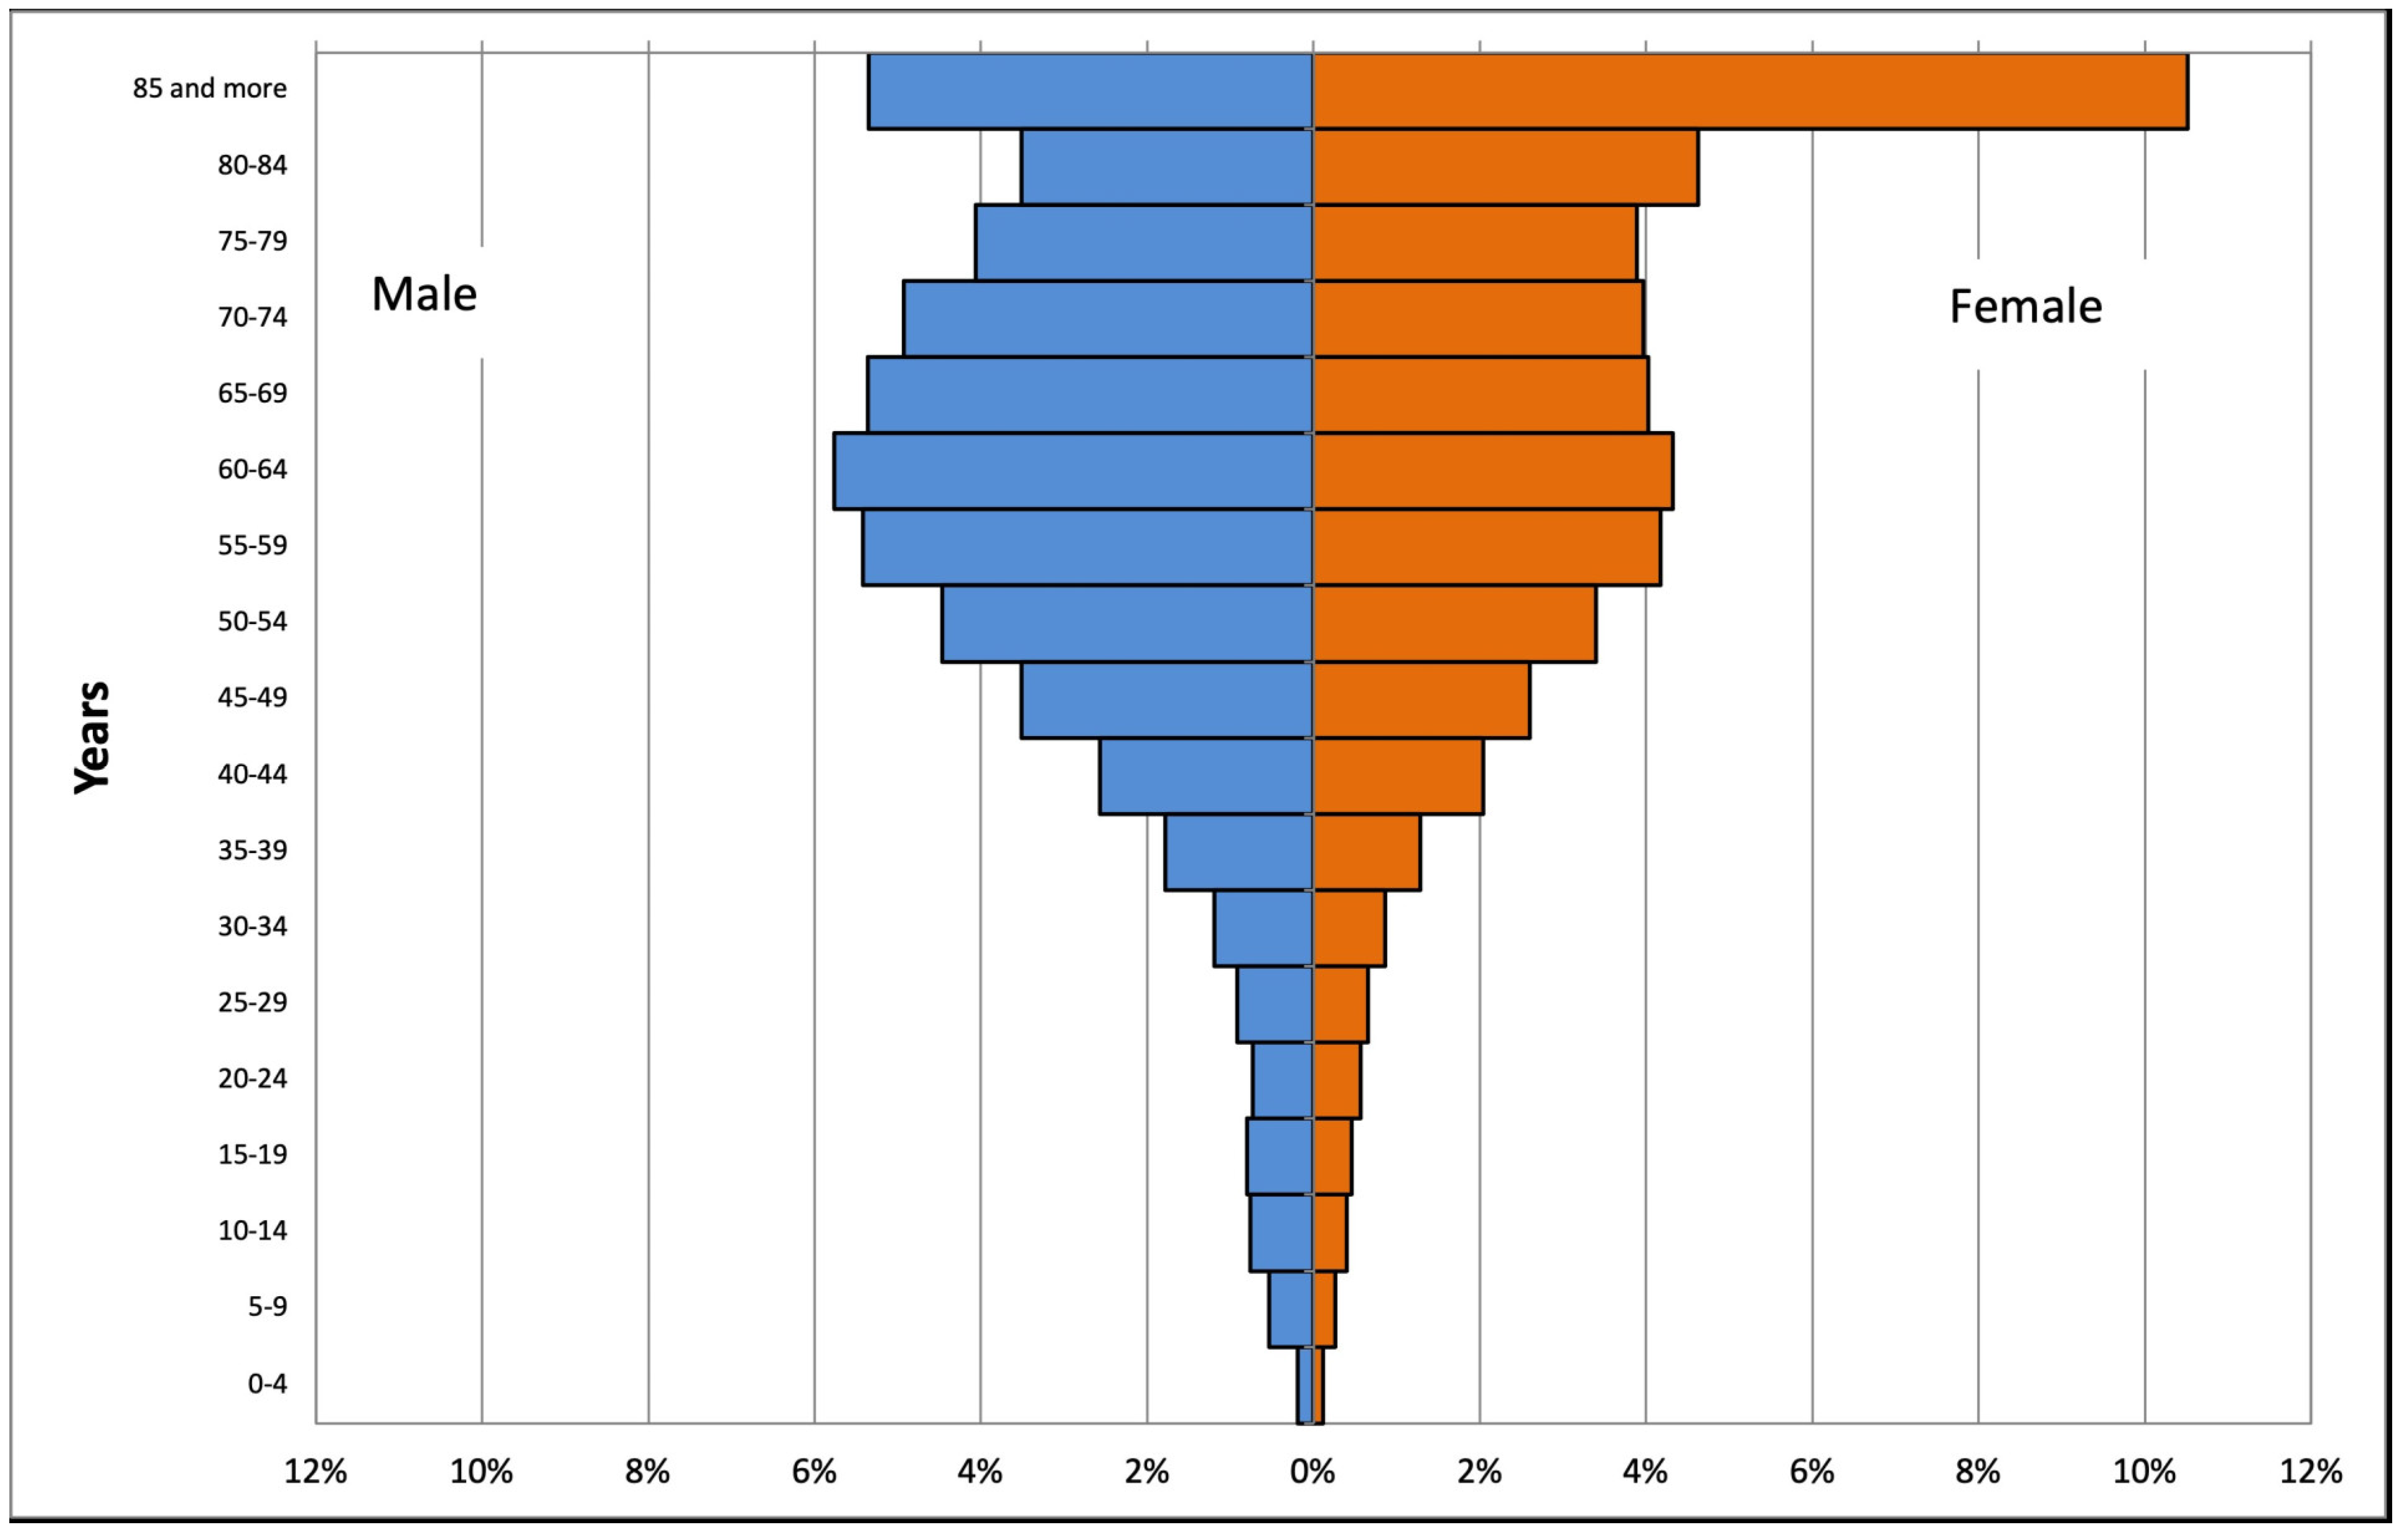
With respect to sex, the global difference between men and women was very small. In 2007, there were more women with disabilities than men, with percentages of 50.38% and 49.62%, respectively. However, in 2018, men represented 51.87% of people with disabilities, whereas women represented 48.13%. Regarding age groups, greater differences were found (Figure 2). In the older cohorts, the number of people with disabilities was larger. In this way, in the group of young inhabitants (0 to 14 years), the population with disabilities represented 2.26%, whereas for the group of 15–64 years, the population with disabilities represented 47.50%. More significant numbers were identified for the group that was 65 years and older, with more than half of the people with disabilities (50.24%), partly due to the characteristic ageing of the region of Castile and Leon, with an increasingly older and more dependent population that requires a series of care services. Within this last group, it is worth highlighting the difference between men and women in the cohort of 85 years and older. In this population group, there are twice as many women with disabilities compared to men: 10.52% of women versus 5.35% of men. The causes of this phenomenon are, as previously mentioned, the ageing of the population and the greater life expectancy of women, which makes them more numerous than men in this age group. With regard to the group of men, disability is more frequent in males than in females in practically the entire pyramid, from 0 to 79 years. The greatest differences are found in the group of 50–69 years, where the variation between men and women is over one point and, in some cases, it reaches almost one and a half points in favour of men, due to disabilities derived from certain jobs traditionally associated with men.
According to the 2012 Social Integration and Health Survey conducted by the INE, the main limitation of this population group, both in the whole of Spain and in Castile and Leon, was being homebound, since over 50% of the people perceived it as a barrier to carry out their activities of daily living, mainly due to the maladaptation of buildings to their needs. It is worth pointing out the problems related to transportation, which is worse and less adapted in Castile and Leon, where 43.27% of people report encountering difficulties, compared to 29.87% of the population in the whole of Spain. Other important barriers are found in the realisation of cultural and leisure activities, with very high percentages, with the general Spanish population reaching 70% and that of Castile and Leon exceeding this percentage. The access to and mobility in buildings, as well as access to adequate employment, continue to present impediments for the daily living of people with disabilities. In regard to access to the Internet and social contact and support, the barriers have been practically removed.
4.1.2. The Local Context: Soria
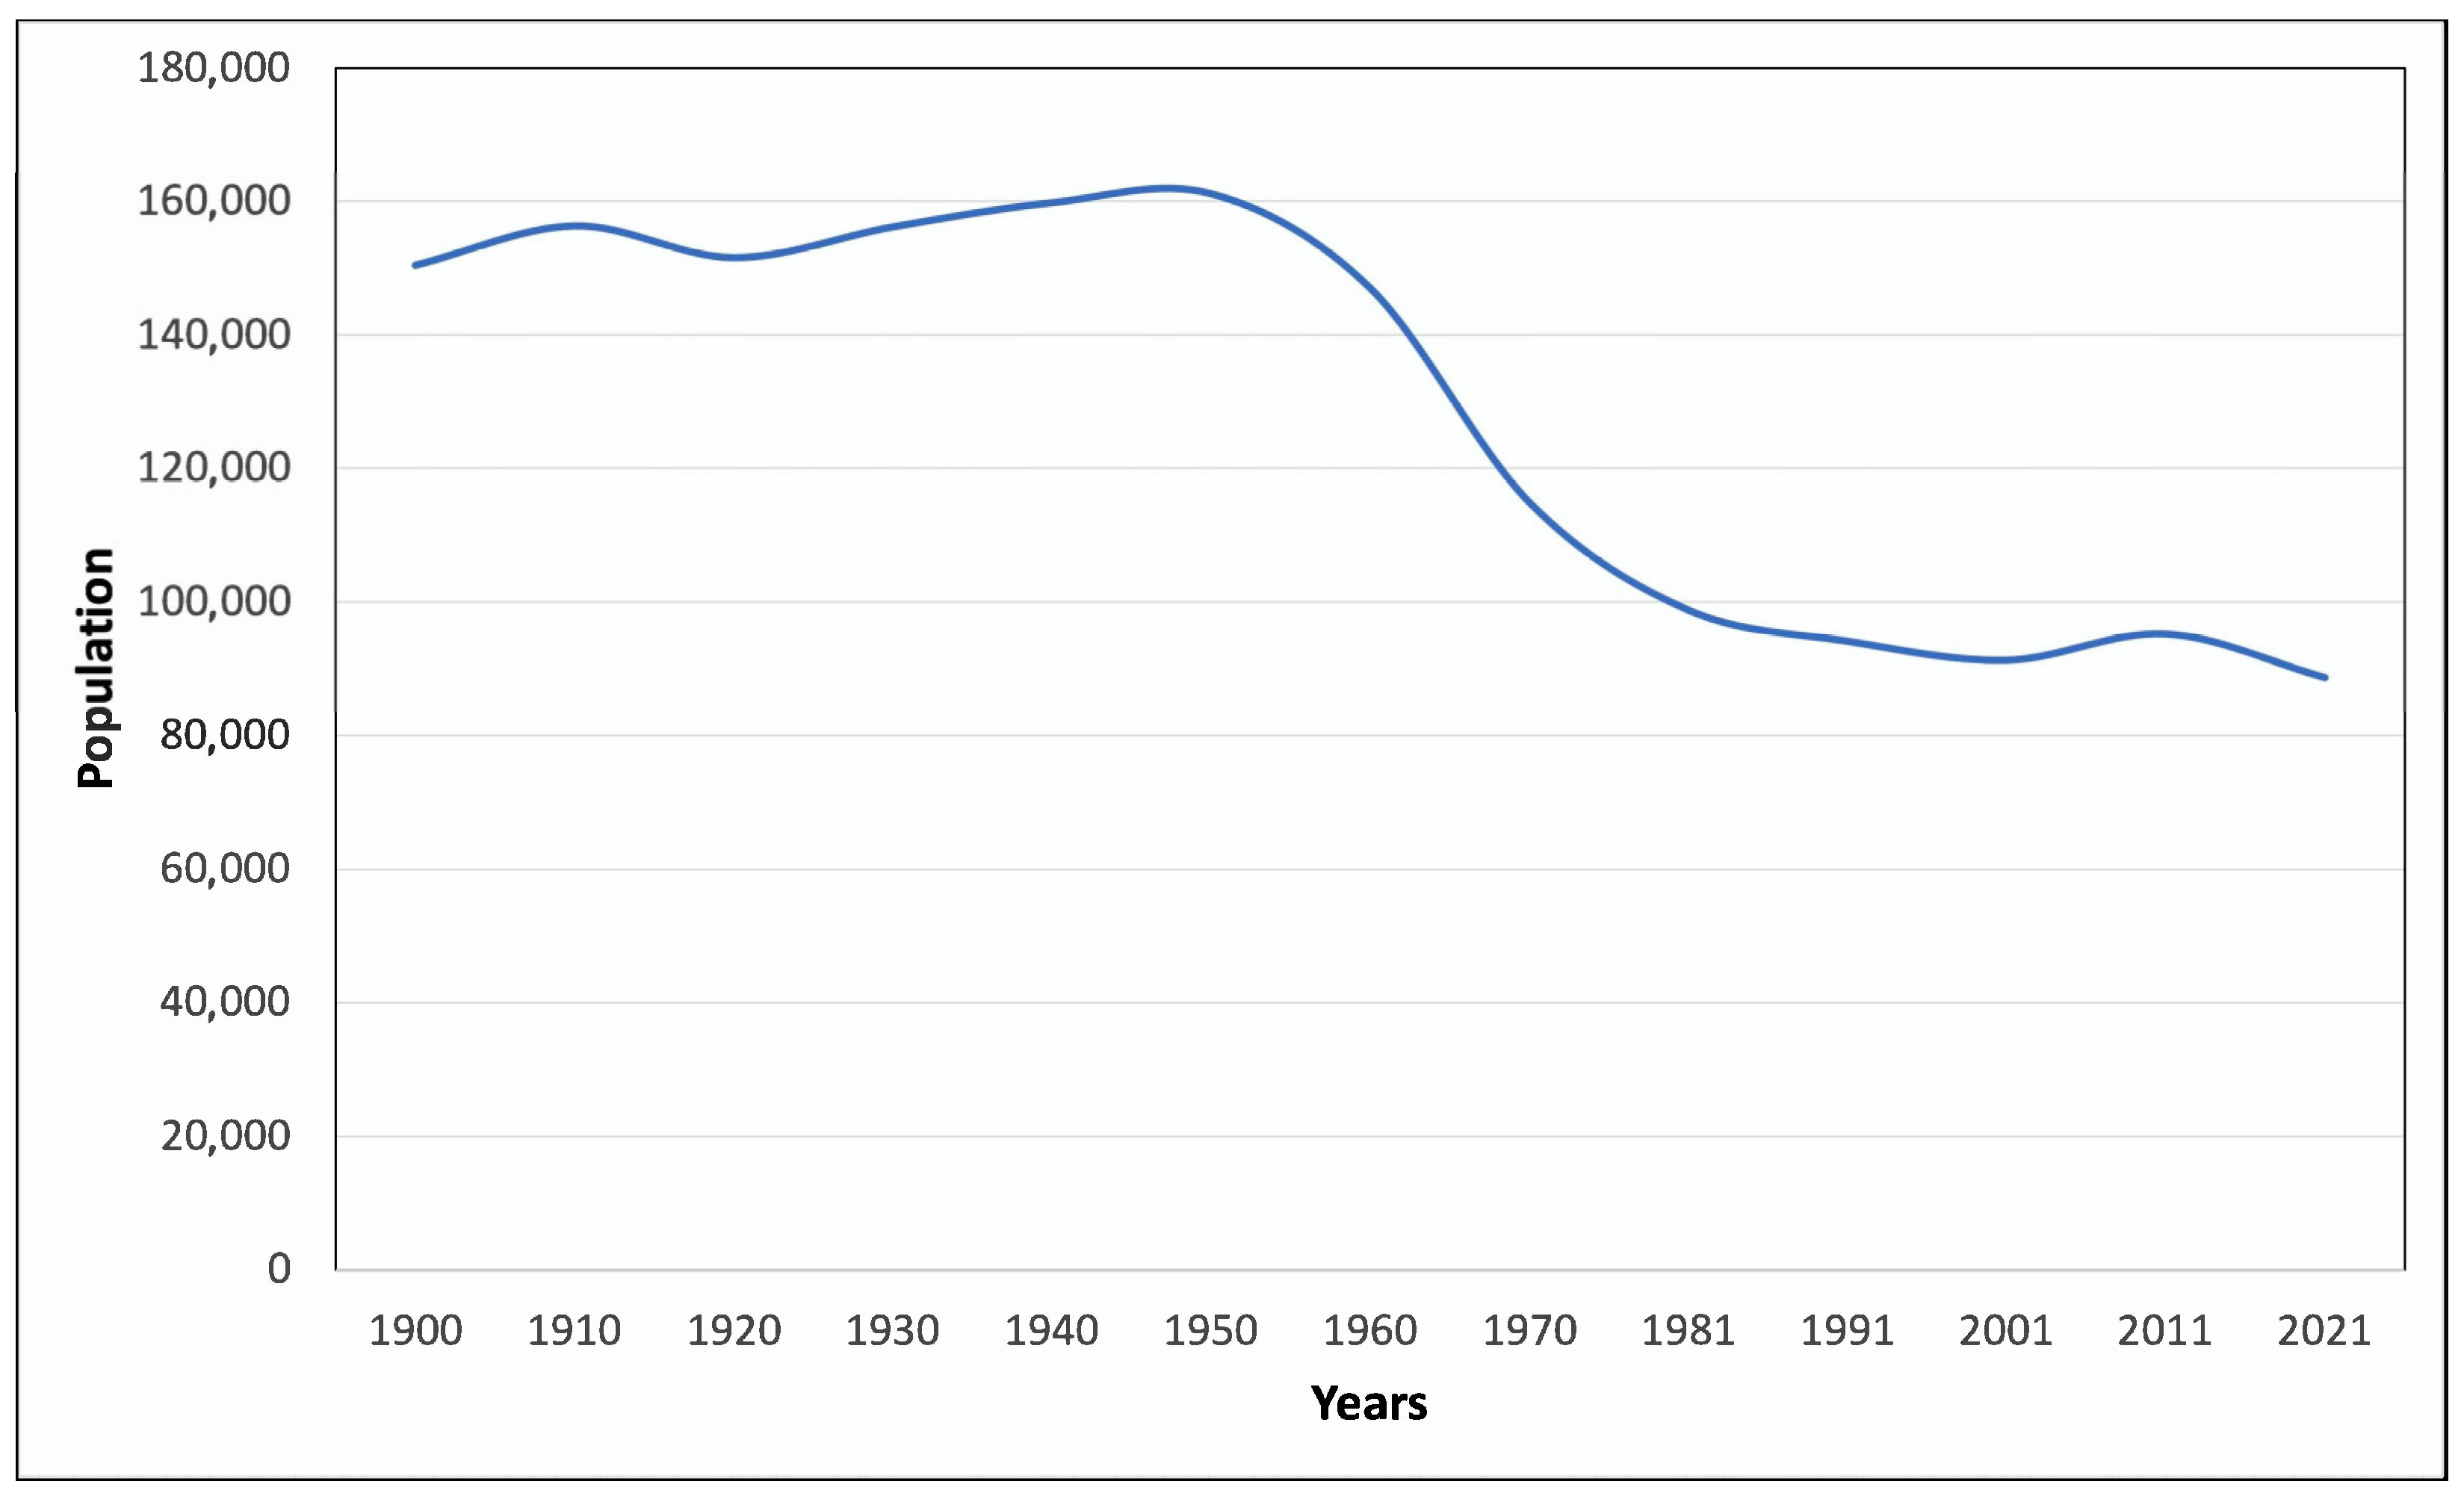
The province of Soria presents sociodemographic characteristics that influence the economic scope and its territory. The evolution of the population between the years 1900 and 2020 shows a sharp decrease in the number of inhabitants from 150,000 in 1900 to merely 90,000 in 2020. That is, in absolute numbers, it has lost a total of 61,578 inhabitants, which poses a 40.93% lower population compared to the year 1900 (Figure 3). This decrease began in the mid-20th century, specifically in the decade of 1950–1960, when the process of rural flight took place, that is, the moving of the population from the rural areas to the urban areas, in search of new opportunities in the industrial and service sectors, due to the employment decline in agricultural activity as a consequence of the technical and technological reforms that occurred in the agricultural sector. The result of this change was the constant decrease in the population in the province, with people moving to industrial development areas such as those in Zaragoza and Valladolid, industrial promotion areas such as that in Burgos, the industrial regions of the Basque Country, and the Community of Madrid. The latter, in addition to being the capital of Spain, offered greater opportunities in the service sector.
The population decrease is associated with a decrease in population density, which has always been low, i.e., around 15 people per square kilometre (people/km2) in the years that recorded the highest population in the province (1900–1950), decreasing to less than 10 people/km2 from 1981 to 2020, with a population density of 8.62 people/km2, thereby considering this territory as a demographic desert. Comparing these data for the year 2020 with those of Castile and Leon as a whole (25.42 people/km2) and Spain (93.78 people/km2), the numbers of the province of Soria are very low.
By municipality (Figure 4), of the 183 municipalities of the province, 153 (83.61% of the total) have a population below five people/km2, of which 37 have less than one person/km2. These numbers show the agonising situation of practically the entire province of Soria. The highest density is found in the city of Soria, with 146.64 people/km2, which also concentrates 44.8% of the population of this province. The capital is followed by Salduero, with 56.44 people/km2. In this case, this municipality has very little representation, as it has a very small population (152 inhabitants), distributed in a surface of only 2.69 km2. The cases of Ólvega, San Leonardo de Yagüe and Almazán are more significant, with 37.23 people/km2, 33.93 people/km2 and 32.91 people/km2, respectively; these localities have more than 1000 inhabitants each and operate as regional hubs, with a greater population concentration and greater development and economic diversity. Of the 183 localities of the province, only ten of them showed a population increase (Figure 4), whereas the other 173 presented a population decrease.
The structure by sex and age shows a very aged society due to the increase in the population over 65 years of age and the overageing of people over 84 years of age (population groups with a greater proportion of recognised disabilities). The birth rates decrease, the young population groups are increasingly narrower, as can be observed in the bottom of the population pyramid, and people are increasingly older (Figure 5).
The youngest group (0–14 years) represents 12.10% of the population, the age group of 15–64 years represents 62.32%, and the oldest group (65 years and older) represents 25.58%. The differences with Spain are great since, in the whole of the country, the percentage of the population aged 0–14 years is 14.40% and that of 65 years and older is 19.43%, which is also a worrying percentage since the ageing degree of the Spanish population is also high. Therefore, it is necessary to invest in social policies for the most disadvantaged population groups that are in full and constant growth.
The reality of disability in the province of Soria is influenced by its economic, social and demographic situation. As can be observed, the province of Soria presents an unbalanced population structure in terms of territory, characterised by a great degree of ageing, which influences the sociotype of people with disabilities. In fact, an important part of the sociotype of people with disabilities is constituted by older people (Figure 6).
In 2019, in the province of Soria, there were a total of 6759 people with disabilities, predominantly physical disabilities (64.90%), followed by intellectual disabilities (9.38%), mental disabilities (13.33%), visual disabilities (6.98%), and auditory disabilities (5.40%) (data from the Social Services of the Government of Castile and Leon, 2019). Cases of deaf-blind people have not been registered. Due to the important percentage of people with disabilities, this situation may lead the rest of the disabilities to remain invisible to some extent, or even marginalised in some cases by the administrations and social groups in the making of certain decisions that affect their daily living. According to the degree of disability, 51.16% range between 33 and 64% of disability, 27.05% range between 64 and 74%, and 21.79% have 75% or higher.
Figure 6 shows, as in the case of the situation of Castile and Leon, a sharp increase in adult people with disabilities, specifically from the age of 40 years, increasing year by year. It is worth highlighting the percentage of women aged 85 years and older, with 13.45% of all the people with disabilities, compared to 6.13% of men. Once again, this is due to the larger number of women in these age ranges. Therefore, the sociotype of people with disabilities is fundamentally represented by people over 50 years of age.
Regarding the place of residence, it is possible to distinguish those people who live in urban areas, that is, with populations of over 10,000 inhabitants, from those who live in rural areas. In the case of the province of Soria, the only locality with this characteristic is the city of Soria, with the other 182 municipalities belonging to the category of rural localities with less than 10,000 inhabitants. The urban habitat concentrates 48.54% of the people with disabilities, whereas the rural areas have the other 51.45%. The fact that over half of these people live in rural areas implies a series of associated problems, such as the scarcity of services and difficulties related to mobility. The smallest municipalities, i.e., those with less than 500 inhabitants, represent 89.62% of all the municipalities of the province, and these are the ones that report the largest number of problems. Thus, there are a total of 10 Social Action Centres (CEAS), which are shared among several municipalities and distributed throughout the entire province, and they struggle to alleviate this situation. In addition to these CEAS, social services are also provided by the town halls and associations of people affected by some disability, such as ASAMIS, ASOVICA-FADESS, Asociación Autismo Soria, FADISO (integrated by ALCER Soria, FRATER, ASPACE Soria and Parkinson Social), the Ande Soria Cultural Association, etc., which provide socio-healthcare attention to people with some type of disability.
4.2. Descriptive Quantitative Study
Based on the information reported by our informants, the general valuation of the situation is positive since 27 people valued this situation with a score of ≥5. This score is in disagreement with Figure 7, which shows a negative perception of accessibility in the towns and cities of residence.
In regard to accessibility to public buildings, 28 of the 37 participants gave a score of ≥5 to this parameter. Furthermore, over half of the participants (19 people) showed a positive perception toward accessibility to public buildings, with a score of ≥7. Only nine people gave a value of less than 5 to the accessibility to public buildings.
With respect to the valuation of the ease of access to public transportation, the responses were also generally positive, with 28 participants giving a score of ≥5.
The basic elements of accessibility of the province seem to be adequate, according to the perception of people related to disability. It would be convenient to delve into the understanding of accessibility through a more exhaustive, detailed and objective study, thoroughly analysing the situation of the streets, traffic signs, traffic lights, etc. In some cases, routine and everyday life affect our perception, which somehow alters our valuation.
The participants were also asked about the phenomenon of incorporating disability into the social structure. To this end, the informants were requested to value the following statement: “I consider that, in the locality where I live, people with disabilities are taken into account”. The general perception of our informants was positive, with 24 people giving a score of ≥5 to this statement.
Lastly, the participants were asked about their valuation of the information published by the media of the province. More specifically, we asked them to value from 0 to 10 whether the media, which reports on their province, addresses the problems of people with disabilities. In this case, the responses were less positive than the previous responses. In fact, eighteen people responded with a score of ≤5; nine, six and eight informants valued the information of the local media with a score of 3, 4 and 5 points, respectively. In this sense, it would also be convenient to thoroughly analyse the type of information that is presented about people with disabilities in the province.
Moreover, we considered that it would be important to know the perception of people affected by disability toward the political institutions (City Hall, County Council, Government of Castile and Leon, and Spanish Government). According to their responses (Figure 7), there was a clear difference between the valuation of the institutions that are closer to the citizens and the valuation of those that are farther away. It is not possible to establish a clear upward or downward tendency; thus, we decided not to incorporate this information. However, we could make some clarifying comparisons. Most of the participants (28 people) valued the work of the city hall with a score of 5 or higher. In the case of the County Council of Soria, the value was slightly lower (24 participants). For the Government of Castile and Leon, once again, 28 people valued the work of this institution with 5 or more points. Lastly, in the case of the Spanish Government, only 14 people gave a score of 5 or more points. It is also worth pointing out that nine informants valued the City Hall with 7 points, and eight people gave 4 points to the Spanish Government. In addition, six people considered that the Spanish Government did nothing and, therefore, gave it a score of 0.
The next step was to determine whether the closest political administrations (more specifically, the City Hall and the County Council) informed appropriately about the possible services they provide to improve the quality of life of people with disabilities. Therefore, it was important to ask the participants if they were well informed about the activities conducted by the closest institutions. In this case, 18 people gave a score of ≥5; thus, we could not consider that they generally felt well informed. In fact, on the other hand, 19 people had a negative perception, considering that these institutions do not inform adequately, valuing them with a score of ≤4. The data suggest that the local institutions need to improve their information means, although, as was previously mentioned, these data must be considered with caution, requiring further research and analyses in this respect.
After describing the perception of people related to disabilities toward the institutions, we focused our analysis on the situation of some services and the possibilities of improving the lives of people affected by disability. In this sense, we addressed the aspects related to employment, companies and the treatment in medical services. Thus, our aim was to obtain a general view of the reality of the social structure of the province regarding the analysed sociotype.
We began by approaching the collaboration and understanding the medical services offered to people affected by disability in the medical centres of the province. To this end, the participants were asked to provide their perception toward these aspects. The informants gave highly positive information in general lines. In fact, thirteen and seven people valued these interactions with a score of 8 and 5 points, respectively, whereas only four people reported a negative valuation.
With respect to the services aimed at people with disabilities, such as assisted housing and hospices, most of the responses were positive. In fact, 20 people gave a score of 5 or more points to such services, whereas 17 people had a negative perception toward them, with 11 people giving a score of 3 points to these services. The greatest problem was detected in the labour scope. In this sense, 25 people gave a negative valuation regarding the ease for people with disabilities to be employed. Moreover, eight people gave a score of 0 and 1 (four participants in each case). All this suggests that the institutions and companies have much work to do in this regard.
The abovementioned need for business effort became clear when we asked the informants whether employers were committed to people with disabilities. To this question, 25 people showed a negative perception (≤4) and, specifically, 13 participants gave a value of 3 points. This information suggests the existence of job integration barriers to people with disabilities in the province. This was subsequently corroborated in the qualitative study, where the representatives of the participating associations showed a clear concern about this issue. This negative impression of Sorian employers among the participants is complemented with the next aspect, which is related to the problem of equality in the conditions of access to employment. In fact, the informants showed a clear perception of inequality in the access to the job market. Thus, only nine people considered that the valuation of this parameter deserved a score of 5 or more points. This indicates the need for greater effort in this context in order to increase the levels of equality in the possibility of being employed.
4.3. Qualitative Analysis
The qualitative study demonstrated the difficulty in attending to people with disabilities in the province of Soria, mainly due to the lack of resources. This enables us to deduce the challenges individuals with disabilities may encounter in their capacity to engage in their activities and exercise their life choices (agency). This is, without a doubt, a discursive aspect that shows the existing problem in this region, according to the participants. I1 stated the following:
“I feel sad, because I could think of a lot of things to be improved, a lot of things to be done, but there are no technical, financial or human resources to provide assistance… So, I feel very sad and angry. But, anyways, I learned to control these feelings in time.”
I2 said: “On my part, I believe that the most frustrating thing is the lack of sufficient services”. In turn, I1 expressed the following: “We also have the problem with subsidies, which are very scarce. The resources are the same in Soria City and in the rural area, that is, nothing.” The participants added that, due to these deficiencies, they had to move patients to hospitals of other provinces. Certainly, this factor significantly influences the potential for human connections with family and friends when one is admitted to a hospital. According to the participants, this generates a problem of estrangement in those affected: “There is also the problem of estrangement. Of course, they spend 20 years in [name of the association], which is their family. And then we are forced to separate them from the association”, which was endorsed by I3. In a different part of the debate, I4 stated:
“In relation to the state of the province, the bad things of the province (which I presume occur in all provinces), our people, the doctors, the lack of specialists and such… In the end, all of them have to flee the province. [All informants repeated, of course!]. In Valladolid, that is, inside the autonomous community, they created a team for orthoneuropediatric valuations; but for us, Valladolid is farther away from here than Madrid is. In the end, we all end up going to Madrid”.
Then, with respect to the actions carried out by the administration, I1 reported the following:
“The Administration, for example, if people with disabilities, any type of disability, have some type of service, is because us, the entities, are providing them. We are doing a great work for the Administration, because, if it weren’t for the entities…”.
The participants presented numerous specific examples of streets, buildings or particular cases with accessibility problems. In this sense, they had a much more negative view of the context and of accessibility, compared to that shown by the participants in the quantitative study. For instance, I2 highlighted the need to increase the number of pictograms in the central area of the province to improve cognitive accessibility. I4 strongly asserted the following to support the idea of I2: “People can’t navigate here!” I3 even stated, giving herself as an example, that older people find it very difficult to get an appointment in institutional buildings.
In contrast with this negative view, all participants stressed on solidarity and social advance. This aspect was pointed out as a factor of emotional and economic support for all entities. In this sense, I4 expressed the following:
“About Soria, I must highlight the solidarity of its people. In our case, for example, the hospice we are building is great. I mean, I believe that the people of Soria are giving more money than the Administrations. I think that the solidarity here is extraordinary, and that people respond to the problems”.
I4 and I3 stated that this is due to the small size of the city and the fact that “we all know each other”. In this sense, all participants underlined the importance of the educational centres and of the welcoming they receive in them. Thus, they believed that this factor is key to the inclusion and improvement of the lives of people affected by disabilities. However, despite the social advances, they considered that there is still much work to be done and that, for this reason, “they will fight on”. This aspect was unanimous.
5. Discussion
This study shows the reality of disability in the province of Soria. This type of research is not frequent. In fact, Rodríguez-Soler et al. [22], in a bibliometric study on the rural depopulation in which they analysed 1150 articles between the years 1979 and 2018, did not mention the existence of studies related to disability in highly depopulated areas. This confirms, at least partly, our documentary study.
This province is the most depopulated territory of Southern Europe. Such depopulation is due to the fact that different social groups, such as single people, youth, women, and highly qualified people, among others, are more prone to moving to larger cities [23]. Thus, in regions such as Soria, there is a greater relative proportion of people with low education levels and older ages. This depopulation is forcing local services and businesses to terminate their activity due to a lack of demand [24]. This loss and its consequent lack of services and options has also been repeatedly reported by our informants in the qualitative analysis. In the quantitative analysis, the response was positive, although in this case it is important to be aware that most of the responses are from the capital, where the resources and services are concentrated. In line with this, Lewin et al. [8] stated that social care services respond to need/demand processes, although mechanisms of generation of these services also take place without the need for such demand. In fact, these authors linked the establishment of such services to political ideology, as well as to municipal characteristics. These elements, to some extent (although provisionally), can also be observed in the province.
The quantitative analysis shows several results of interest. Firstly, it seems that the needs of people with disabilities (mostly those of the capital) are covered. This fact could be related to the small relative size of the capital of the province (39,695 people according to the Municipal Census on 1 January 2022). This minimises some health problems related to the high population density [6]. Therefore, the problem would lie in the province itself, where the population nuclei are smaller and dispersion is greater. In this sense, the qualitative study clearly shows this fact and the assistance difficulties presented by the people who live in localities outside of the capital.
Thus, the people who live in the province would be in a situation of potential vulnerability in the face of cutbacks, for instance. In this sense, Sèpulchre [25] reported that the financial scope is fundamental for the development of measures of assistance to people with disabilities. For this reason, this author stated, according to the associative movement, that the action investment is lower than that indicated by the politicians, since the analysis of costs performed by the politicians does not consider the advantages of such actions. This is in line with our analysis, although it maintains the difficulty of attending to the needs of people with disabilities who live in the province. As was highlighted by Järkestig et al. [26], the cost reduction strategies derived from austerity policies also affected our sociotype, as it posed a substantial reduction in expenditures. Precisely, this fact is also perceived as an element of control reduction and of elections [27], as well as of the exclusion of participation in society [26]. In this sense, Järkestig et al. [26] and Hayes [28] asserted that austerity strategies must be understood as an ethical mechanism that excludes the most vulnerable social groups, which include our sociotype.
Moreover, different authors show that the context of depopulation has a negative effect on disability [5,7]. In the province of Soria, there are areas with a very high level of depopulation. According to the Spanish Federation of Municipalities and Provinces (FEMP), those municipalities with less than 1000 inhabitants have been established as municipalities at risk of disappearing. In the case of Spain, these represent 61.48% of all municipalities in the entire country. This percentage is considerably higher in the province of Soria, with 93.48%; that is, 172 of its 184 municipalities have less than 1000 inhabitants and would thus be at risk of disappearing, according to the FEMP. These numbers are worrying, since 64.13% of the Sorian municipalities have less than 100 inhabitants, which is a situation that has intensified and has a direct impact on the provision of essential services to the population, thereby making the lives of people with disabilities even harder in the rural areas. Indeed, structural challenges unquestionably impact the autonomy and the agency of individuals with disabilities. These limitations become more pronounced in sparsely populated regions characterized by service gaps and restricted life choices. This fact hinders the generation of community participation networks and, therefore, social inclusion [29]. To solve this problem, organisations related to disability try to promote mechanisms of approach for people in the capital to increase their community participation and socialisation. In essence, individuals with disabilities harness the power of collective action to amplify their agency through collaborative processes. However, these processes deteriorate the economic capacity of associations and, therefore, the possibility of carrying out activities of healthcare, improvement of quality of life, etc.
Another important aspect is related to the world of work. In this case, all the analyses conducted show that there is a problem in this sense and that, in addition, employers are not committed to the reality of our sociotype. Thus, the problem we are facing is that the State, taking into account the general demographic evolution and the relationships between unemployment and health [30], should be aware of this reality and develop strategies for the promotion of employment. Otherwise, no matter how many integration mechanisms are developed, these will not be complete [29]. This fact may also explain why the participants considered that the Spanish Government is one of the main political agents that care least about their needs.
6. Limitations and Opportunities
As was previously indicated, the quantitative analysis was limited due to two main reasons, although both are related to the lack of funding for the development of these works. It is known that gathering data face to face generates higher response rates, but they involve higher costs than the online format. On the other hand, older people do not usually agree to respond to online questionnaires or use social networks. Moreover, the analytical perspective used in the quantitative study was consultative and not exploratory. In fact, the aim of this study was to explore the subjective reality of people affected by disability, their assistance needs and the opinion of associative entities. Therefore, we did not focus our work on statistical precision but on the subjective and intersubjective perception of the participants.
The data that we have gathered originate from a modest sample size. However, it is worth noting that our approach in this quantitative study has been consultative rather than exploratory. Consequently, our emphasis has not been on achieving statistical precision, but on gaining insights into the subjective experiences of individuals affected by disability within a small, predominantly elderly population. This knowledge will serve as a foundational basis for conducting more intricate future studies in this domain and formulating practical recommendations for enhancement.
In view of this, the following are proposed as possible future lines of research:
- Our first future line of research could be conducting a comprehensive investigation into the key determinants impacting the province of Soria, with a particular focus on the infrastructure network, including roads and public transport systems. We will explore their implications for land-use planning and accessibility to specialized facilities across various municipalities within the province. Additionally, we intend to create a geographical map that calculates distances and estimated travel times to the provincial capital, as well as other crucial urban centres in the surrounding area that serve as vital hubs for the local population.
- A second future line of research could be studying the situation of other provinces in Spain which are in a similar situation of depopulation to Soria, such as the provinces of Teruel and Cuenca (Spain), in order to check whether there is a similar situation to that of Soria. This study would make it possible to establish similarities and differences between territories with a high level of depopulation and to be able to undertake measures to help alleviate the deficit.
7. Conclusions
- In the province of Soria, there are localities with a very high depopulation level. These areas are located in the south of the province. In these localities, the possibility of increasing the difficulties that may be encountered by people with disabilities is greater than in other regions. This is also enhanced by the high centralism present in the province. In fact, most of the population is concentrated in the capital of the province.
- The capital is not a city with great population density. This fact may be one of the elements that explain the positive view of the city. In this sense, the quantitative and qualitative analyses are in disagreement. The informants of the quantitative analysis perceive the city in a more positive manner than the participants in the qualitative analysis.
- Social solidarity has increased, and this was perceived as a positive aspect. This fact improved, to some extent, the lives of people with disabilities and their social inclusion. The informants consider that there is much work to be done, although they also recognise that social exclusion has decreased.
- The business sector and the political agents are perceived most negatively. The informants consider that there is no commitment to people with disabilities either on the part of employers or on the part of the government. For this, the State should be aware of the real existing needs in order to be able to implement integration mechanisms that provide solutions to this problem. This is one of the reasons why the informants consider the government to be one of the least committed agents to their problems. This allows confirming the need for further work to build a more equitable society, support the employment of people with disabilities and develop political mechanisms to improve the aspects that affect this sociotype.
- In Soria, over 60% of its municipalities boast populations of less than 100 residents, predominantly situated in rural settings. This stark demographic distribution has had an adverse impact on the availability of essential services within these villages, subsequently exacerbating the challenges faced by individuals with disabilities in rural areas and limiting their agency.
- Our investigation has substantiated our initial premise: residing in areas experiencing significant demographic decline can significantly magnify the hurdles encountered by specific social groups.
Author Contributions
Conceptualization, J.R.C. and A.P.-D.; methodology, J.R.C., J.F.-P., S.G.-R.; formal analysis, J.R.C. and A.P.-D.; data curation, J.R.C. and J.F.-P.; writing—original draft preparation, all authors; writing—review and editing, all authors. All authors have read and agreed to the published version of the manuscript.
Funding
This research received no external funding.
Data Availability Statement
The data reported here are available at request by scientific community members.
Conflicts of Interest
The authors declare no conflict of interest.
References
- World Health Organitzation (WHO). Disability. Available online: https://www.who.int/health-topics/disability#tab=tab_1 (accessed on 7 April 2023).
- Marijuán, P.C.; Montero-Marín, J.; Navarro, J.; García-Campayo, J.; del Moral, R. The “sociotype” construct: Gauging the structure and dynamics of human sociality. PLoS ONE 2017, 12, e0189568. [Google Scholar] [CrossRef] [PubMed]
- Berry, E. The role of the sociotype in managing chronic disease: Integrating bio-psycho-sociology with systems biology. Med. Hypotheses 2011, 77, 610–613. [Google Scholar] [CrossRef] [PubMed]
- Suriá, R. Análisis comparativo de la fortaleza en padres de hijos con discapacidad en función de la tipología y la etapa en la que se adquiere la discapacidad. Anu. Psicol. 2013, 43, 23–37. [Google Scholar]
- Karolaakso, T.; Autio, R.; Näppilä, T.; Leppänen, H.; Rissanen, P.; Tuomisto, M.T.; Karvonen, S.; Pirkola, S. Contextual and mental health service factors in mental disorder-based disability pensioning in Finland—A regional comparison. BMC Health Serv. Res. 2021, 21, 1081. [Google Scholar] [CrossRef] [PubMed]
- Motoc, I.; Timmermans, E.J.; Deeg, D.; Penninx, B.W.J.H.; Huisman, M. Associations of neighbourhood sociodemographic characteristic with depressive and anxiety symptoms in older age: Results from a 5-wave study over 15 years. Health Place 2019, 59, 102172. [Google Scholar] [CrossRef] [PubMed]
- Reime, L.J.; Claussen, B. Municipal unemployment and municipal typologies as predictors of disabilitypensioninng in Norway: A multilevel analysis. Scand. J. Public Health 2013, 41, 158–165. [Google Scholar] [CrossRef] [PubMed]
- Lewin, B.; Westin, L.; Lewin, L. Needs and Ambitions in Swedish Disability Care. Scand. J. Disabil. Res. 2008, 10, 237–257. [Google Scholar] [CrossRef]
- Archer, M.S. Structure, Agency and the Internal Conversation; Cambridge University Press: Cambridge, UK; New York, NY, USA, 2003. [Google Scholar]
- Archer, M.S. Making Our Way through the World: Human Reflexivity and Social Mobility; Cambridge University Press: Cambridge, UK; New York, NY, USA, 2007. [Google Scholar]
- Caetano, A. Defining personal reflexivity: A critical reading of Archer’s Approach. Eur. J. Soc. Theory 2017, 18, 60–75. [Google Scholar] [CrossRef]
- Mitchell, D.T.; Snyder, S.L. Low-level agency. Disability, oppression and alternative genres of the human. In Manifestos for the Future of Critical Disability Studies; Routledge: New York, NY, USA, 2018; pp. 189–198. [Google Scholar]
- Van Herwijnen, M.; Daly, G.; Iotzov, V.; ESPON EGTC; INOVA+. ESPON Fighting Rural Depopulation in Southern Europe. Transnational Observation. ESPON. Available online: https://www.espon.eu/sites/default/files/attachments/af-espon_spain_02052018-en.pdf (accessed on 19 May 2022).
- Stake, R.E. The Art of Case Study Research; Sage: Thousand Oaks, CA, USA, 1995. [Google Scholar]
- Bricout, J.C.; Gray, D.B. Community Receptivity: The Ecology of Disabled Persons’ Participation in the Physical, Political and Social Environments. Scan. J. Disabil. Res. 2006, 8, 1–21. [Google Scholar] [CrossRef]
- Shen, J.; Chu, D.; Zhang, Q.; Zhang, W. Developing a census data system in China. Int. Stat. Rev. = Rev. Int. Stat. 1999, 67, 173–186. [Google Scholar] [CrossRef]
- Waldrop, J.; Long, J.F. A first look at the 21st Century: Census 2000. Popul. Res. Policy Rev. 2002, 21, 3–16. [Google Scholar] [CrossRef]
- Howe, A. Revising long-established population estimates in Australia: Reasons, methods and implications. In The Frontiers of Applied Demography; Swanson, D.A., Ed.; Springer: Berlin/Heidelberg, Germany, 2017; pp. 409–429. [Google Scholar] [CrossRef]
- Moreno Jiménez, A.; Buzai, G.D.; Fuensalida, M.; Claudia, B.; María Rosa, C.; Maria, V. Sistemas de Información Geográfica: Aplicaciones en Diagnósticos Territoriales y Desigualdades Geoambientales; Ra-Ma Editorial: Madrid, Spain, 2012. [Google Scholar]
- Nielson, D. (Ed.) . Geographic Information Systems (GIS): Tecniques, Applications and Technologies; Nova Science Publishers, Inc.: Hauppauge, NY, USA, 2014. [Google Scholar]
- Mohan, R.R.; Sharieff, A. Geographical Information System: Theory & Practice; Rawat Publications: Jaipur, India, 2018. [Google Scholar]
- Rodríguez-Soler, R.; Uribe-Toril, J.; De Pablo, J. Worldwide trends in the scientific production on rural depopulation, a bibliometric analysis using bibliometrix R-tool. Land Use Policy 2020, 97, 104787. [Google Scholar] [CrossRef]
- Meijer, M.; Syssner, J. Getting ahead in depopulating areas—How linking social capital is used for informal planning practices in Sweden and The Netherlands. J. Rural Stud. 2017, 55, 59–70. [Google Scholar] [CrossRef]
- Lozano, A.; Jiménez-Bravo, D.; Pato, D.; Valera, A.; Luis, G. Voice Assistant and Route Optimization System for Logistics Companies in Depopulated Rural Areas. Sustainability 2020, 12, 5377. [Google Scholar] [CrossRef]
- Sépulchre, M. Ensuring equal citizenship for disabled people: A matter of rights or a matter of costs? Alter 2020, 12, 114–127. [Google Scholar] [CrossRef]
- Järkestig, U.; Melin, U.; Bergman, A.S. Strategies of austerity used in needs assessments for personal assistance—Changing Swedish social policy for persons with disabilities. Eur. J. Soc. Work 2021, 24, 380–392. [Google Scholar] [CrossRef]
- Mladenov, T. What is good personal assistance made of? Results of a European survey. Disabil. Soc. 2020, 35, 1–24. [Google Scholar] [CrossRef]
- Hayes, G. Regimes of austerity. Soc. Mov. Stud. 2017, 16, 21–35. [Google Scholar] [CrossRef]
- Milner, P.; Kelly, B. Community participation and inclusion: People with disabilities defining their place. Disabil. Soc. 2009, 24, 47–62. [Google Scholar] [CrossRef]
- Schuring, M.; Schram, J.L.D.; Robroek, S.J.W.; Burdorf, A. The contribution of health to educational inequalities in exit from paid employment in five European regions. Scand. J. Work Environ. Health 2019, 45, 346–355. [Google Scholar] [CrossRef]
Figure 1.
Distribution of people with disabilities obtained in the different regions of Spain. Date obtained from Social Integration and Health Survey (2012). Source: developed by the authors.
Figure 1.
Distribution of people with disabilities obtained in the different regions of Spain. Date obtained from Social Integration and Health Survey (2012). Source: developed by the authors.

Figure 2.
Population pyramid of people with disabilities in Castile and Leon in 2018. Source: Government of Castile and Leon. Developed by the authors.
Figure 2.
Population pyramid of people with disabilities in Castile and Leon in 2018. Source: Government of Castile and Leon. Developed by the authors.

Figure 3.
Evolution of the population in the province of Soria (1900–2021). Source: INE censuses. Developed by the authors. Note: Blue line shows the evolution of population during the 20th century and the beginning of the 21st century in the studied area.
Figure 3.
Evolution of the population in the province of Soria (1900–2021). Source: INE censuses. Developed by the authors. Note: Blue line shows the evolution of population during the 20th century and the beginning of the 21st century in the studied area.

Figure 4.
Population density in 2020 and Population variation (1950–2020) in Soria. Source: Continuous Census Statistics of the INE. Developed by the authors.
Figure 4.
Population density in 2020 and Population variation (1950–2020) in Soria. Source: Continuous Census Statistics of the INE. Developed by the authors.

Figure 5.
Population pyramid of the province of Soria in 2020. Source: Census of inhabitants of the INE. Developed by the authors.
Figure 5.
Population pyramid of the province of Soria in 2020. Source: Census of inhabitants of the INE. Developed by the authors.

Figure 6.
Population pyramid of people with disabilities (administrative) in the province of Soria. Source: Social Services of the Government of Castile and Leon, 2019. Developed by the authors.
Figure 6.
Population pyramid of people with disabilities (administrative) in the province of Soria. Source: Social Services of the Government of Castile and Leon, 2019. Developed by the authors.

Figure 7.
Comparison of the perception of the participants toward the work of the institutions [City Hall, County Council, Government of Castile and Leon, and Spanish Government] to address the problems of people with disabilities. Note: City Hall (orange), County Council (blue), Government of Castile and Leon (grey), and Spanish Government (yellow). Source: Developed by the authors.


Table 1.
Articles Related to Research.
| Title | Highlights | References | |
|---|---|---|---|
| 1 | Contextual and mental health service factors in mental disorder-based disability pensioning in Finland—a regional comparison. | A lower risk of disability pensions was associated with contextual indicators of greater regional socioeconomic level. The authors found evidence of a significant regional variation related, at least partially, to the differences in the regional systems of mental health services and the treatment practices. | [5] |
| 2 | Associations of neighbourhood sociodemographic characteristics with depression and anxiety symptoms in old age: results from a five-wave study over 15 years | This article shows that urban areas with high density are associated with health problems such as depression and anxiety. In turn, these statistical associations were stable for 15 years. On the other hand, the authors assert that urban density is an important factor with a negative impact on mental health and older people. | [6] |
| 3 | Municipal unemployment and municipal typologies as predictors of disability pensioning in Norway: a multilevel analysis | People in municipalities with high unemployment rates were 7–17% more likely to acquire disability pensions. Of the total variability of disability pensions, 2.5% of men and 1.9% of women were between municipalities. The other municipal factors only showed mild influences. Conclusion: In addition to individual socioeconomic factors, contextual factors seem to be important determinants of disability pension rates. | [7] |
| 4 | Needs and ambitions in Swedish disability care. | In this study, the authors identified six characteristics to explain this variation: earlier presence of residential institutions, population density, human capital (age, education, employment, health), local culture, territorial surface and stable left-wing government. The results bolster a model of support to social care that responds to the needs of the population, although they also show accessibility problems. This means that spatial equity is violated. To sum up, the place of residence still matters. | [8] |
Source: developed by the authors.
Table 2.
Population density in the most depopulated European regions.
| Regions | 2015 | 2016 | 2017 | 2018 | 2019 |
|---|---|---|---|---|---|
| Soria | 8.9 | 8.8 | 8.7 | 8.7 | 8.7 |
| Licko-senjska zupanija | 8.9 | 8.8 | 8.6 | 8.5 | 8.3 |
| Oppland (statistical region 2016) | 7.9 | 7.9 | 7.9 | 7.9 | 7.9 |
| Innlandet | 7.7 | 7.6 | 7.7 | 7.7 | 7.7 |
| Hedmark (statistical region 2016) | 7.5 | 7.4 | 7.5 | 7.5 | 7.5 |
| Nordland | 6.7 | 6.7 | 6.7 | 6.7 | 6.7 |
| Troms (statistical region 2016) | 6.6 | 6.6 | 6.6 | 6.6 | 6.6 |
| Pohjois-ja Itä-Suomi | 6.4 | 6.4 | 6.4 | 6.3 | 6.3 |
| Norra Sverige | 6.0 | 6.1 | 6.1 | 6.1 | 6.1 |
| Sogn og Fjordane (statistical region 2016) | 6.2 | 6.1 | 6.2 | 6.1 | 6.1 |
| Mellersta Norrland | 5.3 | 5.3 | 5.3 | 5.3 | 5.3 |
| Västerbottens län | 4.8 | 4.8 | 4.9 | 4.9 | 5.0 |
| Nord-Norge | 4.5 | 4.4 | 4.5 | 4.5 | 4.5 |
| Kainuu | 3.7 | 3.7 | 3.7 | 3.6 | 3.6 |
| Iceland | 3.3 | 3.3 | 3.4 | 3.5 | 3.6 |
| Ísland | 3.3 | 3.3 | 3.4 | 3.5 | 3.6 |
| Guyane | 3.2 | 3.2 | 3.3 | 3.3 | 3.4 |
| Övre Norrland | 3.4 | 3.4 | 3.4 | 3.4 | 3.4 |
| Jämtlands län | 2.6 | 2.6 | 2.6 | 2.7 | 2.7 |
| Norrbottens län | 2.6 | 2.6 | 2.6 | 2.6 | 2.6 |
| Lappi | 2.0 | 1.9 | 1.9 | 1.9 | 1.9 |
| Finnmark (statistical region 2016) | 1.7 | 1.6 | 1.6 | 1.6 | 1.6 |
| Landsbyggd | 1.2 | 1.2 | 1.2 | 1.3 | 1.3 |
Source: Eurostat—Population density by NUTS 3 region (data: person/km2).
Table 3.
Age distribution of the participants and the quantity of participants in the survey within each age category.
Table 3.
Age distribution of the participants and the quantity of participants in the survey within each age category.
| Age Group | Participants |
|---|---|
| 20–30 years | 6 |
| 30–40 years | 7 |
| 40–50 years | 13 |
| 50–60 years | 8 |
| 60–70 years | 2 |
| More than 70 years | 1 |
| Total | 37 |
Source: developed by the authors.
Disclaimer/Publisher’s Note: The statements, opinions and data contained in all publications are solely those of the individual author(s) and contributor(s) and not of MDPI and/or the editor(s). MDPI and/or the editor(s) disclaim responsibility for any injury to people or property resulting from any ideas, methods, instructions or products referred to in the content. |
© 2023 by the authors. Licensee MDPI, Basel, Switzerland. This article is an open access article distributed under the terms and conditions of the Creative Commons Attribution (CC BY) license (https://creativecommons.org/licenses/by/4.0/).
Share and Cite
MDPI and ACS Style
Coca, J.R.; Fernández-Portela, J.; Gómez-Redondo, S.; Paramá-Díaz, A. Sociodemographic Analysis of Disability in a Highly Depopulated Rural Region: The Case of Soria, Spain. Urban Sci. 2023, 7, 112. https://doi.org/10.3390/urbansci7040112
AMA Style
Coca JR, Fernández-Portela J, Gómez-Redondo S, Paramá-Díaz A. Sociodemographic Analysis of Disability in a Highly Depopulated Rural Region: The Case of Soria, Spain. Urban Science. 2023; 7(4):112. https://doi.org/10.3390/urbansci7040112
Chicago/Turabian StyleCoca, Juan R., Julio Fernández-Portela, Susana Gómez-Redondo, and Anabel Paramá-Díaz. 2023. "Sociodemographic Analysis of Disability in a Highly Depopulated Rural Region: The Case of Soria, Spain" Urban Science 7, no. 4: 112. https://doi.org/10.3390/urbansci7040112